Issue 18 · 2026-11-16
This issue prices things in bushels, because the dollar tag has stopped telling the story. A ton of DAP costs 233 bushels of Iowa corn, up from 190 in September. Retail DAP rose $27 in those two months, but Iowa cash corn fell 78 cents, and the corn price accounts for 85% of the move. The fertilizer barely changed. The crop that pays for it did.
The same conversion runs through the other departments. NDSU's oat acre carries $80 of fertilizer, 75% of spring wheat's, and needs $3.41 a bushel to match wheat in 2027. Spreading its own urea saves a spinner owner about $6 an acre, or 1.3 bushels of corn, and in the one Missouri trial that put pans under preplant urea an uneven pattern cost 4.5 to 14. A four-track tractor's premium works out to 0.9 bushel an acre. A quart of potassium silicate costs $8.60 and carries a quarter-pound of silicon, where wheat straw removes 40 pounds.
Why now: 2027 inputs are being booked against corn that is 78 cents cheaper than it was in September. A cost quoted in dollars looks much as it did then. Quoted in bushels it does not, and bushels are what you pay with. We give both, so you can rerun each figure at your own bid.
— Crop Root Zone, Editorial Desk.
Letters & Responses
No reader correspondence reached us this week. On November 16 we searched the publication inbox from November 8 onward and found no questions, corrections or pushback about RZ-017. The same search returned about 47 other threads from that period, none of them from a reader, so this is a real zero. We will not invent a letter to fill the space.
On RZ-017's fall anhydrous question. Last week's Discussion asked whether you still put anhydrous on this fall if soils have not cooled by the end of November, or move those acres to spring urea or UAN, and what your dealer quotes delivered for each. No reader has sent an answer yet, and the question stays open. This issue adds one piece of the spring side: what it saves, and what it can cost, to put that urea on with your own spinner (TRZ-0356).
Open questions (ours, not readers'). These carry forward, and this issue adds evidence to both.
- RZ-015's potash question. What is your dealer quoting for spring 2027 potash, and on what basis? This issue sets out what the producers were paid in the third quarter: K+S $410 a tonne overseas and ICL $370 delivered (TRZ-0346).
- RZ-014's sulfur question. What sulfur source and rate are you booking for 2027 corn? The $615 fourth-quarter Tampa settlement takes $33 off a ton of DAP, but not until spring (TRZ-0342).
- This issue's question. Discussion, at the end of the issue, asks a new question from your own operation.
Corrections, disagreements and figures from your own operation are welcome by email. We answer the sharpest ones here the following week.
In This Issue
This week's features, by department.
- A Ton of DAP Costs 233 Bushels of Iowa Corn, Up From 190 in September and 4 Short of Last November. MAP, at 243, Costs More Corn Than It Did a Year Ago.Iowa cash corn fell 78 cents in two months while retail DAP rose $27 and MAP $29, so 43 of the 47 bushels a ton that September had gained on last November are gone, and the corn price accounts for 85% of the move. The New Orleans barge slipped $6 over the same weeks the dealer price rose $16. Replacing a 210-bushel corn crop's phosphate now takes $69 an acre, or 17.0 bushels against 13.9 in September. Sulfur's fourth-quarter cut is worth $33 a ton of DAP and November ammonia took back $19, Nutrien is closing a fifth of its phosphate sales in 2027, and the Moroccan duty finding stands at 20.04%.
- The US Exported 1.22 Million Tonnes of Ammonia Through August, 37% More Than Last Year and Within 69,000 Tonnes of What It Imported. Urea Export Receipts Tripled to $539 Million. UAN Exports Fell 47%.Eight months of trade records show US nitrogen imports flat and exports up 36% in nitrogen content, which cut net imports by about 480,000 tonnes of N. Ammonia went to Morocco and Chile from new Texas plants. Urea went to Canada during the US spring and then, once the Gulf barge fell $50 a tonne under Brazil in June, to Chile, Brazil, South Africa and New Zealand. UAN stayed home. Retail prices rose in the same order: anhydrous 19%, urea 12%, UAN 6% to 8%. On today's quotes the urea export window is shut and would reopen near $392 to $401 a short ton at New Orleans, about $29 to $38 under the barge. That is a floor the spring 2027 buyer did not have two years ago.
- K+S Was Paid $410 a Tonne Overseas and ICL $370 Delivered in the Third Quarter, Up $24 and $17 on the Year. Nutrien's Offshore Ton Netted $253, Up $3. Freight Took Most of the Increase, and Both Sold Less Into North America.The two offshore-facing potash sellers that reported this week were paid more per tonne than a year ago: K+S $410 overseas and €338 on muriate, ICL $370 on a delivered CIF basis. In short tons that is $336 to $372, about the $345 New Orleans barge and well under the $430 Midwest posted price. ICL's own bridge shows about $14 of its $17 gain went to ships. ICL's North American potash sales fell 16% and K+S's North American revenue share slipped to 6.1%. K+S assumes flat fourth-quarter prices and says the overseas increase it expected has not arrived, while Brazil has dropped about $34 a tonne below its third-quarter average. The 2027 China and India contracts are the next test of whether $430 holds into spring.
- Tampa Sulfur Settled at $615 for the Fourth Quarter, $90 Under the Record and Still Double Last Year. It Takes $33 Off a Ton of DAP, but Not Until Spring. A Corn Acre's Phosphate Now Carries $15 of Sulfur the Crop Never Gets.Mosaic, Itafos, AdvanSix and a distributor market summary all put the fourth-quarter Tampa molten sulfur contract at $615 a long ton, down from $705 and up from $310 a year ago. On our ratios the cut is worth $33 a short ton of DAP, $37 of MAP and $20 of ammonium sulfate, and reaches producer costs in the first quarter of 2027. Middle East and Chinese spot sulfur kept falling into November, so Tampa's discount to the world price has narrowed. On a corn acre, the sulfur consumed to make 64 lb of P2O5 as DAP costs about $15.47 at the new contract, against $4.12 for the 15 lb of sulfur the crop actually uses. Bought as ammonium sulfate in Oklahoma, that 15 lb costs $8.78 net of its nitrogen, and the net sulfur price rose 4 cents a pound in the fortnight the contract fell.
- The Ammonia Contract Fell $80 Because a Phosphate Plant Stopped Buying. Nitrogen Growers Get the Discount.September Tampa settled at $555/t CFR, the fourth straight monthly fall and $270 off May's peak — and the stated cause is a phosphate producer's sulfur problem, not weak nitrogen demand. Retail anhydrous moved $20.
- December Oats Settled at $3.615 on November 13 and Minneapolis Bid $4.32. NDSU's Oat Acre Still Carries $80 of Fertilizer, 75% of Spring Wheat's, and Needs $3.41 a Bushel to Match Wheat in 2027.Oats are sold as the low-fertilizer small grain. In NDSU's budgets the oat fertilizer line is $80 to $97 an acre, and at the $2.46 budget price it is 40% of revenue. We repriced the East Central North Dakota budget at November 13 settlements. For 2027, an oat bid no worse than 47 cents under September futures matches spring wheat on return over direct costs. It takes $4.41 to match corn and $4.91 to match soybeans. South Dakota's 28 nitrogen trials say the fertilizer line can come down by about $23 an acre.
- Southern Illinois' Wheat and Double-Crop Soybean Acre Led Full-Season Soybeans by $105 in September's Budget. At a $5.80 New-Crop Wheat Bid It Trails by $20, and the Second Crop Has to Make 50 Bushels Instead of 39.farmdoc's 2027 budget priced wheat at $7.30. On November 11 July 2027 wheat settled at $6.25¼ and southern Illinois river elevators bid $5.80 to $5.85 for new crop. That takes $153 an acre off the two-crop system, $130 of it wheat, and $28 off full-season soybeans. The system ties soybeans again at $6.03 cash wheat, about $6.48 on the July board, or at 49.7 bushels of double-crop beans. Nitrogen would have to fall to about $489 a ton of urea to close the gap by itself. Wheat already drilled should stay, and an 85% revenue policy written at $7.54 covers most of the difference.
- USDA Cut the Corn Crop 141 Million Bushels, and Illinois Lost 88 Million of It. The Carryout Landed 68 Million Under the Trade. The 2027 Board Still Pays Soybeans About $103 an Acre More Than Corn in Central Illinois.November's WASDE cut corn yield 1.6 bushels to 179.6 and ending stocks to 1.758 billion (10.8% of use), lowered the corn price another 10 cents to $4.60, and took soybeans to 300 million bushels and $12.10. December corn rose 9¾ cents and November soybeans 42¼. December 2027 corn at $4.90½ against November 2027 soybeans near $11.94 is a 2.43 ratio. On farmdoc's 2027 budget, corn needs about $5.32 on the board to tie soybeans, 42 cents above the close and the same gap as October 12. The report paid both 2027 crops about $17 an acre and did not change which one wins.
- December 2027 Cotton at 77.6 Cents Covers a Delta Acre's Direct Costs With Room to Spare. It Covers Total Cost Nowhere in Mississippi's or Georgia's Budgets, and Diesel, Not Fertilizer, Took the Difference.We repriced Mississippi State's and Georgia's latest cotton budgets to the November 9 board: 76.4 cents a pound cash, diesel up about $2.60 a gallon and fertilizer close to flat. Diesel adds $27 to $61 an acre to Delta cotton, and fertilizer adds $3 to $4. Furrow-irrigated Delta cotton clears direct cost by $245 but needs an 81.5-cent December board to cover total specified cost before land. Dryland Delta cotton needs 86.7. On dryland Delta ground, corn now out-earns cotton on both measures. In Georgia, irrigated cotton beats irrigated peanuts over variable cost at current prices. The seed cotton PLC payment is projected at half a cent a pound, so it does little for the 2027 acre.
- At the Same Illinois Elevator, Soybean Basis Is 31 Cents Stronger Than Corn Basis. One Crop Has a Buyer That Doesn't Need the River.Central Illinois corn is bid 38.75 under; soybeans at the same elevators are 7.25 under. On a 1,000-acre corn-and-bean farm the corn basis bill is roughly eighteen times the soybean one, and that gap should decide which bin fills first.
- Spreading Its Own Urea Saves a Spinner Owner About $6 an Acre, or 1.3 Bushels of Corn. In the One Missouri Trial That Put Pans Under Preplant Urea, an Uneven Pattern Cost 4.5 to 14.At $5.07 diesel and a 5.41% real rate, Iowa's hired dry pass is $8.48 and a new $36,362 pull-type spinner breaks even at 650 acres spread a year. Putting urea on the corn half through the same machine cuts the break-even farm from about 1,290 acres to 645. Missouri pan tests found uneven spread in all six fields they caught, five of them under self-propelled machines, and yield loss only where the whole nitrogen program went on preplant. Half-width urea passes cost about $2.55 an acre, half a bushel, and still leave owning ahead above about 800 acres.
- A Four-Track Row-Crop Tractor Asks About $70,000 More Than the Same Tractor on Duals. That Is $4 an Acre, or 0.9 Bushel of Corn, on 2,500 Acres, and No Tractor Trial We Found Is Built to Detect a Gain That Small.Dealer asking prices put a 410-hp four-track about 14% above its wheeled twin, and published premiums run to 32%. Owning that premium costs $10,100 to $21,100 a year, which is 0.9 to 1.8 bushels of December 2027 corn per acre on 2,500 acres. The one Ohio State trial that measured it found duals at 6 psi compacted less than either track width, and Iowa State found no yield difference. Axle load, which belts do not change, sets the deep compaction. A gauge, VF tires at $237 a tire more, or central inflation gets the low pressure for 8 cents to about $1 an acre.
- A 70-Foot Farm Truck Scale Costs About $12,600 a Year to Own. An Elevator Scale Inside Legal Tolerance Cannot Be Off by That Much Until a Farm Weighs 1.5 Million Bushels.A scale dealer's published turnkey price is $95,000 to $125,000. At 7.12% money and a 20-year life that is about 2.5 cents a bushel on 500,000 bushels. Against Iowa's $11.15 average commercial weigh fee the scale needs 1,130 loads a year, and against state fine schedules it needs four to ten citations a year at 10,000 pounds over. It pays where weights are out of tolerance or in dispute. A grain-cart scale kit or a $12,200 set of wheel-load pads does the loading job for $460 to $1,655 a year.
- A New Machine Shed Costs About $2.82 a Square Foot a Year to Own. A Combine Covers Its Stall Ten Times Over on Trade-In Alone. A Grain Cart Does Not.At a $30-a-square-foot shell, 6.79% money and a 25-year life, a combine's stall costs about 0.2% of the machine's new value a year. The extension studies credit housing with about 2% a year in trade-in value alone. On trade-in alone, shed space pays above roughly $141 of machine value per square foot for harvest equipment and $564 for tillage tools and carts. Below that line, old rented space at $0.34 to $1.42 a square foot is the better bet, or the machine stays outside.
- A Quart of Potassium Silicate Costs $8.60 and Carries a Quarter-Pound of Silicon. Wheat Straw Removes 40 Pounds. In the Louisiana Wheat Trial Sellers Cite, the Lime-Only Plot Tied Every Silicon Treatment.The one public price we found for a field-labelled liquid silicate is $85.95 for 2.5 gallons, or $34 a pound of silicon, about 150 times our estimate for silicate slag. A label-rate spray puts 0.1 to 0.5 lb of silicon on an acre and needs 0.7 to 3.6 bushels of December 2027 corn as a tank-mix partner, or 2.7 to 5.5 bushels with its own ground pass. Louisiana State pot work found sprayed silicon did not raise silicon in the rice plant. We found no land-grant field trial of foliar silicon reporting corn or soybean yield. The same chemistry is registered with EPA as a fungicide, and that is the claim a buyer can hold a seller to.
- Six Foliar Fertilizers in a 16-State Soybean Trial Cost $3.64 to $22.27 an Acre and Need a Third of a Bushel to 2 Bushels of 2027 Beans to Pay. The Best One Added 0.13 Bushel.The only public per-acre prices for nationally sold soybean foliar products are a 2019 retailer survey: $3.64 to $22.27. At November 2027 futures of $11.87 less an assumed 71-cent basis, that is 0.33 to 2.00 bushels before any application charge, and 1.4 to 3.1 bushels if the product needs its own $12 aerial pass. Across 46 sites the six products moved yield between minus 0.48 and plus 0.13 bushel, with a treatment p-value of 0.97. A $21 potassium product carries about $2.33 of nitrogen and potash at retail dry prices. Manganese on fields showing symptoms is the exception, and the blends tested carry 4% to 8% of a corrective manganese dose.
- A Mycorrhizal Inoculant Costs $9 to $19 an Acre and Needs 2 to 4 Bushels of 2027 Corn to Pay. The Independent Corn Trials We Found Returned Nothing, or Lost 9 Bushels.No public 2026 list price exists. Dated price points run from $8.66 to $19 an acre, which is 1.8 to 3.9 bushels of December 2027 corn, 0.7 to 1.6 of soybeans or 1.3 to 2.9 of wheat. Company material claims 4.7 to 11.8 bushels of corn. The independent replicated trials we found show no significant difference in Iowa, a 9-bushel loss in Nebraska and a 1.9% loss in Wisconsin, all on well-fertilized ground. In a 28-product viability study, 84% of the commercial inoculants tested in sterilized soil formed no mycorrhizae at all. Where native fungi are plausibly short, after fallow, sugarbeet or canola, extension's remedy is banded phosphate at about $21 an acre, and no independent trial we found shows the inoculant doing that job.
- Cereal Rye Seed Costs About $13 an Acre This Fall. Ahead of Corn, the Yield It Can Take Is Worth Up to Five Times That. Ahead of Soybeans, Iowa Cost-Share Brings the Acre Close to Even.North Dakota's fall 2026 foundation price of $14 a bushel puts 50 lb of rye at $12.50 an acre. Iowa's 2026 custom rates put drilling at $19.05. Termination adds $13 to $16 by our estimate, so a drilled acre costs $45 to $49 when it needs its own pass. Trials put the rye penalty at 2% to 5% of corn yield, worth $18 to $44 at November futures, and at roughly nothing on soybeans. Drilled into corn stalks bound for soybeans, sharing the burndown, an Iowa returning user's acre nets out within $1 of even on $20 of state cost-share plus $15 from Practical Farmers. Ahead of corn the same acre still costs $29 to $73.
State of the Industry
Last week retail anhydrous crossed $1,000 and every grain fell. This week USDA took 141 million bushels out of the corn crop, grain rallied, and most of the fertilizer sheet slipped. The exceptions were phosphate at the dealer and natural gas.
USDA cut the corn crop. The November 10 reports put corn yield at 179.6 bushels an acre, down from 181.2 and under the 180.5 the trade expected. Ending stocks fell to 1.758 billion bushels against a trade guess of 1.826 billion, and the farm price was lowered 10 cents to $4.60. Soybean stocks came in at 300 million bushels against an expected 336 million [1]. December corn settled at $4.45½ on November 13, up 4 cents on the week. November soybeans gained 54 cents to $12.43 and December wheat 2 cents to $5.93¼ [2]. North-central Illinois elevators bid $4.19 for corn and $12.04 for soybeans [2]. A bushel of soybeans there now buys 2.87 bushels of corn, against 2.82 a week ago (our arithmetic).
Nitrogen eased, at retail and at the Gulf. DTN's survey for November 2–6 put anhydrous at $1,003 a ton, $4 under the prior week's survey and still $26 above a month ago. Urea was $662, UAN28 $428 and UAN32 $484, all lower on the month [3]. NOLA granular urea barges were indicated at $412.50 a short ton on November 13, $13 under a week earlier [4], and CBOT's March Gulf urea contract showed $432 against $445 [5]. Tampa ammonia was indicated at $640 a tonne [6], the lower of the two November contract prints we carried last week. A ton of retail anhydrous now costs about 239 bushels of that Illinois corn, against about 244 a week ago (our arithmetic).
Gas is the risk to that. Egypt deepened its gas cut to fertilizer plants to 33%, and Europe's AGF Nitrogen has halted some ammonia lines [7]. Henry Hub spot gas was $3.00 on November 11, up from $2.60 on November 6 [8].
Phosphate rose at the dealer and nowhere else. Retail DAP at $950 and MAP at $991 are the highest in DTN's 12-month table [3]. The NOLA DAP barge was indicated at $795 a tonne, up $1 [9], and the DAP benchmark slipped $5 to $790 [10]. Spot sulfur, the phosphate makers' largest raw-material bill, fell $75 in a week to $732.50 a tonne delivered China [11].
Potash slipped. Retail potash was $504, $6 under the prior survey [3]. The NOLA barge indication fell $11 to $334 a short ton on November 10, its first move in weeks [12].
The field is catching up. By November 8, 81% of corn was harvested against an 86% average, with Iowa at 72% against 89%. Winter wheat rated good to excellent rose to 49% from 44% [13]. Diesel fell 16.5 cents to $6.127, and Illinois River barge freight dropped to $30.21 a ton from $33.59 [14]. Midwest residential propane was $2.311 a gallon, up 1.4 cents [15].
On the inputs shelf. About 96% of Illinois fall anhydrous carries a nitrification inhibitor, yet researchers found only 25 plot-years of tile-drain data testing what it does to nitrate loss. A $1.4 million Illinois study aims to lift that above 380 observations [16].
What to watch. The December Tampa ammonia contract settles late this month. Today's Crop Progress was not out as we closed.
| Benchmark | Level | Basis | Move |
|---|---|---|---|
| Anhydrous | $1,003/ton | Delivered retail, Nov 2–6 | +$26 MoM; +16.9% YoY; −$4 vs Oct 26–30 |
| Urea | $662/ton | Delivered retail, Nov 2–6 | −$10 MoM; +10.9% YoY |
| UAN28 | $428/ton | Delivered retail, Nov 2–6 | −$14 MoM; +3.4% YoY |
| UAN32 | $484/ton | Delivered retail, Nov 2–6 | −$1 MoM; +4.1% YoY |
| Ammonia | $640/t | Tampa CFR, indicative, Nov 13 | Unchanged vs last issue; one report gave $645 for November |
| Urea | $412.50/st | NOLA granular barge, FOB, indicative, Nov 13 | −$13.00 vs Nov 6; −$6.00 vs Nov 12 |
| Urea | $422.25/st | CBOT U.S. Gulf futures, Nov 2026, shown Nov 13 | −$3.00 vs last issue; Mar 2027 at $432.00, −$13.00 |
| DAP | $950/ton | Delivered retail, Nov 2–6 | +$16 MoM; +2.6% YoY |
| MAP | $991/ton | Delivered retail, Nov 2–6 | +$12 MoM; +6.6% YoY |
| DAP | $790.00/t | Benchmark, Nov 13 | −$5.00 vs Nov 6; −1.6% m/m |
| DAP | $795/t | NOLA barge, FOB, indicative, Nov 12 | +$1 vs Nov 5 |
| Sulfur | $732.50/t | Granular, CFR China, indicative, Nov 12 | −$75.00 vs Nov 5 |
| Sulfur | $697.50/t | Granular, FOB Middle East, indicative, Nov 12 | −$20.00 vs Nov 5 |
| Sulfur | 5,101.75 CNY/t | China-denominated benchmark, Nov 16 | −1.0% vs Nov 9; −16.0% m/m |
| Potash | $504/ton | Delivered retail, Nov 2–6 | +$2 MoM; +3.1% YoY |
| Potash | $334/st | NOLA granular barge, FOB, indicative, Nov 10 | −$11 vs Nov 3 |
| Dec corn | $4.45½/bu | CBOT settlement, Nov 13 | +4¢ w/w |
| Nov soybeans | $12.43/bu | CBOT settlement, Nov 13 | +54¢ w/w |
| Dec Chicago wheat | $5.93¼/bu | CBOT settlement, Nov 13 | +2¢ w/w |
| Corn, cash | $4.19/bu | N-central Illinois elevator avg, Nov 13 | +7¢ w/w; +3.9% YoY |
| Soybeans, cash | $12.04/bu | N-central Illinois elevator avg, Nov 13 | +43¢ w/w; +10.3% YoY |
| U.S. diesel | $6.127/gal | On-highway retail, wk Nov 9 | −16.5¢ w/w; +$2.29 YoY |
| Propane | $2.311/gal | Midwest residential, wk Nov 9 | +1.4¢ w/w |
| Natural gas | $3.00/MMBtu | Henry Hub spot, Nov 11 | +40¢ vs Nov 6 |
| Illinois River barge | $30.21/ton | Havana–Hardin to New Orleans, Nov 10 | −$3.38 vs Nov 3 |
| Corn harvested | 81% | National, Nov 8 | 74% a week earlier; 86% five-year avg |
| Soybeans harvested | 92% | National, Nov 8 | 88% a week earlier; 91% five-year avg |
| Winter wheat good/excellent | 49% | National, Nov 8 | 44% a week earlier |
Sources: DTN/Progressive Farmer, Nov 11, 2026 (retail, Nov 2–6; month and year moves computed from the survey's month-ago and year-ago rows; week moves against the Oct 26–30 survey in our last issue); CommodityScope, accessed Nov 16, 2026 (Tampa ammonia, NOLA urea, DAP and potash, and granular sulfur; indicative assessments whose underlying sources the site does not name); Farmbucks quote page for CBOT U.S. Gulf urea futures, accessed Nov 16, 2026 (not labelled as settlements; "no recent trades"); Trading Economics, accessed Nov 16, 2026 (DAP, sulfur); USDA AMS Illinois Grain Bids, Nov 13, 2026 (week moves against the Nov 6 figures in our last issue; year-ago from the report); USDA AMS Grain Transportation Report, Nov 12, 2026 (diesel, barge); U.S. Energy Information Administration, accessed Nov 16, 2026 (propane, Henry Hub; no Henry Hub price was posted for Nov 12 or 13); USDA NASS Crop Progress via DTN, Nov 9, 2026. Week moves against a prior issue are our arithmetic. The $645 Tampa print is Fertilizer Daily's of Nov 5, carried from our last issue. November soybeans are in their delivery month; January settled at $12.31½.
The week's verdict: USDA's corn cut bought the grower back about five bushels on a ton of anhydrous, nitrogen and potash eased at the water, and phosphate at the dealer took none of the wholesale softness.
References
- DTN/Progressive Farmer, "USDA Reports Summary," Nov 10, 2026. https://www.dtnpf.com/agriculture/web/AG/news/article/2026/11/10/usda-releases-november-crop-wasde
- USDA Agricultural Marketing Service, Illinois Grain Bids, Nov 13, 2026. https://www.ams.usda.gov/mnreports/ams_3192.pdf
- DTN/Progressive Farmer, "Retail Fertilizer Prices Mixed During First Week of November," Nov 11, 2026. https://www.dtnpf.com/agriculture/web/AG/crops/article/2026/11/11/retail-fertilizer-prices-mixed-first
- CommodityScope, Urea prices, accessed Nov 16, 2026. https://commodityscope.com/prices/urea
- Farmbucks, "Urea (US Gulf) Futures (CBOT UFV)," accessed Nov 16, 2026. https://farmbucks.com/futures/fertilizer/urea-us-gulf
- CommodityScope, Fertilizer prices (Ammonia CFR Tampa), accessed Nov 16, 2026. https://commodityscope.com/prices/fertilizers
- Fertilizer Daily, "Egypt extends gas supply cut to ammonia producers to 33%," Nov 11, 2026, citing EnterpriseAM and Egyptian Exchange filings; Fertilizer Daily, "AGF Nitrogen weighs ammonia plant shutdowns as gas costs soar and demand weakens," Nov 12, 2026, citing Reuters (Nov 4, 2026). https://www.fertilizerdaily.com/20261111-egypt-gas-supply-cut-ammonia-producers-33-percent/ ; https://www.fertilizerdaily.com/20261112-ammonia-plant-shutdowns-agf-nitrogen/
- U.S. Energy Information Administration, Henry Hub Natural Gas Spot Price (daily), accessed Nov 16, 2026. https://www.eia.gov/dnav/ng/hist/rngwhhdD.htm
- CommodityScope, Phosphate prices (DAP NOLA FOB), accessed Nov 16, 2026. https://commodityscope.com/prices/phosphates
- Trading Economics, Di-ammonium Phosphate, accessed Nov 16, 2026. https://tradingeconomics.com/commodity/di-ammonium
- CommodityScope, Sulfur prices, accessed Nov 16, 2026; Trading Economics, Sulfur, accessed Nov 16, 2026. https://commodityscope.com/prices/sulfur ; https://tradingeconomics.com/commodity/sulfur
- CommodityScope, Potash prices, accessed Nov 16, 2026. https://commodityscope.com/prices/potash
- DTN/Progressive Farmer, "USDA Weekly Crop Progress Report," Nov 9, 2026 (USDA NASS, week ending Nov 8). https://www.dtnpf.com/agriculture/web/ag/news/article/2026/11/09/usda-crop-progress-corn-81-harvested
- USDA Agricultural Marketing Service, Grain Transportation Report, Nov 12, 2026. https://ams-prod.azureedge.us/sites/default/files/media/GTR11122026.pdf
- U.S. Energy Information Administration, Weekly Heating Oil and Propane Prices (residential propane), accessed Nov 16, 2026. https://www.eia.gov/dnav/pet/pet_pri_wfr_a_EPLLPA_PRS_dpgal_w.htm
- Fertilizer Daily, "Illinois study will test how much nitrogen inhibitors cut nitrate loss," Nov 13, 2026. https://www.fertilizerdaily.com/20261113-statewide-study-nitrogen-inhibitors-nitrate-loss-illinois/
Weekly Briefing
Fertilizer
Retail anhydrous holds above $1,000 as urea and UAN ease — DTN's survey for November 2–6 put anhydrous at $1,003 a ton, urea at $662, UAN28 at $428 and UAN32 at $484. DAP at $950 and MAP at $991 were both higher on the month. All eight products cost more than a year ago, led by anhydrous at 17% and urea at 11%, and a pound of N costs 61 cents as anhydrous against 72 cents as urea. (DTN/Progressive Farmer, Nov 11, 2026)
Gas cuts are shutting ammonia lines in Egypt and Europe — Egypt's Mopco told the Egyptian Exchange its gas intake was cut 33%, up from 20% a week earlier, and EnterpriseAM reports the government is applying the same cut to other fertilizer and methanol plants with no end date. In Europe, AGF Nitrogen's chief executive told Reuters the company has halted some ammonia lines and may shut plants because gas makes its ammonia costlier than imports. Neither report says how much output is lost. (Fertilizer Daily, Nov 11, 2026; Reuters, Nov 4, 2026, via Fertilizer Daily, Nov 12, 2026)
TFI: Belarusian potash would add 8% to 12% at most — A Fertilizer Institute white paper estimates Belarus could send 1 million to 1.5 million tonnes of potash a year to the United States, against 12.6 million tonnes imported in 2025. Canada supplies 85% to 90% of U.S. imports. Belarus has lost its route through Lithuania, and TFI says moving more volume would take more than a purchase agreement. (Farm Progress, via Fertilizer Daily, Nov 11, 2026)
CF asks Washington to press Brussels on ammonia's carbon number — In comments to the U.S. Trade Representative, CF Industries says the EU's default emissions value for U.S. ammonia is 3.41 tonnes of CO2-equivalent a ton, against 2.14 on its own analysis of U.S. government data. Census data cited in the filing show U.S. UAN exports to the EU at 42,000 tonnes through September, 88% below the prior three-year average. The 2.14 figure is CF's own calculation. (Argus Media, via Fertilizer Daily, Nov 13, 2026)
Crops
USDA cuts corn yield 1.6 bushels, more than the trade expected — The November 10 reports put corn yield at 179.6 bushels an acre, production at 15.893 billion bushels and ending stocks at 1.758 billion, 68 million under the average trade estimate. The farm price fell 10 cents to $4.60. Soybean yield rose 0.2 to 53.3 and ending stocks fell to 300 million bushels against an expected 336 million, with the price up 10 cents to $12.10. (DTN/Progressive Farmer, Nov 10, 2026)
Corn harvest 81%, Iowa still 17 points behind — By November 8, 81% of corn and 92% of soybeans were harvested, against averages of 86% and 91%. Iowa corn was 72% against 89%. Winter wheat was 89% planted and 76% emerged, and 49% rated good to excellent, up 5 points on the week. DTN's text gives the five-year average rating as 37% and its table implies 38%. (USDA NASS via DTN, Nov 9, 2026)
Illinois soybeans gain 43 cents on the week, corn 7 — North-central Illinois country elevators bid an average $12.04 for soybeans and $4.19 for corn on November 13, against $11.61 and $4.12 a week earlier. December corn settled at $4.45½ and December 2027 corn at $4.79¾. The week-on-week moves are our arithmetic against the November 6 report. (USDA AMS Illinois Grain Bids, Nov 13, 2026)
Wheat stem sawfly costs Colorado $70 million a year — Colorado State puts direct and indirect sawfly losses at $70 million a year on a winter wheat crop worth up to $350 million. Solid-stem varieties resist the larvae but yield less. Fusarium strains killed up to 90% of larvae in lab and greenhouse tests, and field inoculation of stubble is only starting. (Colorado State University, via Phys.org, Nov 10, 2026)
Home & Garden
Check tender plants for disease before they come indoors — Iowa State's yard and garden specialists say to look for more than insects before overwintering tender perennials. Rings or distortions on elephant ear leaves can mean a virus, which cannot be cured and stays in the tubers. Galls on petunias can be crown gall or leafy gall. Suspect plants go in the trash, not the compost, and should not be divided or used for cuttings. (Iowa State University Extension and Outreach, Nov 5, 2026)
Feed the spring bulbs now, before the ground freezes — A University of Missouri Extension horticulturist says spring bulbs benefit from fertilizer between mid-November and early December. Roses want 6 to 10 inches of mulch after a hard frost, and strawberries a loose straw cover before temperatures reach the teens. Amaryllis and paperwhites started in late November bloom in four to six weeks. The advice is written for central Missouri. (Jefferson City News Tribune, Nov 1, 2026)
Your pumpkin pie owes something to the mastodon — Wild squash is bitter with cucurbitacins that small mammals avoid. Ice Age giants ate the fruit anyway and spread the seed, and preserved mastodon dung has turned up with squash seeds in it. When the big animals died out, wild squash declined until people began growing it and selecting for better flavor. (University of Illinois Extension, Good Growing, Nov 6, 2026)
Micronutrients
A maize gene explains how nickel reaches the grain — Chinese researchers screened 1,404 maize lines and identified a transporter, ZmNAET1, that moves nickel from stems and leaves into the kernel. Lines with higher expression carried about 60% more grain nickel, and seed from plants with the gene impaired germinated poorly after 8 to 12 months in storage. Basic science: the summary gives no figures for the field foliar-nickel work, and nothing here supports a nickel recommendation. (Cell, via Phys.org, Nov 10, 2026)
Spot sulfur falls another $75 into China — Granular sulfur delivered to China was indicated at $732.50 a tonne on November 12, down $75, or 9.3%, in a week. Middle East spot was $697.50 FOB, down $20, and Indonesia $750 delivered, down $65. The yuan-denominated benchmark is 16% below a month ago and still 39% above a year ago. These are indicative assessments, and the site does not name its underlying sources. (CommodityScope, Nov 12, 2026; Trading Economics, Nov 16, 2026)
Organics
Compost alone raised ammonia loss and cut rice yield — In a two-rotation rice and wheat test, Jiangsu researchers found compost with 15% biochar and 0.5% of the nitrification inhibitor DCD cut ammonia losses 27.1% against urea and held rice yield. Plain compost and biochar-only compost raised ammonia emissions and cut rice yield by about 19.5%. Soil columns, not fields: the authors call for field trials, and the economic estimates rest on assumed premiums. (Agricultural Ecology and Environment, via Fertilizer Daily, Nov 12, 2026)
Green manure plus biochar let maize hold yield on 30% less fertilizer — A three-year North China Plain field experiment found a winter green manure with biochar lowered bulk density by up to 12.4% against winter fallow and raised soil carbon and microbial biomass. Maize yield held with controlled-release fertilizer cut 30%. A 45% cut gave significantly lower yield. The work comes from one region, and the report does not name the journal. (Bioengineer.org, via Fertilizer Daily, Nov 11, 2026)
PFAS may blunt the soil enzymes that release phosphorus — Two studies summarized this week found PFOA cut soil microbial viability by up to 79% at higher concentrations in West Texas soil, and that a phosphorus-releasing enzyme fell by up to 82% in an arid Spanish soil in a 210-day lab test. Lab and incubation results: the reported field link, in farmer accounts from India, is suspected and not proven. (The Scientist, via Fertilizer Daily, Nov 16, 2026)
Up and Coming
Illinois will measure what inhibitors do to tile nitrate — A retailer survey found nitrification inhibitors in about 96% of Illinois fall anhydrous applications. Researchers found only 25 plot-years of monitored tile-drainage data across the Corn Belt testing the nitrate effect. A four-year, $1.4 million University of Illinois project across 12 sites aims for more than 380 observations, with Koch Agronomic Services funding nearly $1 million of nitrous oxide work at the same sites. No results yet. (Fertilizer Daily, Nov 13, 2026)
A nitrogen-fixing-microbe company lists what still has to work — Switch Bioworks led a Nature Biotechnology commentary saying engineered bacteria that release ammonia for cereals tend to grow and compete poorly on roots. It sets four priorities, including standard tests showing the nitrogen reaches the crop. A company-led commentary, not a trial: it reports no field yields, and the emissions savings quoted are the company's estimate. (Fertilizer Daily, Nov 13, 2026)
Punjab injects green ammonia under 110 acres of wheat — Scientists at a Punjab Agricultural University farm science center began a trial on November 2, injecting green ammonia about 15 centimeters deep as a possible substitute for urea. Early-stage: the report gives no control design, yield data or cost of the ammonia. (The Tribune, via Fertilizer Daily, Nov 12, 2026)
Two hormone sprays lifted cotton yield 11.6% on potassium-poor soil — China Agricultural University researchers found ethylene and jasmonate together switch on cotton's potassium uptake when soil supply is low. Spraying both signals raised seed cotton yield 11.6% over unsprayed plants. One soil type: the fields held under 60 mg/kg of available potassium, so nothing shows a gain on adequately fertilized ground. (Science Bulletin, via Fertilizer Daily, Nov 12, 2026)
Interesting
A ton of U.S. grain takes 13 kg of nutrient, Brazil's 62 — A paper using FAO data from 1961 to 2023 puts applied nutrient per tonne of grain at about 13 kg in the United States, 32 in Canada, 53 in China and 62 in Brazil. It says U.S. cereal yield has doubled since 1980 while the application rate rose 14%. The paper is from a Calgary farmland investment manager and is not peer-reviewed. (Omnigence Asset Management, Nov 4, 2026, via Fertilizer Daily, Nov 10, 2026)
Freight is now a third of Illinois corn's cost landed in Mexico — USDA puts third-quarter Illinois corn landed at Veracruz by water at $262.33 a tonne, up 6.8% on the quarter. Transport was $82.68 of it, 32%, against 28% a year earlier. Barge cost rose 26% on the quarter and ocean freight 50% on the year. (USDA AMS Grain Transportation Report, Nov 12, 2026)
Rail fuel surcharges hit a record 76 cents a mile — The grain-weighted Class I fuel surcharge for November is $0.76 a mile, an all-time high and 231% above April. On a 1,500-mile trip that is $765 a car more than a year ago at BNSF and Union Pacific. Secondary shuttle bids of $150 to $217 a car below tariff are offsetting part of it. (USDA AMS Grain Transportation Report, Nov 12, 2026)
UAN leaks from a containment tank in southeast Iowa — Iowa's Department of Natural Resources is investigating a release of 32% UAN at a fertilizer facility in Fort Madison. Some product and rainwater reached a ditch that connects to a tributary of the Mississippi. Cleanup has started and no dead fish had been seen. No volume was reported. (DTN/Progressive Farmer, Nov 11, 2026)
Off the Wall Discovery
Wombats loosen soil and may carry root fungi — Inside the range of the southern hairy-nosed wombat, Australian researchers measured soil compaction up to 78% lower and water infiltration up to 295% higher, with plant density averaging 168% higher. Mycorrhizal fungi turned up in the dung. A comparison, and mostly "up to" figures: the fungal dispersal role is inferred from the dung, not demonstrated. (Australian Mammalogy, via Phys.org, Nov 10, 2026)
Same fertilizer in bigger, rarer doses favored two weeds — At eight field sites in Germany, plots given a double dose every two weeks grew 66.1% and 137.7% more above-ground mass of two invasive plants, knotweed and Canada goldenrod, than plots given the same total in weekly doses. Native plants did not respond. One season and two species, and the summary does not say which figure belongs to which plant. (Basic and Applied Ecology, via Phys.org, Nov 12, 2026)
An archaeological dig roughly doubled a hillside's erosion — Modelling of a Bronze Age mound in Türkiye excavated from 2003 to 2019 put sediment yield on the cemetery slope at about 21 tonnes a hectare a year after the dig, against 11 before. The team used the USDA-developed WEPP erosion model. A model, not a measurement: no runoff or sediment was measured on site. (Geoderma Regional, via Phys.org, Nov 10, 2026)
A Ton of DAP Costs 233 Bushels of Iowa Corn, Up From 190 in September and 4 Short of Last November. MAP, at 243, Costs More Corn Than It Did a Year Ago.
Iowa cash corn fell 78 cents in two months while retail DAP rose $27 and MAP $29, so 43 of the 47 bushels a ton that September had gained on last November are gone, and the corn price accounts for 85% of the move. The New Orleans barge slipped $6 over the same weeks the dealer price rose $16. Replacing a 210-bushel corn crop's phosphate now takes $69 an acre, or 17.0 bushels against 13.9 in September. Sulfur's fourth-quarter cut is worth $33 a ton of DAP and November ammonia took back $19, Nutrien is closing a fifth of its phosphate sales in 2027, and the Moroccan duty finding stands at 20.04%.
Retail DAP averaged $950 a ton and MAP $991 in DTN's survey for Nov 2–6, the highest readings for either product in the year DTN's table covers (DTN/Progressive Farmer, Nov 11, 2026) [1]. Over the same weeks the corn that pays for it got cheaper. The six Iowa country-elevator regions USDA reports averaged about $4.08 a bushel on Nov 13 (USDA AMS Iowa Daily Cash Grain Bids, Nov 13, 2026) [2]. On Sep 15 the same average was about $4.86 (Crop Root Zone, TRZ-0199, Sep 16, 2026) [5]. A ton of DAP therefore costs about 233 bushels of Iowa corn, up from 190 in mid-September and 4 bushels short of the 237 it cost a year ago. MAP costs about 243 bushels, more than the 238 of last November. The affordability gain this desk measured in September was a corn-price gain, and most of the corn price has gone. Nothing on the producer side points to the phosphate price making up the difference before spring.
1. Two months took back 43 of September's 47 bushels, and corn did 85% of it
What's new: Between mid-September and mid-November, Iowa cash corn fell 16% and retail DAP rose 3%. DAP's cost in bushels rose from 189.8 to 232.7, a 23% increase. Against last November, DAP is 1.7% more affordable in corn and MAP is 2.1% less affordable.
Evidence: USDA's Nov 13 Iowa report shows regional country-elevator corn averages of $4.01 to $4.12 and year-ago values of $3.86 to $3.97. The simple averages are $4.0822 and $3.9097 [2]. Soybeans averaged $11.61, against $10.47 a year ago [2] and about $12.64 in mid-September [5]. December corn settled at $4.455 on Nov 13 [2]. It settled at $5.3575 on Sep 15 [5]. USDA's Nov 10 WASDE cut the corn yield 1.6 bushels to 179.6 and still lowered the season-average farm price a dime to $4.60, with exports reduced 25 million bushels (USDA WASDE, Nov 10, 2026) [6]. In September the same forecast was $4.80 [5].
| Mid-month | Nov 2025 | Sep 2026 | Nov 2026 |
|---|---|---|---|
| Retail DAP, $/ton | 926 | 923 | 950 |
| Retail MAP, $/ton | 930 | 962 | 991 |
| Iowa cash corn, $/bu | 3.91 | 4.86 | 4.08 |
| Iowa cash soybeans, $/bu | 10.47 | 12.64 | 11.61 |
| DAP, bu corn/ton | 236.8 | 189.8 | 232.7 |
| MAP, bu corn/ton | 237.9 | 197.8 | 242.8 |
| DAP, bu soybeans/ton | 88.4 | 73.1 | 81.8 |
| MAP, bu soybeans/ton | 88.8 | 76.1 | 85.4 |
Sources: Retail, DTN/Progressive Farmer, Nov 11, 2026 (delivered retail survey averages for Nov 3–7, 2025, Sep 7–11, 2026 and Nov 2–6, 2026) [1]. Grain, USDA AMS Iowa Daily Cash Grain Bids, Nov 13, 2026, simple average of six country-elevator regions, current delivery, with the report's year-ago column used for Nov 2025 [2]; Sep 2026 grain prices and DAP ratios from Crop Root Zone, TRZ-0199 (Iowa bids of Sep 15, 2026) [5]. Bushels per ton are Crop Root Zone estimates.
The move since September can be split. Had DAP stayed at $923, the corn decline alone would have taken the ratio from 189.8 to 226.1 bushels. The $27 rise in DAP added the other 6.6. Of the 42.9-bushel deterioration, 85% came from the crop and 15% from the fertilizer. Measured against last November's 236.8, September's reading was a 47-bushel improvement. Four of those bushels are left.
232.7 bushels
Iowa cash corn needed to buy one ton of retail DAP in mid-November 2026, against 189.8 in mid-September and 236.8 a year ago. (Crop Root Zone estimate from DTN/Progressive Farmer, Nov 11, 2026; USDA AMS Iowa Daily Cash Grain Bids, Nov 13, 2026)
Soybeans held up better. Iowa soybean bids are down 8% since mid-September and still 11% above last November [2][5]. A ton of DAP costs about 82 bushels of soybeans, 9 more than in September and 7 fewer than a year ago. In our September piece the 2019–20 average for DAP was 127 bushels of corn on a mid-September basis [5]. Today's reading is 1.8 times that.
Ground Truth: In September we called the improved ratio a mark-to-market figure that became real only for bushels sold against tons booked [5]. The two months since show the size of that caveat. A grower who priced corn and booked DAP in mid-September paid about 190 bushels a ton. One who did neither is at 233. The dollars on the fertilizer invoice differ by $27. The 43-bushel gap is nearly all a grain-marketing result, not a fertilizer-buying one. For 2027 the same logic runs forward: the phosphate bill will be set this winter, and the ratio it is judged by will be set whenever the 2027 crop is priced.
2. The barge slipped while the dealer price rose
What's new: Wholesale phosphate did not lead retail higher this month. The New Orleans DAP barge eased to $795–798 a short ton on Nov 6 from $795–805 a week earlier, and MAP firmed to $820–830 on tight spot supply (Advanced Turf Solutions, Nov 9, 2026) [7]. DTN's retail DAP average rose $16 between the Oct 5–9 and Nov 2–6 surveys [1].
Evidence:
| Level | DAP, $/st | MAP, $/st | Basis | As of |
|---|---|---|---|---|
| Producer guidance, Q4 | 744–762* | n/a | FOB plant, Mosaic guidance of $820–840 a tonne | Nov 3 |
| NOLA barge | 795–798 | 820–830 | FOB barge, New Orleans | Nov 6 |
| Illinois distributor ask, average | 932.14 | 948.00 | FOB distributor | Nov 13 |
| Retail survey average | 950 | 991 | Delivered retail, national survey | Nov 2–6 |
Sources: The Mosaic Company, Nov 3, 2026 [10]; Advanced Turf Solutions, Nov 9, 2026 [7]; USDA AMS Illinois Production Cost Report, Nov 13, 2026 [4]; DTN/Progressive Farmer, Nov 11, 2026 [1]. *Crop Root Zone conversion from metric tonnes at 0.9072.
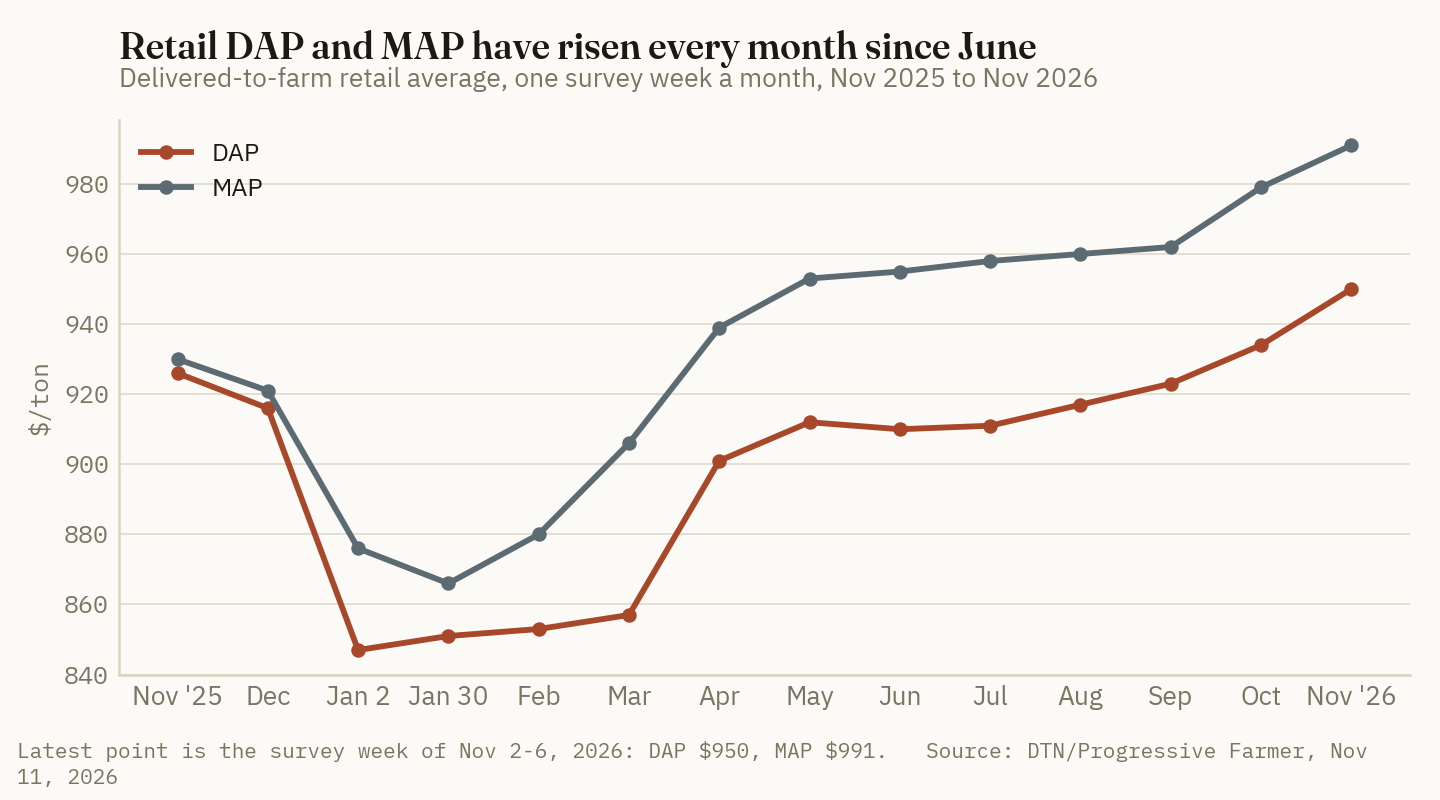
Retail DAP now sits about $153.50 over the midpoint of the barge range. In mid-October we measured that gap at $131.50, with retail at $934 and the barge at $802.50 (Crop Root Zone, TRZ-0286, Oct 16, 2026) [8]. The October barge figure came from a different public series than the distributor summary used here, so the $22 widening is approximate. The direction is clear in both sources. The barge moved down a few dollars and the retail average moved up $16.
The Illinois panel shows the same pattern from the dealer side. The average distributor ask was $932.14 for DAP and $948.00 for MAP on Nov 13, both unchanged from the prior bi-weekly report, with DAP offers ranging from $840 to $995 [4]. At the central Illinois country-elevator corn average of $4.26 [3], that DAP ask is about 219 bushels, a Crop Root Zone estimate.
The year-on-year comparison points the other way. The barge is up about 9% from $725–735 a year ago [7]. Retail DAP is up 3% [1]. The retail-to-barge gap was about $196 last November and is about $154 now. Priced in Iowa corn, the barge ton itself costs about 195 bushels against 187 a year ago. The distributor summary's year-ago MAP barge figure contains an apparent typographical error, so we make no MAP comparison.
Ground Truth: The $16 that retail DAP added in a month is the dealer layer returning toward its usual width. It is not a new cost coming up the river. In October that layer was the narrowest in four Octobers [8], and it is still about $42 narrower than last November. For a buyer this sets the floor more than the ceiling. If the barge holds near $800, as the distributor summary expects through December [7], a retail average in the $930s to $950s is what a normal markup produces. A quote in the $840s to $880s, which the Illinois range shows still exists [4], is a dealer selling older inventory. That is the price worth asking for.
3. The producer side offers three reasons not to wait for cheaper phosphate
What's new: Three developments since late October bear on spring supply. The November Tampa ammonia contract rose $95 a tonne. Nutrien said it will close its White Springs, Florida, phosphate operation in the second quarter of 2027. The Commerce Department's final sunset-review result kept its 20.04% subsidy finding on Moroccan phosphate.
Evidence: Yara and Mosaic settled the November Tampa ammonia contract on Oct 28, up $95 from October (Fertilizer Daily, Nov 2, 2026) [12], at $645 a tonne CFR (Fertilizer Daily, Nov 5, 2026) [11]. The fourth-quarter Tampa sulfur contract fell $90 a long ton to $615 [7][10], which we valued at about $33 a short ton of DAP (Crop Root Zone, TRZ-0342, Nov 10, 2026) [13]. Using the 0.22 tonnes of ammonia per tonne of DAP from our producer-margin work (Crop Root Zone, TRZ-0331, Nov 4, 2026) [14], the ammonia increase costs about $19 a short ton.
| Input move | Change | Effect on a short ton of DAP | When it reaches cost |
|---|---|---|---|
| Tampa sulfur, Q3 to Q4 contract | −$90/lt | −$33* | Mainly first quarter 2027 |
| Tampa ammonia, October to November | +$95/t | +$19* | Monthly contract, from November |
| Net | −$14* |
Sources: The Mosaic Company, Nov 3, 2026 [10]; Advanced Turf Solutions, Nov 9, 2026 [7]; Fertilizer Daily, Nov 2 and Nov 5, 2026 [11][12]. *Crop Root Zone estimates using 0.41 long tons of sulfur and 0.22 tonnes of ammonia per tonne of DAP [13][14].
Mosaic's own guidance already pointed to no price cut. It expects fourth-quarter DAP at $820–840 a tonne FOB plant, against $838 realized in the third quarter, with margins falling further and more mine curtailment, and it expects the sulfur saving to reach earnings mainly in the first quarter of 2027 [10]. The company ran its phosphate system at 52% of capacity in the third quarter [7][14]. Its Nov 3 release described demand as running ahead of customers' expectations because stronger crop prices had improved farm economics [10]. December corn has since settled at $4.455 [2].
Nutrien reported a third-quarter phosphate net selling price of $864 a tonne against cost of goods sold of $939, a gross margin of minus $75, and attributed the cost increase mainly to sulfur. After a strategic review it will keep its larger North Carolina complex, having judged the bids it received too low, and shut White Springs as the mine nears the end of its economic reserves. White Springs accounts for about 20% of the company's 2026 phosphate sales, which are guided to 2.40–2.55 million tonnes (Nutrien, Nov 4, 2026) [9]. That is roughly half a million tonnes of product a year, on our arithmetic.
On trade, the distributor summary reports that Commerce concluded its sunset review with the 20.04% countervailing duty on Moroccan phosphate maintained, while the temporary suspension remains in effect [7]. Argus reported the final result on Nov 3 and an International Trade Commission vote expected on May 5, 2027 (Argus Media, Nov 3, 2026) [15]. The suspension was proclaimed on June 29 for eight months (Crop Root Zone, TRZ-0209, Sep 18, 2026) [16]. Counted from that date it lapses around the end of February 2027 unless it is extended, and the commission's vote comes after that.
Ground Truth: Each of these shortens the list of ways phosphate gets cheaper by planting. The net input saving is about $14 a ton, not $33, and it arrives in a quarter when the largest US producer is guiding margins down. A plant that supplies a fifth of another major producer's phosphate sales closes in the spring application quarter. The duty waiver that lets Moroccan tons land at no duty is due to lapse about two months before the commission votes. An importer deciding in January whether to load a March cargo faces the chance that 20.04% applies on arrival. We expect that uncertainty to show up first as thinner spring import offers, before it shows up in any price.
4. On the acre: $69 for a corn crop's removal, and the bushels depend on which corn price is used
What's new: At November retail, replacing the phosphate removed by a 210-bushel corn crop costs about $69 an acre as DAP and $64 as MAP. That is 17.0 bushels of Iowa cash corn, against 13.9 in mid-September and 17.3 a year ago.
Evidence: We use Iowa State's grain removal coefficients of 0.32 lb of P2O5 per bushel of corn and 0.72 lb per bushel of soybeans, and its default yields of 210 and 70 bushels (Iowa State University Extension, PM 1688, Feb 2023) [17], the same basis as our September drawdown piece (Crop Root Zone, TRZ-0227, Sep 24, 2026) [18]. DAP at $950 is $1.03 a pound of P2O5 with no credit for its nitrogen. MAP at $991 is $0.95.
| Crop and yield | P2O5 removed, lb/acre | As DAP, $/acre | As MAP, $/acre | DAP cost in bu, Nov 2026 | Sep 2026 | Nov 2025 |
|---|---|---|---|---|---|---|
| Corn, 210 bu | 67.2 | 69.39 | 64.03 | 17.0 | 13.9 | 17.3 |
| Soybeans, 70 bu | 50.4 | 52.04 | 48.03 | 4.5 | 4.0 | 4.8 |
| Two-year rotation | 117.6 | 121.43 | 112.06 |
Sources: Removal coefficients, Iowa State University Extension, PM 1688, Feb 2023 [17]. Prices, DTN/Progressive Farmer, Nov 11, 2026 [1]; USDA AMS Iowa Daily Cash Grain Bids, Nov 13, 2026 [2]; Crop Root Zone, TRZ-0199 [5]. All per-acre figures are Crop Root Zone estimates with no nitrogen credit and no application cost. Bushel columns divide the DAP cost at each date's retail price by that date's Iowa cash price for the crop.
The corn-year bill is 8.1% of the crop's gross value at the Iowa cash price, up from 6.6% in September. MAP is the cheaper source by about $5 an acre when its nitrogen is ignored. Credit the nitrogen at DTN's anhydrous value of $0.61 a pound [1] and the order reverses: DAP's phosphate costs about $0.79 a pound and MAP's about $0.82, the same flip we have reported since August.
A 2027 budget is not built on today's harvest-pressured cash bid. December 2027 corn settled at $4.7975 on Nov 13 [2]. The reading in bushels depends on which price the reader uses.
| Corn price used | $/bu | DAP, bu/ton | |
|---|---|---|---|
| Iowa country-elevator average, Nov 13 | 4.08 | 232.7 | ██████████ |
| Central Illinois country-elevator average, Nov 13 | 4.26 | 223.0 | ██████████ |
| December 2027 futures less 38 cents* | 4.42 | 214.9 | █████████░ |
| WASDE 2026/27 season-average price | 4.60 | 206.5 | █████████░ |
| December 2027 futures, Nov 13 | 4.80 | 198.0 | █████████░ |
| Reference: Iowa cash, Sep 15 | 4.86 | 189.8 | ████████░░ |
Sources: USDA AMS Iowa Daily Cash Grain Bids and Illinois Grain Bids, Nov 13, 2026 [2][3]; USDA WASDE, Nov 10, 2026 [6]; Crop Root Zone, TRZ-0199 [5]; retail DAP at $950 from DTN/Progressive Farmer, Nov 11, 2026 [1]. *Illustration only: it applies the Nov 13 Iowa state-average basis of 38 cents under December 2026 to the December 2027 contract. It is not a quoted new-crop bid. Bushels per ton are Crop Root Zone estimates; bars scale 232.7 to ten blocks.
Every row is above September's 190. At the December 2027 settlement with no basis taken off, the corn-year removal bill is 14.5 bushels. The USDA reports we used carry no November 2027 soybean settlement, so the soybean figures here are on a cash basis only.
Ground Truth: The September number told a grower with high-testing ground that a phosphate drawdown saved a lot. The November number says it saves more. On fields in Iowa State's High and Very High categories, where the university recommends little or no maintenance phosphate for a single crop [18], leaving out the corn-year application keeps $69 an acre, or 17 bushels, in a year when a bushel is worth 78 cents less than it was at the start of harvest. On Optimum ground the pounds are still owed, and the decision is about timing. There the producer side decides it. We see no evidence that waiting until spring buys a lower price, and three reasons, in section 3, to think spring supply is the larger risk. For Optimum ground, we would price the tons now and look for the grain sale separately. The futures curve currently offers $4.80 for December 2027, which would return the ratio to about 198 bushels.
References
- DTN/Progressive Farmer, Russ Quinn, "DTN Retail Fertilizer Trends," Nov 11, 2026 (retail survey Nov 2–6, 2026; monthly table from Nov 3–7, 2025; per-pound nitrogen values). https://www.dtnpf.com/agriculture/web/AG/crops/article/2026/11/11/retail-fertilizer-prices-mixed-first
- USDA AMS, Iowa Daily Cash Grain Bids, Nov 13, 2026 (current and year-ago regional corn and soybean bids; state average and basis; CBOT settlements including December 2026 and December 2027 corn). https://www.ams.usda.gov/mnreports/ams_2850.pdf
- USDA AMS, Illinois Grain Bids, Nov 13, 2026 (central Illinois country-elevator average). https://www.ams.usda.gov/mnreports/ams_3192.pdf
- USDA AMS, Illinois Production Cost Report (Bi-weekly), week ending Nov 13, 2026 (distributor asks, FOB). https://www.ams.usda.gov/mnreports/ams_3195.pdf
- Crop Root Zone, TRZ-0199, "A Ton of Potash Costs About 102 Bushels of Corn, Back to Its 2019–20 Level. DAP Still Takes About 190, More Than at the 2022 Peak.," Sep 16, 2026 (Iowa cash corn and soybean averages of Sep 15, 2026; December corn settlement; September WASDE price; September ratios and the 2019–20 average).
- USDA World Agricultural Outlook Board, World Agricultural Supply and Demand Estimates (WASDE-677), Nov 10, 2026. https://www.usda.gov/oce/commodity/wasde/wasde1126.pdf
- Advanced Turf Solutions, "U.S. Fertilizer Market Summary," Nov 9, 2026 (prices as of Nov 6, 2026: NOLA DAP and MAP barges, week-ago and year-ago; Tampa sulfur; Mosaic operating rate; Commerce sunset review; outlook). https://www.advancedturf.com/wp-content/uploads/2026/04/ATS-Fertilizer-Market-Update-11_9_2026.pdf
- Crop Root Zone, TRZ-0286, "Retail DAP Sits $131.50 Over the NOLA Barge, the Narrowest October Gap in Four Years. Measured Against Summer Fill, the Dealer's Markup Has Shrunk Three Falls Running.," Oct 16, 2026.
- Nutrien Ltd., "Nutrien Reports Third Quarter 2026 Results," news release, Nov 4, 2026, as republished by Investing News Network (phosphate segment results; strategic review; White Springs closure; sales volume guidance). https://investingnews.com/nutrien-reports-third-quarter-2026-results/
- The Mosaic Company, "The Mosaic Company Reports Third Quarter 2026 Results," press release, Form 8-K Exhibit 99.1, Nov 3, 2026. https://www.sec.gov/Archives/edgar/data/0001285785/000128578526000139/pressreleaseq32026-ex991.htm
- Fertilizer Daily, K. Clarksen, report on the Yara–Mosaic November ammonia contract, Nov 5, 2026 ($645 a tonne CFR Tampa, up $95 from October; relays a weekly market report). https://www.fertilizerdaily.com/20261105-yara-mosaic-november-ammonia-contract/
- Fertilizer Daily, K. Clarksen, report on the November 2026 Tampa ammonia contract, Nov 2, 2026 (settled Oct 28; up $95 a tonne; relays Quantum Commodity Intelligence). https://www.fertilizerdaily.com/20261102-tampa-ammonia-november-2026/
- Crop Root Zone, TRZ-0342, "Tampa Sulfur Settled at $615 for the Fourth Quarter, $90 Under the Record and Still Double Last Year. It Takes $33 Off a Ton of DAP, but Not Until Spring. A Corn Acre's Phosphate Now Carries $15 of Sulfur the Crop Never Gets.," Nov 10, 2026.
- Crop Root Zone, TRZ-0331, "Mosaic Got $838 a Tonne for DAP in the Third Quarter, Its Best Price of the Year, and Booked a Phosphate Gross Margin of Minus $105. Sulfur Explains Only Half of the Drop.," Nov 4, 2026 (ammonia ratio; 52% operating rate from Mosaic's performance data).
- Argus Media, "US Commerce affirms Morocco phos duty proposal," Nov 3, 2026 (headline and public summary only; full text not retrieved). https://www.argusmedia.com/en/news-and-insights/latest-market-news/2899649-us-commerce-affirms-morocco-phos-duty-proposal
- Crop Root Zone, TRZ-0209, "Washington Suspended the 16.60% Moroccan Phosphate Duty on July 8. Ten Weeks Later Retail DAP Is $923/st — $13 Higher Than the Week It Was Signed.," Sep 18, 2026 (June 29 proclamation; eight-month term).
- Iowa State University Extension and Outreach, PM 1688, "A General Guide for Crop Nutrient and Limestone Recommendations in Iowa," revised Feb 2023. https://store.extension.iastate.edu/product/A-General-Guide-for-Crop-Nutrient-and-Limestone-Recommendations-in-Iowa
- Crop Root Zone, TRZ-0227, "Skipping Fall P&K Ahead of Corn Saves About $87 an Acre. On Ground Testing Optimum, Only About $14 of It Is Real Money.," Sep 24, 2026 (removal basis; Iowa State soil-test category recommendations).
Disclosures
Crop Root Zone is an independent publication. Nothing here is investment advice. Market calls, where included, reflect the editors' own read and are not a recommendation to buy or sell any security.
The US Exported 1.22 Million Tonnes of Ammonia Through August, 37% More Than Last Year and Within 69,000 Tonnes of What It Imported. Urea Export Receipts Tripled to $539 Million. UAN Exports Fell 47%.
Eight months of trade records show US nitrogen imports flat and exports up 36% in nitrogen content, which cut net imports by about 480,000 tonnes of N. Ammonia went to Morocco and Chile from new Texas plants. Urea went to Canada during the US spring and then, once the Gulf barge fell $50 a tonne under Brazil in June, to Chile, Brazil, South Africa and New Zealand. UAN stayed home. Retail prices rose in the same order: anhydrous 19%, urea 12%, UAN 6% to 8%. On today's quotes the urea export window is shut and would reopen near $392 to $401 a short ton at New Orleans, about $29 to $38 under the barge. That is a floor the spring 2027 buyer did not have two years ago.
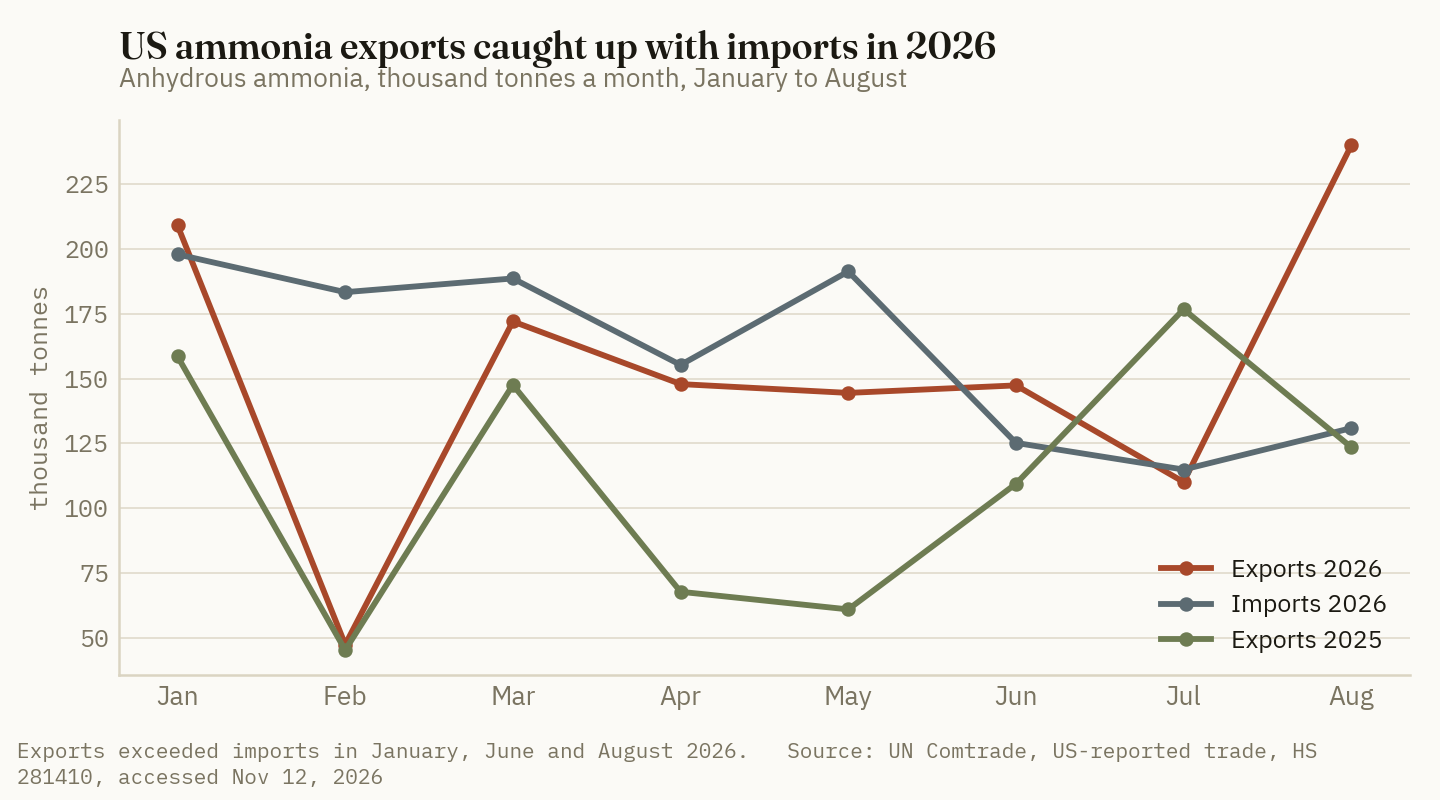
The United States shipped out 1.22 million tonnes of anhydrous ammonia in January to August 2026, 37% more than in the same months of 2025, and took in 1.29 million. The gap between the two, 69,000 tonnes, was 511,000 a year earlier (UN Comtrade, accessed Nov 12, 2026) [1]. Urea exports earned $539 million against $182 million, and the tonnage, most of which Comtrade estimates from the dollar value, rose from about 0.40 million tonnes to about 1.16 million. UAN went the other way, down 47% to 452,000 tonnes [1]. Imports of the same products barely moved. This publication has spent the fall counting what came in: July's urea, Brazil's bids, Europe's cargoes. This piece counts what went out, where it went, why, and what an export outlet at the Gulf means for the barge and retail price a Corn Belt buyer faces for spring 2027. One limit applies throughout. The public product-level record ends at August. The Census Bureau published September on Nov 4, and Comtrade had not posted it when we checked on Nov 12 [1], and the Census Bureau's own product-level API returns nothing without a registered key [11].
1. Eight months of exports
What's new: In nitrogen content, exports of the four main straight nitrogen products rose 36% in January to August while imports fell 0.3%. Net imports dropped from about 2.35 million tonnes of N to about 1.87 million (Crop Root Zone calculation from [1]).
Evidence:
| US exports, Jan–Aug | 2024 (kt) | 2025 (kt) | 2026 (kt) | 2026 vs 2025 | Value 2025 ($M) | Value 2026 ($M) | $/tonne, 2026 |
|---|---|---|---|---|---|---|---|
| Anhydrous ammonia | 692.7 | 889.8 | 1,218.5 | +37% | 280.7 | 646.9 | 531 |
| Urea | 522.8† | 398.4† | 1,161.1† | +191%† | 181.7 | 538.5 | 464† |
| UAN | 1,001.9 | 844.6 | 451.6 | −47% | 202.3 | 114.3 | 253 |
| Ammonium nitrate | 535.3 | 434.7 | 330.5 | −24% | 167.2 | 152.0 | 460 |
| Total, tonnes of N* | 1,291 | 1,314 | 1,781 | +36% | 831.9 | 1,451.7 | n/a |
| Imports, same products, tonnes of N* | 3,631 | 3,669 | 3,656 | −0.3% | n/a | n/a | n/a |
| Net imports, tonnes of N* | 2,340 | 2,355 | 1,875 | −20% | n/a | n/a | n/a |
Basis: thousand metric tonnes of product, all routes; FOB export value. Source: UN Comtrade, US-reported monthly trade, HS 281410, 310210, 310280 and 310230, accessed Nov 12, 2026 [1]. *Crop Root Zone calculation at 82% N for ammonia, 46% for urea, 30% for UAN and 34% for ammonium nitrate. †Comtrade estimate: see the caution below. The import rows also carry estimated urea tonnages for July and August 2026.
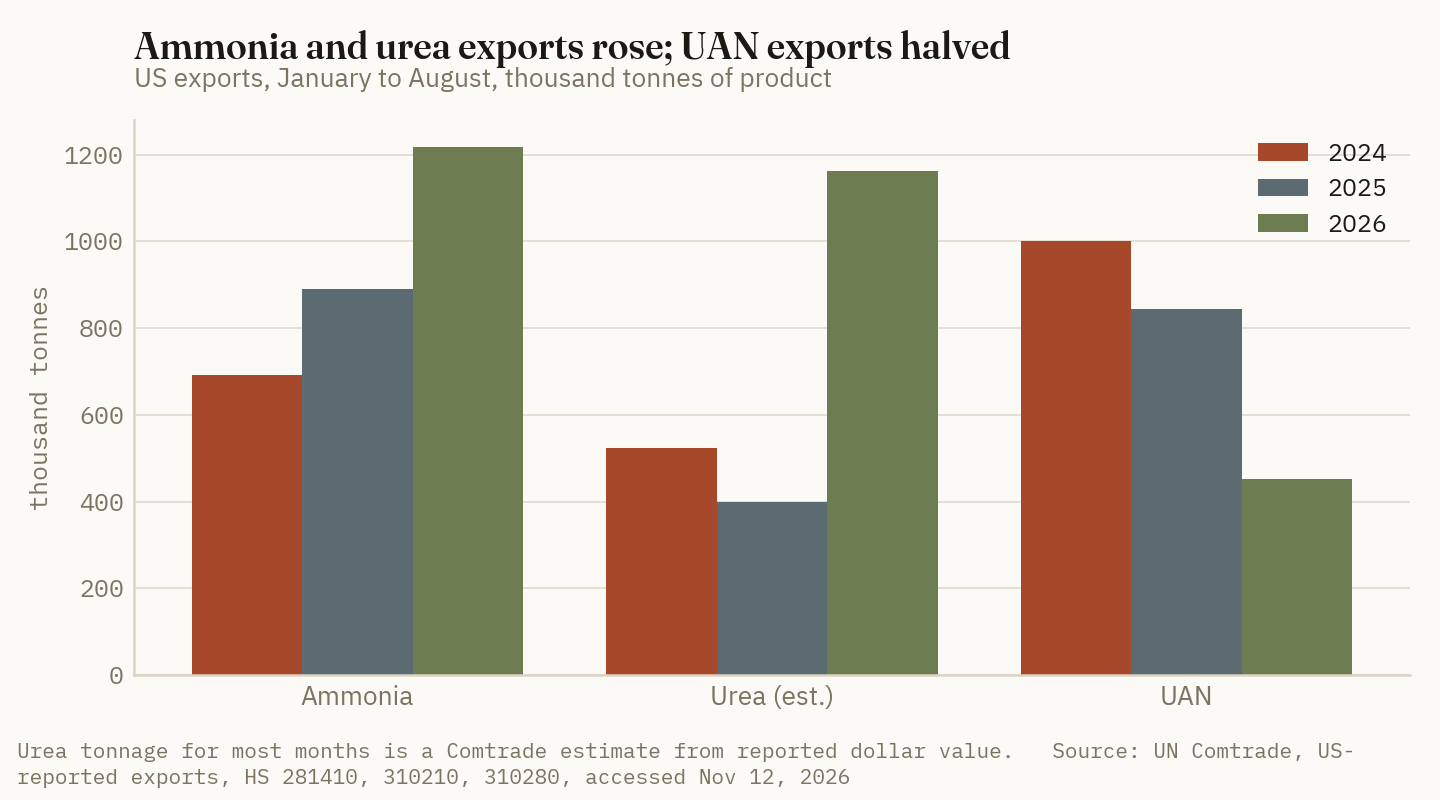
A caution on urea. Comtrade's copy of the US record reports the dollar value of urea exports for every month but reports tonnage for only some. For January to June 2026 it derived tonnes from dollars at a single price of $479 a tonne. Urea was far above that in the spring, so those months are overstated. Argus, working from the Census record, counted 144,619 tonnes to Canada in April (Argus via World Fertilizer, Jun 12, 2026) [7]; Comtrade's estimate for the same flow is 193,400. If we deflate the first six months by the unit value of US urea imports in each month, the January to August total is about 1.0 million tonnes against about 0.43 million in 2025. Exports therefore rose by a factor of 2.3 to 2.9. July and August are reported tonnages: 172,800 and 209,600 tonnes, against an estimated 57,000 and a reported 55,000 a year earlier [1]. The dollar figures need no adjustment. Ammonia, UAN and ammonium nitrate carry no estimation flags.
For context, the US exported 1.28 million tonnes of ammonia in all of 2025, a record on Census data (Quantum Commodity Intelligence, Feb 19, 2026) [5]. Eight months of 2026 have reached 95% of that. On Comtrade's annual series back to 2019, urea's eight months already exceed every full year except 2022, and UAN's eight months are the lowest pace in the series [1].
Ground Truth: A buyer who watched only imports this year saw nothing change: 3.67 million tonnes of N came in through August 2025 and 3.66 million through August 2026. The change was all on the other side of the dock. About 480,000 fewer tonnes of N stayed in the country on net, which is the nitrogen in a little over a million tonnes of urea. Domestic output rose as well, so this is not a measure of a shortage. It does mean the import line-up is no longer a sufficient reading of US supply. Our own pieces cited July's doubling of urea arrivals as heavy supply going into the fall [19][20]. In the same month the US shipped out 173,000 tonnes.
2. Ammonia: new Texas plants, old destinations
What's new: August's 240,055 tonnes of ammonia exports were a 12-month high (Quantum Commodity Intelligence, Oct 6, 2026) [2], and exports exceeded imports in January, June and August [1]. Quantum attributed the first-half rise to new capacity in Texas and to demand from North Africa after the Strait of Hormuz closed (Quantum Commodity Intelligence, Aug 4, 2026) [4]. September slowed slightly from August, on the one line of that report we could read (Quantum Commodity Intelligence, Nov 5, 2026) [6].
Evidence: Two plants account for the new capacity. Gulf Coast Ammonia's 1.2-million-tonne-a-year plant at Texas City loaded its first cargo late in 2025, and Woodside's 1.1-million-tonne plant at Beaumont was due to reach commercial output early in 2026 (Argus Media, Dec 23, 2025) [8]. Woodside has since taken operational control at Beaumont and is delivering conventional ammonia to international customers through 2026 (Fertilizer Daily, Jul 1, 2026) [9].
| Ammonia exports by destination, Jan–Aug | 2025 (kt) | 2026 (kt) | Change (kt) | |
|---|---|---|---|---|
| Morocco | 311.9 | 456.6 | +144.7 | ██████████ |
| Chile | 20.4 | 173.7 | +153.3 | ████░░░░░░ |
| Norway | 91.1 | 169.4 | +78.3 | ████░░░░░░ |
| Belgium | 86.6 | 123.1 | +36.5 | ███░░░░░░░ |
| Mexico | 53.2 | 79.8 | +26.6 | ██░░░░░░░░ |
| United Kingdom | 85.5 | 59.5 | −26.0 | █░░░░░░░░░ |
| Germany, Bulgaria, Netherlands | 183.8 | 54.2 | −129.6 | █░░░░░░░░░ |
| All other | 57.3 | 102.2 | +44.9 | ██░░░░░░░░ |
| Total | 889.8 | 1,218.5 | +328.7 |
Basis: thousand metric tonnes, declared country of destination. Source: UN Comtrade, US-reported exports, HS 281410, accessed Nov 12, 2026 [1]. Bars show 2026 tonnes and scale 456.6 to ten blocks. Changes are Crop Root Zone calculations.
Morocco and Chile supplied 298,000 of the 329,000 tonnes of growth. Morocco, a phosphate producer that buys ammonia to make DAP and MAP, took 37% of everything the US exported. The six European destinations in the table took 406,000 tonnes against 447,000 a year earlier. Through August, Europe was not the pull.
That may be changing. The November Tampa contract settled at $645 a tonne CFR, up $95 from October, while northwest Europe was quoted at $710 to $730 CFR (Fertilizer Daily, Nov 5, 2026) [10]. CF Industries said 37% of Europe's ammonia capacity was offline or running at reduced rates in October (AgNavigator, Nov 5, 2026) [16]. The average exported tonne left the US at $531 FOB through August, against $315 a year earlier [1].
The new plants do not explain the whole increase, and the increase does not use up the new plants. Their combined 2.3 million tonnes a year is about 1.53 million tonnes over eight months at full rates. Exports rose 329,000 tonnes and imports fell 113,000. The trade swing of 441,000 tonnes is under 30% of prorated nameplate (Crop Root Zone calculation from [1][8]). We found no public figure for either plant's actual 2026 output, or for how much of it moved inland.
69,000 tonnes
US net imports of anhydrous ammonia, January to August 2026. The same eight months of 2025 came to 511,000 tonnes and of 2024 to 780,000. (Crop Root Zone calculation from UN Comtrade, accessed Nov 12, 2026)
Ground Truth: The ammonia leaving Texas is mostly not ammonia taken from an Iowa terminal. It comes from plants built at Gulf ports to load ships, and their arrival is the reason exports could rise by a third without retail anhydrous running short. What the export outlet changes is the price reference. A Gulf producer who can load a ship for Antwerp or Jorf Lasfar will not sell a barge or a pipeline ton for much less than that ship pays, net of freight. The fall bore that out: Tampa rose $95 in a month on European gas, with no change in Corn Belt demand, and retail anhydrous stands 19% above a year ago [13]. We expect the spring 2027 anhydrous price to follow Dutch gas and the Tampa settlement more closely than Henry Hub or the pace of fall application.
3. Urea: Canada in the spring, the Southern Hemisphere in the summer
What's new: Urea exports came in two waves with different causes. From March to May the tonnes went north to Canada. From June to August they went offshore, to countries that took almost none a year earlier.
Evidence:
| Urea exports, kt | To Canada, 2025 | To Canada, 2026 | Elsewhere, 2025 | Elsewhere, 2026 |
|---|---|---|---|---|
| Jan–Feb | 86.0† | 108.2† | 10.7† | 16.8† |
| Mar–May | 134.0† | 452.1† | 18.6† | 63.1† |
| Jun–Aug | 121.6† | 170.6† | 27.5† | 350.3† |
| Jan–Aug | 341.7† | 731.0† | 56.7† | 430.1† |
Basis: thousand metric tonnes, declared destination. Source: UN Comtrade, US-reported exports, HS 310210, accessed Nov 12, 2026 [1]. †Includes months for which Comtrade estimated tonnage from reported value; the 2026 spring figures are upper bounds, as section 1 explains. Only August 2025 and July and August 2026 are reported tonnages.
The Canadian wave has a documented cause. Argus reported that several Canadian nitrogen plants lost production over the winter, carryover was thin, and Nutrien's Carseland plant in Alberta began a turnaround in April, followed by Yara's Belle Plaine in Saskatchewan in late May. April's shipment was the largest for any month in records back to 2008 [7]. These tonnes left during the US application season. Retail urea rose from $674 a ton in mid-March to $847 in early April [19]. The US also imported 1.30 million tonnes of urea in March and 0.90 million in April [1], so some of what arrived at the Gulf replaced tonnes that had gone north by rail and truck.
The offshore wave is new. The two months with reported tonnage show where it went:
| Urea exports, Jul–Aug 2026 | kt | Jul–Aug 2025 (kt) | |
|---|---|---|---|
| Chile | 129.1 | 0.0 | ██████████ |
| Canada | 126.7 | 102.3 | ██████████ |
| South Africa | 33.0 | 0.0 | ███░░░░░░░ |
| Brazil | 32.6 | 1.1 | ███░░░░░░░ |
| New Zealand | 22.0 | 0.0 | ██░░░░░░░░ |
| Mexico | 21.0 | 3.6 | ██░░░░░░░░ |
| Colombia | 10.3 | 0.0 | █░░░░░░░░░ |
| All other | 7.7 | 5.0 | █░░░░░░░░░ |
| Total | 382.4 | 112.0 |
Basis: thousand metric tonnes, reported quantities except July 2025, which Comtrade estimated. Source: UN Comtrade, US-reported exports, HS 310210, accessed Nov 12, 2026 [1]. Bars scale 129.1 to ten blocks.
Comtrade's split of the two months shows 17,900 tonnes of re-exported foreign urea, all of it to Canada. The offshore cargoes were declared as US product [1].
The price explanation is in work we have already published. The NOLA barge averaged $389.88 a short ton in June, or $429.76 a tonne, while Brazil paid about $480 CFR, a gross gap of $50 [18]. The Strait of Hormuz had reopened only gradually after a June 15 ceasefire [9], and CF Industries says Middle East urea exports have run at roughly half their pre-war rate [16]. Southern Hemisphere buyers who normally draw on the Middle East were short, and the Gulf was the cheapest granular origin in the Atlantic. By September the Gulf was $13 to $38 above Brazil [18], and it is level with it today.
Three things we could not establish. We found no CFR quote for Chile, the largest offshore buyer. We found no new urea export terminal; these cargoes loaded at existing docks. And the declared values are low: $276 a tonne for Chile in July and $388 in August, against $568 for Canada in August [1]. That fits cargoes sold at June's prices, but we cannot confirm it. One trade report says the US was a net urea exporter in August by about 8,200 tonnes (Quantum Commodity Intelligence, Oct 9, 2026) [3]. Comtrade's copy shows exports of 209,600 tonnes against an estimated 227,900 of imports. The difference lies in Comtrade's import estimate, and on either count the two flows were close to equal.
| Urea, Nov 6, 2026 | $/tonne | $/short ton | Basis |
|---|---|---|---|
| NOLA barge, November | 475* | 424–437 | FOB barge |
| NOLA barge, December | 465* | 422 | FOB barge |
| Brazil | 460–475 | 417–431* | CFR |
| Middle East, granular | 440–450 | 399–408* | FOB |
| NOLA at which Brazil pays the freight | 433–443* | 392–401* | Brazil midpoint less $25–$35 freight |
| June 2026: NOLA average | 430* | 389.88 | FOB barge |
| June 2026: Brazil, end of month | 480 | 435* | CFR |
Source: Advanced Turf Solutions, Nov 9, 2026 (prices as of Nov 6) [12]; June figures from USDA AMS and Argus as reported in TRZ-0298 [18]. *Crop Root Zone calculation at 1.10231 short tons per tonne and range midpoints. The $25 to $35 a tonne of ocean freight from the US Gulf to Brazil is our assumption. We found no public freight quote, and NOLA barge and vessel FOB are not the same basis.
Ground Truth: The US Gulf now works in both directions for urea, and that puts a floor under the barge. In June a $50 gross gap to Brazil was enough to move about 350,000 tonnes offshore within three months. On today's Brazilian quotes, our estimate is that the same trade reopens with NOLA near $392 to $401 a short ton, $29 to $38 under the Nov 6 barge. That is about $5 to $6 an acre on 150 pounds of N. Our Nov 6 piece carried a downside case of $340 at New Orleans if the barge slid to Indian parity [19]. With an export outlet open above that level, we now think $340 requires Brazil to fall as well. A buyer waiting for a much cheaper spring barge is waiting for a price at which the product leaves the country.
4. UAN stayed home, and what that says about retail
What's new: UAN exports fell to 452,000 tonnes from 845,000. France took 185,000 tonnes in January to August 2025 and Belgium 49,000. Neither took any in 2026. Australia fell from 229,000 to 117,000 tonnes [1].
Evidence: The European stop coincides with the first year of the EU's carbon border charge, under which the European Commission raised the default emissions value for US ammonia to 3.41 tonnes of CO2e a tonne from 2 [8]. We did not find a source that attributes the UAN stop to the charge, and the EU suspended its ordinary tariffs on UAN earlier this year (Fertilizer Daily, Aug 11, 2026) [17]. The timing is suggestive only. At home, CF Industries shipped 1.99 million tons of UAN in the third quarter against 1.56 million, which its management called the largest quarterly volume this decade [14][15]. UAN imports were 1.50 million tonnes against 1.55 million [1].
Setting the trade record beside the retail survey gives this:
| Product | Retail, Oct 26–30 ($/ton) | YoY | $/lb N | Exports, Jan–Aug, YoY | Net imports, Jan–Aug 2025 (kt) | Net imports, Jan–Aug 2026 (kt) | Change |
|---|---|---|---|---|---|---|---|
| Anhydrous | 1,007 | +19% | 0.61 | +37% | 510.7 | 69.3 | −86% |
| Urea | 669 | +12% | 0.73 | +191%† | 3,885.9† | 3,265.5† | −16% |
| UAN32 | 494 | +6% | 0.77 | −47% | 702.2 | 1,045.8 | +49% |
| UAN28 | 446 | +8% | 0.80 | −47% | 702.2 | 1,045.8 | +49% |
Basis: retail as quoted to growers; trade in thousand metric tonnes of product, with UAN28 and UAN32 sharing one trade line. Source: DTN/Progressive Farmer, Nov 4, 2026 [13]; UN Comtrade, accessed Nov 12, 2026 [1]. Net imports and changes are Crop Root Zone calculations. †Includes Comtrade-estimated urea tonnages.
Ground Truth: Retail prices rose in the same order in which the trade balance tightened. Anhydrous lost almost all of its net imports and is up 19%. Urea lost a sixth and is up 12%. UAN gained net supply and is up 6% to 8%. Three products do not prove a cause, and the UAN row warns against a simple reading: UAN had the most product kept at home and is still the most expensive nitrogen per pound, at 77 to 80 cents against 61 for anhydrous. Export pull explains the year-on-year change in each product better than it explains the level. For a buyer comparing forms for spring, the product with the least export exposure is not the cheap one. It is the one whose price is least likely to be moved by a cargo sold to someone else.
5. What the export outlet means for spring 2027
What's new: As of Nov 6 the urea window is shut. The barge sits at Brazil's CFR price before freight, December barges traded at $422, and Brazil has an estimated 20% to 30% of its seasonal nitrogen still to buy [12]. The ammonia window is open and widening on European gas [10].
Evidence: Three readings follow from the record above.
First, exports limit the downside for urea more than they add to the upside. An export outlet takes product only when the Gulf is cheap. It took 350,000 tonnes when the barge was at $390, and the incentive was gone by the time the barge was at $450. It does not bid against a Corn Belt buyer at $430.
Second, the Canadian flow is the exception, because it runs in the US spring whatever the Gulf price is. An estimated 452,000 tonnes went north in March to May 2026 against 134,000 a year earlier. That flow depends on Canadian plant reliability, which no US price signal controls. We found no published 2027 turnaround schedule for the Canadian plants.
Third, anhydrous has the least room to fall. Net imports are near zero, the export price reference is European, and CF's Yazoo City complex is not expected back until the first half of 2027 [21].
Ground Truth: For spring 2027 we would treat the three products differently. On urea, the export floor near $395 at New Orleans and the $445 March futures [19] bracket a range of about $50 a short ton, or $8 an acre on 150 pounds of N. That is a narrow range to wait on, and it supports pricing the tons a grower is certain to use. On anhydrous, a buyer is short European gas whether he knows it or not, and the next Tampa settlement matters more than any domestic number. On UAN, exports are not the risk. The figure to watch is whether the 393,000 tonnes that did not go abroad through August are still in tanks in March or were sold in CF's record summer fill.
What to watch
- September and October trade. Census published September on Nov 4. Comtrade had not posted it by Nov 12 [1]. With the Gulf $13 to $38 above Brazil in September [18], offshore urea exports should have fallen sharply. If they did not, our parity estimate is too low.
- Brazil CFR against the NOLA barge. A gap back toward $50 a tonne reopens exports. At $460 to $475 against a $475 barge there is none [12].
- The December Tampa settlement and northwest European ammonia at $710 to $730 [10].
- Canadian plant schedules for the first half of 2027.
- UAN to France. A return of cargoes would show that the 2026 stop was about price and not policy.
- Full-year ammonia exports. If the last four months only match 2025's 394,000 tonnes, 2026 ends near 1.61 million tonnes, 26% above the record. That is arithmetic and not a forecast.
References
- UN Comtrade database, US-reported monthly exports and imports for HS 281410 (anhydrous ammonia), 310210 (urea), 310280 (urea-ammonium nitrate solutions) and 310230 (ammonium nitrate), world and by partner, January 2024 to August 2026, with total exports split into domestic exports and re-exports for July and August 2026, and annual totals for 2019 to 2023; public preview queries, accessed Nov 12, 2026 (September 2026 not yet posted). https://comtradeplus.un.org/ (API: https://comtradeapi.un.org/public/v1/preview/C/M/HS)
- Quantum Commodity Intelligence, "US ammonia exports hit 12-month high in August," Oct 6, 2026 (lead paragraph only; remainder behind registration). https://www.qcintel.com/ammonia/article/us-ammonia-exports-hit-12-month-high-in-august-74652.html
- Quantum Commodity Intelligence, "US shifts to net-exporter of urea in August," Oct 9, 2026 (lead paragraph only). https://www.qcintel.com/ammonia/article/us-shifts-to-net-exporter-of-urea-in-august-74877.html
- Quantum Commodity Intelligence, "US ammonia exports jump 55% on year in H1," Aug 4, 2026 (lead paragraph only). Comtrade's current record gives a first-half rise of 47%. https://www.qcintel.com/ammonia/article/us-ammonia-exports-jump-55-on-year-in-h1-70351.html
- Quantum Commodity Intelligence, "US ammonia exports hit another record high for 2025, as imports slump to new low," Feb 19, 2026 (lead paragraph only). https://www.qcintel.com/ammonia/article/us-ammonia-exports-hit-another-record-high-for-2025-as-imports-slump-to-new-low-59059.html
- Quantum Commodity Intelligence, "US September ammonia exports slow from multi-year high," Nov 5, 2026 (lead paragraph only; no September tonnage visible). https://www.qcintel.com/ammonia/article/us-september-ammonia-exports-slow-from-multi-year-high-76866.html
- World Fertilizer, "US urea exports to Canada rise to record," Jun 12, 2026 (relaying Argus Media on US Census Bureau data). https://www.worldfertilizer.com/nitrogen/12062026/us-urea-exports-to-canada-rise-to-record/
- Argus Media, "Viewpoint: Expanding US ammonia output weighs on prices," Dec 23, 2025 (Gulf Coast Ammonia and Woodside Beaumont capacities and start-up; EU default emissions value for US ammonia). https://www.argusmedia.com/en/news-and-insights/latest-market-news/2769268-viewpoint-expanding-us-ammonia-output-weighs-on-prices
- Fertilizer Daily, K. Clarksen, "Woodside Beaumont ammonia plant doubles US exports," Jul 1, 2026 (citing Woodside Energy; June 15 ceasefire and gradual reopening of the Strait of Hormuz). https://www.fertilizerdaily.com/20260701-woodside-beaumont-ammonia-plant-doubles-us-exports/
- Fertilizer Daily, K. Clarksen, on the Yara–Mosaic November ammonia contract, Nov 5, 2026 (Tampa $645 a tonne CFR, up $95; northwest Europe $710–$730 CFR). https://www.fertilizerdaily.com/20261105-yara-mosaic-november-ammonia-contract/
- US Census Bureau, International Trade API, exports by HS code endpoint, queried Nov 12, 2026 (returned no data without a registered key; not used). https://api.census.gov/data/timeseries/intltrade/exports/hs
- Advanced Turf Solutions, "U.S. Fertilizer Market Summary," Nov 9, 2026 (prices as of Nov 6, 2026; NOLA urea barge, Brazil CFR, Middle East FOB, Brazil's uncovered requirement). https://www.advancedturf.com/wp-content/uploads/2026/04/ATS-Fertilizer-Market-Update-11_9_2026.pdf
- DTN/Progressive Farmer, T. Neeley, "UAN28 Continues to Lead Fertilizer Prices Higher in October's Final Week," Nov 4, 2026 (survey Oct 26–30, 2026). https://www.dtnpf.com/agriculture/web/ag/crops/article/2026/11/04/uan28-continues-lead-fertilizer-week
- CF Industries Holdings, Inc., Q3 2026 earnings release, Exhibit 99.1 to Form 8-K, Nov 4, 2026, as reported in [21]. https://www.sec.gov/Archives/edgar/data/0001324404/000132440426000023/cf-11042026_ex991xearnings.htm
- The Motley Fool, "CF Industries (CF) Q3 2026 Earnings Call Transcript," Nov 5, 2026, as cited in [21]. Third-party transcript. https://www.fool.com/earnings/call-transcripts/2026/11/05/cf-industries-cf-q3-2026-earnings-call-transcript/
- AgNavigator, "Nitrogen supplies remain tight amid ongoing Middle East tensions, CF Industries reports in Q3 2026 earnings," Nov 5, 2026. https://www.agnavigator.com/Article/2026/11/05/nitrogen-market-update-cf-industries-reports-q3-2026-results/
- Fertilizer Daily, "UK suspends 6% tariff on UAN fertilizer, boosting U.S. exporters," Aug 11, 2026 (citing USDA Foreign Agricultural Service). https://www.fertilizerdaily.com/20260811-uk-suspends-6-tariff-on-uan-fertilizer-boosting-u-s-exporters/
- Crop Root Zone, TRZ-0298, "Brazil Paid $50 a Tonne Over NOLA for Urea in June. By September the Gulf Paid $13 to $38 More, and in Mid-October the Gap Is $2 to $12.," Oct 21, 2026 (June NOLA average and Brazil CFR; September spread).
- Crop Root Zone, TRZ-0335, "NOLA Urea Goes Into Winter at $425 a Short Ton, $45 Above Last November," Nov 6, 2026 (DTN retail urea in March and April 2026; March 2027 futures; India-parity scenario).
- Crop Root Zone, TRZ-0278, "US Urea Imports More Than Doubled in July," Oct 14, 2026.
- Crop Root Zone, TRZ-0334, "CF Industries Got $423 a Ton for Urea and $322 for UAN in the Third Quarter," Nov 6, 2026 (CF UAN volumes; Yazoo City restart).
Disclosures
Crop Root Zone is an independent publication. Nothing here is investment advice. Market calls, where included, reflect the editors' own read and are not a recommendation to buy or sell any security.
K+S Was Paid $410 a Tonne Overseas and ICL $370 Delivered in the Third Quarter, Up $24 and $17 on the Year. Nutrien's Offshore Ton Netted $253, Up $3. Freight Took Most of the Increase, and Both Sold Less Into North America.
The two offshore-facing potash sellers that reported this week were paid more per tonne than a year ago: K+S $410 overseas and €338 on muriate, ICL $370 on a delivered CIF basis. In short tons that is $336 to $372, about the $345 New Orleans barge and well under the $430 Midwest posted price. ICL's own bridge shows about $14 of its $17 gain went to ships. ICL's North American potash sales fell 16% and K+S's North American revenue share slipped to 6.1%. K+S assumes flat fourth-quarter prices and says the overseas increase it expected has not arrived, while Brazil has dropped about $34 a tonne below its third-quarter average. The 2027 China and India contracts are the next test of whether $430 holds into spring.
The two potash sellers that had not reported when we set out Nutrien's and Mosaic's third quarter have now done so, and both were paid more per tonne than a year ago. K+S, which mines in Germany and at Bethune, Saskatchewan, averaged $410.30 a tonne on its overseas sales, up from $385.90, and €338.30 a tonne on muriate of potash (MOP) across all markets, up from €322.10 (K+S, Nov 10, 2026) [1][2]. ICL, which produces at the Dead Sea and in Spain, reported $370 a tonne on a delivered CIF basis, up from $353 (ICL, Nov 11, 2026) [4]. Those figures look far above the $253 Nutrien netted on offshore tons and the $276 Mosaic realized at the mine [6][7]. Most of the gap is basis, and most of the year's increase went to freight. ICL's own profit bridge shows a $17 million price gain against $15 million of added marine transport cost. Neither company is guiding to a higher fourth quarter. K+S assumes prices stay flat and says the overseas increase behind the top of its earnings range "has not materialized so far" [1]. This piece sets out what each was paid, why the four producers' numbers differ, where the tons went, what has happened to offshore prices since Sept 30, and what the 2027 contracts mean for the $430 Midwest posted price.
1. What K+S and ICL were paid
What's new: K+S's Agriculture segment took in €642.0 million in the third quarter, up 4.3%, on 1.77 million tonnes, down 1.4%. Excluding trade goods, volume was 1.61 million tonnes against 1.74 million and the average price was €355.60 a tonne against €338.40 [1]. Group EBITDA slipped to €107.6 million from €110.7 million. K+S attributed that to higher cost of sales and to the Bethune maintenance shutdown, which fell entirely in the third quarter this year [1]. ICL's potash segment sold 1,090,000 tonnes against 1,046,000. Segment sales rose to $469 million from $453 million, and segment EBITDA fell to $157 million from $169 million [4].
Evidence: Each company's price lines, in the currency and on the basis it reports:
| Q3 price line | 2026 | 2025 | YoY | Q2 2026 | ≈ $/short ton, 2026 | Volume, 2026 (Mt) | Basis |
|---|---|---|---|---|---|---|---|
| K+S, overseas | $410.30 | $385.90 | +6.3%* | $401.70 | 372* | 1.12 | Revenue per tonne, MOP and specialties, incl. trade goods |
| K+S, Europe | €375.00 | €361.10 | +3.8%* | €364.50 | 391* | 0.64 | Revenue per tonne, MOP and specialties, incl. trade goods |
| K+S, MOP | €338.30 | €322.10 | +5.0%* | €329.40 | 353* | 0.99 | Revenue per tonne, all regions |
| K+S, fertilizer specialties | €395.10 | €375.20 | +5.3%* | €387.40 | 412* | 0.78 | Revenue per tonne, all regions |
| K+S, segment excl. trade goods | €355.60 | €338.40 | +5.1%* | €342.80 | 371* | 1.61 | Revenue per tonne |
| ICL, potash | $370 | $353 | +4.8% | $376 | 336* | 1.09 | CIF, $/tonne |
Source: K+S, Q3/2026 Quarterly Report and Facts & Figures, Nov 10, 2026 [1][2]; ICL, Q3 2026 results, Form 6-K, Nov 11, 2026 [4]; ICL's Q2 price from Fertilizer Daily, Aug 13, 2026 [5]. *Crop Root Zone calculation. Euro figures are converted at K+S's stated third-quarter rate of $1.15 per euro, and tonnes at 1.10231 short tons per tonne. K+S's regional and product lines are two cuts of the same 1.77 million tonnes.
Three things in the table matter for a North American reader. First, K+S's overseas price has risen in each of the last two quarters, from $375.20 in the first quarter to $410.30 [2]. Second, ICL's price fell $6 from the second quarter. It is the only line in the table that went down sequentially. Third, K+S's volume moved toward the sea. Overseas tonnes rose to 1.12 million from 1.03 million while European tonnes fell to 0.64 million from 0.77 million. K+S said low water on inland waterways restricted European shipping and it placed a larger share overseas [1].
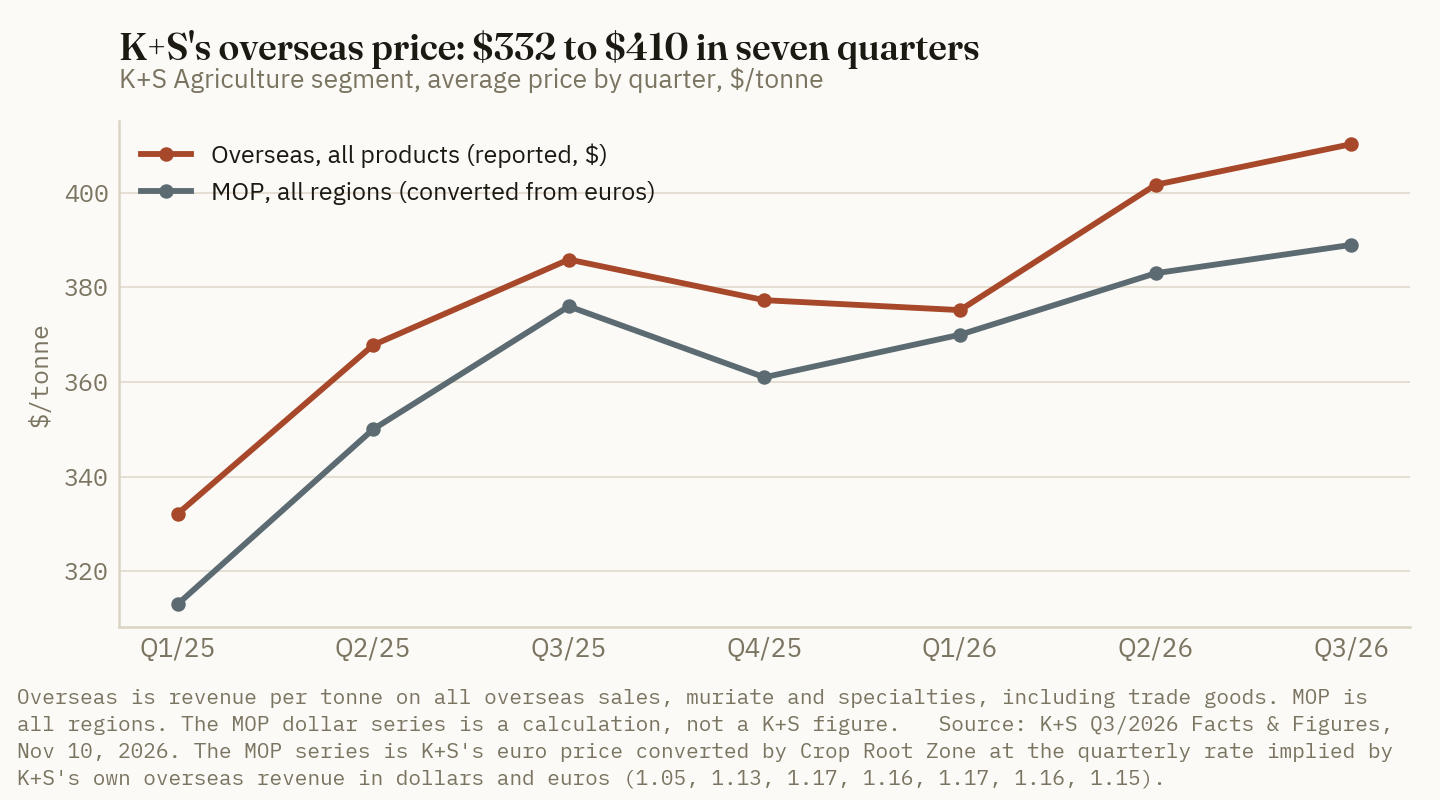
Costs took the gain at both companies. ICL publishes the bridge:
| ICL potash operating income, Q3 | $ million | ≈ $/tonne sold* |
|---|---|---|
| Q3 2025 | 104 | 99 |
| Price | +17 | +16 |
| Quantity | +6 | — |
| Marine transportation | −15 | −14 |
| Exchange rates (stronger shekel) | −12 | −11 |
| Energy (water fees, electricity) | −9 | −8 |
| Operating and other | +3 | +3 |
| Q3 2026 | 94 | 86 |
Source: ICL, Form 6-K, Nov 11, 2026 [4]. *Crop Root Zone calculation on 1,090,000 tonnes sold (1,046,000 for the 2025 row). The segment includes some non-potash sales, so the per-tonne column is approximate.
$17 up, $14 to the ship
ICL's delivered potash price rose $17 a tonne on the year. Its added marine transport cost was about $14 a tonne sold. (Crop Root Zone calculation from ICL, Form 6-K, Nov 11, 2026)
Ground Truth: A delivered price that rises because freight rose is not a price increase the mine keeps, and it is not evidence of a tighter market at the mine gate. After the ship was paid, ICL kept roughly $2 to $3 of its $17, before the shekel and energy took more. Nutrien's offshore ton, which is reported net of freight, rose $3, and Mosaic's mine-gate ton rose $5 [6][7]. The four producers are telling the same story on four different bases: offshore buyers paid $17 to $24 a tonne more than a year ago, and $3 to $5 of it reached the producer. A reader who sees "$410" next to Nutrien's "$253" and concludes that the offshore market is running away from North America has compared a delivered number with a netback.
2. One quarter, four bases
What's new: With K+S and ICL in, every large seller into the Western Hemisphere has now reported the same quarter. Converted to short tons, the offshore sellers' prices sit between the two Canadian producers' netbacks and the Midwest posted price, and close to the New Orleans barge.
Evidence: Each price in $/short ton and, where the product is 0-0-60, in cents a pound of K2O:
| Price | $/short ton | ¢/lb K2O | Year ago, $/st | Basis | |
|---|---|---|---|---|---|
| Nutrien, offshore, Q3 | 230* | 19.1* | 227* | Net selling price, net of freight | █████░░░░░ |
| Mosaic MOP, Q3 | 250* | 20.9* | 246* | FOB mine, all markets | █████░░░░░ |
| Nutrien, North America, Q3 | 281* | 23.4* | 289* | Net selling price, net of freight | ██████░░░░ |
| ICL, Q3 | 336* | 28.0* | 320* | CIF, all markets | ███████░░░ |
| NOLA barge, Nov 6 | 340–350 | 28.8* | 325–330 | FOB barge | ███████░░░ |
| K+S MOP, Q3 | 353* | 29.4* | 341* | Revenue per tonne, all markets | ███████░░░ |
| K+S overseas, Q3 | 372* | n/a | 350* | Revenue per tonne, MOP and specialties | ███████░░░ |
| Intrepid, Q3 | 394 | 32.8* | 381 | Net realized | ████████░░ |
| Corn Belt warehouse, Nov 6 | 395–435 | 34.6* | n/a | FOB warehouse | ████████░░ |
| Nutrien posted Midwest | 430 | 35.8* | n/a | FOB Midwest terminal | ████████░░ |
| DTN national retail, Oct 26–30 | 510 | 42.5* | 487 | As quoted to growers | ██████████ |
Source: K+S, Nov 10, 2026 [1][2]; ICL, Nov 11, 2026 [4]; Nutrien, Nov 4, 2026 [6]; Mosaic, Nov 3, 2026 [7]; Intrepid Potash, Nov 3, 2026 [8]; Advanced Turf Solutions, Nov 9, 2026 (prices as of Nov 6) [10]; DTN/Progressive Farmer, Nov 4, 2026 [9]. *Crop Root Zone calculation; ranges at midpoints; bars scale $510 to ten blocks. K+S's year-ago MOP figure converts €322.10 at $1.168 per euro, a rate we derived from K+S's own third-quarter 2025 overseas revenue in dollars and euros. No K2O figure is given for K+S overseas because that line includes lower-analysis specialties. The Nutrien, Mosaic, Intrepid and DTN rows are as reported in our Nov 9 piece [15].
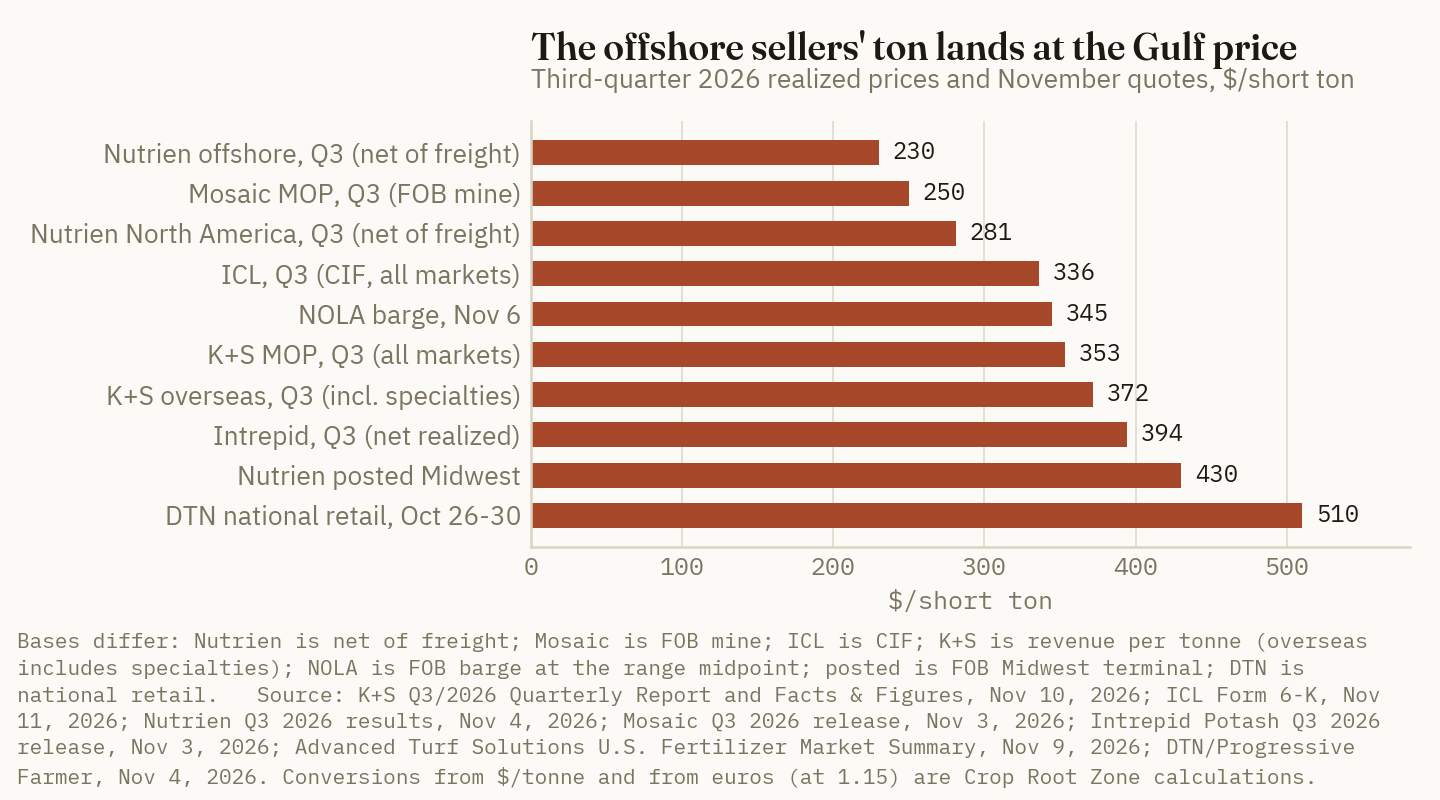
The bases need stating because the companies do not state them the same way. Nutrien reports net of freight, transportation and distribution. Mosaic reports FOB mine. ICL labels its figure CIF, which in standard trade terms means cost, insurance and freight to the destination port; its filing does not define the term further [4]. K+S reports revenue divided by tonnes and does not describe the result as a mine-gate price. Its outlook lists "current spot freight rates from Vancouver" as a cost assumption [1], which indicates that ocean freight sits in its costs and not as a deduction from the price. That reading is our inference.
On that reading, the distance between a delivered offshore ton and a Canadian netback was about $115 a tonne in the quarter. ICL's $370 is $117 above Nutrien's offshore $253, and K+S's muriate at about $389 is $113 above Mosaic's $276 (Crop Root Zone calculation from [2][4][6][7]). That distance covers rail to port, port handling, ocean freight, insurance and the marketing margin. Neither company publishes the split.
The comparison that matters in the Corn Belt is with the Gulf. ICL's worldwide delivered average of $336 a short ton is $9 below the midpoint of the New Orleans barge, and K+S's muriate average is $8 above it. A barge loaded at New Orleans and a cargo landed at a foreign port are not the same basis, but they are close. In the third quarter the Gulf paid about what the rest of the world paid. It did not pay enough more to pull tons toward it, and the next section shows that the tons went elsewhere.
3. Both sold less into North America
What's new: ICL's potash segment sales in North America fell to $52 million from $62 million in the quarter, and to $120 million from $145 million over nine months. Its sales in Asia rose 32% in the quarter and 59% over nine months [4]. North America's share of K+S's group revenue fell to 6.1% from 7.1% over nine months, and Asia's rose to 14.9% from 11.6% [1].
Evidence:
| Region | ICL potash segment sales, Q3 2026 ($M) | Q3 2025 ($M) | Change | ICL, 9M 2026 ($M) | 9M 2025 ($M) | K+S group revenue, 9M 2026 (€M)* | 9M 2025 (€M)* |
|---|---|---|---|---|---|---|---|
| North America | 52 | 62 | −16%* | 120 | 145 | 181 | 193 |
| South America | 124 | 101 | +23%* | 403 | 314 | 345 | 358 |
| Asia | 135 | 102 | +32%* | 351 | 221 | 443 | 315 |
| Europe | 94 | 128 | −27%* | 387 | 401 | 1,736 | 1,651 |
| Rest of world | 64 | 60 | +7%* | 179 | 160 | 268 | 198 |
| Total | 469 | 453 | +4%* | 1,440 | 1,241 | 2,973 | 2,715 |
Source: ICL, Form 6-K, Nov 11, 2026 [4]; K+S, Q3/2026 Quarterly Report, Nov 10, 2026 [1]. *Crop Root Zone calculation. K+S publishes regional shares of group revenue (58.4%, 14.9%, 11.6%, 9.0% and 6.1% for 2026), and the euro figures apply those shares to group revenue of €2,973.1 million and €2,715.0 million. K+S's "rest of world" is its Africa and Oceania line. K+S group revenue includes its salt and industrial business, so the K+S columns are not potash alone.
ICL said in its filing that the quarter's higher volume came from India and Brazil and was partly offset by lower volume in the US and Europe. Over nine months the growth came from China, Brazil and India [4]. If all $52 million of ICL's North American segment sales were potash at its average price, they would be about 140,000 tonnes. That is an upper bound, because the segment includes other products, and it is our estimate. Nutrien alone sold 1.59 million tonnes in North America in the quarter [6].
K+S's position is less obvious. It runs a mine in Saskatchewan that its chief executive described on the results call as producing at an annual rate of about 2.3 million tonnes (K+S call via Investing.com, Nov 10, 2026) [3]. That is nearly a third of the 7.4 to 7.6 million tonnes the group expects to sell this year. North America is 6% of group revenue. The Vancouver freight assumption and the regional shares both indicate that most Bethune output leaves through the west coast for Asia and South America. We could not find a K+S figure for Bethune's sales by destination. K+S said Bethune adds 100,000 to 150,000 tonnes of output a year and should reach 2.4 to 2.5 million tonnes by the end of 2027 [3].
Ground Truth: For the US buyer, K+S and ICL are marginal suppliers, and in 2026 they became more marginal by choice. Asia paid more and took more. That has two consequences. The domestic price this fall was set by two Canadian producers and a posted list with little offshore competition in it, which is why a $45 posted increase held. And the volume that could change this is small and visible. One market summary reported this week that the first Belarusian potash vessel to reach the US in four years, about 30,000 tonnes, has cleared customs at New Orleans (Advanced Turf Solutions, Nov 9, 2026) [10]. That is one cargo and one source, and we have not confirmed it elsewhere. It is still the first sign of offshore tons responding to the Gulf's premium over Brazil.
4. Since Sept 30: softer offshore, heavier volume
What's new: The offshore benchmarks that carried K+S and ICL through the third quarter have come off in Brazil and held in Asia. Both companies, and Mosaic, are guiding to large fourth-quarter volumes at flat or lower prices.
Evidence: ICL's filing prints the quarter's average benchmarks. The most recent quotes we have are from the end of October:
| Benchmark | Q3 2026 average | Q3 2025 average | Q2 2026 average | Oct 30, 2026 quote | Quote vs. Q3 average | Basis |
|---|---|---|---|---|---|---|
| Brazil, granular | $391 | $360 | $402 | $350–$365 | −$34* | CFR, $/tonne |
| Southeast Asia, standard | $402 | $370 | $392 | $387–$416 | 0* | CFR, $/tonne |
| Northwest Europe, granular | €361 | €365 | €360 | n/a | n/a | CIF, €/tonne |
| NOLA barge | n/a | n/a | n/a | $340–$350/st | n/a | FOB barge; about $375–$386/tonne* |
Source: quarterly averages from ICL, Form 6-K, Nov 11, 2026 [4]; Oct 30 quotes from Advanced Turf Solutions, Nov 2, 2026, as cited in our Nov 9 piece [11][15]; the barge was unchanged on Nov 6 [10]. *Crop Root Zone calculation at range midpoints, rounded. The quarterly averages and the October quotes come from different price reporters, so the difference shows direction and rough size only.
Brazil is the market to watch. ICL's table shows Brazilian imports of 3.6 million tonnes in the third quarter, down from 4.0 million a year earlier and 4.4 million in the second quarter. China's imports were 4.0 million tonnes against 2.4 million [4]. K+S's management said on its call that Brazilian imports were up 20% in October, that port stocks there are higher, and that Chinese port stocks are about 4.5 million tonnes and easing [3]. Those call figures come from a third-party transcript and we have not checked them against a second source.
What each company said about the fourth quarter:
| Company | Q4 2026 price | Q4 2026 volume | Year-ago Q4 volume | Stated reason |
|---|---|---|---|---|
| K+S | "On average stable" against current levels | 1.91–2.11 Mt* | 1.86 Mt* | Supply constraints support the low end; overseas increase "has not materialized so far" |
| ICL | No price guidance | 1.14–1.34 Mt* | 1.20 Mt* | Reiterated 4.5–4.7 Mt for the year |
| Mosaic | $255–$275/t FOB mine, against $276 in Q3 | 2.3–2.6 Mt | n/a | Could not build inventory in Q3 |
| Nutrien | No price guidance | n/a | n/a | Raised 2026 sales to 14.3–14.8 Mt |
Source: K+S, Nov 10, 2026 [1][2]; ICL, Nov 11, 2026 [4]; Mosaic, Nov 3, 2026 [7]; Nutrien, Nov 4, 2026 [6]. *Crop Root Zone calculation: full-year guidance less nine-month sales. K+S's figures exclude trade goods (nine months 5.49 Mt; Q4 2025 1.86 Mt). K+S's management put its own fourth quarter at about 1.9 million tonnes on the call [3].
K+S moved both ends of its 2026 EBITDA range, to €700 million to €750 million from €680 million to €760 million. It raised the bottom because the weak-demand case "is losing relevance against the backdrop of supply-side constraints in the global potash market." It lowered the top because the overseas price increase behind that scenario has not arrived [1]. On the call, management attributed the supply constraint to repairs, maintenance and logistics problems in Russia and Belarus and said it expects a gradual return to normal in 2027. It also said it expects good spring demand [3].
Ground Truth: The volume side of the outlook is firm and the price side is not. K+S is guiding to a fourth-quarter volume above last year's, ICL's range straddles last year's, and Mosaic expects to sell more than it did in the third quarter. None is guiding to a higher price, and the one benchmark that moved since September moved down. K+S's revised range is the clearest statement of this: demand will be there, and the price rise will not. For a US buyer that argues against two opposite fears. Offshore producers are not about to pull the domestic price higher, because their own realized prices have stopped rising. They are also not about to push it lower this winter, because their volume is committed to Asia and Brazil and the Russian and Belarusian tons that would fill the gap are constrained. We read the $430 posted price as a level the producers can hold but cannot raise.
5. The 2027 contracts and the spring ton
What's new: The two annual contracts that set the floor of the offshore market are both due. China's 2026 contract was signed in November 2025. India's runs to the end of December [12].
Evidence:
| Reference price | $/tonne | Terms | Date |
|---|---|---|---|
| China, 2026 contract | 348 | CFR, standard MOP | Signed Nov 2025 |
| ICL to China, 2026 | 348 | CIFFO; 750,000 t plus an option on 330,000 t | Announced Dec 23, 2025 |
| India, 2026 contract (BPC and IPL) | 383 | CFR, 180 days' credit, deliveries to end of December | May 18, 2026 |
| Southeast Asia spot, Q3 average | 402 | CFR, standard | Q3 2026 |
| Brazil spot, Q3 average | 391 | CFR, granular | Q3 2026 |
| Brazil spot, Oct 30 | 350–365 | CFR, granular | Oct 30, 2026 |
Source: Argus Media, May 18, 2026 [12]; S&P Capital IQ via MarketScreener, Dec 23, 2025 [13]; ICL, Nov 11, 2026 [4]; Advanced Turf Solutions, Nov 2, 2026, as cited in [15]. Argus reported the India price as stated by the seller; the buyer had not confirmed it at the time.
Argus noted in May that India's $35 premium over China was well above the $8 average of 2016 to 2025 [12]. That leaves China's $348 as the low outlier in the table. Southeast Asian spot averaged $54 above it in the third quarter. Mosaic said last week that China's 2027 talks have started earlier than usual and that Chinese imports have already passed last year's total [14][15]. Sellers therefore have a case for a higher China number. Brazil works against them. At $350 to $365 it is now within $2 to $17 of the China contract, and a buyer's negotiator will point to it.
We did not find a published offer, bid or settlement for either 2027 contract as of Nov 11. Our estimate is a China settlement in a range of about $355 to $375 a tonne. That is an estimate and not a reported price. Its reasoning is that the seller's supply argument is real, the 2026 India contract shows buyers will pay more, and Brazil caps how much more.
For the domestic ton, the arithmetic from our Nov 9 piece still applies: a corn-soybean rotation removing 130 pounds of K2O changes by about $1.09 an acre for every $10 a short ton [15]. The gap between today's posted $430 and the $345 barge is $85 a short ton, or about $9 an acre over the two years. That is the most the Gulf could take off the potash bill if barge-priced tons reached every Midwest terminal, which they will not this winter.
Ground Truth: Three dated events will show which way spring goes, and a buyer does not need to guess before they happen. A China settlement above $365 would put the offshore floor near the Gulf price and remove the import threat to the posted price; we would then expect a 2027 winter fill at or near $430 and the $520 to $540 spring retail range from our Nov 9 piece to hold. A settlement at or near $348, with Brazil still in the $350s, would leave New Orleans roughly $23 to $32 a tonne above the two largest offshore markets, and more cargoes like this week's would follow once the river reopens. In that case a winter fill below $430 is likely and fall-priced tons would not beat spring. By our estimate the difference between those outcomes is $20 to $30 a short ton, or about $2 to $3 an acre on a rotation. That is small enough that agronomy should decide the timing of application. It matters more to a retailer deciding how many replacement tons to buy at $430 before January.
What to watch
- The 2027 China contract. Price and date. The 2026 contract was signed in November 2025 at $348 [12].
- India's renewal. The $383 contract's delivery window closes at the end of December [12].
- Brazil CFR. A move back toward $391, the third-quarter average, would support K+S's flat-price assumption. A move below $350 would undercut it.
- Nutrien's winter fill. The 2026 program was announced on Jan 8 at $355 [15].
- Further offshore arrivals at New Orleans. This week's Belarusian cargo is reported by one source [10]. A second and third would change the Gulf's balance for spring.
- ICL's call. ICL's results call was scheduled for Nov 11 and no transcript was available when this was written. Its filing gives no fourth-quarter price view [4].
- K+S's 2027 guidance, due in March [3], and its fourth-quarter overseas price against $410.
References
- K+S Aktiengesellschaft, Q3/2026 Quarterly Report, Nov 10, 2026 (Agriculture segment revenues, volumes and prices by region and product; revenue by region; 2026 outlook and assumptions; third-quarter exchange rate of 1.15). https://www.kpluss.com/.downloads/ir/2026/quartalsmitteilung-q3-2026/kpluss-quarterly-report-q3-2026.pdf
- K+S Aktiengesellschaft, Q3/2026 Facts & Figures, Nov 10, 2026 (quarterly table from Q1/2025 to Q3/2026: overseas price in $/tonne, Europe, MOP and specialties prices in €/tonne, volumes, revenues). https://www.kpluss.com/.downloads/ir/2026/quartalsmitteilung-q3-2026/kpluss-facts-and-figures-q3-2026.pdf
- Investing.com, "Earnings call transcript: K+S lifts 2026 outlook as Q3 profit slips," Nov 10, 2026. Third-party transcript and summary; used for Bethune's production rate and ramp-up, the fourth-quarter volume, Brazilian and Chinese stocks, and the 2027 remarks. https://www.investing.com/news/transcripts/earnings-call-transcript-ks-lifts-2026-outlook-as-q3-profit-slips-93CH-5014471
- ICL Group Ltd., Q3 2026 results, Form 6-K, Nov 11, 2026 (potash segment sales, operating income bridge, EBITDA, CIF price, production and sales volumes, sales by region, benchmark prices and imports, 2026 guidance). https://www.sec.gov/Archives/edgar/data/0000941221/000117891326005126/zk2636351.htm
- Fertilizer Daily, "ICL Q2 2026 operating income at three-year high," Aug 13, 2026 (second-quarter potash price of $376 a tonne CIF). https://www.fertilizerdaily.com/20260813-icl-q2-2026-operating-income-3-year-high/
- Nutrien Ltd., Q3 2026 results, Exhibit 99.1 to Form 6-K, Nov 4, 2026, as reported in [15]. https://www.sec.gov/Archives/edgar/data/0001725964/000119312526447554/d139721dex991.htm
- The Mosaic Company, Q3 2026 earnings release, Exhibit 99.1 to Form 8-K, Nov 3, 2026 (MOP price FOB mine; fourth-quarter price and volume guidance), as reported in [15]. https://www.sec.gov/Archives/edgar/data/0001285785/000128578526000139/pressreleaseq32026-ex991.htm
- Intrepid Potash, Inc., Q3 2026 earnings release, Exhibit 99.1 to Form 8-K, Nov 3, 2026, as reported in [15]. https://www.sec.gov/Archives/edgar/data/0001421461/000142146126000026/ex991q32026pressrelease.htm
- DTN/Progressive Farmer, T. Neeley, "UAN28 Continues to Lead Fertilizer Prices Higher in October's Final Week," Nov 4, 2026 (survey Oct 26–30, 2026). https://www.dtnpf.com/agriculture/web/ag/crops/article/2026/11/04/uan28-continues-lead-fertilizer-week
- Advanced Turf Solutions, "U.S. Fertilizer Market Summary," Nov 9, 2026 (prices as of Nov 6, 2026; NOLA barge, Corn Belt warehouse, Nutrien posted price, Belarusian vessel). https://www.advancedturf.com/wp-content/uploads/2026/04/ATS-Fertilizer-Market-Update-11_9_2026.pdf
- Advanced Turf Solutions, "U.S. Fertilizer Market Summary," Nov 2, 2026 (prices as of Oct 30, 2026; Brazil and Southeast Asia CFR), as cited in [15]. https://www.advancedturf.com/wp-content/uploads/2026/04/ATS-Fertilizer-Market-Update-11_2_2026.pdf
- Argus Media, "BPC, IPL set new India MOP contract at $383/t cfr," May 18, 2026 (India and China 2026 contract prices and terms; India's historical premium). https://www.argusmedia.com/es/news-and-insights/latest-market-news/2828100-bpc-ipl-set-new-india-mop-contract-at-383-t-cfr
- MarketScreener (S&P Capital IQ), "ICL Group Ltd Signs Agreements for the Supply of Potash to Customers in China During 2026," Dec 23, 2025. https://www.marketscreener.com/news/icl-group-ltd-signs-agreements-for-the-supply-of-potash-to-customers-in-china-during-2026-ce7e59dbd089f326
- The Motley Fool, Mosaic third-quarter 2026 earnings call transcript, Nov 4, 2026, as cited in [15]. Third-party transcript. https://www.fool.com/earnings/call-transcripts/2026/11/04/mosaic-mos-q3-2026-earnings-call-transcript/
- Crop Root Zone, TRZ-0338, "Nutrien Was Paid $281 a Ton for North American Potash This Summer, $8 Less Than a Year Ago. Its Posted Price Has Since Risen $45 and Retail $16. A 2027 Corn-Soy Rotation's Potash Costs $55 an Acre, $2.50 More Than Last Fall.," Nov 9, 2026 (source here for the Nutrien, Mosaic, Intrepid and DTN figures, the Oct 30 offshore quotes, the 2026 winter fill and the per-acre arithmetic).
Disclosures
Crop Root Zone is an independent publication. Nothing here is investment advice. Market calls, where included, reflect the editors' own read and are not a recommendation to buy or sell any security.
Tampa Sulfur Settled at $615 for the Fourth Quarter, $90 Under the Record and Still Double Last Year. It Takes $33 Off a Ton of DAP, but Not Until Spring. A Corn Acre's Phosphate Now Carries $15 of Sulfur the Crop Never Gets.
Mosaic, Itafos, AdvanSix and a distributor market summary all put the fourth-quarter Tampa molten sulfur contract at $615 a long ton, down from $705 and up from $310 a year ago. On our ratios the cut is worth $33 a short ton of DAP, $37 of MAP and $20 of ammonium sulfate, and reaches producer costs in the first quarter of 2027. Middle East and Chinese spot sulfur kept falling into November, so Tampa's discount to the world price has narrowed. On a corn acre, the sulfur consumed to make 64 lb of P2O5 as DAP costs about $15.47 at the new contract, against $4.12 for the 15 lb of sulfur the crop actually uses. Bought as ammonium sulfate in Oklahoma, that 15 lb costs $8.78 net of its nitrogen, and the net sulfur price rose 4 cents a pound in the fortnight the contract fell.
The fourth-quarter contract for molten sulfur delivered into Tampa settled at $615 a long ton. That is $90 below the third quarter's record $705 and almost exactly double the $310 of a year ago. On October 12 we reported that no settlement was public twelve days into the quarter (Crop Root Zone, TRZ-0270, Oct 12, 2026) [14]. The number has since come out from four separate places. Mosaic's third-quarter release says it "settled a sulfur supply contract with U.S. Gulf Coast refiners at $615 per long ton" (Mosaic, Nov 3, 2026) [1]. Itafos says the contract "decreased and closed at $615" during October (Itafos, Nov 4, 2026) [3]. AdvanSix's chief executive gave the same figure on the company's call (AdvanSix call via Investing.com, Nov 4, 2026) [5], and a distributor market summary prints it as $615/lt CFR (Advanced Turf Solutions, Nov 2, 2026) [7]. None of these is the Argus or Green Markets print itself. Both services keep their fourth-quarter Tampa reports behind paywalls, and we did not get past either. This piece sets out what the settlement changes and when. It covers the ton of phosphate and of ammonium sulfate, the world sulfur market the contract now has to keep up with, and the sulfur bill on a corn acre.
1. The settlement and the lag behind it
What's new: The contract fell for the first time since the Strait of Hormuz disruption began in late February. It fell $90, more than the cut of at least $50 the trade was reported to expect in early October [14]. It landed near the bottom of the $605 to $705 range we published on October 12.
Evidence: Four of the five settlements shown below are dated trade prints. The quarterly cost Mosaic actually paid, from its performance data, runs about a quarter behind the contract.
| Quarter | Tampa contract, $/lt delivered | Change on quarter | Mosaic realized sulfur, $/lt | |
|---|---|---|---|---|
| Q4 2025 | 310 | — | 306 | ████░░░░░░ |
| Q1 2026 | 495.69 | +185.69 | 379 | ███████░░░ |
| Q2 2026 | 655 | +159.31 | 522 | █████████░ |
| Q3 2026 | 705 | +50 | 715 | ██████████ |
| Q4 2026 | 615 | −90 | Due Feb 2027 | █████████░ |
Source: Argus Media, Dec 30, 2025 (Q4 2025 baseline) [9]; Green Markets, Mar 6, 2026 (Q1 2026, quoted CFR) [10]; Argus Media, Jul 13, 2026 (Q2 and Q3 2026) [8]; Mosaic, Nov 3, 2026 (Q4 2026 settlement) [1]; Mosaic, Q3 2026 performance data, Nov 3, 2026 (realized cost) [2]. Bars scale the contract, $705 to ten blocks. Changes are Crop Root Zone arithmetic.
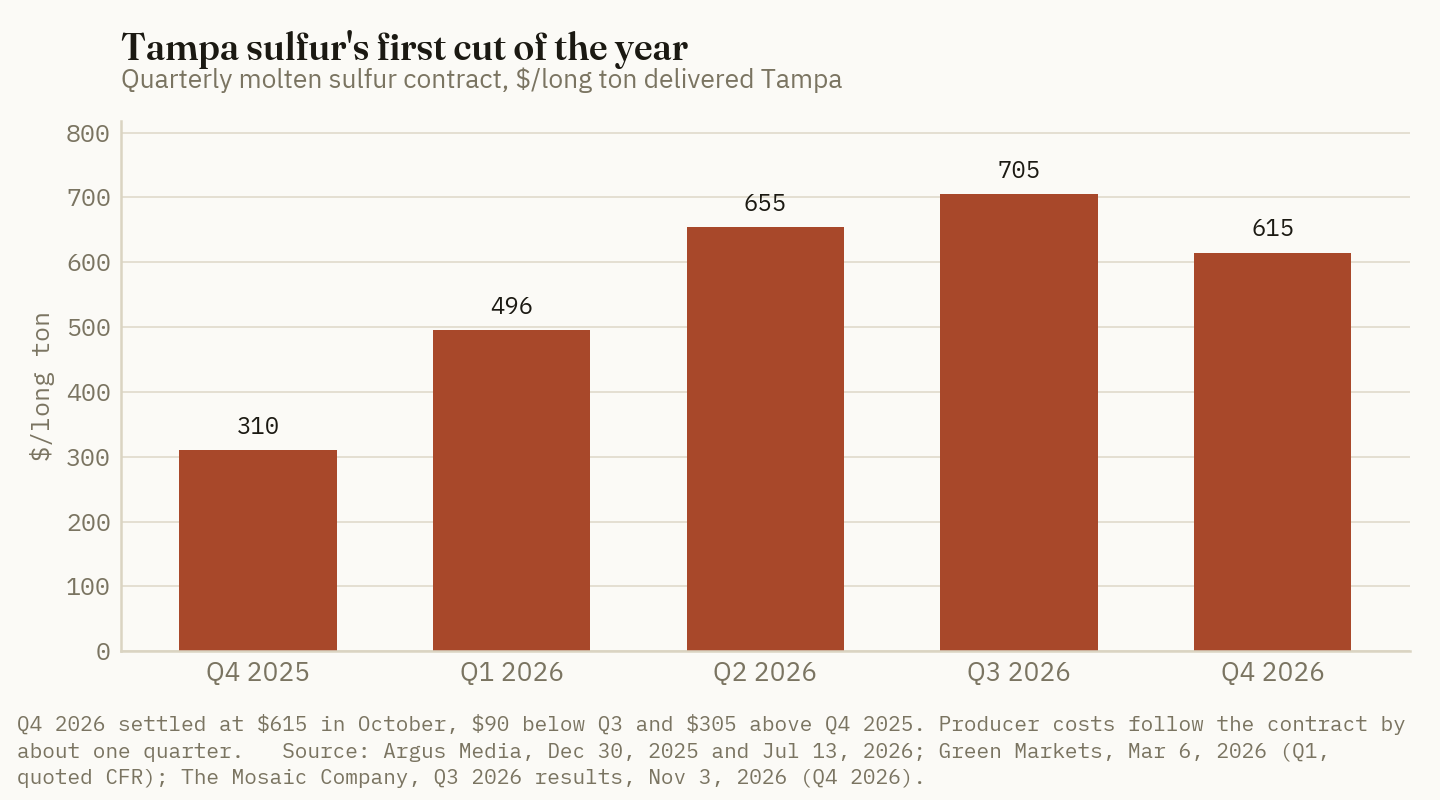
Mosaic's realized sulfur cost tells you when the settlement reaches anyone's costs. It paid $379 in the first quarter against a $495.69 contract, $522 in the second against $655, and $715 in the third against $705 [2]. The company's own explanation is a "two- to three-month inventory cycle." It says fourth-quarter stripping margins "are expected to decline further" as sulfur bought in the third quarter flows through cost of goods sold [1]. The $615 contract therefore shows up mainly in first-quarter 2027 results. Mosaic's fourth-quarter realized cost, due in February, should sit nearer $705 than $615. That is our reading of the pattern, not company guidance.
Sulfur is also a large cost for the company that sells the most ammonium sulfate. AdvanSix makes ammonium sulfate as a byproduct of caprolactam, and it buys sulfur to make the sulfuric acid that process needs. Its chief executive said each $100 a long ton change in sulfur is worth about $35 million a year in cost [5]. That implies about 350,000 long tons a year of sulfur bought (Crop Root Zone arithmetic), and about $31.5 million a year of relief from the $90 cut. Raw materials were the company's largest earnings headwind in the third quarter, at $65 million, driven mainly by sulfur and benzene (AdvanSix, Nov 4, 2026) [4][6].
Sulfuric acid is the other path from sulfur to a fertilizer plant, and the public record on it is thinner. Itafos blamed "materially higher sulfur and sulfuric acid costs" at its Conda, Idaho and Arraias, Brazil operations for a fall in adjusted EBITDA to $14.4 million from $48.9 million. A sulfuric acid plant outage at Conda in September cut its P2O5 output to 84,267 tonnes from 91,219 [3]. In May, Itafos and Rio Tinto amended the acid contract that supplies about 60% of Conda's needs. From May 1 its reference moved from the Vancouver sulfur index to Tampa, at a revised price running to the end of 2029 (AgriBusiness Global, May 15, 2026) [17]. On our reading, the Tampa cut should therefore reach at least one western acid buyer's price. The article does not give the formula. We could not find a dated public US Gulf sulfuric acid assessment for October or November. The trade services that publish one are subscription-only.
2. Tampa is no longer far below the world price
What's new: Spot sulfur outside the United States kept falling after the Tampa contract was set. The contract's discount to the world price is smaller than it was a month ago.
Evidence: On October 12 the $705 contract, about $694 a tonne, sat $126 under Kuwait's October post of $820 fob and $271 under Chinese granular at $965 cfr [14]. The table puts today's $615 contract next to the latest prices we could find.
| Sulfur reference | Date | $/tonne | Tampa Q4 ($605/t) below it by | Basis |
|---|---|---|---|---|
| Tampa Q4 contract | Mid-Oct | 605* | — | Molten, delivered Tampa ($615/lt) |
| Middle East spot, excl. Iran | Nov 5 | 680–740 | 75–135* | Solid, fob |
| Middle East daily marker, Nov to date | Nov 5 | 725 | 120* | Solid, fob; Oct average 793 |
| US Gulf | Nov 5 | 770–780 | 165–175* | Solid, fob |
| US Gulf prills | Oct 30 | 800–830 | 195–225* | Solid, fob |
| Vancouver | Nov 5 | 770–780 | 165–175* | Solid, fob |
| China granular | Nov 5 | 800–810 | 195–205* | Solid, cfr |
| Kuwait October post | Oct 5 | 820 | 215* | Solid, fob; November post not verified |
Source: ChemPortal sulphur market page, assessed Nov 5, 2026 (aggregator; it does not name the price-reporting agency behind its ranges) [11]; Advanced Turf Solutions, Nov 2, 2026 (US Gulf prills) [7]; Argus Media, Oct 5, 2026 (Kuwait) [12]; Mosaic, Nov 3, 2026 [1]. *Crop Root Zone conversions at 1.01605 tonnes per long ton. Fob, cfr and delivered prices are not like for like, and molten and solid sulfur are different products. The comparison shows direction, not an arbitrage.
Chinese domestic sulfur fell faster still. Trading Economics put it at 5,151.75 yuan a tonne today. That is down 29.6% in a month and up 45.5% on the year (Trading Economics, Nov 10, 2026) [13]. On October 12 the same series stood at 7,319 [14]. The reason has not changed since October. A French radio report relayed on November 9 put world sulfur at $700 to $800 a tonne, against a summer peak of $1,200 to $1,300. It said supply from the Gulf stays restricted until shipping through Hormuz stabilizes (World Today News, relaying RFI, Nov 9, 2026) [15]. Prices are falling because buyers have stepped back, not because the lost tonnes have returned.
We could not verify the November posted prices from QatarEnergy, Kuwait's KPC or Adnoc. The Argus announcements we found run through October. The aggregator page above lists a Qatar price of $735 and a Kuwait price of $720 under an "Oct 26" label. Those figures conflict with Argus's dated October prints of $835 and $820 [12]. We have left them out rather than guess which month they belong to.
Ground Truth: The fourth-quarter cut was set by buyers who could not afford $705. The next one, if it comes, will be set by a world price that has fallen to meet Tampa. On October 12 the contract was the cheapest sulfur on the board by a wide margin. Today it is about $75 to $135 a tonne under Middle East spot before freight, and the Middle East marker fell about 9% from its October average in the first five days of November [11]. If the first-quarter 2027 contract followed that marker, it would settle near $560. Our estimate for the settlement is a range of $540 to $615, with a rollover still possible. Refiners now have an export price that is falling toward them, so they have less reason to give up another $90. That is our estimate from the spot evidence, not a trade forecast. A buyer should treat any number below $540 as news.
3. What $615 does to a ton of product
What's new: The $90 cut takes about $33 off the sulfur in a short ton of DAP. The year-on-year rise of $305 still leaves about $110 more sulfur in that ton than last fall.
Evidence: We use the conversions from our October work [14][16]. Phosphate takes about 0.405 tonnes of sulfur per tonne of DAP and 0.458 per tonne of MAP. For ammonium sulfate (24% S) and ATS (26% S) we use the sulfur in the analysis. A 90% elemental product carries 1,800 lb of sulfur a short ton. Per short ton of product those are 0.362, 0.409, 0.217, 0.232 and 0.804 long tons. All of these are our engineering estimates.
| Sulfur value inside a short ton, $ | Q4 2025 ($310) | Q3 2026 ($705) | Q4 2026 ($615) | Quarter change | Year change | Current price, $/st | Sulfur share now |
|---|---|---|---|---|---|---|---|
| DAP 18-46-0 | 112* | 255* | 223* | −33* | +110* | 941 retail | 24%* |
| MAP 11-52-0 | 127* | 288* | 252* | −37* | +125* | 987 retail | 25%* |
| Ammonium sulfate 21-0-0-24S | 67* | 153* | 134* | −20* | +66* | 573 Oklahoma ask | 23%* |
| ATS 12-0-0-26S | 72* | 164* | 143* | −21* | +71* | 415 Oklahoma ask | 34%* |
| Elemental sulfur, 90% | 249* | 567* | 494* | −72* | +245* | No public quote found | — |
Source: Crop Root Zone model on the contract prints in Section 1 [1][8][9]; DTN/Progressive Farmer, Nov 4, 2026 (national retail, survey Oct 26–30) [18]; USDA AMS Oklahoma Production Cost Report, Oct 30, 2026 (distributor ask, FOB) [19]. *Estimates, sulfur valued at the Tampa contract. For ammonium sulfate and ATS this is an opportunity cost, because much of that supply is made from byproduct streams that do not buy sulfur at Tampa prices. For the elemental product, the figure is the Tampa value of the sulfur it contains, not a price; we found no public retail quote for one.
The farm prices have not moved with the contract. In the survey week of October 26 to 30, DTN had retail DAP at $941, up $7 in a month and $14 on the year, and MAP at $987, up $13 in a month and $56 on the year [18]. The Gulf shows the same thing. NOLA DAP barges traded at $795 to $805 on October 30, against $725 to $735 a year earlier. MAP traded at $815 to $830, against $700 [7]. On midpoints, the MAP barge is up about $122 a ton. That is almost exactly the $125 more sulfur we estimate in a ton of MAP. The DAP barge is up about $70 against $110 more sulfur. So for DAP, the producer has absorbed most of the year's sulfur increase, and Mosaic's phosphate gross margin of minus $105 a tonne shows it [1][2].
Ammonium sulfate moved the wrong way for a buyer waiting on sulfur. Oklahoma's distributor ask rose $20 in the fortnight to October 30, to $573, as the contract settled $90 lower [19]. North Carolina held at $624 and the Pacific Northwest at $812.75 (USDA AMS, Oct 30, 2026) [20][21]. AdvanSix described its fall fill as well received but reset lower in price, and its chief executive said "it is likely that the market will be short of supply into the spring season." She said several North American producers are idle or running intermittently because of input costs [5].
4. A corn acre's sulfur bill, priced two ways
What's new: A corn grower pays for sulfur twice. Once in the sulfur program, which feeds the crop. Once inside the phosphate, where the sulfur becomes sulfuric acid, digests the rock and leaves in phosphogypsum. On our estimate the second bill is now the larger one.
Evidence: Iowa State research finds corn responds to about 15 lb of sulfur an acre on fine-textured soils and about 25 lb on coarse soils. Economic optimums in multi-site work were about 16 and 23 lb (Iowa State University Extension, Mar 2020) [22]. For the phosphate side we use corn's survey-average 64 lb of P2O5 an acre, which is 139 lb of DAP (Crop Root Zone, TRZ-0209, Sep 18, 2026) [23]. Using the same 0.405 ratio, making that DAP consumes about 56 lb of sulfur. MAP at the same P2O5 rate needs 123 lb of product and consumes the same 56 lb.
To price the sulfur program we net out the nitrogen, as we did in October (Crop Root Zone, TRZ-0290) [24]. Ammonium sulfate's 420 lb of N a ton is credited at the same panel's urea price per pound of N. ATS's 240 lb is credited at UAN28. On Oklahoma's October 30 panel, urea was $639.44 and UAN28 $424.30 [19]. That leaves sulfur from ammonium sulfate at $0.586 a pound, up from $0.545 on October 16 [24], and sulfur from ATS at $0.448. The same method gives $0.570 in North Carolina and $0.653 in the Pacific Northwest [20][21]. The Tampa contract is $0.275 a pound.
| Corn acre, $ per acre | Q4 2025 contract | Q4 2026 contract or Oct 30 ask | |
|---|---|---|---|
| Sulfur consumed making 64 lb P2O5 as DAP (56 lb S) | 7.80* | 15.47* | ██████████ |
| 25 lb S from ammonium sulfate, Oklahoma net | — | 14.64* | █████████░ |
| 25 lb S from ATS, Oklahoma net | — | 11.21* | ███████░░░ |
| 15 lb S from ammonium sulfate, Oklahoma net | — | 8.78* | ██████░░░░ |
| 25 lb S at the Tampa contract | 3.46* | 6.86* | ████░░░░░░ |
| 15 lb S from ATS, Oklahoma net | — | 6.73* | ████░░░░░░ |
| 15 lb S at the Tampa contract | 2.08* | 4.12* | ███░░░░░░░ |
Source: Crop Root Zone model. Contract prices as in Section 1 [1][9]; Oklahoma asks from USDA AMS, Oct 30, 2026 [19]; rates from Iowa State University Extension [22] and TRZ-0209 [23]. *All values are estimates. The phosphate row assumes the producer's sulfur cost passes through to the farm price in full, which Section 3 shows it has not yet done for DAP. Neither USDA report gives a year-ago ammonium sulfate or ATS ask, so the program rows have no year-ago column. Bars scale $15.47 to ten blocks.
56 lb
The sulfur consumed to make one corn acre's 64 lb of P2O5 as DAP or MAP, against the 15 to 25 lb the crop is fed. At $615 it costs about $15.47 an acre, double last fall's $7.80. (Crop Root Zone model on Mosaic and Argus contract prints, Nov 3, 2026 and Dec 30, 2025)
Three things follow from the table. First, the $90 cut is worth about $2.27 an acre on the phosphate side ($17.74 at $705 against $15.47 at $615). On a 15 lb sulfur program it is worth 60 cents if the program's price followed Tampa, and so far it has not. Second, the year's increase on the phosphate side, about $7.67 an acre, is more than a whole 15 lb ATS program costs today. Third, sulfate sulfur still sells at a large premium to the raw element: 2.1 times Tampa for ammonium sulfate in Oklahoma and 1.6 times for ATS. That premium widened as the contract fell, because the net sulfate price went up.
Ground Truth: The cheap place to cut a corn acre's sulfur bill this winter is not the sulfur program. A grower who drops from 25 lb to 15 lb of ammonium sulfate sulfur saves about $5.86 an acre, and risks yield on the coarse soils where the higher rate is the optimum. The sulfur in the phosphate costs more than either rate and will not come down before spring, because the $615 contract enters producer costs in the first quarter and producers have losses to recover first. The sulfate price is not tracking Tampa either. Oklahoma's net sulfur rose 4 cents a pound in the fortnight the contract fell $90. It is set by urea and by ammonium sulfate's own supply, which AdvanSix expects to be short in spring. For a grower who needs sulfur, the practical choice is between ammonium sulfate and ATS, priced per pound of sulfur net of nitrogen. That gap was 14 cents in Oklahoma on October 30, or $2.06 an acre at 15 lb. Waiting for the Tampa cut to reach the bin is not a strategy.
5. When the cut reaches anyone, and what to watch
The order in which the $90 cut travels is on the record. Refiners and phosphate plants priced it in October [3]. Mosaic will book most of it in January to March [1]. AdvanSix says its input costs lag the contract and that it "is well positioned to benefit as sulfur input costs normalize" [5]. Retail product made from $615 sulfur reaches dealers' bins for spring application. The distributor summary we used expects NOLA DAP to stay at $790 to $815 and MAP at $810 to $835 through December. It says "depleted dealer inventories and restricted domestic production" will prevent sharp declines [7]. Mosaic still has South Fort Meade in Florida and Faustina and Uncle Sam in Louisiana idled or curtailed [7]. Its guidance for fourth-quarter DAP at the plant is $820 to $840 a tonne, the same range it gave for the third quarter, on 1.3 to 1.6 million tonnes of sales [1].
| Signal | What it would tell a buyer | When |
|---|---|---|
| First-quarter 2027 Tampa contract | Under $540 is a second large cut; a rollover at $615 means refiners held | Late Dec to mid-Jan |
| November and December Middle East posts | Whether the posted prices are following spot down; our October-to-November spot evidence says yes | Start of each month |
| Mosaic's fourth-quarter realized sulfur cost | Near $705 confirms the lag; well under it means the cut arrived early | Feb 2027 |
| A Mosaic restart at Faustina, Uncle Sam or South Fort Meade | The first sign cheaper sulfur means more US phosphate tons | Any time |
| USDA ammonium sulfate asks into spring | Whether the AdvanSix spring shortage call shows up at distributors | Every two weeks |
| A public US Gulf sulfuric acid price | Fills the gap in this piece | Unknown |
Source: Crop Root Zone; timing from Mosaic, Nov 3, 2026 [1], and from the settlement pattern in Section 1.
References
- The Mosaic Company, "The Mosaic Company Reports Third Quarter 2026 Results," press release, Form 8-K Exhibit 99.1, Nov 3, 2026 (fourth-quarter sulfur contract at $615/lt; third-quarter raw material costs; fourth-quarter phosphate guidance). https://www.sec.gov/Archives/edgar/data/0001285785/000128578526000139/pressreleaseq32026-ex991.htm
- The Mosaic Company, Q3 2026 Performance Data, Form 8-K Exhibit 99.2, Nov 3, 2026 (quarterly realized sulfur cost, DAP price, production). https://www.sec.gov/Archives/edgar/data/0001285785/000128578526000139/performancedataq32026-ex992.htm
- Itafos Inc., "Itafos Reports Q3 2026 Financial Results and Operational Highlights," Nov 4, 2026 (Q4 Tampa sulfur contract at $615; sulfur and sulfuric acid costs; Conda acid plant outage; MAP NOLA averages). https://itafos.com/news/2026/itafos-reports-q3-2026-financial-results-and-operational-highlights/
- AdvanSix Inc., third quarter 2026 earnings release, Form 8-K Exhibit 99, Nov 4, 2026 (Plant Nutrients sales; ammonium sulfate outlook). https://www.sec.gov/Archives/edgar/data/0001673985/000167398526000056/exhibit99q32026prearningsn.htm
- Investing.com, "Earnings call transcript: AdvanSix Q3 2026," Nov 4, 2026 (Tampa marker $705 in Q3 and $615 with the Q4 settlement; $35 million per $100/lt; spring ammonium sulfate supply). Third-party transcript; carries its own accuracy caveat. https://www.investing.com/news/transcripts/earnings-call-transcript-advansix-q3-2026-profit-miss-weighs-on-shares-93CH-5000521
- TipRanks, "AdvanSix Earnings Call: Pricing Strength Meets Raw Material Pressure," Nov 9, 2026 (summary of the call: $65 million raw material headwind; fall fill). https://www.tipranks.com/news/company-announcements/advansix-earnings-call-pricing-strength-meets-raw-material-pressure
- Advanced Turf Solutions, "U.S. Fertilizer Market Summary," Nov 2, 2026 (prices as of Oct 30, 2026: Tampa Q4 $615/lt CFR; US Gulf prills; NOLA DAP and MAP current and year-ago; outlook; Mosaic curtailments). https://www.advancedturf.com/wp-content/uploads/2026/04/ATS-Fertilizer-Market-Update-11_2_2026.pdf
- Argus Media, "Tampa 3Q liquid sulphur price hits record $705/lt," Jul 13, 2026. https://www.argusmedia.com/en/news-and-insights/latest-market-news/2851577-tampa-3q-liquid-sulphur-price-hits-record-705-lt
- Argus Media, "Viewpoint: Sulfur costs to support amsul prices in 2026," Dec 30, 2025 (fourth-quarter 2025 Tampa contract of $310/lt delivered). https://www.argusmedia.com/en/news-and-insights/latest-market-news/2770651-viewpoint-sulfur-costs-to-support-amsul-prices-in-2026
- Green Markets (Bloomberg), "Sulfur," public excerpt: first-quarter Tampa molten contracts valued at $495.69/lt CFR, Mar 6, 2026 (excerpt only; body restricted to members). https://fertilizerpricing.com/sulfur-515/
- ChemPortal, "Sulphur (Sulfur) Prices & Freight," assessed Nov 5, 2026 (spot, contract and daily marker ranges; aggregator page that does not name its underlying price-reporting agency). https://www.chemportal.com.tr/markets/sulphur.html
- Argus Media, "Kuwait's KPC cuts Oct sulphur price by $45/t," Oct 5, 2026. https://www.argusmedia.com/en/news-and-insights/latest-market-news/2886522-kuwait-s-kpc-cuts-oct-sulphur-price-by-45-t
- Trading Economics, "Sulfur — Price, Chart, Historical Data," accessed Nov 10, 2026 (China, CNY/t; the provider notes the series is for reference and not verified). https://tradingeconomics.com/commodity/sulfur
- Crop Root Zone, TRZ-0270, "Twelve Days Into the Quarter, Tampa Sulfur Is Still Unsettled at $705. Gulf Producers Cut October Prices $45 to $70, and a $50 Cut Is Worth $18 on a Ton of DAP.," Oct 12, 2026 (also the source here for the Oct 12 Trading Economics reading, the Oct 1 China granular price and the early-October trade expectation of a $50 to $100 cut).
- World Today News, "Sulfur and Sulfuric Acid Prices Continue to Fall Due to Low Demand," Nov 9, 2026 (secondary rewrite of an RFI report of Nov 8, 2026). https://www.world-today-news.com/sulfur-and-sulfuric-acid-prices-continue-to-fall-due-to-low-demand/
- Crop Root Zone, TRZ-0246, "The Fourth-Quarter Sulfur Price Is Not Public Yet. Every $100 a Long Ton It Settles Adds $36 to a Ton of DAP — and Lands on Spring 2027, Not This Fall.," Oct 1, 2026.
- AgriBusiness Global, "Itafos and Rio Tinto Amend Sulfuric Acid Contract to Further Support American Farming," May 15, 2026 (reference index moved from Vancouver to Tampa effective May 1, 2026; terms through Dec 31, 2029; about 60% of Conda's acid). https://www.agribusinessglobal.com/?p=134733
- DTN/Progressive Farmer, "UAN28 Continues to Lead Fertilizer Prices Higher in October's Final Week," Nov 4, 2026 (survey Oct 26–30, 2026; year-ago Oct 27–31, 2025). https://www.dtnpf.com/agriculture/web/ag/crops/article/2026/11/04/uan28-continues-lead-fertilizer-week
- USDA AMS, Oklahoma Production Cost Report (Bi-Weekly), report 3621, Oct 30, 2026 (ammonium sulfate, ATS, urea, UAN28, DAP, MAP; distributor ask, FOB). https://www.ams.usda.gov/mnreports/ams_3621.pdf
- USDA AMS, North Carolina Production Cost Report, report 3159, Oct 30, 2026. https://www.ams.usda.gov/mnreports/ams_3159.pdf
- USDA AMS, Pacific Northwest Production Cost Report (Bi-Weekly), report 3657, Oct 30, 2026. https://www.ams.usda.gov/mnreports/ams_3657.pdf
- Iowa State University Extension and Outreach, Integrated Crop Management, "Crop Sulfur Fertilization This Spring," Mar 2020 (corn response near 15 lb S/acre on fine-textured and 25 lb on coarse-textured soils; economic optimums near 16 and 23 lb). https://crops.extension.iastate.edu/cropnews/2020/03/crop-sulfur-fertilization-spring
- Crop Root Zone, TRZ-0209, "Washington Suspended the 16.60% Moroccan Phosphate Duty on July 8. Ten Weeks Later Retail DAP Is $923/st — $13 Higher Than the Week It Was Signed.," Sep 18, 2026 (64 lb P2O5 and 139 lb DAP per corn acre).
- Crop Root Zone, TRZ-0290, "Ammonium Sulfate Runs $538 to $813 a Ton Across Five USDA Panels This October. Take Out the Nitrogen and Its Sulfur Costs 52 to 65 Cents a Pound, and Oklahoma's ATS Line Delivers It for 45.," Oct 19, 2026 (method and the Oct 16 Oklahoma net sulfur figure).
Disclosures
Crop Root Zone is an independent publication. Nothing here is investment advice. Market calls, where included, reflect the editors' own read and are not a recommendation to buy or sell any security.
The Ammonia Contract Fell $80 Because a Phosphate Plant Stopped Buying. Nitrogen Growers Get the Discount.
September Tampa settled at $555/t CFR, the fourth straight monthly fall and $270 off May's peak — and the stated cause is a phosphate producer's sulfur problem, not weak nitrogen demand. Retail anhydrous moved $20.
The September Tampa ammonia contract settled at $555 per tonne CFR, $80 lower than August, in a market where nobody is reporting weak nitrogen demand. The publisher carrying the settlement attributes the drop to reduced ammonia purchases by a phosphate producer that is idling capacity because sulfur costs more than its finished product can carry (Australian Fertilizer Corporation, w/e Aug 28, 2026). That is an unusual reason for a nitrogen price to fall, and it changes what a corn grower should read into it. This is not the market telling you nitrogen is oversupplied. It is one very large buyer stepping away from the table for reasons that have nothing to do with corn.
1. What settled, and how far it has come
What's new: Yara and Mosaic settled the September Tampa contract at $555/t CFR, down $80/t from August. The reporting is explicit about the size and the sequence: "The September Tampa contract settled USD 80/t lower at USD 555/t CFR, down from May's peak of USD 825/t CFR" (Australian Fertilizer Corporation, w/e Aug 28, 2026).
Evidence: That is a $270/t fall from the May peak, or 32.7%, spread across four monthly settlements — and $80 of it, nearly 30% of the entire decline, landed in this one month. The correction is accelerating, not decaying.
| Tampa contract | $/t CFR | Change vs prior settlement | |
|---|---|---|---|
| May 2026 (peak) | 825 | — | ██████████ |
| September 2026 | 555 | −80 | ███████ |
| Net May → September | −270 | −32.7% |
Source: Australian Fertilizer Corporation, Weekly Update — Global Fertiliser Markets, w/e Aug 28, 2026.
A note on what this table is and is not. The two levels are page-read from the source cited. The intermediate June, July and August settlements are not reproduced here because this desk has not independently read them, and a chart drawn through months we have not verified would imply precision the sourcing does not carry. What is established is the two endpoints, the size of the final step, and the direction.
$555/t CFR
September Tampa ammonia — the fourth consecutive monthly decline, and 32.7% below the May peak. (Australian Fertilizer Corporation, w/e Aug 28, 2026)
2. The reason is a phosphate problem, and that is the whole story
What's new: The fall is attributed to a single buyer's reduced offtake. The source's words: the correction "appears to reflect reduced ammonia offtake from Mosaic's phosphate operations rather than a uniform repricing across the Atlantic basin" (Australian Fertilizer Corporation, w/e Aug 28, 2026).
Evidence: The context is documented independently. Mosaic filed a WARN notice on Aug 26, 2026 covering 206 workers at its Uncle Sam and Faustina facilities in Louisiana, with separations by Oct 10, 2026, citing global sulfur supply constraints and extraordinary market conditions (WBRZ, Aug 2026; The Advocate, Aug 2026). The company has also signalled reduced output in Brazil and the US (World Fertilizer, Sep 7, 2026). Phosphate manufacture consumes ammonia — DAP is 18% nitrogen, MAP is 11% — so a producer running its phosphate complex at reduced rates buys less ammonia, and the Tampa contract is the price at which a large share of that ammonia is bought.
Two qualifications are worth stating plainly rather than glossing. First, the causal attribution above is the reporting publisher's read, not an established fact confirmed by the counterparties; it is labelled as such here for that reason. Second, ammonia production at Faustina is reported to be continuing through the phosphate idling, so this is a story about purchased ammonia into phosphate operations, not about a plant going dark.
Ground Truth: A price that falls because demand weakened and a price that falls because one buyer left the market look identical on a chart and behave very differently afterward. Demand-driven softness tends to persist, because the thing that caused it — ample supply, poor crop economics — is still there next month. Buyer-withdrawal softness reverses the moment that buyer comes back, and this one has a published trigger date: the sulfur contract driving the curtailment reprices at the end of the quarter. If sulfur settles lower for Q4, the phosphate operator's arithmetic improves, offtake returns, and the support under Tampa comes back with it. Treat $555 as a level with a known expiry rather than a new trend.
3. At retail, almost none of this has arrived
What's new: In the same month the Tampa contract fell $80/t, the US retail anhydrous average moved from $943/ton to $923/ton — a $20 move (DTN/Progressive Farmer, retail data week Aug 19 and Aug 24–28, 2026).
Evidence: Put both on the same basis. $80 per tonne is $72.57 per short ton. Retail moved $20 per short ton over the same interval. Wholesale fell roughly 3.6 times as far as retail in the same month.
| Nitrogen product | Retail $/ton | $/lb N | vs last month |
|---|---|---|---|
| Anhydrous | 923 | 0.56 | Slightly lower |
| Urea | 655 | 0.71 | −5% |
| UAN28 | 428 | 0.76 | −8% |
| UAN32 | 458 | 0.72 | Slightly lower |
Source: DTN/Progressive Farmer retail fertilizer survey, data week Aug 24–28, 2026.
The per-pound-of-nitrogen column is where the gap is legible. Tampa at $555/t is $0.307/lb N at the water ($555 ÷ 1,808 lb of N per tonne of 82% ammonia). Retail anhydrous at $0.56/lb N is 83% above that. Some of that spread is real and permanent — terminal storage, inland freight, retail handling of a pressurised product, and margin — but the spread is not supposed to widen by $70 a short ton in a month, and this month it did.
| Basis | $/lb N | |
|---|---|---|
| Tampa contract, September | 0.307 | ██████ |
| US retail anhydrous, late August | 0.563 | ██████████ |
Sources: Australian Fertilizer Corporation, w/e Aug 28, 2026; DTN/Progressive Farmer, data week Aug 24–28, 2026. Tampa figure derived: $555/t ÷ (0.82 × 2,204.62 lb) — derivation is this desk's, the input price is the source's.
4. What the untransmitted discount is worth per acre
What's new: For a grower budgeting fall anhydrous, the money that has not yet come through the retail channel is quantifiable.
Evidence: At 180 lb of N per acre — a common corn rate, used here as a stated assumption rather than a survey figure — the September settlement alone is worth $0.0442/lb N, or $7.96 per acre, if it passes through in full. The whole May-to-September decline is worth $0.149/lb N, or $26.89 per acre. Against a current anhydrous cost of roughly $101 per acre at $0.56/lb N, that is a quarter of the nitrogen bill sitting in the channel.
| Pass-through scenario | $/lb N | $/acre at 180 lb N | Share of current N cost |
|---|---|---|---|
| September settlement only | 0.044 | 7.96 | 7.9% |
| Full May → September decline | 0.149 | 26.89 | 26.5% |
| Realised at retail so far (Aug 19 → Aug 28) | 0.012 | 2.20 | 2.2% |
Derived by this desk from the sourced prices above. The 180 lb/acre rate is an assumption, not a survey value; scale linearly for your own rate. "Realised" is the $20/short-ton retail move converted at 1,640 lb N per short ton of anhydrous.
Ground Truth: The pass-through lag is not a reason to wait, and this is where most of the commentary gets it backwards. The lag is real, but so is the expiry on the cause. A grower waiting for the full $27 an acre to arrive at the retail tank is betting that retail catches up before the phosphate buyer comes back — and the phosphate buyer's return is scheduled by a quarterly contract, while the retail catch-up is scheduled by nothing at all. The asymmetry favours booking a portion now at a known price rather than holding out for a discount that has to win a race against a date on someone else's calendar.
5. What to watch
The next DTN retail print is the first read on a retail channel that has now had a full settlement cycle to respond, and it will be the first retail survey taken entirely after the September settlement was public. The Q4 sulfur settlement is the other date that matters: it sets whether the curtailed phosphate capacity restarts, and therefore whether Tampa's largest single buyer returns before or after fall application is finished. Those two prints, in that order, will tell a fall nitrogen buyer more than any forecast of the ammonia curve.
One thing not to read into this: nothing in the Tampa settlement says anything about phosphate prices for the grower, which are moving the other way. That is a separate story with separate arithmetic.
References
- Australian Fertilizer Corporation — Weekly Update, Global Fertiliser Markets, w/e 28.08.2026. https://ausfertcorp.com/weekly-update-global-fertiliser-markets-w-e-28-08-2026/
- DTN/Progressive Farmer — Fertilizer Prices Fall as UAN28, Urea Lead the Way Lower, Sep 2, 2026 (retail data week Aug 24–28, 2026). https://www.dtnpf.com/agriculture/web/ag/crops/article/2026/09/02/fertilizer-prices-fall-uan28-urea
- DTN/Progressive Farmer — 5 Fertilizer Prices Slightly Lower Than Last Month; 3 Higher, Aug 19, 2026. https://www.dtnpf.com/agriculture/web/ag/crops/article/2026/08/19/5-fertilizer-prices-slightly-lower-3
- WBRZ — Over 200 Mosaic employees laid off at two facilities amid sulfur supply shortage, Aug 2026. https://www.wbrz.com/news/over-200-mosaic-employees-laid-off-at-two-facilities-amid-sulfur-supply-shortage
- The Advocate — Mosaic to lay off 206 at St. James fertilizer plants, Aug 2026. https://www.theadvocate.com/baton_rouge/news/business/louisiana-fertilizer-plants-lay-off-200-as-war-with-iran-drives-up-cost-of-key/article_c550aee7-016d-4af5-ae2b-497f7e1c2fda.html
- World Fertilizer — Mosaic reveals plans to reduce Brazil and US output, Sep 7, 2026. https://www.worldfertilizer.com/phosphates/09072026/mosaic-reveals-plans-to-reduce-brazil-and-us-output/
Disclosures
Crop Root Zone is an independent publication. Nothing here is investment advice. Market calls, where included, reflect the editors' own read and are not a recommendation to buy or sell any security.
December Oats Settled at $3.615 on November 13 and Minneapolis Bid $4.32. NDSU's Oat Acre Still Carries $80 of Fertilizer, 75% of Spring Wheat's, and Needs $3.41 a Bushel to Match Wheat in 2027.
Oats are sold as the low-fertilizer small grain. In NDSU's budgets the oat fertilizer line is $80 to $97 an acre, and at the $2.46 budget price it is 40% of revenue. We repriced the East Central North Dakota budget at November 13 settlements. For 2027, an oat bid no worse than 47 cents under September futures matches spring wheat on return over direct costs. It takes $4.41 to match corn and $4.91 to match soybeans. South Dakota's 28 nitrogen trials say the fertilizer line can come down by about $23 an acre.
December CBOT oat futures settled at $3.615 a bushel on November 13, and the terminal bid for No. 1 and No. 2 white oats delivered Minneapolis was $4.315, 70 cents over December and 60 cents over the same day last year (USDA AMS, Nov 13, 2026) [1][2]. September 2027 futures, the first new-crop month, settled at $3.8775 [1]. Those prices are well above what the land-grant budgets assumed. NDSU priced 2026 oats at $2.46 a bushel in East Central North Dakota last February and showed a loss of $108 an acre, the largest of any major crop in the region (NDSU Extension, Feb 2026) [9]. Oats have a reputation as the cheap small grain to fertilize. The same budget puts the oat fertilizer line at $79.54 an acre, 75% of spring wheat's [9]. This piece works out what an oat acre earns at current prices, how much fertilizer it really needs, and what bid a grower should require before planting oats in 2027.
1. The price: futures, the terminal bid and the farm price are three different numbers
What's new: Oat prices are up from a year ago at every public quote we found. The gap between the terminal bid and the average farm price is more than a dollar a bushel.
Evidence:
| Quote | Price | Year ago | YoY | Basis |
|---|---|---|---|---|
| CBOT white oats, Dec 2026 ($/bu) | 3.615 | n/a | n/a | Futures settlement, Nov 13 |
| CBOT white oats, Sep 2027 ($/bu) | 3.8775 | n/a | n/a | Futures settlement, Nov 13 |
| US No. 1/2 white oats, Minneapolis ($/bu) | 4.315 | 3.7125 | +16% | Terminal elevator bid, delivered truck, current, Nov 13 |
| No. 2 CW oats, Manitoba (C$/bu) | 4.65 | 3.59* | +30% | Farmer's net cash return at Winnipeg elevator, Nov 6 |
| Oats, price received, United States ($/bu) | 3.10 | 3.12 | −1% | NASS farm price, September |
| Oats, price received, Minnesota ($/bu) | 2.49 | 2.76 | −10% | NASS farm price, September |
| Oats, price received, South Dakota ($/bu) | 2.54 | 3.07 | −17% | NASS farm price, September |
Source: USDA AMS North Dakota Daily Grain Bids, Nov 13, 2026 [1]; USDA AMS Minneapolis Daily Grain Report, Nov 13, 2026 [2]; Manitoba Agriculture, Grain and Oilseed Prices, Nov 6, 2026 [3]; USDA NASS Agricultural Prices, Oct 30, 2026 [4]. *Manitoba publishes the year-ago price as C$232.78 a tonne against C$301.52 now; the C$3.59 a bushel is a Crop Root Zone conversion. Percentages are Crop Root Zone calculations. "n/a" = the source reports carry no year-ago settlement.
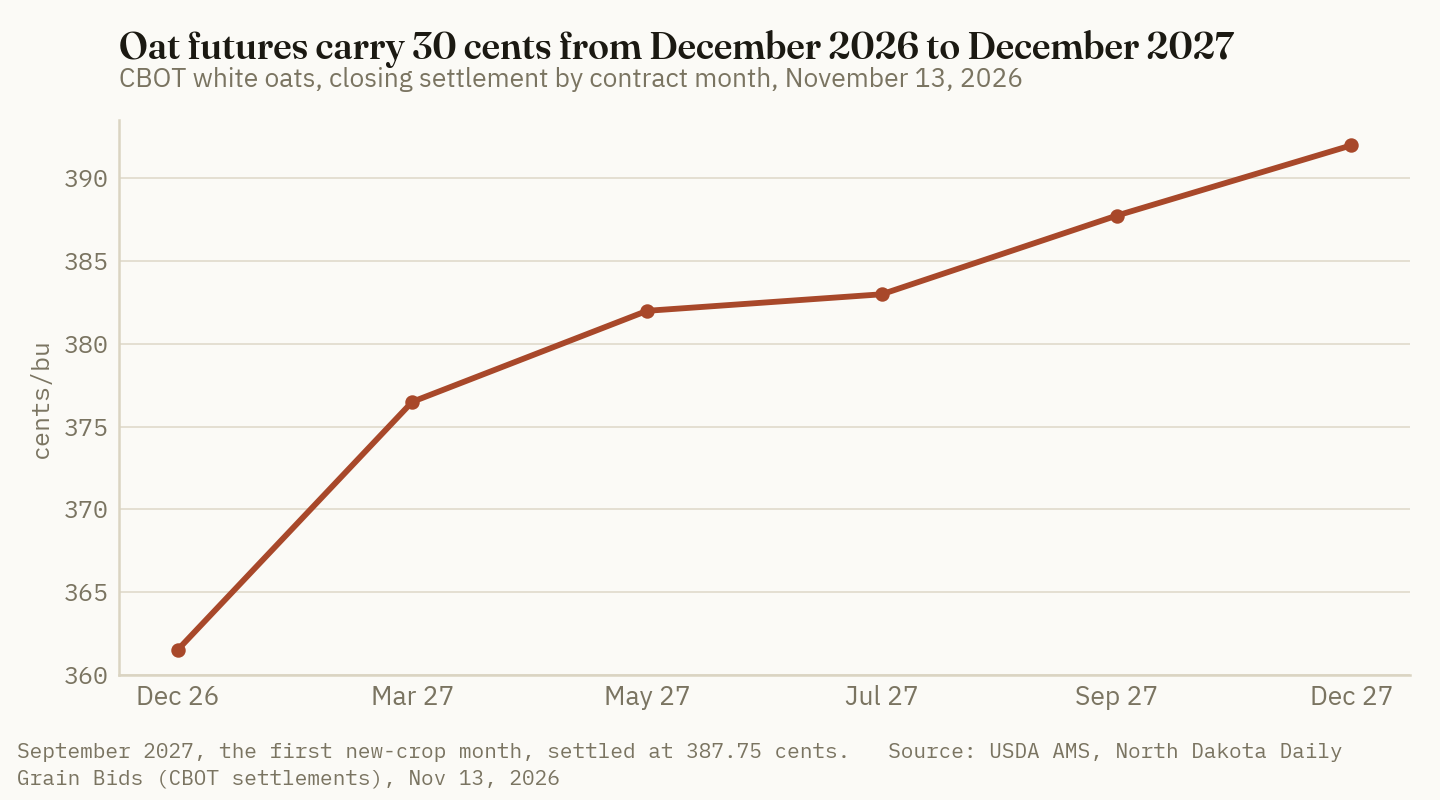
The Manitoba bid converts to about US$3.32 a bushel at the report's exchange rate of C$1.399 [3]. Manitoba listed December oats at $3.34 on November 6 [3]. The contract settled at $3.615 a week later [1], a gain of about 27 cents.
The North Dakota country-elevator report quotes corn, soybeans and spring wheat by region. It carries no oat bid at all [1]. The only public daily cash oat price in the region is the Minneapolis terminal bid. That matters because the farm price is far lower. In September, NASS put the average price received at $2.49 in Minnesota and $2.54 in South Dakota. North Dakota's September figure was withheld, and its August figure was $3.01 [4]. A Minnesota grower averaged about $1.80 less than today's Minneapolis bid. Part of that is timing, because futures have moved since September. Most of it is freight, grade and the difference between oats sold to a mill and oats sold as feed. NDSU's budget price follows the feed market. The $2.46 it used is close to what Minnesota and South Dakota growers were actually paid.
Ground Truth: An oat acre has no public local price, so the budget defaults to the feed price, and at the feed price oats lose. The decision for 2027 depends on a number that is not published anywhere: the delivered bid from a specific mill or elevator, net of freight, for oats that make grade. A grower who cannot get that number in writing before seeding should treat the acre as a $2.50 crop. On NDSU's costs that does not pay.
2. The supply: Canada's crop is down 23%, and the U.S. buys more oats than it grows
What's new: Statistics Canada's September 16 model-based estimate put Canada's 2026 oat crop at 3.031 million tonnes, down 22.7% from 3.920 million. Harvested area was 840,200 hectares and yield was 3,607 kilograms a hectare (Statistics Canada, as relayed by The Western Producer, Sep 16, 2026) [7]. That converts to about 2.08 million acres and 94.7 bushels an acre. The 2025 crop was harvested from 2.6 million acres at 98.1 bushels (Statistics Canada, Dec 4, 2025) [8]. The September figure is a satellite and climate model, not a survey, and the December survey may revise it.
In the U.S., growers planted 2.638 million acres of oats in 2026, up 11% and the most since 2020. They harvested 917,000 acres for grain, down 3%. Yield was 75.3 bushels and production was 69.1 million bushels, down 1% (USDA NASS, Sep 30, 2026) [5].
Evidence:
| State | Planted 2026 (1,000 ac) | Harvested 2026 (1,000 ac) | Harvested share | Yield 2026 (bu/ac) | Yield 2025 (bu/ac) | Production 2026 (1,000 bu) | vs 2025 |
|---|---|---|---|---|---|---|---|
| Minnesota | 230 | 150 | 65% | 92 | 87 | 13,800 | −4% |
| North Dakota | 360 | 175 | 49% | 74 | 77 | 12,950 | −4% |
| South Dakota | 345 | 80 | 23% | 96 | 86 | 7,680 | −34% |
| Iowa | 130 | 68 | 52% | 100 | 92 | 6,800 | +48% |
| Wisconsin | 145 | 61 | 42% | 74 | 64 | 4,514 | +9% |
| United States | 2,638 | 917 | 35% | 75.3 | 73.8 | 69,081 | −1% |
Source: USDA NASS, Small Grains 2026 Summary, Sep 30, 2026 [5]. Basis: all oats, planted and harvested for grain. Harvested share and year-over-year changes are Crop Root Zone calculations.
Only 35% of planted oat acres were combined. The rest were grazed, cut for forage or used as a cover crop. South Dakota planted 345,000 acres and harvested 80,000, down from 135,000 in 2025, and its production fell 34% even with a record 96-bushel yield [5]. The 11% rise in planted area did not become grain. The five states in the table grew 66% of the U.S. crop.
USDA's November balance sheet has 2026/27 U.S. production at 69 million bushels and imports at 72 million. Food, seed and industrial use is 83 million bushels, more than the whole domestic crop. Ending stocks are projected at 33 million bushels and the season-average farm price at $3.35, against $3.23 for 2025/26 (USDA WASDE, Nov 10, 2026) [6].
58 million bushels
The drop in Canada's oat crop from 2025 to 2026, on Statistics Canada's September estimate. That is 80% of what the U.S. is projected to import in 2026/27, and 83% of what the U.S. grew. (Crop Root Zone conversion from Statistics Canada via The Western Producer, Sep 16, 2026; USDA WASDE, Nov 10, 2026; USDA NASS, Sep 30, 2026)
USDA has not changed its import or price projection between October and November [6]. The futures market has already priced some of the Canadian shortfall. The Minneapolis bid at 70 cents over December says the mills are paying up for nearby supply [2].
3. The fertilizer line: oats cost three-quarters of what wheat costs, not a fraction of it
What's new: NDSU's East Central budget puts fertilizer at $79.54 an acre for oats at an 81-bushel yield. Spring wheat is $106.14 at 55 bushels, corn is $155.14 at 149 bushels and soybeans are $13.16 [9]. In the South Valley region (Cass, Richland and Traill counties), oats are $96.74 at 100 bushels against $118.26 for spring wheat and $168.07 for corn (NDSU Extension, Feb 2026) [10]. The University of Nebraska's 2026 dryland no-till oat budget is higher still. It applies 100 pounds of nitrogen as 28-0-0 at $0.78 a pound plus six gallons of 10-34-0, for $102 an acre at an 85-bushel yield (UNL, 2026) [13].
Evidence:
| East Central ND | Fertilizer $/acre | $/bushel | Share of revenue, Nov 13 prices | |
|---|---|---|---|---|
| Corn | 155.14 | 1.04 | 28.4% | ██████████ |
| HRS wheat | 106.14 | 1.93 | 33.7% | ███████░░░ |
| Oats | 79.54 | 0.98 | 32.6%* | █████░░░░░ |
| Soybeans | 13.16 | 0.37 | 3.2% | █░░░░░░░░░ |
Source: Crop Root Zone calculation from NDSU EC1658, Feb 2026 [9], and USDA AMS East Central North Dakota elevator averages, Nov 13, 2026 [1]. Basis: $/acre at NDSU's fertilizer prices and budget yields; bars scaled to corn = 10. *No public oat bid exists for the region. The oat share uses North Dakota's $3.01 August price received [4]. At NDSU's $2.46 it is 39.9%, and at the $4.315 Minneapolis bid it is 22.8%.
NDSU priced those budgets at $0.58 a pound of nitrogen, $0.68 for phosphorus and $0.38 for potassium [9]. Retail has moved since. In the week of November 2-6, DTN's national survey had urea at $662 a ton, up 11% from a year ago, and anhydrous at $1,003, up 17%. MAP was $991 and potash $504. Per pound of nitrogen, urea was $0.72 and anhydrous $0.61 (DTN, Nov 11, 2026) [11]. As a Crop Root Zone estimate, MAP at $991 implies about $0.80 a pound of phosphate once its nitrogen is valued at urea's price, and potash at $504 is $0.42 a pound of K2O. Against NDSU's assumptions that is 24% more for urea nitrogen, 18% more for phosphate and 11% more for potash. NDSU does not split its fertilizer line by nutrient, so we cannot reprice it exactly. A 20% increase adds about $16 an acre to oats, $21 to wheat, $31 to corn and under $3 to soybeans.
The more important number comes from South Dakota. SDSU ran 28 oat nitrogen-rate trials across eastern and central South Dakota from 2017 to 2022. Twenty-five followed soybeans. Maximum yields averaged 100 bushels an acre. The economic optimum nitrogen rate averaged 27 pounds an acre and ranged from zero to 125. SDSU concluded that the nitrogen needed per bushel of oats is 0.9 pounds, not the 1.3 pounds the old formula used, and cut the credit after soybeans from 40 pounds to 30 (SDSU Extension, Jan 2026) [12].
Ground Truth: The low-fertilizer oat acre is real in the trial data and missing from the budgets. A coefficient of 0.9 in place of 1.3 removes about 32 pounds of nitrogen from an 81-bushel oat acre. At urea's $0.72 a pound that is about $23 an acre, close to 30% of NDSU's oat fertilizer line. SDSU's own figure was $15 an acre at $0.43 nitrogen [12]. Today's nitrogen price makes the same agronomy worth half again as much. We do not know what coefficient sits behind NDSU's $79.54, so this is an estimate and not a correction of the budget. A grower who soil-tests to two feet and follows soybeans can plan on an oat fertilizer bill well under the budget. Without the soil test, the budget figure is the safe assumption, and oats then carry about as much fertilizer per dollar of revenue as wheat does.
4. The return: oats beat wheat and corn only above the feed price
What's new: We repriced NDSU's East Central budget (Eddy, Foster, Griggs, Stutsman and Wells counties) at November 13 elevator averages and held its per-acre costs fixed [9][1]. These are Crop Root Zone calculations, not NDSU figures. NDSU itself recommends return over direct costs for short-run planting decisions when land and machinery are already in place [9].
Evidence:
| East Central ND, per acre | Oats | HRS wheat | Corn | Soybeans |
|---|---|---|---|---|
| NDSU budget yield | 81 bu | 55 bu | 149 bu | 36 bu |
| NDSU Feb price | $2.46 | $5.81 | $3.75 | $9.75 |
| Direct costs | $168.17 | $230.35 | $402.55 | $173.77 |
| Total listed costs (incl. $75 land) | $307.73 | $361.85 | $570.87 | $303.63 |
| Return to labor & mgmt, NDSU Feb | −$108.47 | −$42.30 | −$12.12 | $47.37 |
| Nov 13 cash price | no public bid | $5.72 | $3.66 | $11.59 |
| Return over direct costs, Nov 13 | see below | $84.50 | $142.98 | $243.38 |
| Return to labor & mgmt, Nov 13 | see below | −$47.00 | −$25.34 | $113.52 |
Source: NDSU Extension EC1658, Projected 2026 Crop Budgets, East Central North Dakota, Feb 2026 [9]; East Central ND country elevator averages, FOB truck, from USDA AMS, Nov 13, 2026 [1]. Repriced returns are Crop Root Zone calculations. Costs are NDSU's dryland recrop figures and exclude PLC and ARC payments.
Spring wheat's loss of $47 an acre is almost unchanged from the $48 we calculated at October 27 bids (Crop Root Zone, Oct 28, 2026) [14]. Because the region has no public oat bid, the oat column has to be shown as a range of prices.
| Oat price, 81 bu | Revenue $/acre | Return over direct costs | Return to labor & mgmt | Price basis |
|---|---|---|---|---|
| $2.46 | 199 | 31 | −108 | NDSU Feb budget price [9] |
| $3.01 | 244 | 76 | −64 | ND price received, August [4] |
| $3.615 | 293 | 125 | −15 | Dec 2026 futures, zero basis [1] |
| $4.315 | 350 | 181 | 42 | Minneapolis terminal bid, delivered, freight not deducted [2] |
Source: Crop Root Zone calculations from NDSU EC1658 [9] at the prices shown. Rounded to whole dollars. The Minneapolis row overstates a North Dakota farm's return because the budget covers hauling to a local market only.
At the feed price, oats return $31 over direct costs and wheat returns $84. At North Dakota's August farm price, oats are $9 behind wheat. At December futures with no basis, oats are $40 ahead of wheat and $18 behind corn. Nothing in the table reaches soybeans at $243. On NDSU's costs, the break-even oat price is $2.08 for direct costs and $3.80 for all listed costs [9].
Two risks are specific to oats. The first is insurance. NDSU budgets Revenue Protection at 75% for wheat, corn and soybeans, and a yield-only APH policy at 70% for oats [9]. An oat acre has no price guarantee. The second is yield. North Dakota averaged 74 bushels this year against the 81-bushel East Central budget, and fewer than half the planted acres were harvested for grain [5]. At 74 bushels and $3.615, the return over direct costs falls from $125 to about $99, as a Crop Root Zone estimate that holds costs fixed.
5. The 2027 decision: the bid an oat acre has to clear
What's new: No public 2027 new-crop cash bid exists for any of these crops. We estimated one for wheat, corn and soybeans from the furthest listed futures month and East Central North Dakota's current basis midpoint, the same method we used for sunflowers [14]. We then solved for the oat price that gives the same return over direct costs at NDSU's 2026 costs.
Evidence:
| Crop to match | 2027 price used | Return over direct costs | Oat price needed | Against Sep 2027 oat futures ($3.8775) |
|---|---|---|---|---|
| HRS wheat | $6.15* | $107.90 | $3.41 | 47 cents under |
| Corn | $3.97* | $189.35 | $4.41 | 54 cents over |
| Soybeans | $11.21* | $229.70 | $4.91 | $1.03 over |
Source: Crop Root Zone estimates. Costs and yields from NDSU EC1658 [9]; futures and basis from USDA AMS, Nov 13, 2026 [1]. *Estimates, not quotes: Sep 2027 MGE wheat less 52.5 cents, Dec 2027 CBOT corn less 82.5 cents, Sep 2027 CBOT soybeans less 75 cents. Oat price needed = (competing crop's return + $168.17 oat direct costs) ÷ 81 bushels.
An oat acre sold at September 2027 futures with no basis returns about $146 over direct costs and about $6 to labor and management. That is $38 ahead of wheat, $43 behind corn and $84 behind soybeans. Fertilizer prices move these numbers only a little. With every fertilizer line 20% higher, oats need $3.34 to match wheat, because wheat's fertilizer bill rises more. With the oat fertilizer line $23 lower, as the SDSU work suggests, oats need about $3.12.
Ground Truth: Oats do not compete with soybeans on any price the market is offering, and they compete with corn only at a mill premium. Oats compete with spring wheat. For 2027, an oat bid no worse than about 47 cents under September futures matches wheat on NDSU's costs, or $3.41 a bushel. The Minneapolis bid today is $4.315, about 90 cents above that, and freight and grade discounts come out of the difference. A farm within reach of a mill should be able to keep enough of it to beat wheat. A farm selling to the feed market cannot, because September's farm prices in Minnesota and South Dakota were about 90 cents under the $3.41 the acre needs. We would not seed oats for grain in 2027 without a written bid at $3.41 or better, picked up or net of freight. With that bid and a two-foot soil test, the oat acre is the better small grain. It needs about $62 an acre less in direct costs than wheat and $27 less fertilizer, before any rate cut.
What to watch: Statistics Canada's survey-based production estimate in early December, which will confirm or revise the 23% cut [7][8]. USDA's oat import projection, unchanged at 72 million bushels since October [6]. Whether the Minneapolis basis holds 70 cents over once Canadian harvest supplies move [2]. NDSU's 2027 budgets, due this winter, and the oat price and fertilizer prices they use [9]. And spring soil nitrate tests, which decide whether the SDSU rate applies to a given field [12].
References
- USDA AMS Livestock, Poultry and Grain Market News (ND Dept. of Ag Market News), North Dakota Daily Grain Bids, Nov 13, 2026 (includes CBOT, KCBT and MGE closing settlements). https://mymarketnews.ams.usda.gov/viewReport/3878
- USDA AMS Livestock, Poultry and Grain Market News (MN Dept. of Ag Market News), Minneapolis Daily Grain Report, Nov 13, 2026. https://mymarketnews.ams.usda.gov/viewReport/3046
- Manitoba Agriculture, Manitoba Markets: Grain and Oilseed Prices, Nov 6, 2026. https://www.gov.mb.ca/agriculture/markets-and-statistics/crop-statistics/pubs/grains-2026-11-06.pdf
- USDA NASS, "Agricultural Prices," released Oct 30, 2026. https://esmis.nal.usda.gov/sites/default/release-files/796128/agpr1026.txt
- USDA NASS, "Small Grains 2026 Summary," released Sep 30, 2026. https://esmis.nal.usda.gov/sites/default/release-files/796086/smgr0926.txt
- USDA World Agricultural Outlook Board, "World Agricultural Supply and Demand Estimates," WASDE-677, Nov 10, 2026. https://esmis.nal.usda.gov/sites/default/release-files/796142/wasde1126.txt
- Franz-Warkentin, P., The Western Producer, "Statistics Canada crop production report," Sep 16, 2026 (table of Statistics Canada model-based principal field crop estimates). https://www.producer.com/?p=328554
- Statistics Canada, The Daily, "Production of principal field crops, November 2025," Dec 4, 2025. https://www150.statcan.gc.ca/n1/daily-quotidien/251204/dq251204a-eng.htm
- Haugen, R., NDSU Extension, "Projected 2026 Crop Budgets: East Central North Dakota," EC1658, Feb 2026. https://www.ndsu.edu/agriculture/sites/default/files/2026-02/ec1658.pdf
- Haugen, R., NDSU Extension, "Projected 2026 Crop Budgets: South Valley North Dakota," EC1660, Feb 2026. https://www.ndsu.edu/agriculture/sites/default/files/2026-02/ec1660.pdf
- Quinn, R., DTN Retail Fertilizer Trends, "Retail Fertilizer Prices Mixed During First Week of November," Nov 11, 2026. https://www.dtnpf.com/agriculture/web/ag/crops/article/2026/11/11/retail-fertilizer-prices-mixed-first
- Karki, D., J. Clark, A. Bly and P. Sexton, SDSU Extension, "Updating Oat Nitrogen Fertilizer Rate Recommendations in South Dakota," P-00367, Jan 2026. https://extension.sdstate.edu/sites/default/files/2026-01/P-00367.pdf
- University of Nebraska-Lincoln, Center for Agricultural Profitability, "2026 UNL #055 Oats, Dryland, No Till," 2026. https://cap.unl.edu/sites/unl.edu.ianr.agecon.center-for-ag-profitability/files/media/file/%23055%20Oats%2C%20Dryland%2C%20No%20Till_2026.pdf
- Crop Root Zone, "Oil Sunflowers Are Bid $25.90 at Enderlin, 23% Over Last Year. On NDSU's East Central Budget That Returns $159 an Acre, Ahead of Soybeans at $109, Canola at $61 and Spring Wheat at a $48 Loss," TRZ-0315, Oct 28, 2026.
Disclosures
Crop Root Zone is an independent publication. Nothing here is investment advice. Market calls, where included, reflect the editors' own read and are not a recommendation to buy or sell any security.
Southern Illinois' Wheat and Double-Crop Soybean Acre Led Full-Season Soybeans by $105 in September's Budget. At a $5.80 New-Crop Wheat Bid It Trails by $20, and the Second Crop Has to Make 50 Bushels Instead of 39.
farmdoc's 2027 budget priced wheat at $7.30. On November 11 July 2027 wheat settled at $6.25¼ and southern Illinois river elevators bid $5.80 to $5.85 for new crop. That takes $153 an acre off the two-crop system, $130 of it wheat, and $28 off full-season soybeans. The system ties soybeans again at $6.03 cash wheat, about $6.48 on the July board, or at 49.7 bushels of double-crop beans. Nitrogen would have to fall to about $489 a ton of urea to close the gap by itself. Wheat already drilled should stay, and an 85% revenue policy written at $7.54 covers most of the difference.
The University of Illinois published its 2027 crop budgets in late summer with wheat at $7.30 a bushel. On that price, a southern Illinois acre of wheat followed by double-crop soybeans returned $309 before land cost, against $204 for full-season soybeans and $135 for corn (farmdoc, Aug 2026; farmdoc daily, Sep 8, 2026) [1][2]. On Wednesday, November 11, July 2027 Chicago wheat settled at $6.25¼, and barge-loading elevators on the southern Illinois River bid $5.80¼ to $5.85¼ for June and July delivery (USDA AMS, Nov 11, 2026) [4]. Country elevators in southwest Illinois bid $5.60¼ [4]. At the low river bid the same budget returns $156 for the two-crop acre and $176 for full-season soybeans. The wheat is already seeded. What the board has changed is how much double-crop soybean yield the acre now needs, what wheat price puts it back in front, and how much of the answer the wheat's fertilizer bill can still move.
1. The budget: two crops, $309 an acre, at $7.30 wheat
What's new: farmdoc's southern Illinois budget carries four columns that matter here: corn after soybeans, soybeans after corn, wheat, and double-crop soybeans planted behind the wheat [1]. The double-crop column has no land charge and no ARC/PLC payment. Both are booked on the wheat. The wheat price is $7.30 in every region of the state [3].
Evidence:
| 2027, southern Illinois ($/acre) | Corn | Full-season soybeans | Wheat | Double-crop soybeans | Wheat + double-crop |
|---|---|---|---|---|---|
| Yield (bu/acre) | 199 | 60 | 87 | 48 | |
| Price ($/bu) | 5.00 | 12.00 | 7.30 | 12.00 | |
| Crop revenue | 995 | 720 | 635 | 576 | 1,211 |
| ARC/PLC | 16 | 16 | 16 | 0 | 16 |
| Fertilizers | 264 | 77 | 140 | 70 | 210 |
| Pesticides | 110 | 72 | 44 | 65 | 109 |
| Seed | 132 | 80 | 62 | 60 | 122 |
| Total direct costs | 556 | 248 | 276 | 208 | 484 |
| Power costs | 195 | 178 | 166 | 145 | 311 |
| Overhead costs | 125 | 106 | 79 | 44 | 123 |
| Total non-land costs | 876 | 532 | 521 | 397 | 918 |
| Operator and land return | 135 | 204 | 130 | 179 | 309 |
| Land cost | 186 | 186 | 186 | 0 | 186 |
| Farmer return | −51 | 18 | −56 | 179 | 123 |
Basis: $/acre; operator and land return is gross revenue less non-land costs. Corn is corn after soybeans; full-season soybeans are soybeans after corn. Source: farmdoc, 2027 Crop Budgets, Table 4, Southern Illinois, original release Aug 2026 [1]. The last column is a Crop Root Zone sum of the wheat and double-crop columns. farmdoc daily reports the same $309 [2].
Wheat by itself loses to both alternatives, as it has in every year from 2003 through 2025 in farmdoc's records [2]. The second crop is what makes the acre. The system averaged $363 an acre from 2021 through 2025, against $293 for corn and $274 for soybeans, and much of that came from a $733 return in 2022 [2].
The acreage is small and concentrated. Illinois planted 610,000 acres of wheat for 2026, down from 780,000 in 2023. Between 60% and 75% of it sits in the four southernmost crop reporting districts, and farms in the state's farm business association double-cropped more than 90% of their wheat acres from 2021 through 2025 [2].
The budget also shows where the idea stops. On central Illinois high-productivity farmland, farmdoc has wheat at 92 bushels and double-crop soybeans at 49. The pair returns $350 before land against $407 for 77-bushel soybeans [1]. The system was $57 behind there before any repricing.
2. The reprice: wheat lost $1.50 of cash price and soybeans lost 47 cents
What's new: July 2027 Chicago wheat settled at $7.53 on September 4 [12]. It settled at $6.25¼ on November 11, down $1.27¾ [4]. December 2027 corn settled at $4.86 and November 2027 soybeans at about $11.88¼ [4][5]. Both are a few cents under the November 10 settlements we used on Wednesday ($4.90½ and $11.93¾) [11].
Evidence:
| New-crop price, Nov 11, 2026 | Futures ($/bu) | Basis (¢/bu) | Cash ($/bu) | farmdoc budget ($/bu) | Difference ($/bu) |
|---|---|---|---|---|---|
| Wheat, July 2027, southern Illinois River barge bid | 6.25¼ | −45 | 5.80¼ | 7.30 | −1.50 |
| Wheat, July 2027, southwest Illinois country bid | 6.25¼ | −65 | 5.60¼ | 7.30 | −1.70 |
| Soybeans, November 2027† | 11.88¼ | −35* | 11.53 | 12.00 | −0.47 |
| Corn, December 2027 | 4.86 | −25* | 4.61 | 5.00 | −0.39 |
Basis: CBOT settlements and delivered bids for June–July 2027 wheat. Source: USDA AMS Illinois Grain Bids, Nov 11, 2026 [4]; farmdoc [1]. *Assumed basis, the same 35 and 25 cents we used for central Illinois on November 11 [11]. No harvest-2027 corn or soybean bid is posted in the report. †November 2027 soybeans are not in the AMS relay. The figure is derived from a delayed quote of 1184.75¢, down 3.50¢, stamped 13:11 UTC on Nov 12 [5]. The same method reproduces the AMS settlements for July 2027 wheat, December 2027 corn and September 2027 soybeans exactly.
The wheat basis is a posted bid. The river range was 45 to 40 cents under July, so the table uses the lower river bid, and a year ago the same elevators averaged $5.35 [4]. An Illinois River elevator at Naples was bidding $6.89 for July 2027 delivery on September 24 [13]. If that bid is comparable, the river cash market has lost about $1.05 in seven weeks.
| 2027, southern Illinois, operator and land return ($/acre) | Corn | Full-season soybeans | Wheat | Double-crop soybeans | Wheat + double-crop | System minus soybeans |
|---|---|---|---|---|---|---|
| farmdoc budget prices | 135.00 | 204.00 | 130.00 | 179.00 | 309.00 | +105.00 |
| Nov. 11 board, river wheat bid* | 57.39 | 175.95 | −0.18 | 156.56 | 156.38 | −19.57 |
| Nov. 11 board, country wheat bid* | 57.39 | 175.95 | −17.58 | 156.56 | 138.98 | −36.97 |
| After $186 land cost, river bid* | −128.61 | −10.05 | −29.62 | −19.57 |
Basis: $/acre before land cost except the last row. Source: farmdoc [1]; USDA AMS, Nov 11, 2026 [4]; FXEmpire, Nov 12, 2026 [5]. *Crop Root Zone scenarios. Yields and all costs are held at farmdoc's budget levels. Wheat = 87 × price + 16 − 521; double-crop soybeans = 48 × price − 397; full-season soybeans = 60 × price + 16 − 532; corn = 199 × price + 16 − 876. Prices are $5.8025 or $5.6025 for wheat, $11.5325 for soybeans and $4.61 for corn.
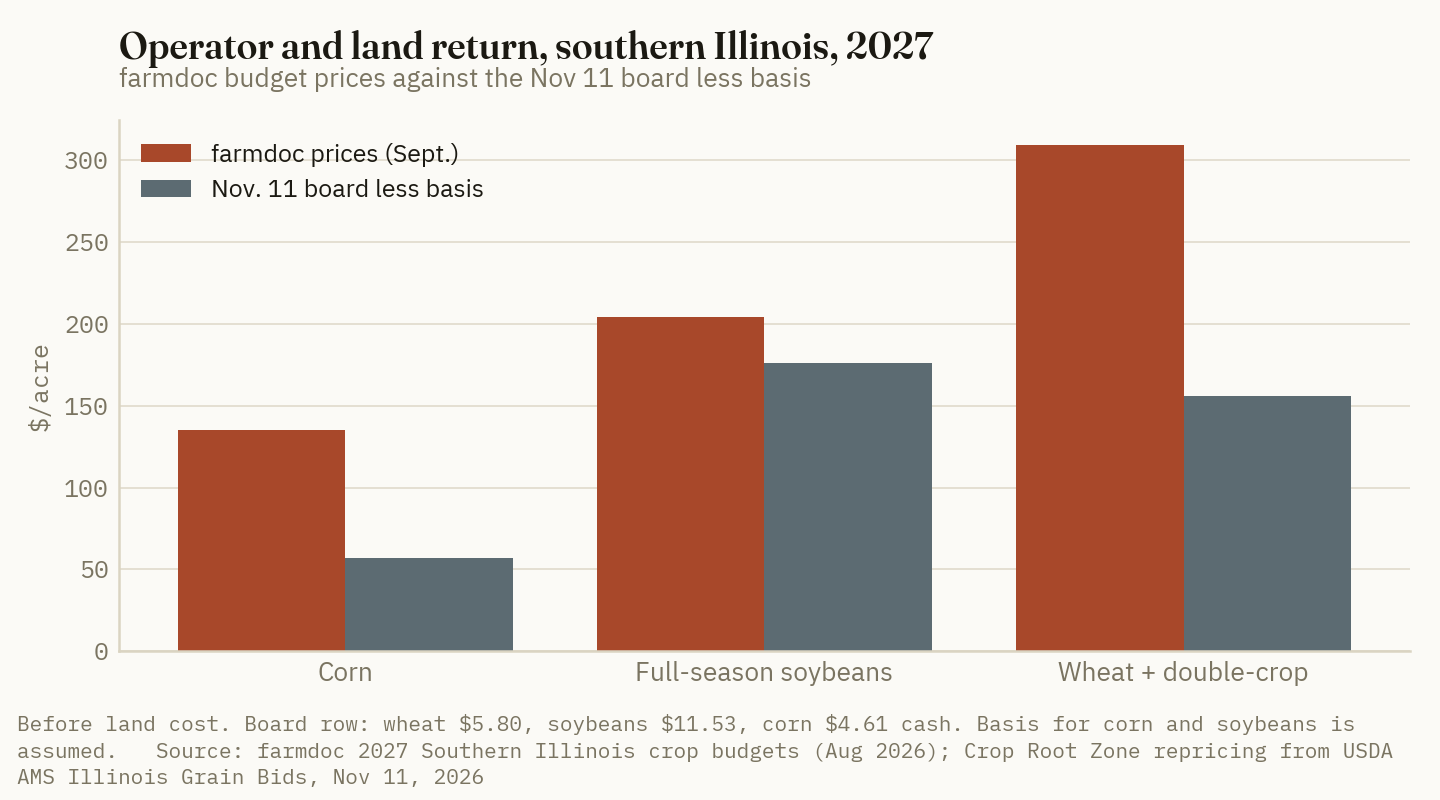
The swing is about $125 an acre. Wheat accounts for $130.28 (87 bushels times $1.4975). Soybeans give $5.61 back, because the 47-cent decline costs 60 bushels of full-season beans $28.05 and 48 bushels of double-crop beans $22.44. Wheat alone is now at break-even before land. The system still leads corn by $99.
Ground Truth: The two-crop acre is a wheat-price position, and a soybean rally works against it. Each 10 cents of wheat is worth $8.70 on this acre. Each 10 cents of soybeans is worth $6.00 to the full-season crop and $4.80 to the double crop, so a higher soybean price moves the comparison $1.20 toward full-season beans. A grower who seeded wheat in October on a $7.30 budget and priced none of it has given up $130 of a $309 return. Pricing November 2027 soybeans does not protect what is left of the system's edge. Only the July wheat contract does. Tuesday's 42-cent soybean rally [11] did nothing for this acre.
3. The break-evens: 50 bushels of double-crop beans, or $6.48 July wheat
What's new: At farmdoc's prices the double crop had to make 39.2 bushels for the system to tie full-season soybeans. That was 8.8 bushels under the 48-bushel budget yield. At the November 11 river bid it has to make 49.7.
Evidence:
| Wheat cash price ($/bu) | What it is | Break-even double-crop yield (bu/acre)* | |
|---|---|---|---|
| 5.60 | Southwest Illinois country bid, Nov. 11 | 51.2 | ██████████ |
| 5.80 | Southern Illinois River bid, Nov. 11 | 49.7 | ██████████ |
| 6.03 | Ties at the 48-bushel budget yield | 48.0 | █████████░ |
| 6.50 | 44.4 | █████████░ |
|
| 7.00 | 40.7 | ████████░░ |
|
| 7.30 | farmdoc budget price | 38.4 | ████████░░ |
Basis: southern Illinois, 87 bu/acre wheat, soybeans at $11.53 cash, costs at farmdoc budget levels. Source: Crop Root Zone calculation from farmdoc [1] and USDA AMS, Nov 11, 2026 [4]. *Yield = (60 × soybean price + 386 − 87 × wheat price) ÷ soybean price. The 39.2-bushel figure in the text uses farmdoc's $12.00 soybeans; the 38.4 here uses $11.53. Bars scale to 51.2 = 10. Storage and hauling costs that rise with yield are not adjusted.
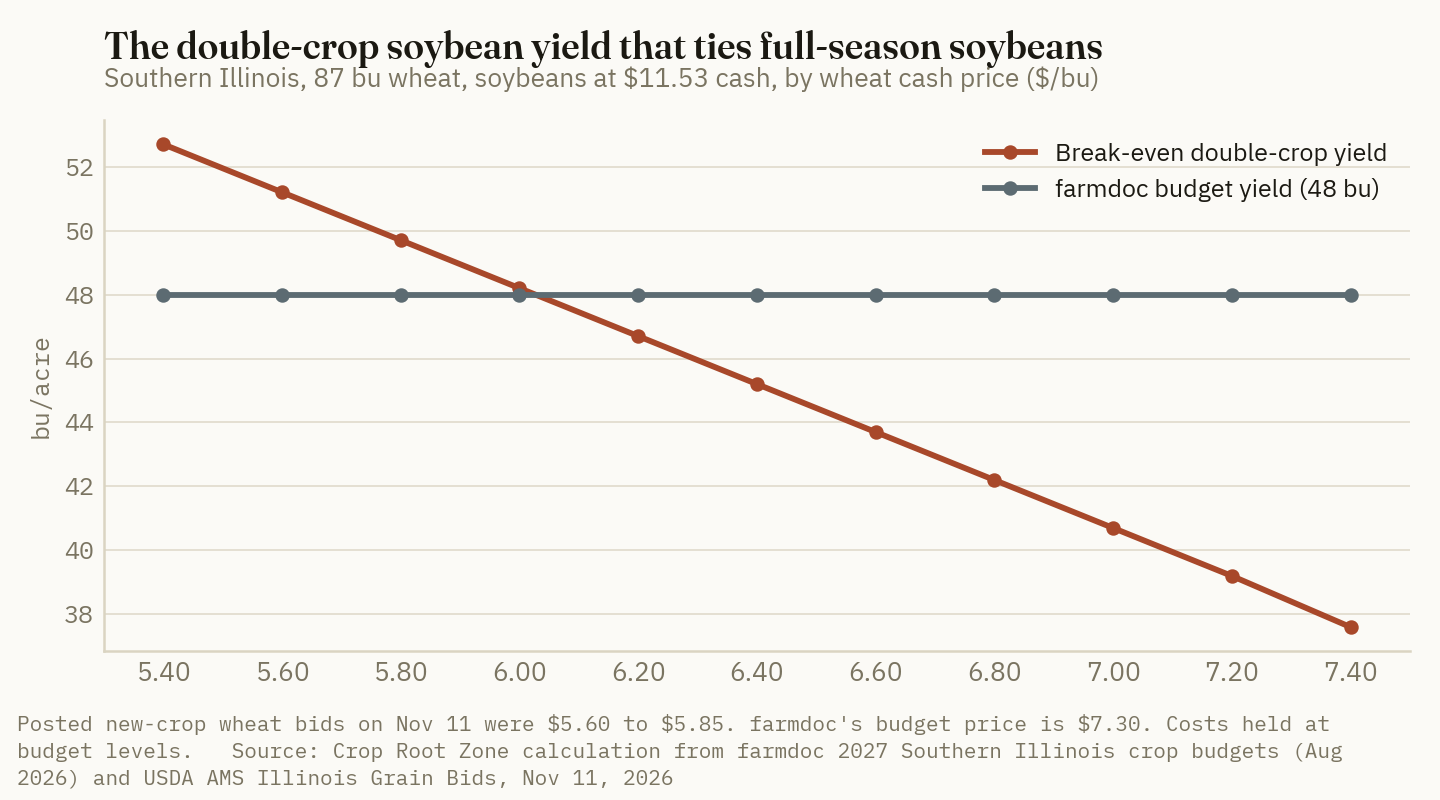
$6.48
The July 2027 wheat futures price at which southern Illinois' two-crop acre ties full-season soybeans on farmdoc's yields and costs, at a 45-cent basis. The contract settled at $6.25¼ on November 11. At the 65-cent country basis the tie is about $6.68. (Crop Root Zone calculation from farmdoc, Aug 2026, and USDA AMS, Nov 11, 2026)
The yield side is not symmetric with the risk. farmdoc's authors write that dry weather after wheat harvest "can sharply reduce double-crop soybean yields" and that occasional low yields should be expected [2]. At the November 11 prices a 40-bushel double crop leaves the system $112 behind full-season soybeans. A 56-bushel double crop puts it $73 ahead.
Kentucky's budgets reached the same place six weeks earlier, at better prices. Greg Halich's fall planting analysis used the September 25 futures close, which gave blended prices of $7.15 for wheat and $12.65 for soybeans (University of Kentucky, Sep 29, 2026) [6].
| Kentucky, 2027 crop | Wheat (bu) | Double-crop soybeans (bu) | Full-season soybeans (bu) | Two-crop net ($/acre) | Full-season net ($/acre) | Two-crop minus full-season | Break-even double-crop yield (bu) |
|---|---|---|---|---|---|---|---|
| Southwest tier, average ground | 77 | 46 | 55 | 39 | 76 | −37 | 49 |
| Southwest tier, best ground | 95 | 53 | 62 | 191 | 109 | +82 | n/a |
| Northwest tier, average ground | 70 | 46 | 55 | −7 | 76 | −83 | 53 |
| Northwest tier, best ground | 80 | 53 | 62 | 92 | 109 | −17 | 55 |
Basis: $/acre net return after cash rent of $200 (average ground) or $250 (best ground); wheat $7.15 and soybeans $12.65, blended field and storage sales at the Sept. 25, 2026 futures close. Source: G. Halich, University of Kentucky, Sep 29, 2026 [6]. No break-even is given where the two-crop acre already leads.
Halich's conclusion at $7.15 wheat was that double-cropping paid only on the best ground in the southwest tier [6]. We did not reprice his table, because the article does not state the basis behind its blended prices. The direction is not in doubt. On the 95-bushel row, a $1.00 decline in wheat removes $95 an acre, more than the $82 lead (our arithmetic).
The central Illinois column gets worse in the same way. Using the same $5.80 wheat bid, which is an assumption for that region, the pair returns $189 before land against $371 for soybeans. The double crop would need 65 bushels against a 49-bushel budget.
Ground Truth: In September the 48-bushel double-crop yield was a cushion. Now it is the target. A budget that ties at 39 bushels can absorb a late wheat harvest and a dry July. A budget that ties at 50 needs the second crop to beat its own planning yield, and farmdoc sets that yield at 80% of the full-season crop while Kentucky uses 84% to 85%. Each 10 cents of wheat moves the break-even three-quarters of a bushel. So the practical reading of $6.48 is this: below it, the system pays only for growers whose double-crop beans routinely make more than 80% of their full-season yield. Those are the growers farmdoc describes, with years of experience in the system. For a first-year wheat acre the September budget was an invitation and the November board is not.
4. The fertilizer bill: $210 against $77, and what nitrogen can still change
What's new: The two-crop acre carries $210 of fertilizer in farmdoc's budget, $140 on the wheat and $70 on the double-crop beans. Full-season soybeans carry $77 and corn $264 [1]. The bean legs are nearly equal. The difference between the system and full-season soybeans is the wheat's $140.
Evidence:
| Fertilizer line, southern Illinois 2027 | $/acre | Bushels of wheat at $7.30 | Bushels of wheat at $5.80* | |
|---|---|---|---|---|
| Corn | 264 | ██████████ |
||
| Wheat + double-crop soybeans | 210 | ████████░░ |
||
| Wheat | 140 | 19.2 | 24.1 | █████░░░░░ |
| Full-season soybeans | 77 | ███░░░░░░░ |
||
| Double-crop soybeans | 70 | ███░░░░░░░ |
Basis: $/acre, farmdoc budget fertilizer lines. Source: farmdoc [1]. *Crop Root Zone calculation at the $5.8025 river bid [4]. Bars scale to corn = 10.
At $7.30, the wheat's fertilizer took 22% of an 87-bushel crop. At $5.80 it takes 28%.
farmdoc does not publish the rates behind the $140. Kentucky's budget file does. Its default entries are 100 pounds of nitrogen as urea, 35 pounds of P₂O₅ and 20 pounds of K₂O on the wheat, and 100, 75 and 60 pounds for wheat and double-crop soybeans together (University of Kentucky, Oct 8, 2026) [7]. At the file's prices that is $109 for the wheat and $154 for the system [7].
| Nitrogen source | $/ton | ¢/lb N | 100 lb N ($/acre) | Bushels of wheat at $5.80 | Basis |
|---|---|---|---|---|---|
| Urea, DTN national | 669 | 72.7 | 72.72 | 12.5 | Retail, Oct. 26–30 |
| UAN28, DTN national | 446 | 79.6 | 79.64 | 13.7 | Retail, Oct. 26–30 |
| Urea, Illinois | 770 | 83.7 | 83.70 | 14.4 | Distributor ask, FOB, Oct. 30 |
| UAN28, Illinois | 468 | 83.5 | 83.55 | 14.4 | Distributor ask, FOB, Oct. 30 |
| Urea, DTN national, a year earlier | 598 | 65.0 | 65.00 | 11.2 | Retail, Oct. 27–31, 2025 |
Basis: as stated per row. Source: DTN/Progressive Farmer, Nov 4, 2026 [8]; USDA AMS Illinois Production Cost Report, Oct 30, 2026 [9]. Cents per pound, dollars per acre and bushels are Crop Root Zone calculations (urea 46% N, UAN28 28% N). The 100-pound rate is Kentucky's budget default [7], not farmdoc's. Illinois urea ranged from $650 to $890 a ton.
We did not find DTN's survey for the first week of November when we wrote. Its latest shows DAP at $941 and potash at $510 a ton [8]. Illinois distributors asked $932 and $518 [9].
Nitrogen cannot close a $19.57 gap inside this year's prices. At 100 pounds, the price of nitrogen would have to fall 19.6 cents a pound, which is urea at about $489 a ton against $669. At 120 pounds it is about $519. Urea was $598 a year ago [8], and even that price would save only $7.72 an acre. The rate is no better a lever. A pound of urea nitrogen costs an eighth of a bushel of wheat at $5.80. Cutting 27 pounds saves the $19.57, and it pays only if it costs less than 3.4 bushels of wheat.
For scale, here is our estimate of what the $140 buys. Replacing the phosphate and potash removed by 87 bushels of wheat (about 44 and 26 pounds, on the coefficients we used in July [14]) costs about $43 at DTN's DAP and potash prices, with credit for the nitrogen in DAP. That leaves about $97 for nitrogen and sulfur. This is an estimate, not farmdoc's breakdown.
Ground Truth: The fertilizer bill changes the answer through timing more than through price. By mid-November the seed ($62 in the budget), the drilling pass and any fall phosphate and potash are spent. The repriced system trails full-season soybeans by $19.57 only when every wheat cost is still to be paid. Once more than $19.57 of the $521 is sunk, keeping the wheat is the better forward choice, and the seed alone is three times that. So no southern Illinois acre in this budget should be sprayed out and returned to full-season beans because of the board. The topdress nitrogen is the last large wheat cost still unspent, at about $73 to $84 for 100 pounds. The question for that money is whether the last 20 or 30 pounds return an eighth of a bushel each. The crop-choice question the repriced budget really answers is next October's, and at these bids its answer is no for anyone whose double-crop beans do not routinely beat 48 bushels.
5. What was locked in September: a $7.54 insurance price
What's new: The 2027 crop-insurance projected price for winter wheat in Illinois is $7.54 a bushel, with a volatility factor of 0.23. Indiana, Missouri and Ohio share the $7.54, and Kentucky and Tennessee are at $7.51 (USDA RMA, Sep 15, 2026) [10]. It was set from July 2027 wheat closes between August 15 and September 14. The sales closing date was September 30 [10].
Evidence: July 2027 wheat at $6.25¼ is 83% of the projected price [4][10].
| Revenue protection coverage level | Price trigger at full yield ($/bu, July futures)* | Guarantee at 87 bu ($/acre)* | Trigger vs. Nov. 11 settlement (¢/bu) |
|---|---|---|---|
| 75% | 5.65½ | 491.99 | −59¾ |
| 80% | 6.03¼ | 524.78 | −22 |
| 85% | 6.41 | 557.58 | +15¾ |
Basis: 2027 winter wheat, Illinois. Source: USDA RMA price discovery, Sep 15, 2026 [10]; USDA AMS, Nov 11, 2026 [4]. *Crop Root Zone calculation: coverage level × $7.54, and × 87 bushels, treating farmdoc's budget yield as the insured yield. That is our assumption. A farm's guarantee uses its own approved yield and unit structure. The harvest price is set next summer and will differ from today's board.
At 85% coverage and a full crop, the policy would pay about $13.62 an acre at the November 11 settlement, and every further cent of decline in July wheat would be made up. That puts the insured acre's wheat at an effective $5.96 cash at the river basis. The system then trails full-season soybeans by about $6, and the break-even double crop is 48.5 bushels. At 80% the trigger is 22 cents under the market, and at 75% it is 60 cents under. farmdoc's wheat budget carries a $20 crop insurance cost and does not state the coverage level [1]. We did not reach county-level data on which levels southern Illinois wheat growers bought.
Ground Truth: Two neighbors with the same wheat stand now hold different acres. The one who bought 85% revenue protection in September owns a floor near $6.41 on the July board. For that grower the comparison with full-season soybeans is close to even, and the reason to price wheat is to capture a rally above the floor. The one at 75% has no protection until $5.65 and carries the whole $130. For that grower $6.48 July wheat is the level that makes the September plan whole against soybeans, and it is 22¾ cents away. There is a consequence for next fall as well. The 2028 projected price will be discovered in August and September 2027 from the July 2028 contract, which was quoted at $6.63¾ on November 12 [5]. If the board stays where it is, next year's wheat acre will be insured about 90 cents lower than this year's, and the high guarantee that is now cushioning the 2027 crop will not be available for 2028.
What to watch: July 2027 wheat against $6.48, and against $6.41 for anyone insured at 85% [4][10]; new-crop wheat basis on the southern Illinois River, now 40 to 45 under [4]; DTN's next retail survey against $669 urea and $446 UAN28 ahead of topdress [8]; the December 10 WASDE [11]; and November 2027 soybeans, where each 10 cents up is worth $1.20 an acre more to full-season beans than to the two-crop acre.
References
- G. Schnitkey and N. Paulson, 2027 Crop Budgets (Illinois Farm Management Handbook; Table 2, Central Illinois high-productivity farmland; Table 4, Southern Illinois), farmdoc, University of Illinois, original release Aug 2026 — https://farmdoc.illinois.edu/assets/management/crop-budgets/crop_budgets_2026_Aug.pdf (linked from https://farmdoc.illinois.edu/handbook/2027-budgets-for-all-regions)
- G. Schnitkey, N. Paulson, B. Zwilling and C. Zulauf, "Wheat Double-Crop Soybean Profitability in Recent Years," farmdoc daily (16):160, University of Illinois, Sep 8, 2026 — https://farmdocdaily.illinois.edu/2026/09/wheat-double-crop-soybean-profitability-in-recent-years.html
- N. Paulson, G. Schnitkey, C. Zulauf and B. Zwilling, "Illinois Crop Budgets for 2027," farmdoc daily (16):157, University of Illinois, Sep 1, 2026 (context for the budget release; figures in this article are taken from the handbook tables in [1]) — https://farmdocdaily.illinois.edu/2026/09/illinois-crop-budgets-for-2027.html
- USDA AMS Livestock, Poultry and Grain Market News / Illinois Dept. of Agriculture Market News, Illinois Grain Bids, Nov 11, 2026 (CBOT settlements as of Nov 11, 2026: July 2027 wheat 625.25¢, December 2027 corn 486.00¢, September 2027 soybeans 1197.25¢; soft red winter wheat bids for June–July delivery: southwest country elevators 65 under July, $5.6025; South Illinois River barge-loading elevators 45 to 40 under July, $5.8025–5.8525, year-ago average $5.35) — https://www.ams.usda.gov/mnreports/ams_3192.pdf
- FXEmpire, CBOT soybean and wheat futures contract tables, delayed quotes stamped 13:11 and 13:12 UTC, Nov 12, 2026 (quotes, not settlements; November 2027 soybeans 1184.75¢, down 3.50¢; July 2028 wheat 663.75¢) — https://www.fxempire.com/commodities/zs/contracts and https://www.fxempire.com/commodities/zw/contracts
- G. Halich, "Fall 2026 Wheat Planting Decision," University of Kentucky Department of Agricultural Economics, Sep 29, 2026 — https://agecon.mgcafe.uky.edu/articles/fall-2026-wheat-planting-decision
- G. Halich, "Wheat Double-Crop Soybean Budget | 2026-2027" (spreadsheet decision aid, last updated Sep 28, 2026; default fertilizer rates and prices), University of Kentucky Department of Agricultural Economics, Oct 8, 2026 — https://agecon.mgcafe.uky.edu/articles/wheat-double-crop-soybean-budget-2026-2027
- T. Neeley, "UAN28 Continues to Lead Fertilizer Prices Higher in October's Final Week," DTN Retail Fertilizer Trends, DTN/Progressive Farmer, Nov 4, 2026 (retail survey Oct 26–30, 2026; year-ago prices) — https://www.dtnpf.com/agriculture/web/ag/crops/article/2026/11/04/uan28-continues-lead-fertilizer-week
- USDA AMS Livestock, Poultry and Grain Market News, Illinois Production Cost Report (Bi-weekly), week ending Oct 30, 2026 (distributor asking prices, FOB: urea $650–890, average $770; UAN28 average $467.86; DAP average $932.14; potash average $517.73) — https://www.ams.usda.gov/mnreports/ams_3195.pdf
- USDA Risk Management Agency, projected prices and volatility factors for the Aug 15–Sep 14, 2026 discovery period (winter wheat, sales closing Sep 30, 2026: Illinois $7.54, volatility 0.23), attachment to PM-26-056, Sep 15, 2026 — https://www.rma.usda.gov/sites/default/files/2026-09/PM-26-056-attachment.pdf
- Crop Root Zone, TRZ-0347, "USDA Cut the Corn Crop 141 Million Bushels, and Illinois Lost 88 Million of It...," Nov 11, 2026 (Nov 10 settlements for December 2027 corn and November 2027 soybeans; basis assumptions; central Illinois repricing; WASDE dates).
- Crop Root Zone, TRZ-0210, "A Kansas Winter Wheat Acre Repriced to September Retail Costs $311 and Breaks Even at 41.7 Bushels...," Sep 18, 2026 (July 2027 Chicago wheat settlement of $7.53 on Sep 4, 2026, citing M. Welch, Southern Ag Today, Sep 10, 2026).
- Crop Root Zone, TRZ-0229, "A Wheat Seed Treatment Needs Two-Thirds of a Bushel to Pay at Today's Bids...," Sep 24, 2026 (CGB Naples, Ill., July 2027 soft red winter wheat bid of $6.89, citing Farmbucks, Sep 24, 2026).
- Crop Root Zone, TRZ-0055, "The Wheat You Seed in September Is a Soybean Decision — and Beans Just Hit a Two-Year High," Jul 30, 2026 (grain nutrient-removal coefficients: wheat 0.50 lb P₂O₅ and 0.30 lb K₂O per bushel).
Disclosures
Crop Root Zone is an independent publication. Nothing here is investment advice. Market calls, where included, reflect the editors' own read and are not a recommendation to buy or sell any security.
USDA Cut the Corn Crop 141 Million Bushels, and Illinois Lost 88 Million of It. The Carryout Landed 68 Million Under the Trade. The 2027 Board Still Pays Soybeans About $103 an Acre More Than Corn in Central Illinois.
November's WASDE cut corn yield 1.6 bushels to 179.6 and ending stocks to 1.758 billion (10.8% of use), lowered the corn price another 10 cents to $4.60, and took soybeans to 300 million bushels and $12.10. December corn rose 9¾ cents and November soybeans 42¼. December 2027 corn at $4.90½ against November 2027 soybeans near $11.94 is a 2.43 ratio. On farmdoc's 2027 budget, corn needs about $5.32 on the board to tie soybeans, 42 cents above the close and the same gap as October 12. The report paid both 2027 crops about $17 an acre and did not change which one wins.
USDA lowered the 2026 U.S. corn yield 1.6 bushels to 179.6 bushels per acre on Tuesday, November 10, cut the crop 141 million bushels to 15.893 billion, and took 2026/27 ending stocks down 91 million to 1.758 billion (USDA WASDE-677, Nov 10, 2026) [1]. The trade had expected 180.5 bushels and a 1.826-billion-bushel carryout (DTN/Progressive Farmer, Nov 6 and Nov 10, 2026) [4][5]. Soybean yield went up 0.2 bushel to a record 53.3, but the survey had looked for 53.6, and ending stocks fell 15 million to 300 million against an expected 336 million [1][5]. December corn settled at $4.49, up 9¾ cents. November soybeans settled at $12.24½, up 42¼ (USDA AMS, Nov 10, 2026; UkrAgroConsult, Nov 11, 2026) [6][7]. One month ago the same reports sent corn limit-down for a time [12]. This month's reports handed back about a third of October's 282-million-bushel carryout increase. They moved the 2027 contracts much less than the 2026 ones, and they did not change the corn-versus-soybean arithmetic for next spring.
1. Corn: 141 million bushels off the crop, 91 million off the carryout
What's new: Harvested area stayed at 88.5 million acres, so the whole production change is yield. USDA took 25 million bushels off feed and residual use and 25 million off exports, and left ethanol at 5.650 billion. The season-average farm price was lowered 10 cents to $4.60, the second 10-cent cut in two months [1].
Evidence:
| Corn (million bu) | 2025/26 est. | 2026/27 Oct. | 2026/27 Nov. | Nov. vs. Oct. |
|---|---|---|---|---|
| Harvested area (mil acres) | 90.9 | 88.5 | 88.5 | 0.0 |
| Yield (bu/acre) | 186.5 | 181.2 | 179.6 | −1.6 |
| Beginning stocks | 1,551 | 2,095 | 2,095 | 0 |
| Production | 16,964 | 16,034 | 15,893 | −141 |
| Imports | 31 | 25 | 25 | 0 |
| Total supply | 18,546 | 18,154 | 18,013 | −141 |
| Feed and residual | 6,118 | 6,000 | 5,975 | −25 |
| Food, seed and industrial | 6,904 | 7,005 | 7,005 | 0 |
| — of which ethanol and by-products | 5,548 | 5,650 | 5,650 | 0 |
| Exports | 3,429 | 3,300 | 3,275 | −25 |
| Total use | 16,451 | 16,305 | 16,255 | −50 |
| Ending stocks | 2,095 | 1,849 | 1,758 | −91 |
| Stocks-to-use* | 12.7% | 11.3% | 10.8% | −0.5 pt |
| Season-average farm price ($/bu) | 4.16 | 4.70 | 4.60 | −0.10 |
Basis: U.S. marketing year beginning September 1; million bushels unless noted. Source: USDA WASDE-677, Nov 10, 2026 [1]. *Stocks-to-use is a Crop Root Zone calculation (ending stocks ÷ total use).
Ending stocks took 65% of the production cut (91 of 141). Feed and exports took 18% each. The feed line is behaving as we described in October: USDA has kept feed and residual near 37.5% of the crop all fall, and 5.975 billion is 37.6% of 15.893 billion [1][12]. The export cut puts the figure back at September's 3.275 billion and reverses the 25 million USDA added in October. USDA's text ties it to "shipments and sales to date" [1].
| 2026/27 | Oct. WASDE | Trade avg. | Trade range | Nov. WASDE | vs. trade avg. | vs. Oct. |
|---|---|---|---|---|---|---|
| Corn yield (bu/acre) | 181.2 | 180.5 | 173.2–185.5 | 179.6 | −0.9 | −1.6 |
| Corn production (mil bu) | 16,034 | 15,944 | 15,344–16,203 | 15,893 | −51 | −141 |
| Corn ending stocks (mil bu) | 1,849 | 1,826 | 1,698–1,956 | 1,758 | −68 | −91 |
| Soybean yield (bu/acre) | 53.1 | 53.6 | 53.1–55.0 | 53.3 | −0.3 | +0.2 |
| Soybean production (mil bu) | 4,562 | 4,601 | 4,566–4,725 | 4,574 | −27 | +12 |
| Soybean ending stocks (mil bu) | 315 | 336 | 280–363 | 300 | −36 | −15 |
Basis: pre-report survey averages and ranges as published in DTN's tables. Source: USDA WASDE-677, Nov 10, 2026 [1]; DTN/Progressive Farmer, Nov 6 and Nov 10, 2026 [4][5]. Difference columns are Crop Root Zone calculations. The text of DTN's Nov 6 preview gives slightly different production averages (about 15,974 and 4,604) than its tables; we used the tables, which DTN repeated on Nov 10.
Every one of the six numbers came in on the tight side of the trade average. None fell outside the range of guesses.
The price line is the odd one. Stocks went down and so did the price. In September USDA paired a 1.567-billion-bushel carryout with $4.80. In October it paired 1.849 billion with $4.70 [12]. Now it pairs 1.758 billion with $4.60 [1].
Ground Truth: USDA's corn price is following the board down, and at $4.60 it has not caught up. On October 12 the December-through-July contracts averaged $4.97 and USDA's $4.70 sat 27 cents under them [12]. On November 10, after the rally, the same four contracts settled at $4.49, $4.61½, $4.69¾ and $4.77¾ [6]. They average $4.65, so $4.60 is only 5 cents under. Iowa's state-average cash bid that day was $4.10, 39 cents under December [6]. Part of the difference is corn that was forward-sold in summer at higher prices, which counts in USDA's average. Even so, if the October relationship held, the price would be near $4.38 (our arithmetic, not USDA's method). Unless the board gains another 20 cents or so, expect the December 10 WASDE to cut the corn price again. That would be a third cut, on a balance sheet that just got tighter. A grower budgeting stored corn at $4.60 is using a number that is 50 cents above Iowa's cash bid.
2. The yield: Illinois gave up 8 bushels and Minnesota found 9
What's new: NASS cut Illinois from 208 bushels to 200. It cut Indiana 5 bushels to 195, Michigan 10 to 170, Missouri 5 to 176 and Nebraska 4 to 184. It raised Minnesota 9 bushels to a record 204. Iowa stayed at 219 for a third month, and Ohio stayed at 200 (USDA NASS Crop Production, Nov 10, 2026) [2].
Evidence: Harvested area did not change in any state between the October and November reports. So each state's production change is its yield change times its area [2][3].
| State | Oct. 1 yield | Nov. 1 yield | Change | Bushels (mil)* | |
|---|---|---|---|---|---|
| Illinois | 208 | 200 | −8 | −87.6 | ██████████ |
| Nebraska | 188 | 184 | −4 | −38.4 | ████░░░░░░ |
| Indiana | 200 | 195 | −5 | −25.8 | ███░░░░░░░ |
| Michigan | 180 | 170 | −10 | −19.5 | ██░░░░░░░░ |
| Missouri | 181 | 176 | −5 | −17.4 | ██░░░░░░░░ |
| North Dakota | 132 | 129 | −3 | −13.4 | ██░░░░░░░░ |
| Kansas | 125 | 124 | −1 | −6.6 | █░░░░░░░░░ |
| Iowa | 219 | 219 | 0 | 0.0 | |
| Ohio | 200 | 200 | 0 | 0.0 | |
| Wisconsin | 182 | 184 | +2 | +6.2 | █░░░░░░░░░ |
| South Dakota | 151 | 153 | +2 | +11.7 | █░░░░░░░░░ |
| Minnesota | 195 | 204 | +9 | +74.7 | █████████░ |
| United States | 181.2 | 179.6 | −1.6 | −140.5 |
Basis: corn for grain, bushels per harvested acre. Source: USDA NASS Crop Production, Oct 9 and Nov 10, 2026 [2][3]. *Crop Root Zone calculation from NASS state production in the two reports. Bars show the size of the change, up or down, scaled to Illinois.
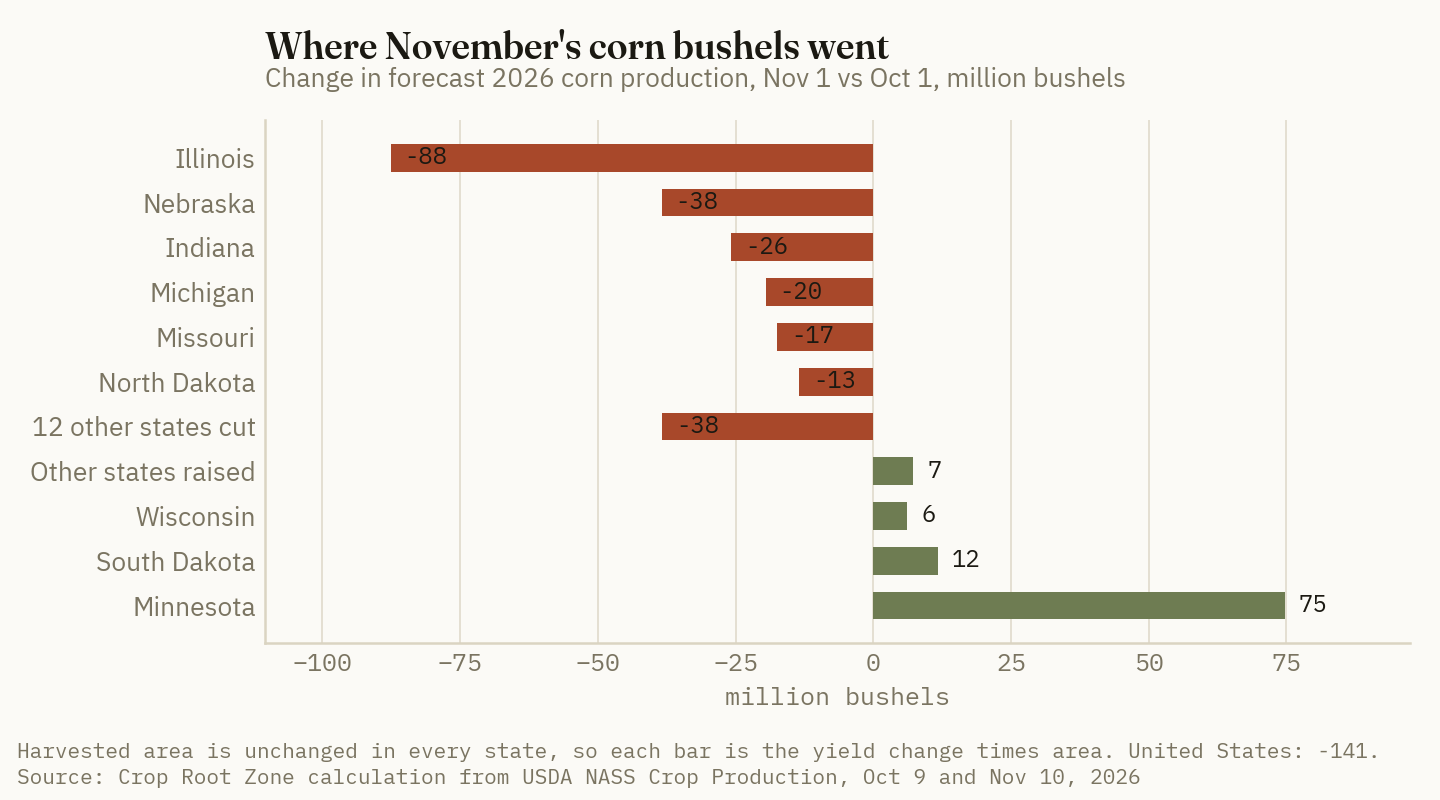
The net cut of 141 million hides a larger move. Eighteen states were lowered by a combined 240 million bushels. Minnesota, South Dakota, Wisconsin and a few small states were raised by 100 million (our sums from the NASS tables [2][3]). Illinois is 36% of the gross cut and 62% of the net. Illinois, Indiana, Michigan and Missouri together lost 150 million bushels.
Illinois has now been 209 in September, 208 in October and 200 in November [12][2]. Its crop of 2.190 billion bushels is 153 million smaller than last year's [2]. Nebraska is the state we flagged on October 12 as the most likely to be revised again, after NASS raised it 11 bushels in a month when its harvest was running late [12]. It went 177, 188, 184. A StoneX economist described the season to one farm broadcaster as "really a roller coaster in USDA's yields this year" (The Bullet, Nov 10, 2026) [8].
The forecast is still not final. NASS says 74% of corn was harvested on November 1, three points behind average [2]. The crop-progress figure for November 8 was 81%, five points behind (USDA Crop Progress as relayed by UkrAgroConsult, Nov 11, 2026) [7]. NASS states that there is a 90% chance final corn production falls between 15.5 and 16.3 billion bushels [2]. That band is about 800 million bushels wide, close to half of the projected carryout. The final figure comes in NASS's annual summary in January [2]. The January WASDE is scheduled for January 12 [1].
Ground Truth: November moved the corn from east to north, and basis should follow. The 150 million bushels that came out of Illinois, Indiana, Michigan and Missouri came out of the region that feeds the river terminals and the eastern processors. The 75 million added in Minnesota sits where the outlets are ethanol plants and the rail to the Pacific Northwest. Iowa's average bid was 39 cents under December on November 10, against 41 under on November 5 [6][13]. We would expect basis in central and eastern Illinois to firm against that Iowa number through winter, and southern Minnesota to lag it. For a grower in the eastern Corn Belt holding unpriced corn in an owned bin, that is a reason to sell the futures side on a rally like Tuesday's and wait on the basis side. It is the storage route we priced on November 6 [13], and the yield map now favors it more in Illinois than in Iowa.
3. Soybeans: a record yield that was smaller than the trade expected
What's new: Production rose 12 million bushels to 4.574 billion. Exports were raised 25 million to 1.720 billion "based on larger supplies and early season export pace," seed use rose 3 million, and crush stayed at 2.780 billion. Ending stocks fell to 300 million. The season-average price rose 10 cents to $12.10. Soybean meal stayed at $340 a short ton and soybean oil was cut 2 cents to 68 cents a pound [1].
Evidence:
| Soybeans (million bu) | 2025/26 est. | 2026/27 Oct. | 2026/27 Nov. | Nov. vs. Oct. |
|---|---|---|---|---|
| Harvested area (mil acres) | 80.4 | 85.9 | 85.9 | 0.0 |
| Yield (bu/acre) | 53.0 | 53.1 | 53.3 | +0.2 |
| Beginning stocks | 325 | 315 | 315 | 0 |
| Production | 4,261 | 4,562 | 4,574 | +12 |
| Imports | 22 | 25 | 25 | 0 |
| Total supply | 4,608 | 4,902 | 4,914 | +12 |
| Crushings | 2,646 | 2,780 | 2,780 | 0 |
| Exports | 1,515 | 1,695 | 1,720 | +25 |
| Seed | 75 | 73 | 76 | +3 |
| Residual | 57 | 39 | 38 | −1 |
| Total use | 4,293 | 4,587 | 4,614 | +27 |
| Ending stocks | 315 | 315 | 300 | −15 |
| Stocks-to-use* | 7.3% | 6.9% | 6.5% | −0.4 pt |
| Season-average farm price ($/bu) | 10.50 | 12.00 | 12.10 | +0.10 |
Basis: U.S. marketing year beginning September 1. Source: USDA WASDE-677, Nov 10, 2026 [1]. *Crop Root Zone calculation.
The state changes were as lopsided as corn's, and they ran along the same line. Illinois was cut 4 bushels to 64, which took out 41.7 million bushels. Kansas, Missouri and Arkansas lost another 36 million between them. Minnesota was raised 5 bushels to a record 54, adding 36.7 million. Iowa went up 2 to a record 65, and Nebraska and South Dakota up 3 each. Those four states added 88 million (our calculation from NASS state tables [2][3]).
The trade was leaning the other way. The survey average was 53.6 and the high guess was 55.0 [4]. One report said the market had been trading rumors of a national yield near 55 [8]. January soybeans had fallen below $12 the week before the report for the first time since early August [4]. Against that position, a 0.2-bushel increase and a 300-million-bushel carryout was a relief. The 42¼-cent gain took November soybeans back to $12.24½, which is still about 70 cents under the October 9 close of $12.92 to $12.94 [6][7][12].
The export line carries the balance sheet. USDA now has shipments 13.5% above last year's 1.515 billion [1]. On October 15 we measured how much of the then 1.695-billion-bushel forecast was still unsold [15]. USDA has since raised the target by 25 million bushels. We did not reach USDA's weekly export sales data for this piece and cannot say how far commitments have moved since. USDA did announce new sales to Mexico on Tuesday of 150,000 tons of soybeans and 312,700 tons of corn [7].
Ground Truth: At 6.5% of use, the soybean carryout now depends on the export forecast. Each 25 million bushels that exports fall short of 1.720 billion adds about half a point to stocks-to-use (25 ÷ 4,614). The whole 36-million-bushel gap between USDA and the trade average is smaller than two such revisions. For a grower with unsold 2026 soybeans, Tuesday was a 42-cent rally that depends on a forecast USDA has raised two months running. Section 4 shows that the board pays nothing to carry those bushels past July. We would treat the rally as a chance to sell old-crop soybeans, not as a reason to hold them.
4. The board: old crop took the report, and 2027 took less than half of it in soybeans
What's new: December 2026 corn gained 9¾ cents and December 2027 gained 7¼. November 2026 soybeans gained 42¼ cents and January 39¾. September 2027 soybeans, the nearest 2027 new-crop month in the public relay we use, gained 22½ [6][7][14].
Evidence:
| CBOT settlement, Nov 10, 2026 | $/bu | Change on the day | Dollars per acre* |
|---|---|---|---|
| Corn, Dec 2026 | 4.49 | +9¾¢ | +17.51 at 179.6 bu |
| Corn, Mar 2027 | 4.61½ | +9¼¢ | |
| Corn, Jul 2027 | 4.77¾ | n/a | |
| Corn, Dec 2027 | 4.90½ | +7¼¢ | +17.76 at 245 bu |
| Soybeans, Nov 2026 | 12.24½ | +42¼¢ | +22.52 at 53.3 bu |
| Soybeans, Jan 2027 | 12.28 | +39¾¢ | |
| Soybeans, Jul 2027 | 12.48 | n/a | |
| Soybeans, Sep 2027 | 11.99 | +22½¢ | +17.33 at 77 bu |
| Soybeans, Nov 2027 | 11.93¾† | n/a |
Basis: CBOT settlement prices. Source: USDA AMS Iowa Daily Cash Grain Bids, Nov 10, 2026 (settlements) [6]; UkrAgroConsult, Nov 11, 2026 (daily changes for nearby contracts) [7]; Crop Root Zone TRZ-0343 for the Nov 9 settlements of December 2027 corn (483.25¢) and September 2027 soybeans (1176.50¢), from USDA AMS [14]. *Crop Root Zone calculation: the day's change times USDA's 2026 national yield for 2026 contracts and farmdoc's 2027 central Illinois budget yield for 2027 contracts [1][10]. †Not in the AMS relay. Derived from FXEmpire's delayed quote of 1191.25¢, down 2.50¢ on the day, stamped 13:04 UTC on Nov 11 [9]. The same method reproduces the AMS settlements for December 2027 corn and September 2027 soybeans exactly. We could not find the Nov 9 settlement for November 2027 soybeans, so its change on report day is not shown.
2.43
November 2027 soybeans divided by December 2027 corn at the November 10 settlements ($11.93¾ ÷ $4.90½). The 2026 contracts stand at 2.73. The 2027 ratio was 2.46 on October 12. (Crop Root Zone calculation from USDA AMS, Nov 10, 2026, and FXEmpire, Nov 11, 2026)
The two curves have opposite shapes. Corn pays to wait: July 2027 is 28¾ cents over December 2026, and December 2027 is 41½ cents over [6]. Soybeans pay to wait only until summer. July 2027 is 20 cents over January, and November 2027 is about 54 cents under July [6][9].
The report also did not repair much. December corn settled at $5.36¾ on September 22 [12]. It was $4.39¼ on November 9, by subtraction from Tuesday's settlement and change [6][7]. Tuesday recovered a tenth of that 97½-cent fall. DTN noted before the report that December corn was on track for a sixth straight weekly loss [4].
Since our October 12 quotes, December 2027 corn has lost 21½ cents and November 2027 soybeans about 68¼ cents [12][6][9]. On farmdoc's 2027 yields of 245 and 77 bushels, those losses are $52.68 an acre for corn and $52.55 for soybeans.
Ground Truth: The market is giving corn and soybeans the same dollars per acre in 2027, up and down. A month of losses took about $53 an acre from each. Tuesday's rally returned about $17 to each, using September soybeans as the stand-in for November. That is why a bullish report for both crops left the planting choice where it was. It also says something about soybeans that the old-crop rally hides. The November 2027 contract is 54 cents under July 2027 and has fallen 68 cents in a month when the 2026/27 carryout got smaller. The deferred contract is already pricing the acres that Section 5's arithmetic points to. The 2026 crop moved 5.7 million acres into soybeans and 1.9 million out of corn [1]. A second year of that is what a 54-cent inverse looks like.
5. The 2027 decision: soybeans by about $103 an acre, the same as a month ago
What's new: farmdoc's 2027 budget for central Illinois high-productivity farmland has not been revised since September 1. It assumes 245 bushels of corn at $5.00 and 77 bushels of soybeans at $12.00, with farmer returns of $36 and $86 an acre after $321 of cash rent (farmdoc daily, Sep 1, 2026) [10]. We repriced it to the November 10 board, as we did on October 12 [12].
Evidence:
| 2027, central Illinois high-productivity farmland | Corn price ($/bu) | Corn return ($/acre) | Soybean price ($/bu) | Soybean return ($/acre) | Soybeans minus corn ($/acre) |
|---|---|---|---|---|---|
| farmdoc budget, Sept. 1 | 5.00 | 36.00 | 12.00 | 86.00 | 50.00 |
| Oct. 12 board less assumed basis* | 4.87 | 4.15 | 12.27 | 106.79 | 102.64 |
| Nov. 10 board less assumed basis* | 4.66 | −48.53 | 11.59 | 54.24 | 102.76 |
| USDA's 2026/27 prices applied to 2027* | 4.60 | −62.00 | 12.10 | 93.70 | 155.70 |
| Corn price that ties Nov. 10 soybeans* | 5.07 | 54.24 | 11.59 | 54.24 | 0.00 |
Basis: $/acre after all costs including cash rent. Source: farmdoc daily, Sep 1, 2026 [10]; USDA AMS, Nov 10, 2026 [6]; FXEmpire, Nov 11, 2026 [9]; October 12 row from TRZ-0271 [12]. *Crop Root Zone scenarios. Corn return = 245 × price + 17 − 885 − 321; soybean return = 77 × price + 17 − 534 − 321. The non-land costs ($885 and $534) and the $17 ARC/PLC payment are the budget lines we read from farmdoc's PDF edition for TRZ-0271; the web edition's tables are images and we did not re-read them this session. The basis rows subtract 25 cents from December 2027 corn and 35 cents from November 2027 soybeans. That is our assumption, not a posted bid. Prices are shown rounded; returns use $4.655 and $11.5875. USDA has published no 2027/28 price, so the fourth row is a what-if.
The tie price of $5.07 cash is $5.32 on the December 2027 board at our basis. Tuesday's settlement was $4.90½, 42 cents short. On October 12 the same calculation asked for $5.54 against a $5.12 quote, also 42 cents short. In ratio terms, corn ties soybeans in this budget when November soybeans are about 2.24 times December corn. The board is at 2.43.
Against farmdoc's all-cost break-evens of $4.92 for corn and $11.10 for soybeans [10][12], corn at the November 10 board is 27 cents under and soybeans are 49 cents over. Each 10 cents of corn price is worth $24.50 on this acre. Each 10 cents of soybean price is worth $7.70.
Fertilizer does not close the gap. DTN's survey for October 26–30 has anhydrous at $1,007 a ton, up 19% from a year earlier and the highest since early July. That is 61 cents a pound of nitrogen. Urea is $669, UAN28 $446, DAP $941 and potash $510 (DTN/Progressive Farmer, Nov 4, 2026) [11]. A ton of anhydrous costs 216 bushels of 2027 corn at $4.655 cash. farmdoc's budget carries $263 an acre of fertilizer for corn and $77 for soybeans [12]. At an illustrative 180 pounds of nitrogen, the anhydrous alone is about $110 an acre.* For corn to tie soybeans through nitrogen cost alone, that $110 would have to fall to about $7.
*Crop Root Zone estimate. The 180-pound rate is ours, for illustration, and is not farmdoc's budget rate, which we did not verify. $102.76 ÷ 180 lb = 57 cents a pound of N against a 61-cent price. DTN's survey for the first week of November was not available when we wrote.
Ground Truth: The November report made 2026 corn and soybeans worth more and left the 2027 choice unchanged. On rotation acres that could go either way, soybeans lead by about $103 an acre in this budget. That lead has held through a $53-an-acre decline and a $17-an-acre rally. Nitrogen cannot change it, because the gap is as large as the whole anhydrous bill. Only the corn price can. Two board levels are worth writing down. December 2027 at about $5.17 gives corn its all-cost break-even of $4.92 at a 25-cent basis. About $5.32 ties soybeans at today's soybean price. Tuesday's close is 27 and 42 cents short of them. Until the first is on offer, fall anhydrous on a swing acre commits that acre to the crop that is behind. The soybean side has its own level. November 2027 breaks even near $11.45 on the board ($11.10 plus a 35-cent basis), 49 cents under Tuesday's settlement, and the contract has lost 68 cents in a month. A grower moving acres to soybeans on this arithmetic should price some of the 2027 crop while the cushion is there. Everyone else is reading the same budget.
What to watch: the December 10 WASDE, for the corn price and for whether the export lines move again [1]; weekly soybean export sales against 1.720 billion bushels; the annual Crop Production summary and December 1 Grain Stocks in January, with Illinois's 200 and Minnesota's 204 first [1][2]; DTN's next retail fertilizer survey against $1,007 anhydrous [11]; and the December 2027 corn contract against $5.17 and $5.32.
References
- USDA World Agricultural Outlook Board, World Agricultural Supply and Demand Estimates, WASDE-677, Nov 10, 2026 (narrative; U.S. Feed Grain and Corn Supply and Use, p. 12; U.S. Soybeans and Products Supply and Use, p. 15; 2026 and 2027 release dates) — https://www.usda.gov/oce/commodity/wasde/wasde1126.pdf
- USDA National Agricultural Statistics Service, Crop Production, released Nov 10, 2026 (forecasts as of Nov 1, 2026; corn and soybean state tables, crop comments and reliability statement) — https://esmis.nal.usda.gov/sites/default/release-files/796144/crop1126.txt
- USDA National Agricultural Statistics Service, Crop Production, released Oct 9, 2026 (forecasts as of Oct 1, 2026; corn and soybean state tables, used for the October state production figures) — https://esmis.nal.usda.gov/sites/default/release-files/796123/crop1026.txt
- DTN/Progressive Farmer, R. Montgomery, "As Grain Prices Melt Down, Can USDA Provide a Spark?" (USDA Reports Preview; pre-report estimate tables), Nov 6, 2026 — https://www.dtnpf.com/agriculture/web/ag/news/article/2026/11/06/grain-prices-melt-can-usda-provide
- DTN/Progressive Farmer, DTN Staff, "USDA Lowers Corn Yield to 179.6 BPA, Drops Corn Production to 15.893 BB" (USDA Reports Summary; estimate tables), Nov 10, 2026 — https://www.dtnpf.com/agriculture/web/ag/news/article/2026/11/10/usda-releases-november-crop-wasde
- USDA AMS Livestock, Poultry and Grain Market News / Iowa Dept. of Agriculture Market News, Iowa Daily Cash Grain Bids, Nov 10, 2026 (CBOT closing settlement prices as of Nov 10, 2026; state average corn $4.10, 39¢ under December; soybeans $11.56, 72¢ under January) — https://www.ams.usda.gov/mnreports/ams_2850.pdf
- UkrAgroConsult, "Wheat, corn and soybean futures rise in Chicago on Tuesday," Nov 11, 2026 (Nov 10 closes and daily changes by contract; USDA Crop Progress for Nov 8; export sales to Mexico) — https://ukragroconsult.com/en/news/wheat-corn-and-soybean-futures-rise-in-chicago-on-tuesday/
- C.J. Miller, "A Bullish Surprise: USDA's WASDE Report Sparks Massive Corn and Soybean Rally," The Bullet (WWBL), Nov 10, 2026 (A. Suderman, StoneX, quoted; pre-report yield rumors) — https://www.wwbl.com/2026/11/10/a-bullish-surprise-usdas-wasde-report-sparks-massive-corn-and-soybean-rally/
- FXEmpire, CBOT corn and soybean futures contract tables, delayed quotes stamped 13:06 and 13:04 UTC, Nov 11, 2026 (quotes, not settlements; November 2027 soybeans 1191.25¢, down 2.50¢) — https://www.fxempire.com/commodities/zc/contracts and https://www.fxempire.com/commodities/zs/contracts
- N. Paulson, G. Schnitkey, C. Zulauf and B. Zwilling, "Illinois Crop Budgets for 2027," farmdoc daily (16):157, University of Illinois, Sep 1, 2026 — https://farmdocdaily.illinois.edu/2026/09/illinois-crop-budgets-for-2027.html
- T. Neeley, "UAN28 Continues to Lead Fertilizer Prices Higher in October's Final Week," DTN Retail Fertilizer Trends, DTN/Progressive Farmer, Nov 4, 2026 (retail survey Oct 26–30, 2026) — https://www.dtnpf.com/agriculture/web/ag/crops/article/2026/11/04/uan28-continues-lead-fertilizer-week
- Crop Root Zone, TRZ-0271, "USDA Put 282 Million More Bushels in the Corn Carryout, 172 Million Over the Trade...," Oct 12, 2026 (September and October 2026/27 balance sheets; September state yields; October 9 and September 22 settlements; October 12 quotes for December 2027 corn and November 2027 soybeans; farmdoc 2027 budget line items and break-evens; basis assumption).
- Crop Root Zone, TRZ-0336, "The Board Pays 30¾ Cents to Hold Corn Into July...," Nov 6, 2026 (Iowa average cash corn bid and basis on Nov 5, 2026; storage routes).
- Crop Root Zone, TRZ-0343, "December 2027 Cotton at 77.6 Cents Covers a Delta Acre's Direct Costs With Room to Spare...," Nov 10, 2026 (CBOT settlements of Nov 9, 2026 for December 2027 corn and September 2027 soybeans, from USDA AMS Mississippi Daily Grain Bids).
- Crop Root Zone, TRZ-0283, "USDA's Soybean Export Number Needs 23.3 Million More Tons...," Oct 15, 2026 (soybean export commitments against the October forecast).
Disclosures
Crop Root Zone is an independent publication. Nothing here is investment advice. Market calls, where included, reflect the editors' own read and are not a recommendation to buy or sell any security.
December 2027 Cotton at 77.6 Cents Covers a Delta Acre's Direct Costs With Room to Spare. It Covers Total Cost Nowhere in Mississippi's or Georgia's Budgets, and Diesel, Not Fertilizer, Took the Difference.
We repriced Mississippi State's and Georgia's latest cotton budgets to the November 9 board: 76.4 cents a pound cash, diesel up about $2.60 a gallon and fertilizer close to flat. Diesel adds $27 to $61 an acre to Delta cotton, and fertilizer adds $3 to $4. Furrow-irrigated Delta cotton clears direct cost by $245 but needs an 81.5-cent December board to cover total specified cost before land. Dryland Delta cotton needs 86.7. On dryland Delta ground, corn now out-earns cotton on both measures. In Georgia, irrigated cotton beats irrigated peanuts over variable cost at current prices. The seed cotton PLC payment is projected at half a cent a pound, so it does little for the 2027 acre.
December 2027 ICE cotton settled at 77.62 cents a pound on Monday, November 9. That is 1.16 cents under the December 2026 contract (78.78) and nearly 7 cents under July 2027 (84.55) (USDA AMS, Nov 9, 2026) [1]. The 2027 cotton budgets that growers in the Mid-South and Southeast will plan from are not published yet. Mississippi State's budget page still carries its 2026 row-crop set as of this morning [4]. Georgia's newest cotton budgets carry costs as of December 2025 [5][6]. Arkansas says its 2027 budgets post tomorrow, November 11 [7]. So the useful exercise now is to take the latest public budgets and reprice them to the 2027 board and to this fall's input costs. We used Mississippi State's 1.2-cent October harvest basis, which gives 76.4 cents cash. The answer is the same across both states. Cotton covers its direct or variable costs on every budget we repriced. It covers total cost on none of them. Most of the cost increase since the budgets were set has come from diesel, not fertilizer. The Texas High Plains side of this question was covered in TRZ-0239 [15]. This piece covers the Delta and the Southeast.
1. The price deck: the board, the basis and what the budgets assumed
What's new: Mississippi State's 2026 budgets (Budget Report 2025-01, November 2025) priced lint at 67.5 cents. That figure is the first-five-days-of-October average for December 2026 futures, 68.70, less a 1.20-cent October harvest basis, and the summary sheets round it to 0.67. Cottonseed is priced at 11 cents a pound, the 2008–2025 average [2]. Georgia's 2026 budgets use 68 cents [5]. Both prices are 8 to 9 cents below today's 2027 board.
Evidence: The cotton curve is inverted into 2027. The nearby 2026/27 contracts trade well above December 2027, so the market is paying more for this year's crop than for next year's. Spot basis is tight in the Southeast and in the Delta, which supports a cash price close to the board for growers in those regions.
| Price input, Nov 9, 2026 | Value | Basis / note |
|---|---|---|
| ICE cotton Dec 2026 | 78.78¢ | Settlement |
| ICE cotton Jul 2027 | 84.55¢ | Settlement |
| ICE cotton Dec 2027 | 77.62¢ | Settlement |
| Southeast spot, base grade 41-4-34 | 79.03¢ | 25 points over Dec 2026 |
| North and South Delta spot, 41-4-34 | 77.53¢ | 125 points under Dec 2026 |
| West Texas spot, 41-4-34 | 74.78¢ | 400 points under Dec 2026 |
| Adjusted World Price (Nov 6–12) | 63.57¢ | No loan deficiency payment |
| 2027 planning lint price used here | 76.42¢* | Dec 2027 less MSU's 1.20¢ harvest basis |
| CBOT corn Dec 2027 | $4.8325 | Settlement; MSU basis −9¢ gives $4.74* |
| CBOT soybeans Sep 2027 | $11.765 | Nov 2027 not listed in the AMS relay; Sep used, less MSU's 7¢ basis = $11.70* |
Source: USDA AMS Daily Spot Cotton Quotations, Vol. 109 No. 70, Nov 9, 2026 [1]; USDA AMS Mississippi Daily Grain Bids, Nov 10, 2026 (CBOT settlements of Nov 9) [8]; Mississippi State University, Cotton 2026 Planning Budgets, Appendix Table 7, Nov 2025 [2]. *Crop Root Zone planning values. They apply MSU's historical harvest basis to deferred futures and are estimates, not bids. The soybean figure uses September 2027 because the November 2027 settlement was not available from a public relay we could reach.
USDA's October WASDE put the 2026/27 upland season-average farm price at 77.0 cents, down from 78.0 in September, and U.S. ending stocks at 3.8 million bales [11]. ERS reported a record Delta yield of 1,267 pounds per harvested acre this season. Southeast yields were forecast at 937 pounds, just under the five-year average of 947 [12]. Spot prices have been volatile this fall. AMS's seven-market average base quotation hit its season low of 72.47 cents on November 3, after a high of 86.52 on August 31 [1].
Ground Truth: A 2027 cotton plan priced off the December 2027 contract is priced about 7 cents under what July 2027 pays for old crop. A grower with cotton still in the module or the loan sells that cotton into July. The new crop gets sold into December 2027. The curve treats them as different prices, and the budget should too. The 76-cent planning price is about 9 cents better than the budgets assumed. Section 3 shows that it is still about 5 cents short of covering total cost on the best Delta acre.
2. The cost side: diesel moved, fertilizer did not
What's new: Mississippi State's 2026 budgets carry diesel at $2.94 a gallon and say their costs "are based on 2025 input prices" [2]. EIA's Gulf Coast retail diesel average was $5.912 a gallon in the week of November 2, 2026. It averaged about $3.32 in October 2025, when the budgets were being priced (EIA via FRED, Nov 2, 2026) [10]. Fertilizer has moved far less. DTN's survey for October 26–30 had UAN32 at $494 a ton and potash at $510. The MSU budget uses about $475 and $511 [2][9].
Evidence: We added the $2.60 change in retail diesel to each budget's fuel line, a dollar-for-dollar estimate. Retail diesel includes road taxes that farm diesel does not pay, but those taxes are a fixed amount per gallon, so the dollar change should carry over. We repriced each budget's fertilizer lines by product to DTN's late-October prices. Irrigation in MSU's budgets is diesel-pumped, so irrigated acres take the largest increase.
| MSU 2026 budget (Delta unless noted) | Diesel, gal/ac | Diesel change, $/ac* | Fertilizer change, $/ac* | |
|---|---|---|---|---|
| Cotton, pivot-irrigated, 1,500 lb | 23.6 | +61.16 | +3.61 | ██████████ |
| Cotton, furrow-irrigated, 1,500 lb | 22.0 | +57.16 | +3.61 | █████████ |
| Corn, furrow-irrigated, 220 bu | 19.4 | +50.29 | +14.31 | ████████ |
| Soybeans, furrow-irrigated, 60 bu | 14.1 | +36.66 | +2.35 | ██████ |
| Cotton, Non-Delta, 1,000 lb | 13.6 | +35.33 | +3.04 | ██████ |
| Cotton, dryland conservation-till, 1,200 lb | 12.4 | +32.09 | +3.61 | █████ |
| Cotton, dryland no-till, 1,200 lb | 10.4 | +26.96 | +2.67 | ████ |
| Corn, dryland, 170 bu | 7.2 | +18.72 | +10.36 | ███ |
| Soybeans, dryland, 42 bu | 5.1 | +13.32 | +2.35 | ██ |
Source: Crop Root Zone calculation from Mississippi State University 2026 Cotton and Delta Planning Budgets, Nov 2025 [2][3]; EIA PADD III (Gulf Coast) retail diesel via FRED, series GASDESGCW, week of Nov 2, 2026 [10]; DTN/Progressive Farmer retail fertilizer survey, Oct 26–30, 2026 [9]. Bars scale the diesel change; pivot cotton = 10. *Estimates. Diesel is priced at MSU's $2.94 plus $2.60, the change in Gulf Coast retail diesel from its October 2025 average to Nov 2, 2026, or about $5.54. UAN lines move +4.0% (UAN32), urea +7.6%, and phosphate +8.4% (DAP as the proxy for MSU's triple superphosphate). Potash and lime are unchanged.
The cotton fertilizer program in the Delta budget is light: 150 pounds of potash and 34 gallons of UAN32, about 120 pounds of N, for $128.70 an acre including lime [2]. At today's prices it costs about $3.61 more. For irrigated cotton, the fuel increase is 16 times that.
Georgia's budgets show the same thing, with one difference. UGA prices diesel at $4.15 including lube, using March 2025 values. Its nitrogen is already at 85 cents a pound of N [5]. DTN has urea at 73 cents and UAN32 at 77 cents [9]. Georgia's fertilizer line is already at or above today's market. Its fuel line is not. At the Gulf Coast change since March 2025, about $2.63 a gallon, the UGA cotton budgets' 11.2 gallons of field-operation diesel add $29.49 an acre [5][10]. That figure excludes irrigation pumping. UGA charges $14.50 per irrigation application, a weighted average of electric and diesel, and does not split the two, so we left it unchanged. That understates the increase on diesel-pumped wells.
Ground Truth: The irrigation fuel gap is the cost to manage for 2027, not the fertilizer bill. In MSU's budgets, the furrow-irrigated cotton acre burns 9.7 more gallons than the dryland acre. At $2.94 those gallons cost $28 an acre. At about $5.54 they cost $54. A diesel well that pumps 10.5 acre-inches now costs about $26 an acre more each season than when the budget was written. That is enough to put electric conversion, pump-efficiency testing and fewer furrow sets ahead of any change in nitrogen rate. A 10% cut in the cotton N rate saves about $9.50 an acre. One fewer irrigation set saves more on a diesel pump.
3. Break-evens: the board covers direct cost and stops short of total cost
What's new: On every MSU and UGA cotton budget we repriced, 76.4 cents covers direct or variable cost at the budget yield. None of them covers total cost. MSU's "total specified expenses" add machinery and irrigation ownership but not land, management or overhead [3]. UGA's total adds overhead and management at 5% of variable cost each, and also excludes land [5]. Rent comes on top of every break-even below.
Evidence: Ginning and cottonseed income change with yield. MSU charges 11 cents a pound of lint to gin and haul, and credits 1.35 pounds of seed per pound of lint at 11 cents, which nets 3.85 cents a pound of lint in the grower's favor [2]. UGA nets seed against ginning, leaving 1.29 cents a pound [5]. We let those lines move with yield and held everything else at the budget, after the fuel and fertilizer changes in Section 2.
| Budget, repriced | Yield, lb | Direct/variable cost* | Return over direct at 76.4¢* | Return over total at 76.4¢* | Break-even cash, direct* | Break-even cash, total* | Dec 2027 board needed, total* | Break-even yield, total, lb* |
|---|---|---|---|---|---|---|---|---|
| MS Delta, furrow-irrigated | 1,500 | 1,124.35 | +244.70 | −58.24 | 60.1¢ | 80.3¢ | 81.5¢ | 1,573 |
| MS Delta, pivot-irrigated | 1,500 | 1,134.27 | +234.78 | −81.78 | 60.8¢ | 81.9¢ | 83.1¢ | 1,602 |
| MS Delta, dryland no-till | 1,200 | 939.89 | +155.35 | −42.09 | 63.5¢ | 79.9¢ | 81.1¢ | 1,252 |
| MS Delta, dryland conservation-till | 1,200 | 987.48 | +107.76 | −109.30 | 67.4¢ | 85.5¢ | 86.7¢ | 1,336 |
| MS Non-Delta, 12-row conservation-till | 1,000 | 834.56 | +78.14 | −151.40 | 68.6¢ | 91.6¢ | 92.8¢ | 1,189 |
| GA irrigated, conventional | 1,200 | 729.74 | +187.30 | −255.14 | 60.8¢ | 97.7¢ | 98.9¢ | — |
| GA dryland, conventional | 750 | 562.19 | +10.96 | −274.73 | 75.0¢ | 113.1¢ | 114.3¢ | — |
Source: Crop Root Zone calculation from Mississippi State University Cotton 2026 Planning Budgets, Tables 1–4 and 8 (B3TXF variety), Nov 2025 [2]; University of Georgia 2026 Irrigated Cotton and Dryland Cotton budgets, costs as of Dec 2025 [5]; USDA AMS, Nov 9, 2026 [1]; EIA via FRED [10]; DTN [9]. $/acre except where noted. *Estimates. MSU break-even prices are net of cottonseed income. "Total" is MSU's total specified expense and UGA's total cost; both exclude land. The board equivalent adds back the 1.20¢ basis. UGA break-even yields on total cost are not shown because UGA's fixed costs do not fall with yield and the result would be above any realistic yield.
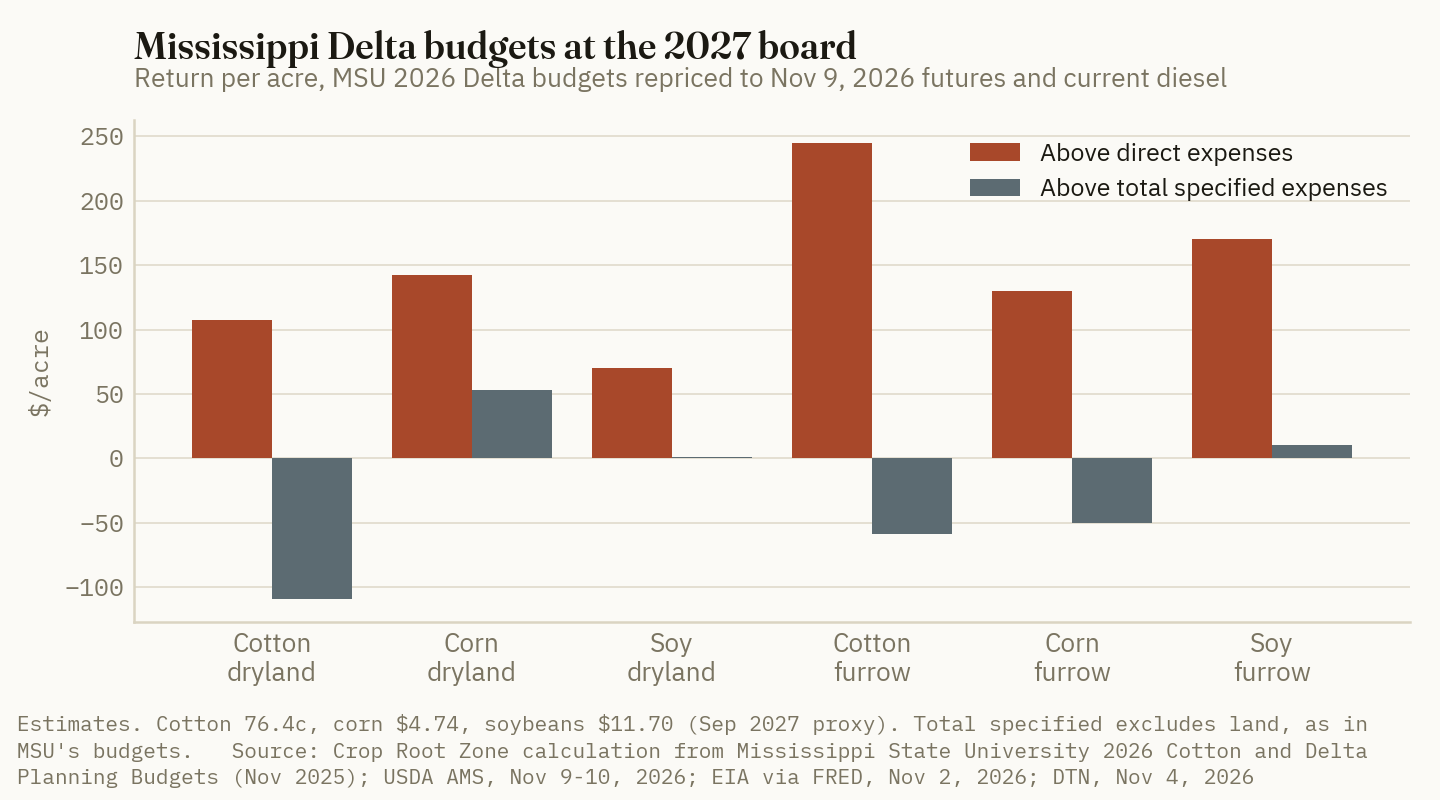
81.5 cents
The December 2027 settlement a furrow-irrigated Mississippi Delta cotton acre needs to cover MSU's total specified cost at 1,500 pounds, before any land charge. The board was 77.62 on November 9. (Crop Root Zone calculation from Mississippi State University, Nov 2025, and USDA AMS, Nov 9, 2026)
Two results stand out. First, irrigated cotton has a wide cushion on direct cost. The furrow budget covers its operating cost down to 60 cents cash. At the budget's 1,500 pounds, it would take a December 2027 board below about 61 cents to put it under water on direct cost. The gap to total cost is the picker, the module builder and the well: $303 an acre of fixed cost in the furrow budget [2]. Second, the tillage system changes the dryland answer more than any input price does. MSU's dryland no-till budget breaks even on total cost at 79.9 cents. The conservation-till budget, on the same 1,200 pounds, needs 85.5. That 5.6-cent gap is about $67 an acre, close to twenty times the fertilizer change in Section 2.
Georgia's totals look worse because UGA's fixed costs are larger. It charges $171 an acre for harvest machinery ownership and $140 for irrigation ownership, both at new-equipment prices [5]. Georgia's dryland number is the tightest in the set. At 76.4 cents the 750-pound budget covers variable cost by $11, and its variable-cost break-even yield is 735 pounds.
Ground Truth: On Delta ground, the 2027 cotton decision is a machinery decision. The board pays operating cost on every acre in MSU's set, so a grower who already owns the picker should plant cotton where it covers that cost. Cotton earns the most over direct cost there, and every acre spreads the picker cost further. What 77-cent cotton does not do is justify replacing a picker or adding a module builder. The fixed-cost lines are where 2027 falls short, and they cannot be paid off from the direct-cost margin. A grower with an aging picker should run its replacement cost against 1,500 pounds at 76 cents before trading it in. On dryland ground, the no-till budget's 5.6-cent advantage is the cheapest margin available.
4. Cotton against corn, soybeans and peanuts on the same ground
What's new: We repriced MSU's Delta corn and soybean budgets the same way, using corn at $4.74 and soybeans at $11.70. MSU charges cash rent at zero for every crop, and a given field rents for the same amount whatever is planted on it. So the ranking below holds after rent [3].
Evidence:
| MSU 2026 Delta budget, repriced | Yield | Price* | Return over direct* | Return over total specified* |
|---|---|---|---|---|
| Dryland cotton, conservation-till | 1,200 lb | 76.4¢ | +107.76 | −109.30 |
| Dryland cotton, no-till | 1,200 lb | 76.4¢ | +155.35 | −42.09 |
| Dryland corn, conventional | 170 bu | $4.74 | +142.63 | +53.35 |
| Dryland soybeans, RR2X | 42 bu | $11.70 | +69.87 | +1.03 |
| Furrow cotton | 1,500 lb | 76.4¢ | +244.70 | −58.24 |
| Furrow corn, conventional | 220 bu | $4.74 | +129.88 | −50.17 |
| Furrow soybeans, RR2X | 60 bu | $11.70 | +170.41 | +10.60 |
Source: Crop Root Zone calculation from Mississippi State University Delta 2026 Planning Budgets, Tables 1, 2, 4, 21, 22, 29 and 30, Nov 2025 [3]; USDA AMS, Nov 9–10, 2026 [1][8]; EIA via FRED [10]; DTN [9]. $/acre. *Estimates; fuel and fertilizer repriced as in Section 2. Soybeans priced off September 2027 futures as a proxy for November 2027.
The corn-to-cotton price ratio on the 2027 contracts is about 6.2 ($4.8325 ÷ 77.62¢). It was about 6.6 in late September [15]. A lower ratio favors corn, yet cotton still leads on irrigated ground over direct cost, by $74 to $115 an acre. On dryland ground, MSU's 170-bushel corn acre beats conservation-till cotton on both measures. It beats no-till cotton on total cost by $95, and no-till cotton leads over direct cost by only $13.
Georgia is the stronger case for cotton. UGA's irrigated peanut budget, at 2.35 tons and $450 a ton, earns $94 over variable cost once its field diesel is repriced. At $480 a ton, which is FSA's projected 2026/27 average price of 24 cents a pound [13], it earns $165. The irrigated cotton budget earns $187.
| UGA 2026 budget, field diesel repriced | Yield | Price | Return over variable cost* |
|---|---|---|---|
| Irrigated cotton | 1,200 lb | 76.4¢* | +187.30 |
| Irrigated peanuts | 2.35 t | $480/t (FSA projected MYA) | +164.63 |
| Irrigated peanuts | 2.35 t | $450/t (UGA budget) | +94.13 |
| Dryland cotton | 750 lb | 76.4¢* | +10.96 |
| Dryland peanuts | 1.70 t | $480/t | −43.61 |
| Dryland peanuts | 1.70 t | $450/t | −94.61 |
Source: Crop Root Zone calculation from University of Georgia 2026 Irrigated Cotton, Dryland Cotton, Irrigated Peanut and Dryland Peanut budgets, costs as of Dec 2025 [5]; USDA FSA projected 2026/27 MYA prices, Oct 9, 2026 [13]; EIA via FRED [10]. $/acre. *Estimates. Field-operation diesel moved by the $2.63 Gulf Coast change since March 2025; irrigation application costs unchanged. No 2027 peanut contract price has been published that we could verify, so two reference prices are shown.
Ground Truth: The 2027 board puts cotton where Delta growers make the most from it: on irrigated ground. On dryland ground, corn now earns more. Where the farm has the drying, hauling and planter capacity, the dryland cotton acres on a Delta farm are the ones to move to corn, not the furrow acres. In Georgia, the usual rotation argument for peanuts no longer has a margin argument behind it on UGA's budgets. Irrigated cotton out-earns irrigated peanuts over variable cost unless 2027 peanut contracts come in well above $480. That makes the case for peanuts in 2027 an agronomic one: disease and nematode break, and residual nitrogen for the following cotton. The case is real, but growers should price it as a rotation benefit and should not expect peanut income to cover it.
5. What the farm program and the insurance price add
What's new: The seed cotton safety net is close to zero for 2026. FSA's October 9 projection puts the 2026 seed cotton effective price at 41.47 cents against the 42-cent effective reference price. That gives a projected PLC payment rate of 0.53 cents a pound [13]. Corn and soybeans project no PLC payment: corn's projected average price of $4.70 is above its $4.42 reference, and soybeans' $12.00 is above $10.71. Peanuts project 7.5 cents a pound, or $150 a ton, against a 31.5-cent reference price [13].
Evidence: PLC pays on base acres and payment yields, whatever is planted. A projected 0.53-cent rate on seed cotton base therefore does almost nothing for the 2027 planting decision. FSA's seed cotton price is a weighted average of the lint and cottonseed prices, and lint is well under half the weight of seed cotton. By our rough estimate, each 1-cent fall in the 2026/27 lint average lowers the seed cotton price by about 0.4 cents.* Lint would have to average well below 77 cents for the payment to matter. For 2027 the same holds: at 76-cent lint the program pays little, and the acre has to earn its money from the crop. The peanut payment also goes to base acres, not to the acres planted to peanuts. It supports the farm's income, but it does not make a 2027 peanut acre pay better than a cotton acre.
The insurance price is still to be set. Under RMA's cotton price provisions, the projected price is the average December 2027 settlement over a window that depends on the county's sales closing date. For the February 28 closing date, which covers most Delta and Southeast counties, the window is January 15 to February 14 (USDA RMA, Commodity Exchange Price Provisions – Cotton) [14]. At Monday's 77.62, a 75% revenue guarantee on a 1,500-pound APH would be worth about $873 an acre.* That is $251 below the repriced furrow budget's direct cost. Revenue protection therefore does not cover operating cost on its own at this price. It protects against a disaster, not against a bad year.
*Crop Root Zone estimates. The seed cotton sensitivity is an approximation, not FSA's formula. The guarantee is 0.75 × 1,500 × $0.7762 and ignores the harvest price option and unit structure.
Three dated items will reset these numbers before planting:
- Arkansas's 2027 budgets, November 11. The Division of Agriculture's page lists ten 2027 cotton budgets, five for B3TXF and five for ThryvOn, across lease, diesel-furrow, electric-furrow, pivot and non-irrigated systems. It has not yet linked the files [7]. These will be the first public 2027 cotton cost lines in the region. The diesel-versus-electric furrow split will show directly how much of Section 2's fuel cost electric pumping avoids.
- Mississippi State's and Georgia's 2027 sets. MSU published its 2026 books in November 2025 and has posted only 2027 forage budgets so far [4]. UGA's 2026 cotton budgets carried December 2025 costs [5]. If those sets keep diesel near $2.94 to $4.15, they will understate the cost increase we found here.
- The January 15–February 14 price discovery window. Each 1-cent move in December 2027 changes a 1,500-pound irrigated acre by $15 and a 1,200-pound dryland acre by $12.
Ground Truth: The 2027 cotton acre in the Delta and the Southeast will get little help from the farm program. Seed cotton PLC is near zero at 77-cent lint. Insurance at 75% does not reach operating cost on an irrigated acre. Cash prices are running close to futures in both regions. So the break-even table in Section 3 is the plan. Those numbers will change before February in two ways. Arkansas's 2027 lines, out tomorrow, show the cost side as the university sees it. The December 2027 contract's move toward or away from 81.5 cents will settle whether irrigated Delta cotton covers its machinery. A grower who plans 2027 from the budgets' printed returns at 67 to 68 cents is working from a worse price and a lower cost than the ones that apply now. Both should be updated.
References
- USDA Agricultural Marketing Service, Cotton and Warehouse Market News, Daily Spot Cotton Quotations, Vol. 109 No. 70, Nov 9, 2026 (ICE settlements incl. Dec-26 78.78¢, Jul-27 84.55¢, Dec-27 77.62¢; spot quotations by growth area; Adjusted World Price 63.57¢ for Nov 6–12; season high and low of base quotations) — https://www.ams.usda.gov/mnreports/ams_3804.pdf
- Mississippi State University, Department of Agricultural Economics, Cotton 2026 Planning Budgets, Budget Report 2025-01, Nov 2025 (Tables 1–10; Appendix Tables 4, 5 and 7: input prices, $2.94 diesel, futures, basis and budget prices) — https://www.agecon.msstate.edu/whatwedo/budgets/docs/26/MSUCOT26.pdf
- Mississippi State University, Department of Agricultural Economics, Delta 2026 Planning Budgets, Budget Report 2025-05, Nov 2025 (cotton, soybean, corn and other Delta enterprise budgets; foreword on excluded land, management and overhead costs) — https://www.agecon.msstate.edu/whatwedo/budgets/docs/26/MSUDELTA26.pdf
- Mississippi State University, Department of Agricultural Economics, Budgets page (2026 row-crop planning budgets; 2027 forage budgets only), accessed Nov 10, 2026 — https://www.agecon.msstate.edu/whatwedo/budgets.php
- Y. Liu, G. Hancock and A. Smith, University of Georgia Department of Agricultural and Applied Economics, 2026 Irrigated Cotton, 2026 Dryland Cotton, 2026 Irrigated Peanut and 2026 Dryland Peanut enterprise budgets, South Georgia (costs as of Dec 2025; diesel and nitrogen as of Mar 2025) — https://agecon.uga.edu/content/dam/caes-subsite/ag-econ/documents/extension/budgets/2026-budgets/row-crops/2026-Irr-Cotton.xlsx ; https://agecon.uga.edu/content/dam/caes-subsite/ag-econ/documents/extension/budgets/2026-budgets/row-crops/2026-Dryland-Cotton.xlsx ; https://agecon.uga.edu/content/dam/caes-subsite/ag-econ/documents/extension/budgets/2026-budgets/row-crops/2026-Irrigated-Peanut.xlsx ; https://agecon.uga.edu/content/dam/caes-subsite/ag-econ/documents/extension/budgets/2026-budgets/row-crops/2026-Dryland-Peanut.xlsx
- University of Georgia, Department of Agricultural and Applied Economics, Crop and Livestock Budgets page, accessed Nov 10, 2026 — https://agecon.uga.edu/extension/budgets.html
- University of Arkansas System Division of Agriculture, Cooperative Extension Service, Crop Enterprise Budgets for Arkansas ("2027 Arkansas Crop Enterprise Budgets coming 11/11/2026"; page last updated Nov 8, 2026), accessed Nov 10, 2026 — https://uaex.uada.edu/farm-ranch/economics-marketing/farm-planning/budgets/crop-budgets.aspx
- USDA AMS Livestock, Poultry and Grain Market News / Mississippi Dept. of Agriculture Market News, Mississippi Daily Grain Bids, Nov 10, 2026 (CBOT settlements as of Nov 9, 2026: corn Dec-27 483.25¢; soybeans Sep-27 1176.50¢) — https://www.ams.usda.gov/mnreports/AMS_2928.pdf
- R. Quinn, DTN Retail Fertilizer Trends, DTN/Progressive Farmer, Nov 4, 2026 (retail survey Oct 26–30, 2026) — https://www.dtnpf.com/agriculture/web/AG/crops/article/2026/11/04/uan28-continues-lead-fertilizer-week
- U.S. Energy Information Administration via Federal Reserve Bank of St. Louis (FRED), PADD III (Gulf Coast) Diesel Sales Price, series GASDESGCW, weekly, through week of Nov 2, 2026 ($5.912/gal) — https://fred.stlouisfed.org/series/GASDESGCW
- USDA World Agricultural Outlook Board, World Agricultural Supply and Demand Estimates, WASDE-676, Oct 9, 2026 (U.S. cotton supply and use) — https://www.usda.gov/oce/commodity/wasde/wasde1026.pdf
- USDA Economic Research Service, L. Meyer and T. Dew, Cotton and Wool Outlook: October 2026, CWS-26j, Oct 14, 2026 — https://www.ers.usda.gov/media/29738/cws-26j.pdf
- USDA Farm Service Agency, Projected 2026 Price Loss Coverage (PLC) Payment Rates, Table 3, Oct 9, 2026 — https://www.fsa.usda.gov/sites/default/files/2026-10/2026_PLC.pdf
- USDA Risk Management Agency, Commodity Exchange Price Provisions, Section II – Cotton (23-CEPP-0021) — https://www.rma.usda.gov/sites/default/files/crop-policies/Commodity-Exchange-Price-Provisions---Cotton-23-CEPP.pdf
- Crop Root Zone, TRZ-0239, "A Dryland High Plains Cotton Acre Needs 446 Pounds at 2027 Prices...," Sep 29, 2026 (corn-to-cotton ratio of about 6.6 on Sep 28, 2026 settlements).
Disclosures
Crop Root Zone is an independent publication. Nothing here is investment advice. Market calls, where included, reflect the editors' own read and are not a recommendation to buy or sell any security.
At the Same Illinois Elevator, Soybean Basis Is 31 Cents Stronger Than Corn Basis. One Crop Has a Buyer That Doesn't Need the River.
Central Illinois corn is bid 38.75 under; soybeans at the same elevators are 7.25 under. On a 1,000-acre corn-and-bean farm the corn basis bill is roughly eighteen times the soybean one, and that gap should decide which bin fills first.
USDA's daily grain bid report for Sep 3, 2026 shows central Illinois elevators bidding $5.02 for corn and $13.06 for soybeans. Those are not comparable numbers on their face — different crops, different futures. Backed out against the futures reference the same report implies, they become comparable, and the answer is stark: corn is bid 38.75 cents under futures and soybeans 7.25 cents under, at the same elevators, on the same day (USDA AMS Daily Grain Bids, Sep 3, 2026). Two crops, one buyer, a 31.5-cent gap in how that buyer is valuing delivery.
1. Establishing the futures reference, because the basis is the whole point
What's new: The report publishes explicit basis figures at the export and terminal locations and flat prices at the interior elevators. The published basis lets the futures reference be recovered exactly, which then lets the interior bids be expressed as basis.
Evidence: Every location in the report solves to the same futures number, which is the check that the arithmetic is right rather than convenient:
| Location | Published basis, ¢ | Published bid, $/bu | Implied futures, $/bu |
|---|---|---|---|
| Gulf yellow corn | +66 | 6.0575 | 5.3975 |
| Gulf yellow corn | +91 | 6.3075 | 5.3975 |
| Ohio east yellow corn | −40 | 5.0075 | 5.4075 |
| Ohio east yellow corn | −35 | 5.0575 | 5.4075 |
| Toledo terminal corn | −65 | 4.7575 | 5.4075 |
| Toledo terminal corn | −15 | 5.2575 | 5.4075 |
| Indiana white corn | +60 | 6.0075 | 5.4075 |
| Gulf soybeans | +102 | 14.1525 | 13.1325 |
| Gulf soybeans | +103 | 14.1625 | 13.1325 |
Source: USDA AMS Daily Grain Bids, report dated Sep 3, 2026. Implied-futures column derived by this desk (bid minus basis). The one-cent difference between the Gulf corn solution ($5.3975) and the interior corn solution ($5.4075) is carried as-is rather than smoothed; interior basis below is computed against the interior solution, which four independent locations agree on.
Applying $5.4075 corn and $13.1325 soybeans to the central Illinois flat bids:
| Central Illinois elevators | Bid, $/bu | Futures, $/bu | Basis, ¢ | Basis as % of futures |
|---|---|---|---|---|
| Corn | 5.02 | 5.4075 | −38.75 | −7.17% |
| Soybeans | 13.06 | 13.1325 | −7.25 | −0.55% |
Derived by this desk from USDA AMS Daily Grain Bids, Sep 3, 2026.
31.5¢
The gap between soybean basis and corn basis at the same central Illinois elevators on Sep 3, 2026 — a thirteen-fold difference in proportional terms. (Derived from USDA AMS Daily Grain Bids, Sep 3, 2026)
2. The gap is not a corn-versus-beans price story
What's new: A weak basis and a weak price are different things, and this is a basis story only.
Evidence: Corn futures at $5.41 are historically strong — the 2026 crop insurance projected price, set on the February average of December corn, was $4.62 (DTN/Progressive Farmer, Feb 27, 2026), so the board is running roughly 17% above the guarantee. Corn is not cheap. What is happening is that the local buyer is declining to pay the board, and declining by far more on corn than on beans.
| Crop | Board price | Local bid | Local buyer's discount |
|---|---|---|---|
| Corn | 5.4075 | 5.02 | 7.17% |
| Soybeans | 13.1325 | 13.06 | 0.55% |
Derived from USDA AMS Daily Grain Bids, Sep 3, 2026; projected price from DTN/Progressive Farmer, Feb 27, 2026.
| Discount the local buyer is taking | % of board | |
|---|---|---|
| Corn | 7.17 | ██████████ |
| Soybeans | 0.55 | █ |
Same sources.
3. Where the two crops go, and why that shows up in the bid
What's new: The marginal bushel of each crop has a different destination this year, and only one of those destinations depends on the river.
Evidence: The soybean crush is running hard. USDA raised its 2026/27 soybean crush estimate by 30 million bushels to 2.780 billion, and lifted 2025/26 crush by 5 million to 2.655 billion, explicitly citing crush margins; soybean oil futures were near $0.69/lb in early September, and processors have been reported at record crush margins on the strength of oil (USDA WAOB via published crush estimates; CoBank Knowledge Exchange; Argus Media, 2026). A crush plant in Illinois bids for beans out of a truck and never books a barge.
Corn's marginal bushel goes the other way. The Gulf corn basis of +66 to +91 says the export channel is paying up for corn at the water — but the river between central Illinois and that water is in its third consecutive low-water year, with a low-water protocol triggered on the Memphis gauge on Aug 3, 2026 and a 9-foot draft restriction carrying a loading penalty of roughly 10–25% below normal (Alliance Chemical market note, Aug 12, 2026). A wide Gulf basis with a wide interior basis under it is the signature of a channel that wants the bushel and cannot cheaply move it.
The interior-to-Gulf spread makes the point numerically:
| Crop | Central Illinois bid | Gulf bid (mid) | Spread, $/bu |
|---|---|---|---|
| Corn | 5.02 | 6.1825 | 1.1625 |
| Soybeans | 13.06 | 14.1575 | 1.0975 |
Derived from USDA AMS Daily Grain Bids, Sep 3, 2026. Gulf figures are midpoints of the published ranges.
Corn and soybeans both weigh 60 pounds to the bushel and ride the same barges at the same freight. Yet the market is charging 6.5 cents a bushel more to get corn from central Illinois to the Gulf than to get soybeans there. Freight does not explain that. Competition for the bushel at the origin does: the bean has a second bidder at home and the corn does not.
Ground Truth: The practical instruction is that this year the storage decision is crop-specific in a way it usually is not. Ordinarily a grower reasons about storage once — is basis appreciation plus carry worth the shrink, interest and bin space — and applies the answer to both crops. That reasoning breaks here. Soybeans at 7.25 under are being bid close to full board value before the harvest delivery surge, by a buyer whose demand is set by a renewable-fuel mandate and does not soften when the river falls; there is very little basis appreciation left to capture and a real risk that harvest delivery volume erodes what there is. Corn at 38.75 under is being bid by a channel whose constraint is physical and seasonal, and a physical constraint that eases — rain on the Ohio and Mississippi watersheds, or simply the end of harvest congestion — is exactly the condition under which basis recovers. Deliver beans at harvest and store corn is the read, and it is the opposite of the instinct that says sell the cheap-looking crop and store the dear one.
4. What the gap costs on a real farm
What's new: Expressed as money on a specific operation, the asymmetry is larger than the cents suggest, because corn contributes far more bushels per acre.
Evidence: Take a 1,000-acre farm split evenly, at 200 bu/acre corn and 60 bu/acre soybeans — yields stated as an assumption, not a survey figure.
| Corn | Soybeans | |
|---|---|---|
| Acres | 500 | 500 |
| Yield, bu/acre | 200 | 60 |
| Bushels | 100,000 | 30,000 |
| Basis, $/bu | −0.3875 | −0.0725 |
| Basis cost vs board, $ | −38,750 | −2,175 |
Derived by this desk from the basis figures above. Acreage and yields are assumptions; substitute your own.
The corn basis bill is 17.8 times the soybean basis bill on the same farm. A ten-cent recovery in corn basis is worth $10,000 on this operation; a ten-cent recovery in soybean basis is worth $3,000, and there is not ten cents of room to recover it in.
5. What to watch
Three dates. The September WASDE lands Sep 11 and will reset the futures reference both bases are measured against — note that a futures move changes the flat price without changing the argument here, which is about the spread. River stage on the Memphis gauge governs whether the corn channel's physical constraint eases or tightens through the delivery peak. And the weekly retail and crush prints will show whether the soybean bid holds its near-board level once harvest volume actually arrives, which is the one assumption in Section 3 that has not yet been tested by supply.
One caution on the numbers themselves: these are single-day bids from one report. A basis relationship worth restructuring a marketing plan around should be confirmed across several sessions, and the direction of the gap matters more than its exact width on Sep 3.
References
- USDA Agricultural Marketing Service — Daily Grain Bids: Kansas, Illinois, Gulf, Portland, Indiana, Ohio, report dated Sep 3, 2026. https://www.ams.usda.gov/services/transportation-analysis/grain-transportation
- DTN/Progressive Farmer — Crop Insurance Price Falls to $4.62 for Corn, Soybeans Bump Up to $11.09, Feb 27, 2026. https://www.dtnpf.com/agriculture/web/ag/news/business-inputs/article/2026/02/27/crop-insurance-price-falls-4-62-corn
- CoBank Knowledge Exchange — Soybean processors see record crush margins on surging soyoil prices, 2026. https://www.cobank.com/knowledge-exchange/soybean-processors-see-record-crush-margins-on-surging-soyoil-prices
- Argus Media — US soy crush margins soar, set to remain high, 2026. https://www.argusmedia.com/en/news-and-insights/latest-market-news/2824915-us-soy-crush-margins-soar-set-to-remain-high
- Alliance Chemical — Rhine & Mississippi Low Water 2026: Chemical Supply Impact, Aug 12, 2026. https://alliancechemical.com/blogs/news/rhine-mississippi-low-water-2026-chemical-supply
- American Soybean Association — Soy Demand Rises to Meet Large Crop, 2026. https://soygrowers.com/news-releases/soy-demand-rises-to-meet-large-crop/
Disclosures
Crop Root Zone is an independent publication. Nothing here is investment advice. Market calls, where included, reflect the editors' own read and are not a recommendation to buy or sell any security.
Spreading Its Own Urea Saves a Spinner Owner About $6 an Acre, or 1.3 Bushels of Corn. In the One Missouri Trial That Put Pans Under Preplant Urea, an Uneven Pattern Cost 4.5 to 14.
At $5.07 diesel and a 5.41% real rate, Iowa's hired dry pass is $8.48 and a new $36,362 pull-type spinner breaks even at 650 acres spread a year. Putting urea on the corn half through the same machine cuts the break-even farm from about 1,290 acres to 645. Missouri pan tests found uneven spread in all six fields they caught, five of them under self-propelled machines, and yield loss only where the whole nitrogen program went on preplant. Half-width urea passes cost about $2.55 an acre, half a bushel, and still leave owning ahead above about 800 acres.
In March 2016 a University of Missouri crew set catch pans under a pull-type spinner spreader putting 160 pounds of nitrogen an acre on a corn field as urea, across a 50-foot swath. The pans caught too much on the left and too little in the middle. Hand-harvest checks that September put yield at 149 bushels under the pattern as spread and 163 where the intended rate landed, a penalty of 14 bushels an acre (Scharf and Kitchen, University of Missouri, Year 1 report on 2016 trials) [1]. Our October 13 piece found that a new spinner beats Iowa's hired dry pass above about 640 acres a year on fall phosphate and potash, and noted, without pricing it, that spring urea through the same machine would add to the acres [16]. This piece prices it. Urea does halve the farm size at which a spinner pays. The saving on each urea acre is about $6, or 1.3 bushels of December 2027 corn. The Missouri pans measured losses about four to eleven times that, and not only under the farmer-sized machine.
1. The hired pass and the ownership line, repriced for November
What's new: Diesel fell and interest rose since October. The two nearly cancel. Iowa's hired dry pass is now about $8.48 an acre, and a new 8-ton spinner breaks even at 650 acres spread a year, against 639 a month ago.
Evidence: Iowa's 2026 survey prices dry bulk spreading at $8.15 an acre, materials excluded, with a median of $8.00 and a range of $4.00 to $13.50 across 59 responses, on a $2.89 diesel assumption (Iowa State University, AgDM A3-10, Mar 2026) [2]. Illinois farm diesel averaged $5.07 a gallon in the week ending November 13, down 64 cents from the prior report (USDA AMS, Nov 13, 2026) [3]. Iowa State's fuel table puts dry spreading with a bulk cart at 0.15 gallons an acre (Iowa State University, AgDM A3-27, Feb 2026) [8]. The diesel gap adds 33 cents to the survey rate.
The Seventh District's average rate on new operating loans was 7.41% on October 1, up from 7.12% a quarter earlier (Federal Reserve Bank of Chicago, AgLetter, Nov 2026) [6]. Iowa State's method subtracts 2% expected inflation (Iowa State University, AgDM A3-29, Mar 2026) [7], which gives a 5.41% real rate. Dealers' asking prices did not move. Fourteen priced 2026-model 8-ton pull-type spinners at two dealers, in Iowa and North Dakota, ran from $32,434 to $38,935 with a median of $36,362 (Machinery Pete, accessed Nov 16, 2026) [5].
| Input | Oct 13 piece [16] | Nov 16 |
|---|---|---|
| Illinois farm diesel, $/gallon, F.O.B. distributor | 5.63 | 5.07 |
| Operating-loan rate, Seventh District | 7.12% | 7.41% |
| Real rate used | 5.12% | 5.41% |
| Iowa hired dry pass, diesel-adjusted, $/acre | 8.56 | 8.48 |
| Median ask, new 8-ton spinner | $36,362 | $36,362 |
| Fixed cost, $/year | 3,976 | 4,056 |
| Variable cost, tractor treated as paid for, $/acre | 2.34 | 2.24 |
| Break-even, acres spread a year | 639 | 650 |
| Break-even with a 150-hp tractor charged at $1.72/acre | 882 | 897 |
Basis: 10-year hold, resale at 35% of the asking price, 60-foot swath at 6 mph and 29.7 acres an hour, labor at $22 an hour × 1.1, repairs held at $0.55 an acre. Source: Crop Root Zone calculation on the method in Iowa State University AgDM A3-29 [7], with capacity from A3-24 [9], fuel from A3-27 [8], wage and tractor rental from A3-10 [2], diesel from USDA AMS [3], interest from the Federal Reserve Bank of Chicago [6] and asking prices from Machinery Pete [5]. Every cost cell is model output. Asking prices are one brand on one site on one day; sale prices are lower.
Each point of interest moves the line by about 45 acres. Price moves it from 580 acres at the low ask to 696 at the high one. The other two 2026 surveys we re-read sit higher than Iowa and so pay sooner.
| Survey (2026) | Service | Survey $/acre | At $5.07 diesel* | Spinner break-even, acres |
|---|---|---|---|---|
| Iowa | Dry bulk, applied | 8.15 | 8.48 | 650 |
| Ohio | Dry bulk, fixed rate | 9.68 | 9.94 | 527 |
| Nebraska | Dry, solid broadcast | 9.66 | 9.98 | 524 |
| Ohio | Variable-rate fertilizer application | 10.96 | 11.22 | 452 |
| Nebraska | Dry, variable rate | 12.48 | 12.80 | 384 |
Basis: $/acre, materials excluded, operator, power unit and fuel included; break-even with the tractor treated as paid for. Source: Iowa State University, AgDM A3-10 [2]; Ohio State University Extension, Jun 29, 2026 [11]; University of Nebraska–Lincoln, 2026 [10]. *Crop Root Zone estimate: survey rate plus 0.15 gallons [8] times the gap between $5.07 [3] and each survey's fuel basis, $2.89 in Iowa, $2.93 in Nebraska and $3.36 in Ohio, the low end of the range Ohio's authors describe. The variable-rate rows apply only to a spreader with a rate controller, which the listings price at up to $38,935 [5].
2. Urea doubles the acres
What's new: A corn-soybean farm that spreads a two-year phosphate and potash rate covers half its ground each fall. Urea on the corn half covers the other half's worth again. The spreader's fixed cost does not change. The break-even farm falls from about 1,290 acres to 645.
Evidence: We ran the Section 1 machine over three programs and five farm sizes. Repairs here are recomputed from accumulated hours on the fertilizer-spreader curve Iowa State prints, 13% of price by 300 hours and 40% by 700 [7], instead of being held flat.
| Acres farmed | P and K only | P and K plus urea, full width | P and K plus urea at half width |
|---|---|---|---|
| 600 | −2,131 | −278 | −970 |
| 800 | −1,513 | +957 | −3 |
| 1,000 | −896 | +2,179 | +930 |
| 1,500 | +648 | +5,169 | +3,257 |
| 2,000 | +2,179 | +8,142 | +5,510 |
| Break-even, acres farmed | 1,290 | 645 | 801 |
Basis: dollars a year saved by owning instead of hiring every dry pass at $8.48; negative means hiring is cheaper. Phosphate and potash on half the acres each year, urea on the corn half, tractor treated as paid for. Source: Crop Root Zone calculation, inputs as in Section 1. "Half width" spreads urea on a 30-foot swath at 14.85 acres an hour and doubles that pass's fuel to 0.30 gallons an acre; the fuel doubling is our assumption. The 2,000-acre half-width row logs 1,010 hours in ten years, 10 past the end of the printed repair curve, and is extrapolated.
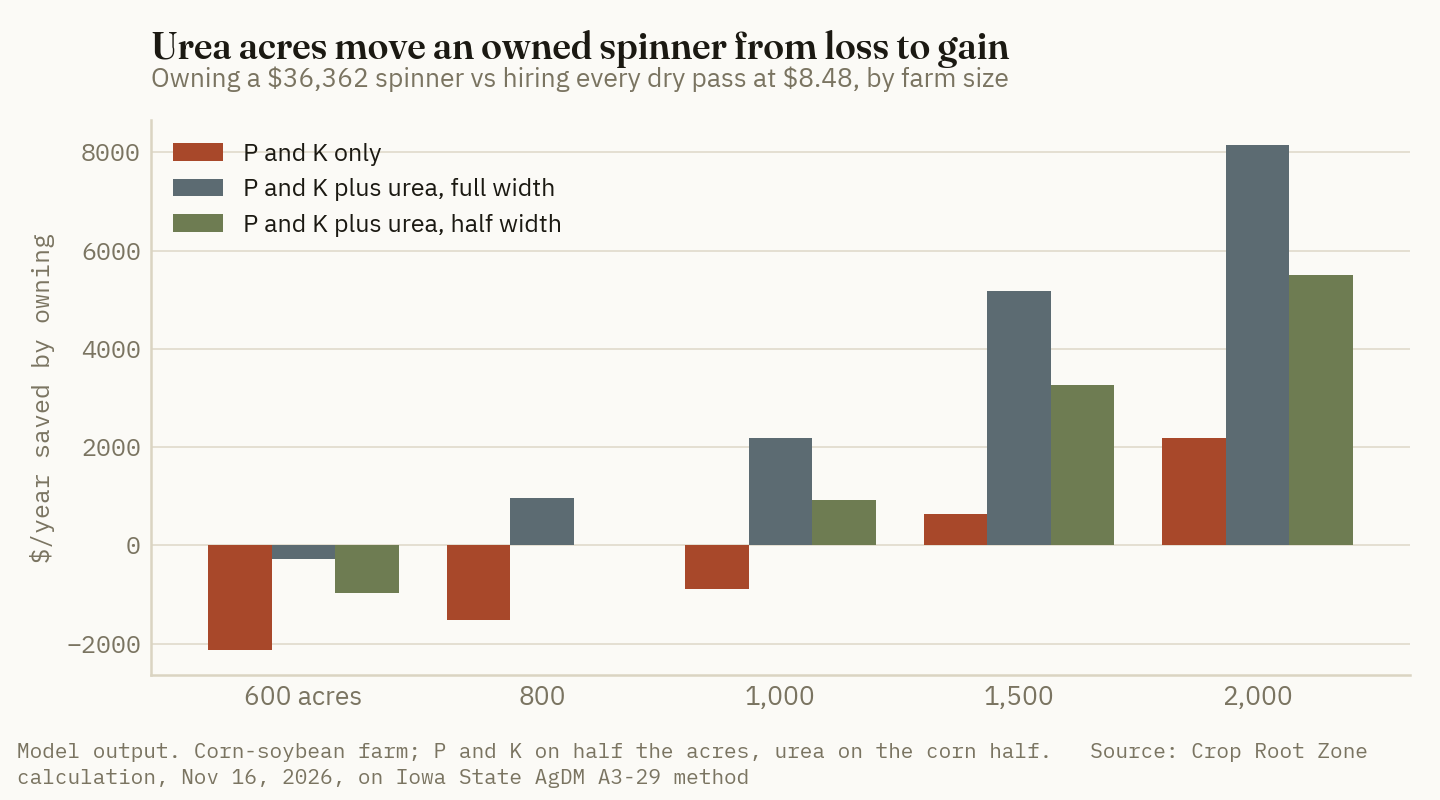
For a farm that already owns the spreader, the marginal arithmetic is simpler. The urea pass costs the owner $2.33 to $2.51 an acre in fuel, labor and added repairs. Hiring it costs $8.48. The gap is about $6.05 an acre. December 2027 corn settled at $4.79¾ on November 13 (USDA AMS, Nov 13, 2026) [4], so the saving is worth 1.26 bushels.
The product in the box is worth far more than the pass. Illinois distributors asked an average $770 a ton for urea, F.O.B., in a range of $650 to $890 [3]. At the Missouri field's 160 pounds of nitrogen, that is 348 pounds of urea and $133.91 an acre. The $8.48 fee is 6% of it.
3. What the pans caught in Missouri
What's new: We said in October that we had found no US trial pricing the yield cost of an uneven dry pattern [16]. For phosphate and potash that still holds. For nitrogen there is one. It found uneven spread in every field it tested and a yield penalty in both fields where the whole nitrogen program went on preplant.
Evidence: The Missouri crew caught six applications in 2016, placing pans across the applicator's path during normal field work, then hand-harvested at pan locations and fitted yield to the nitrogen caught [1].
| Field | Timing, N rate | Machine | Product | Swath | Pattern caught | Yield penalty, bu/acre |
|---|---|---|---|---|---|---|
| 1 | Preplant, 160 lb | Tractor, pull-type box | Urea | 50 ft | High left, low middle | 14 |
| 2 | Preplant, 130 lb | Self-propelled, spinner box | Ammonium nitrate plus sulfur | 85 ft | High left, low middle | 2 and 7 in two passes |
| 3 | In season, 40 lb | Self-propelled, spinner box | Urea plus ammonium sulfate | 80 ft | M-shaped | None found |
| 4 | In season, 40 lb | Self-propelled, spinner box | Urea plus ammonium sulfate | 80 ft | M-shaped | None found |
| 5 | In season, 40 lb | Self-propelled, spinner box | Urea | 70 ft | W-shaped, sawtooth | None found |
| 6 | In season, 50 lb | Self-propelled, spinner box | Urea | 70 ft | Sawtooth | None found |
Basis: corn, Missouri, 2016; N rate in pounds an acre as intended; penalty is predicted yield at the intended rate less predicted yield at the rates caught. Source: Scharf and Kitchen, University of Missouri, Year 1 report [1]. In fields 1 and 2 the preplant pass was the total nitrogen program. In fields 3 to 6 the main application had gone on before planting.
| Case | Bushels an acre | Dollars at $4.79¾ | |
|---|---|---|---|
| Field 1, pull-type, preplant urea | 14 | 67.17 | ██████████ |
| Field 2, self-propelled, worse pass | 7 | 33.58 | █████░░░░░ |
| Field 2, average of two passes | 4.5 | 21.59 | ███░░░░░░░ |
| Field 2, better pass | 2 | 9.60 | █░░░░░░░░░ |
| Owner's saving on a urea acre | 1.26 | 6.05 | █░░░░░░░░░ |
| Fields 3 to 6, in season at 40 to 50 lb | 0 | 0 | ░░░░░░░░░░ |
Basis: yield penalty from the table above [1], valued at the December 2027 corn settlement [4]; the saving row is the Section 2 calculation. Bars scale the bushel column, with 14 bushels = 10 blocks.
14 bushels an acre
The yield penalty under a pull-type spinner spreading the whole nitrogen program as preplant urea on a 50-foot swath: 149 bushels as spread, 163 at the intended rate. (Scharf and Kitchen, University of Missouri, Year 1 report on 2016 trials)
The limits of this evidence are wide. It is one year in one state. Each penalty rests on six to ten hand-harvested spots and a fitted curve. Field 1's figure combines a bad pattern with a rate that averaged below target, and the report does not separate the two. The report does not say who owned any of the machines. It is labelled Year 1, and we did not find a second-year report. A conference abstract of the same work turned up in search, but its page would not open, and we have not used it.
Three findings bear on ownership all the same. The uneven patterns were not the one the researchers expected, a heavy center from dusty product. Product quality was acceptable in all six fields. About a fifth of the urea granules broke on the spinner vanes, with intact large granules falling from 90% to 70% between box and pan in Field 1. And the authors judged that spreader adjustment would likely have fixed the patterns [1].
Ground Truth: The Missouri pans do not say that an owned spinner spreads worse than a hired one. Five of the six uneven patterns came from self-propelled rigs of the kind a retailer sends, and the one at 85 feet cost 2 to 7 bushels. What they say is that the saving from owning, 1.3 bushels on a urea acre, is small against the spread of outcomes on either side of the fence. Owning loses if the farm's own pattern is 1.3 bushels worse than the hired machine's would have been, and wins by more than the survey arithmetic shows if it is better. The Field 2 operator saw the pans and went for the manual. An owner can do that in March. A grower who hires sees the pattern in August, from the road.
4. Why urea is the hard load, and what evenness costs
What's new: Urea is lighter than the products a spinner is usually set for, and it breaks. The cheap fixes cost the owner about half a bushel an acre. An air-boom costs several.
Evidence: Ireland's farm advisory service puts urea at about 80% of the density of other fertilizers and says it may limit the width a spreader can cover evenly and is moved more by wind. Its advice is to ask for independent test reports on urea specifically and to look for a coefficient of variation under 10% (Forristal and Quigley, Teagasc, Jan 2022) [12]. That guidance was written for mounted twin-disc machines on 8- to 30-meter bouts, not for a Corn Belt pull-type, and we use it for the physics only.
Missouri's Peter Scharf wrote in 2009 that in two-thirds of the severely nitrogen-stressed corn fields he photographed from the air, he also saw streaks, and that the streak spacing matched applicator widths: most often 40, 50 or 80 feet for spinners (Scharf, University of Missouri, Feb 10, 2009) [13]. His explanation then was broken granules falling short. His remedy was an air-boom: "You can't throw dust, but you can blow it" [13]. A year later he listed narrower swaths or two half-rate trips as the field fix, at the cost of up to half the applicator's daily acres (Scharf, University of Missouri, Mar 16, 2010) [14]. He also cautioned that double spreading makes unevenness less visible more than it makes the application even [13].
What each option costs the owner, per urea acre and in corn:
| Route to a more even urea pass | Added cost | $/urea acre | Bushels at $4.79¾ |
|---|---|---|---|
| Pan-test and adjust the owned spinner | Pans and an afternoon; not priced | — | — |
| Spread urea at half width | Fuel, labor and repairs on a second trip's worth of travel | 2.55 | 0.53 |
| Hire the urea pass, keep the spinner for P and K | The saving given up | 6.05 | 1.26 |
| Used 72-foot air-boom, 2020 model, asked at $76,000 | $4,195 a year more fixed cost* | 8.39 at 500 corn acres; 4.20 at 1,000 | 1.75; 0.87 |
| New 72-foot air-boom, asked at $148,500 | $12,509 a year more fixed cost* | 25.02 at 500 corn acres; 12.51 at 1,000 | 5.21; 2.61 |
Basis: cost above the owned spinner of Section 1. Source: Crop Root Zone calculation; air-boom asking prices from Machinery Pete, Salford listings, accessed Nov 16, 2026 [15]. *Fixed cost only, on the Section 1 method at 5.41%, with the new machine's resale at 35% of its ask and the used machine's at 20% of the new ask. The air-boom rows leave out fan fuel and any repair difference, charge the whole premium to urea acres though the machine would also spread phosphate and potash, and rest on three new listings at one North Dakota dealer and one used unit. We found no pan data under an air-boom in the Missouri work; all six machines were spinners [1].
Half width is the cheap insurance. It costs $2.50 to $2.63 an acre across the farm sizes in Section 2, moves the break-even farm from 645 to 801 acres, and leaves the owner $3.33 to $3.65 an acre ahead of hiring. An air-boom is a different purchase. On 500 corn acres the new machine has to be worth more than 5 bushels an acre over a spinner. The Missouri penalties were that large in one field of two.
5. What the hired pass does and does not buy
What's new: Nothing in the surveys says which machine makes a hired pass, and the Missouri fields show where a spinner's errors are cheap.
Evidence:
The machine is not on the invoice. Iowa's survey has one dry line and does not say whether a spinner or an air-boom made the pass [2]. Neither do Nebraska's or Ohio's [10][11]. Scharf wrote in 2009 that most dry fertilizer in Missouri went on with spinners and that he heard more retailers talk of moving from air-booms back to spinners than the reverse [13]. In the 2016 tests every machine was a spinner [1]. We found no public figure for the share of custom dry acres spread by air-boom. A grower hiring a urea pass for evenness should ask which machine is coming and at what width.
Rate and timing carry the risk, more than the box. The four in-season fields got 40 to 50 pounds of nitrogen on top of a preplant program. Their patterns were as ragged as the others, and yield was the same at the high and low spots [1]. At 40 pounds the urea on the acre is worth $33.48, a quarter of the preplant load. A split program puts the spinner on the job where its errors are small in pounds. A whole-program preplant pass puts it on the one where they were worth 4.5 to 14 bushels.
The day. Owning buys the choice of day, and for urea the day matters more than it does for potash. Our November 2 piece found that urease-inhibitor trial results split on rain within days of application more than on crop or soil [17]. No survey prices the wait for a hired machine, and we have no public report of spring application backlogs to set against it.
What stays out of the model. Tendering, road time and a scale are not in the ownership cost, as in October [16]. Variable-rate urea is not modelled. The surveys price a variable-rate pass $1.28 above fixed-rate in Ohio and $2.82 above in Nebraska [10][11], and the listed spinners with rate controls ask up to $6,501 more than the cheapest hydraulic-drive units [5].
Ground Truth: Urea is the reason a spinner pencils on a 650- to 1,300-acre farm, and it is the load on which a spinner is least forgiving. The two facts point to the same program. Own the spinner, run phosphate and potash and the in-season or split nitrogen through it, and treat a whole-program preplant urea pass as a separate decision: pan-test for that product and that width first, spread it at half width for about half a bushel, or hire it and ask for the air-boom. A farm that will not put pans out is buying the machine to save 1.3 bushels on acres where the only field data we found lost 4.5 to 14.
References
- Peter Scharf (University of Missouri, Plant Sciences Division) with Newell Kitchen (USDA Agricultural Research Service), "Dry nitrogen fertilizer quality: Impact on spreading variability, Year 1 report," University of Missouri Extension; undated, reports 2016 field trials and by its own text was written after January 2017 — https://extension.missouri.edu/media/wysiwyg/Extensiondata/Pro/NutrientManagement/Docs/drynitrogenqualityreportyear1.pdf
- Iowa State University Extension and Outreach, Ag Decision Maker File A3-10, "2026 Iowa Farm Custom Rate Survey" (FM 1698), revised March 2026 — https://www.extension.iastate.edu/agdm/crops/pdf/a3-10.pdf
- USDA Agricultural Marketing Service, Illinois Production Cost Report (Bi-weekly), report 3195, week ending Nov 13, 2026 — https://www.ams.usda.gov/mnreports/ams_3195.pdf
- USDA AMS Livestock, Poultry and Grain Market News / Iowa Department of Agriculture Market News, Iowa Daily Cash Grain Bids, Nov 13, 2026 (CBOT closing settlement prices; December 2027 corn 479.75 cents) — https://www.ams.usda.gov/mnreports/ams_2850.pdf
- Machinery Pete, Dalton Ag Products pull-type fertilizer spreader dealer listings (42 listings, asking prices), accessed Nov 16, 2026 — https://www.machinerypete.com/applicators/pull-type-fertilizer-spreaders/dalton-ag-products
- Federal Reserve Bank of Chicago, AgLetter No. 2014, November 2026 (third-quarter 2026 survey; average operating-loan rate 7.41% as of Oct 1, 2026) — https://www.chicagofed.org/publications/agletter/2025-2029/november-2026
- Iowa State University Extension and Outreach, Ag Decision Maker File A3-29, "Estimating Farm Machinery Costs" (PM 710), revised March 2026 (Tables 1b, 2 and 3) — https://www.extension.iastate.edu/agdm/crops/pdf/a3-29.pdf
- Iowa State University Extension and Outreach, Ag Decision Maker File A3-27, "Fuel Required for Field Operations," revised February 2026 — https://www.extension.iastate.edu/agdm/crops/pdf/a3-27.pdf
- Iowa State University Extension and Outreach, Ag Decision Maker File A3-24, "Estimating the Field Capacity of Farm Machines" (PM 696), revised February 2026 — https://www.extension.iastate.edu/agdm/crops/pdf/a3-24.pdf
- Glennis McClure and Jim Jansen, University of Nebraska–Lincoln, Center for Agricultural Profitability, "2026 Nebraska Agricultural Custom Rates Report," 2026 — https://cap.unl.edu/sites/unl.edu.ianr.agecon.center-for-ag-profitability/files/media/file/2026-nebraska-custom-rates-report_ada.pdf
- Ohio State University Extension, "Ohio Farm Custom Rates 2026," summary dated June 29, 2026 — https://farmoffice.osu.edu/sites/aglaw/files/site-library/Ohio%20Farm%20Custom%20Rate%20Summary%202026%20June%2029.pdf
- Dermot Forristal and Francis Quigley, Teagasc, "Urea: even spread is essential," Today's Farm, January–February 2022, pp. 26–27 — https://teagasc.ie/wp-content/uploads/media/website/publications/2022/Fertiliser-Focus---Urea---even-spread-is-essential.pdf
- Peter Scharf, University of Missouri, "Streaky Fields and Uneven Application of N Fertilizer," Integrated Pest & Crop Management, vol. 19, no. 2, Feb 10, 2009 — https://extension.missouri.edu/media/wysiwyg/Extensiondata/Pro/NutrientManagement/Docs/Streaky_Fields_and_Uneven_Application_of_N_Fertilizer.pdf
- Peter Scharf, University of Missouri, "Streaky Nitrogen Applications: Why They Happen and What You Can Do About Them," Integrated Pest & Crop Management, Mar 16, 2010 — https://ipm.missouri.edu/cropPest/2010/3/Streaky-Nitrogen-Applications-Why-They-Happen-and-What-You-Can-Do-About-Them
- Machinery Pete, Salford pull-type fertilizer spreader dealer listings (first page of 67 listings, asking prices), accessed Nov 16, 2026 — https://www.machinerypete.com/applicators/pull-type-fertilizer-spreaders/salford
- Crop Root Zone, TRZ-0276, "Hiring a Dry Fertilizer Pass Costs $8.56 an Acre in Iowa at Today's Diesel. A New Pull-Type Spinner Asked at $36,362 Beats That Past About 640 Acres a Year. Renting One at the Surveyed $7.05 Does Not.," Oct 13, 2026.
- Crop Root Zone, TRZ-0329, "A Urease Inhibitor Adds About 6.5 Cents to a 73-Cent Pound of Urea Nitrogen. In Montana's Wheat Trials It Saved Enough Nitrogen to Pay in 9 of 17. Yield Moved in 1 of 9.," Nov 2, 2026.
Disclosures
Crop Root Zone is an independent publication. Nothing here is investment advice. Market calls, where included, reflect the editors' own read and are not a recommendation to buy or sell any security.
A Four-Track Row-Crop Tractor Asks About $70,000 More Than the Same Tractor on Duals. That Is $4 an Acre, or 0.9 Bushel of Corn, on 2,500 Acres, and No Tractor Trial We Found Is Built to Detect a Gain That Small.
Dealer asking prices put a 410-hp four-track about 14% above its wheeled twin, and published premiums run to 32%. Owning that premium costs $10,100 to $21,100 a year, which is 0.9 to 1.8 bushels of December 2027 corn per acre on 2,500 acres. The one Ohio State trial that measured it found duals at 6 psi compacted less than either track width, and Iowa State found no yield difference. Axle load, which belts do not change, sets the deep compaction. A gauge, VF tires at $237 a tire more, or central inflation gets the low pressure for 8 cents to about $1 an acre.
Dealers are asking a median $587,450 for a low-hour 2025 410-hp row-crop tractor on four tracks and $517,450 for the same model on wheels and duals (dealer listings, read Nov 12, 2026) [1][2]. The gap is $70,000. December 2027 corn was $4.8525 a bushel this morning (FXEmpire, Nov 12, 2026) [3]. The track is sold on two claims, traction and less compaction. The second is a yield claim, and yield claims can be priced. We costed the premium per acre, converted it to bushels, and read the university trials to see whether the bushels are there. An Iowa State trial that put tires and tracks on the same classes of planter tractor found no significant difference in corn yield (Gelder, Cruse and Zhang, Transactions of the ASABE, 2007) [4].
1. What tracks cost over duals
What's new: No manufacturer publishes a wheels-against-tracks price list we could open, and the standard extension source does not separate them. The University of Illinois lists a 310 PTO-hp tractor at $623,657 and a 640 engine-hp tractor at $778,865 for 2025, with one footnote: "List price includes either MFWD or 4WD for all tractors" (farmdoc, Aug 2025) [5]. The premium has to be assembled from dealer listings and trade reports.
Evidence:
| Source of the premium | Basis | Premium over wheels | |
|---|---|---|---|
| Tracks business manager, Firestone Ag | Tracked machines against tire machines, general statement, 2021 | 25–40% | ██████████ |
| One UK farm's purchase | Four-track 370-hp against the wheeled equivalent, 2020 purchase | about 32% | ████████ |
| UK launch report | Four-track row-crop against an equivalent wheeled model, 2020 | more than 20% | █████ |
| US trade report | Tracks over wheels, 2015 | 14–21% | █████ |
| 640-hp articulated, dealer asking prices | Median $722,299 four-track against $614,700 on duals, 2025 models | 17.5% ($107,600) | ████ |
| 410-hp row-crop, dealer asking prices | Median $587,450 four-track against $517,450 on duals, 2025 models | 13.5% ($70,000) | ███ |
Sources: DTN/Progressive Farmer, Sep 30, 2021 [8]; Farmers Weekly, Dec 12, 2022 [7]; Farmers Weekly, Apr 2020 [6]; Farm Progress, Mar 26, 2015 [9]; dealer listings read Nov 12, 2026 [1][2][10]. Asking-price rows are Crop Root Zone medians of the listings below. Bars scale to the 40% top of the Firestone range.
The listing rows need their limits stated. We read ten 410-hp listings and nine 640-hp listings from the search index. The listing pages themselves refused to open. The wheeled 410-hp units were $479,900 to $528,400 at 179 to 592 hours. The four-track units were $459,500 to $655,550 at 192 to 454 hours [1][2]. These are asking prices for nearly new machines, not list prices and not sale prices, and the units are not matched on options. One four-track at $459,500 was a farm-used unit priced below every wheeled tractor in the sample. With it removed the median premium is $72,450.
The same UK owner reported the four-track cost about 6% more than the two-track version of the same tractor [7]. We found no US price for the two-track.
Resale is the gap we could not close. Successful Farming reported in August 2024 that four-track articulated tractors were holding value better than other equipment categories [27]. The article is behind a paywall and we read only its teaser, which gives no numbers. We therefore assume the premium loses value at the same rate as the tractor.
2. What the premium costs per acre, and in bushels
What's new: The premium is a capital cost plus a wear cost. Replacement belts have published prices. A new 30-inch Camso 4500 belt lists at $13,938.95 and a new 36-inch Soucy belt for a four-track articulated at $10,644.15. A new 480/80R50 Firestone radial lists at $2,758.02 (NTS Tire Supply, accessed Nov 12, 2026) [12]. The same dealer's listing for the rear belt on the 410-hp four-track showed no price. Firestone's track warranty is four years or 4,000 hours, and the company's tracks manager says hard users get fewer hours [8]. The UK owner got about 4,000 hours from the original belts on a two-track. On the four-track the rear belts lasted about 1,200 hours and the fronts about 1,500, and the manufacturer paid for the replacements and blamed road heat [7].
Evidence: We follow the Illinois convention of a ten-year hold and 300 hours a year, with the tractor worth 36% of list at year ten on a purchase at 85% of list [5]. That leaves 42.4% of the purchase price, and we apply it to the premium. Interest is 7.12% on average investment, the rate this publication has used since the second-quarter Chicago Fed survey [11]. Insurance and housing are 1% of average investment [5]. Wear is four belts at the $12,292 average of the two listed prices against eight tires at $2,758, both over 4,000 hours. Equal life is our assumption, and using the rear-tire price for the fronts overstates the tire set.
| Premium paid | Depreciation | Interest | Insurance and housing | Belts less tires | Annual cost, $ | |
|---|---|---|---|---|---|---|
| $70,000 (asking-price median) | 4,036 | 3,547 | 498 | 2,033 | 10,114 | █████ |
| $103,490 (20% of the wheeled median) | 5,966 | 5,245 | 737 | 2,033 | 13,981 | ███████ |
| $165,584 (32%) | 9,546 | 8,391 | 1,179 | 2,033 | 21,149 | ██████████ |
Crop Root Zone estimate. Ten-year hold, 300 hours a year, 42.4% of purchase price remaining (farmdoc convention) [5]; 7.12% on average investment [11]; belt and tire prices from one dealer [12]; 4,000-hour life for both (assumption). Idlers, mid-rollers and bearings are not included because we found no published prices. Bars scale to $21,149.
If the premium is worth nothing at resale, the $70,000 case rises to $11,875 a year. If it is fully recovered, the cost falls to $7,717. The 640-hp premium of $107,600 costs about $12,400 a year in capital alone on the same terms.
Fuel is not in the table. In the Nebraska tests Case IH publishes, the wheeled 620-hp tractor delivered 17.63 hp-hours per gallon at maximum drawbar power and the four-track 16.63. At 75% of pull the figures were 16.61 and 15.87. The wheeled tractor also pulled more, 65,077 pounds against 57,556 (Case IH, citing Nebraska Tests 2164 and 2165, Sep–Oct 2016) [13]. Those are test-track results on a prepared surface, and we did not open the lab reports. On soft ground tracks slip less, so we charge neither side for fuel.
| Acres covered per year | $70,000 premium, $/acre | Bushels | 20% premium, $/acre | Bushels | 32% premium, $/acre | Bushels |
|---|---|---|---|---|---|---|
| 1,500 | 6.74 | 1.5 | 9.32 | 2.0 | 14.10 | 3.1 |
| 2,500 | 4.05 | 0.9 | 5.59 | 1.2 | 8.46 | 1.8 |
| 4,000 | 2.53 | 0.5 | 3.50 | 0.8 | 5.29 | 1.1 |
Crop Root Zone estimate. Bushels are corn at $4.60, which is December 2027 futures of $4.8525 [3] less the 25-cent basis this publication uses for new-crop corn. The bushels are needed on every acre the tractor covers, every year.
0.9 bushel an acre
What a $70,000 track premium has to return on 2,500 acres at $4.60 corn. On a 200-bushel crop that is 0.44% of yield. (Crop Root Zone estimate from dealer listings read Nov 12, 2026, and FXEmpire, Nov 12, 2026)
3. What the trials find when tires are inflated correctly
What's new: The trial most often cited in extension material is from Ohio State. It ran a four-wheel-drive tractor on 710/70R38 duals at 6 and 24 psi against a tracked tractor on 24- and 36-inch belts, with four replications, and measured the loss of air permeability in the soil at four depths (Abu-Hamdeh et al., 1995, as presented by University of Minnesota Extension, Feb 2023) [14].
Evidence:
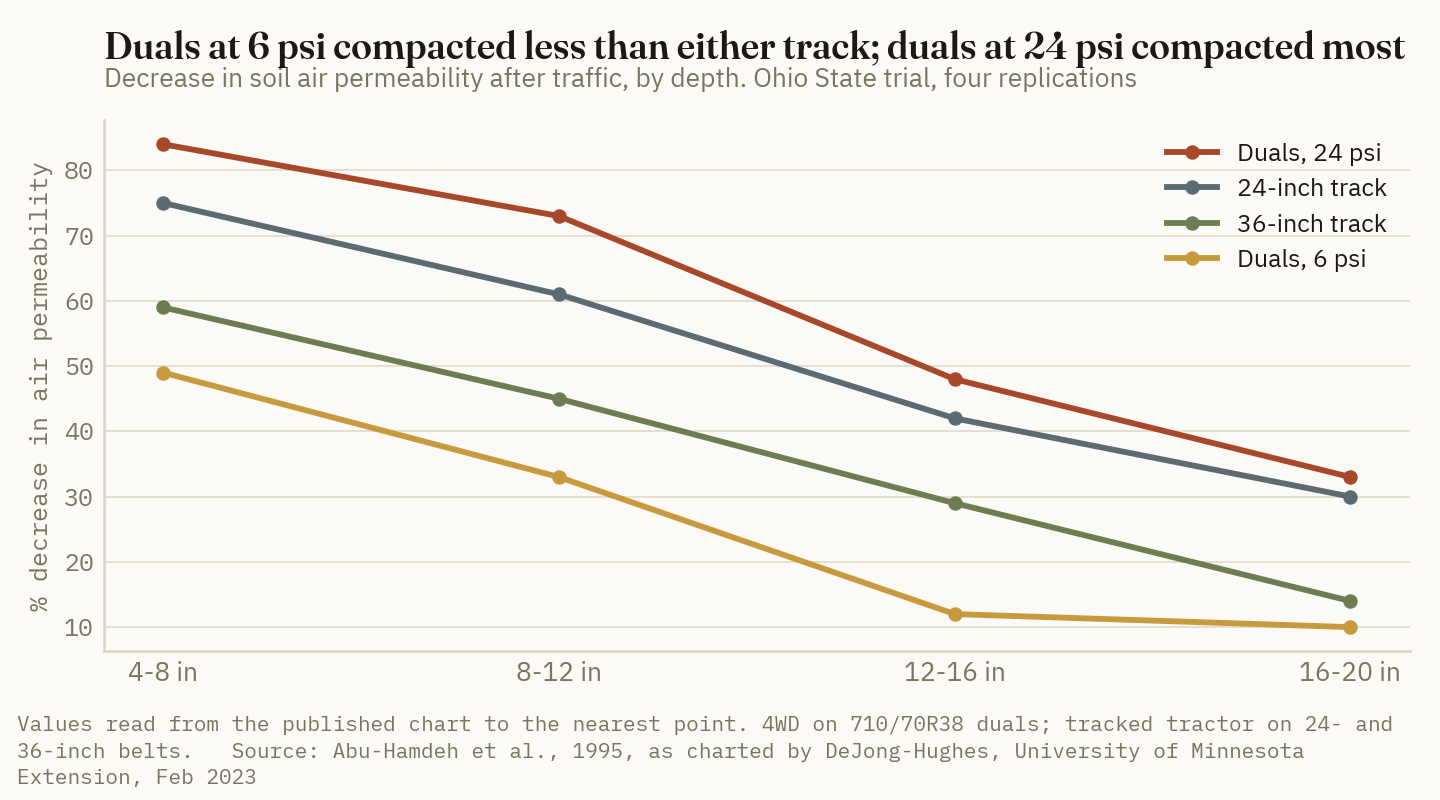
The result runs against the sales claim. Duals at 6 psi did the least damage at every depth. The 36-inch belt was second, the 24-inch belt third, and the duals at 24 psi last. Penn State's summary of what appears to be the same work gives the tractors as 310 hp tracked and 350 hp on duals and reaches the same conclusion (Duiker, Penn State Extension, updated Feb 12, 2005) [17]. Minnesota's current bulletin says "properly inflated radial tires can sometimes result in less compaction than tracks" (DeJong-Hughes and Daigh, University of Minnesota Extension, 2025) [15].
The reason is pressure peaks. A belt averages 4 to 7 psi on the ground. A radial tire presses 1 to 2 psi above its inflation pressure, so a tire at 6 psi exerts 7 to 8 (DeJong-Hughes, University of Minnesota Extension, Oct 14, 2019) [16]. The belt's average hides peaks under the drive wheel, idler and mid-rollers. Minnesota reproduces a measurement on a 225-hp tractor at 25,000 pounds on duals at 10 psi and its tracked twin at 25,300 pounds on 16-inch belts, and labels it: "Average contact pressure under rubber tracks is low, however, there are pressure points under guide wheels" [14].
| Trial | Comparison | Yield result |
|---|---|---|
| Iowa State, Clarion-Nicollet-Webster soils [4] | Tires and tracks on 4WD and MFWD planter tractors | No significant difference in emergence, yield or penetrometer resistance |
| Iowa, continuous corn, 1984–87 [18] | Track-type tractor against wheeled tractor for spring work | 148 against 139 bu/acre, four-year average |
| Ohio State, 16-row planter, 2016 [19] | Tracks against tires on the planter, one field | 3.9 to 7.4 bu/acre for tracks, whole field |
| Ohio State, same field, 2017 [19] | Wheeled and tracked tractor with wheeled and tracked planter | Sixteen charted values from 188 to 214 bu/acre; the slide text does not let us assign them to treatments |
| 2025 journal paper, planter tires with tracked and wheeled tractors [21] | Tracked against wheeled tractor | No statistically significant yield difference, from the abstract as indexed |
Sources as numbered. The 1984–87 figures are from Erbach et al., 1988, as shown in a 2020 Iowa State presentation; the slide does not describe the machines and we did not open the paper. The Ohio State rows are from conference slides, not a refereed paper. We could not open the 2025 paper.
Three results favor tracks. The oldest used a steel-track machine of the 1980s. The 2016 Ohio result is one field in one year and concerns belts on the planter, and we could not read the 2017 result on the same field from the slides. The Ohio State presenter's own break-even for the planter belts was a $40,000 kit over 1,730 acres, needing 6 bushels an acre at $3.86 corn [19].
Ground Truth: The bushels a track premium needs are too few for a field trial to see. At 2,500 acres the hurdle is 0.9 to 1.8 bushels, under 1% of a 200-bushel crop. The replicated trials that report "no significant difference" between tires and tracks could not have detected a difference that size, so they neither prove nor rule out a payback. None of the summaries we read reports a least significant difference, so that is our inference from the plot designs and not a published figure. The trials that do find a track advantage find 4 to 9 bushels, in one field-year or with 1980s machines. A buyer should not expect better evidence to arrive. The decision turns on a narrower question that the Ohio State data does answer: the comparison is with tires at the right pressure. A farm running duals at 20 psi or more in the field is comparing tracks with the worst line on the chart, and it can move to the best line with a gauge.
4. The compaction belts do not change
What's new: Contact pressure governs the topsoil. Axle load governs how deep the damage goes. Minnesota's guidance is to stay at or under 10 tons an axle to keep compaction in the top 10 to 12 inches, where tillage can reach it [15]. A track spreads the load over more ground. It does not make the machine lighter, and the four-track in the UK report shipped at 18.7 tonnes [6].
Evidence:
| Machine, loaded | Tons per axle | |
|---|---|---|
| Grain cart, 2,000 bu, one axle | 70–76 | ██████████ |
| Grain cart, 1,200 bu, one axle | 35–40 | █████ |
| Combine with 300 bu, front axle | 24 | ███ |
| Grain cart, 720 bu, one axle | 22 | ███ |
| Tractor, 330 hp MFWD, rear axle | 12 | ██ |
| Minnesota guideline | 10 | █ |
Sources: University of Minnesota Extension, Feb 2023 [14]; combine and tractor rows from Hanna, Iowa State University (retired), Jan 2020, who puts the 1,200-bushel cart at 46 tons [18]. Bars scale to 76 tons.
The tractor is the lightest machine on the list. An international series of more than 20 experiments found axle loads of 10 to 12 tons cut yields about 15% in the first year and 3% to 5% after ten years, with the deep-subsoil share still present after twelve [17]. In northwest Ohio, 10- and 20-ton axle loads cut corn and soybean yields in three of four years. In central and southeast Iowa, the same loads cut yield in one of nine site-years [18]. The loss depends on the soil and the year.
The second loss is the pinch row. In a three-year Iowa trial on Webster silty clay loam, corn with wheel tracks on both sides of the row yielded the same 157 bushels as corn with none. Corn with a track on the row and on both sides yielded 121 [18]. In a planter maker's 2020 Ohio plots, rows between tractor duals averaged about 194 bushels against 203 for untracked rows, a loss of 9 bushels in those rows and 2 bushels an acre across the planter (AgriNews, Mar 4, 2021) [20]. That is a manufacturer's own trial in one season. Two bushels an acre is also the size of the track hurdle in Section 2. A two-track or four-track tractor running between the rows removes the dual's pinch row, and this is the one mechanism in the public record that could plausibly carry the premium on a planter tractor.
Ohio State's department chair has said yield loss in grain-cart lanes may be smaller on tracks than on wheels when soil conditions are poor, (Western Producer, Apr 16, 2025) [22]. The same report says the first pass does about 85% of the damage. It gives no yield figures. We did not price tracks for carts or combines, and the cart's own economics are in TRZ-0296.
5. The cheaper ways to low ground pressure
What's new: The Ohio State chart says the target is low inflation pressure at the load carried. Three things deliver it for less than a belt. The first is a gauge and the tire maker's load table. The second is a VF tire, which carries the same load at 40% lower pressure than a standard radial (Irish Farmers Journal, Jan 25, 2023) [25]. A VF480/80R50 Firestone lists at $2,994.92 against $2,758.02 for the standard tire of the same size and tread, a premium of $236.90 or 8.6% [12]. The third is central tire inflation, which changes pressure between road and field from the cab. We found no published US price. UK prices were £13,490 for a factory system on a row-crop tractor, £16,950 for one aftermarket system and £6,000 to £8,000 for another (Farmers Weekly, Mar 2022) [24].
Evidence:
| Route to low ground pressure | Up-front cost, $ | Annual cost, $ | $/acre at 2,500 acres | Bushels at $4.60 |
|---|---|---|---|---|
| Gauge and load table | about 0 | about 0 | 0.00 | 0.0 |
| VF tires in place of standard, eight tires | 1,895* | 210 | 0.08 | 0.02 |
| Central tire inflation | 20,000* | 2,712 | 1.08 | 0.2 |
| Four tracks, asking-price premium | 70,000 | 10,114 | 4.05 | 0.9 |
| Four tracks, 32% premium | 165,584 | 21,149 | 8.46 | 1.8 |
Crop Root Zone estimate. *VF set assumes the $236.90 rear-tire premium on all eight tires, written off over 4,000 hours at 300 hours a year, with 7.12% interest on average investment. The $20,000 inflation system is an assumption, not a quoted price, taken over ten years with no salvage. Track rows from Section 2.
Correct pressure also pays in the field. In one trial Minnesota cites, a tractor at 13 and 11 psi used 1.43 gallons an acre, covered 13.2 acres an hour and slipped 7.1%. The same tractor at 24 psi used 1.75 gallons, covered 12.2 acres and slipped 10.8% [14].
The yield evidence for low pressure is better than the yield evidence for tracks, with one condition. A replicated trial on silty clay loam in central Illinois found low-pressure tires raised corn yield 4.31% in 2017 and 2.70% in 2018 and soybean yield 3.70% in 2018 (Shaheb et al., Soil Use and Management, 2024) [23]. On 200-bushel corn that is 5.4 to 8.6 bushels. The companion economic paper reports the gain came under deep tillage and that tire pressure did not affect yield under shallow tillage or no-till, as its abstract is indexed [26]. Trade coverage ties the trial to one tire maker's product. We could not confirm from the abstracts who paid for it.
Ground Truth: Tracks are the last step in the order of spending. A gauge costs nothing and moves a tractor from the worst line on the Ohio State chart to the best. VF tires cost 8 cents an acre and central inflation about a dollar, and the only replicated Corn Belt yield evidence for low ground pressure was produced with tires. The $4 to $8 an acre for belts buys what a tire cannot, which is traction and the ability to work on days when wheels would spin. Those are the days when the soil is wettest and compacts most, and the machine weighs at least as much as its wheeled twin. A track bought to protect yield will therefore do most of its extra work in the conditions that cost yield. Buy tracks for working days and slope stability and count them against timeliness. Charge compaction to tire pressure and to the 35-ton axle on the grain cart, because that is where the trials find the bushels.
References
- Dealer listings for 2025 John Deere 8R 410 tractors, read from the search index Nov 12, 2026; listing pages returned errors when opened ($525,000 at 179 hours; $509,900 at 300; $528,400 at 400; $479,900 at 592; one unit at $449,900 and 1,350 hours excluded) — https://www.fastline.com/farm-equipment/listing-detail/2025-john-deere-8r-410-united-ag-and-turf-navasota-texas/b5ec7676-22bb-4d89-be55-905888d407f9 ; https://www.fastline.com/farm-equipment/listing-detail/2025-john-deere-8r-410-platte-valley-equipment-clarkson-nebraska/5fdeeb6e-e62c-4645-862e-b1156e195621
- Dealer listings for 2025 John Deere 8RX 410 tractors, read from the search index Nov 12, 2026; pages not opened ($652,500 at 192 hours; $579,900 at 195; $589,900 at 265; $585,000 at 360; $655,550 at 423; $459,500 at 454, farm-used; one unit at $549,230 and 1,093 hours excluded) — https://tractorzoom.com/equipment/2025-john-deere-8rx-410-6284fc10-c1f1-40f8-a17c-dba6e1007eda ; https://checkout.rdoequipment.com/used-2025-john-deere-8rx-410-z246033/
- FXEmpire, corn futures contract page, delayed quotes timestamped Nov 12, 2026, 13:07 UTC (December 2027 corn 485.25; December 2026 corn 447.25) — https://www.fxempire.com/commodities/zc/contracts
- Gelder, B.K.; Cruse, R.M.; Zhang, X.Y., "Comparison of Track and Tire Effects of Planter Tractors on Corn Yield and Soil Properties," Transactions of the ASABE 50(2): 365–370, 2007 (abstract read on the AGRIS record) — https://agris.fao.org/search/en/providers/122535/records/65df666f6eef00c2cea2a054
- Lattz, D.; Schnitkey, G., "Machinery Cost Estimates: Tractors," University of Illinois farmdoc, Aug 2025 (list prices; purchase at 85% of list; ten years; 300 hours a year; salvage 36% of list; insurance and housing 1%) — https://farmdoc.illinois.edu/assets/management/machinery-costs/tractor_costs_2025.pdf
- Andrews, J., "Video: John Deere four-track 8RX – a genuine alternative to wheels?", Farmers Weekly, Apr 16–17, 2020 (premium of more than 20%; shipping weight 18.7 t; 7 psi ground pressure) — https://www.fwi.co.uk/machinery/tractors/301-400hp/video-john-deere-four-track-8rx-a-genuine-alternative-to-wheels
- Mark, O., "Driver's view: Soanes Farming rates its John Deere 8RX 370 tractor," Farmers Weekly, Dec 12, 2022 (about 32% over wheels and 6% over the two-track; belt life) — https://www.fwi.co.uk/machinery/tractors/401hp/drivers-view-soanes-farming-rates-its-john-deere-8rx-370-tractor
- Miller, D., "Track Protection," DTN/Progressive Farmer, Sep 30, 2021 (tracked machines 25% to 40% more; warranty four years or 4,000 hours; 16- and 18-inch belts for row crops) — https://www.dtnpf.com/agriculture/web/ag/magazine/article/2021/10/01/track-protection
- Farm Progress, "8 tracked tractor options," Mar 26, 2015 (tracks at a 14% to 21% premium; read from the search index, page refused to open) — https://www.farmprogress.com/farming-equipment/8-tracked-tractor-options
- Dealer listings for 2025 John Deere 9R 640 and 9RX 640 tractors, read from the search index Nov 12, 2026; pages not opened (9R 640: $686,995 at 5 hours; $619,500 at 313; $609,900 at 469; $639,900 at 507; $599,900 at 566; $589,900 at 605. 9RX 640: $739,900 at 200 hours; $722,299 at 500; $715,000 at 500) — https://www.fastline.com/farm-equipment/listing-detail/2025-john-deere-9r-640-riesterer-schnell-inc-hortonville-wisconsin/002fa794-bd40-4644-a2e9-4ac2dd0d3e09 ; https://www.fastline.com/farm-equipment/listing-detail/2025-john-deere-9rx-640-midwest-machinery-co-northfield-minnesota/6acf126a-55bb-48b0-b8d7-d83e295dcbd3
- Federal Reserve Bank of Chicago, AgLetter No. 2013, Aug 2026 (Q2 2026 average farm operating loan rate 7.12%) — https://www.chicagofed.org/publications/agletter/2025-2029/august-2026
- NTS Tire Supply, online store listings accessed Nov 12, 2026 (30-inch Camso 4500 General Ag track, new, $13,938.95; 36-inch Soucy agricultural-tread track for Case IH STX, new, $10,644.15; 480/80R50 Firestone Radial Deep Tread 23, $2,758.02; VF480/80R50 Firestone Radial Deep Tread 23, $2,994.92) — https://store.ntstiresupply.com/shop/f30at02943sis-30-camso-track-4500-general-ag-john-deere-8000t-100-43359 ; https://store.ntstiresupply.com/shop/1360tx42-2-36-soucy-track-agricultural-tread-case-ih-stx-100-43005 ; https://store.ntstiresupply.com/shop/360090-480-80r50-firestone-radial-deep-tread-23-r-1w-100-40346 ; https://store.ntstiresupply.com/shop/007493-vf48080r50-firestone-radial-deep-tread-23-r-1w-171b-100-36190
- Case IH, "Wheeled or Tracked — The Steiger 620 Sets New Performance Records," accessed Nov 12, 2026 (Nebraska Tractor Tests 2164 and 2165, Sep–Oct 2016; manufacturer's summary, lab reports not opened) — https://www.caseih.com/en-us/unitedstates/company/efficient-power/nebraska-test-results
- DeJong-Hughes, J., "Is Compaction Squeezing Your Yields?", University of Minnesota Extension, presented at the NDSU Advanced Crop Advisers Workshop, Feb 2023 (Abu-Hamdeh et al., 1995 chart; axle-load table; Lancas et al., 1996; Hoeft et al., 2000) — https://ndsu.edu/agriculture/sites/default/files/2023-02/ACAW%202023%20DEJONG-HUGHES%20Is%20Compaction%20Squeezing%20Your%20Yields.pptx.pdf
- DeJong-Hughes, J.; Daigh, A., "Soil Compaction Solutions: Prevention, Management, and Recovery," University of Minnesota Extension, 2025 — https://conservancy.umn.edu/server/api/core/bitstreams/e53affe4-d536-43d8-9de6-0a8cb62ccbc2/content
- DeJong-Hughes, J., "Soil compaction and ruts: What can you do?", University of Minnesota Extension, Oct 14, 2019 — https://blog-nwcrops.extension.umn.edu/2019/10/soil-compaction-and-ruts-what-can-you-do.html
- Duiker, S.W., "Avoiding Soil Compaction," Penn State Extension, updated Feb 12, 2005 — https://extension.psu.edu/avoiding-soil-compaction
- Hanna, M., "Dealing with Soil Compaction Considering Equipment of Today," Ohio State Precision University, Jan 9, 2020 (Erbach et al., 1988; Kaspar and Erbach, 1996; Melvin et al., 1994; Al-Adawi and Reeder, 1996; axle weights) — https://digitalag.osu.edu/sites/digitag/files/imce/publications/Soil_Compaction/3%20-%202020%20Precision%20U%20-%20Mark%20Hanna%20-%20Dealing%20with%20soil%20compaction%20considering%20equipment%20of%20today.pdf
- Klopfenstein, A., "Pinch-Row Compaction from Tractors and Planters Considering Field Variability," Conservation Tillage and Technology Conference, Mar 6, 2018 (slides; 2016 and 2017 yields; $40,000, 1,730 acres, 6 bu/acre at $3.86) — https://www.slideshare.net/slideshow/andrew-klopfenstein-pinchrow-compaction-from-tractors-and-planters-considering-field-variability/116537445
- AgriNews, "Planter compaction yield penalties," Mar 4, 2021 (AGCO 2020 crop tour; Ohio pinch rows) — https://www.agrinews-pubs.com/news/farm-equipment/2021/03/04/planter-compaction-yield-penalties
- "Planter tire configuration effects on soil compaction with tracked and wheeled tractors," Smart Agricultural Technology, 2025 (abstract as indexed; article refused to open; authors not confirmed) — https://www.sciencedirect.com/science/article/pii/S2772375525008524
- Halsall, M., "Supersized grain carts a weighty problem for soil compaction," The Western Producer, Apr 16, 2025 — https://www.producer.com/crops/supersized-grain-carts-a-weighty-problem-for-soil-compaction/
- Shaheb, M.R.; Misiewicz, P.A.; Godwin, R.J.; Dickin, E.T.; White, D.R.; Grift, T.E., "The effect of tire inflation pressure and tillage systems on soil properties, growth and yield of maize and soybean in a silty clay loam soil," Soil Use and Management 40(2), 2024 — https://hau.repository.guildhe.ac.uk/id/eprint/18084/
- Hill, P., "Central tyre inflation systems – the options and prices," Farmers Weekly, Mar 15–17, 2022 — https://www.fwi.co.uk/machinery/technology/central-tyre-inflation-systems-the-options-and-prices
- Forristal, D., "VF/IF tyres: are they worth the money?", Irish Farmers Journal, Jan 25, 2023 — https://www.farmersjournal.ie/machinery/farm-machinery/vf-if-tyres-are-they-worth-the-money-745241
- Shaheb, M.R.; Misiewicz, P.A.; Godwin, R.J.; Dickin, E.T.; White, D.R.; Lowenberg-DeBoer, J.M.; Shearer, S.A.; Grift, T.E., "An economic appraisal of the effect of tire inflation pressure for alternative tillage systems on a silty clay loam soil," Agronomy Journal, 2023 — https://hau.repository.guildhe.ac.uk/id/eprint/18008/
- Successful Farming, "Staying on Track," Aug 2024 (teaser text only, read on Magzter; full article paywalled) — https://magzter.com/stories/business/Successful-Farming/STAYING-ON-TRACK
Disclosures
Crop Root Zone is an independent publication. Nothing here is investment advice. Market calls, where included, reflect the editors' own read and are not a recommendation to buy or sell any security.
A 70-Foot Farm Truck Scale Costs About $12,600 a Year to Own. An Elevator Scale Inside Legal Tolerance Cannot Be Off by That Much Until a Farm Weighs 1.5 Million Bushels.
A scale dealer's published turnkey price is $95,000 to $125,000. At 7.12% money and a 20-year life that is about 2.5 cents a bushel on 500,000 bushels. Against Iowa's $11.15 average commercial weigh fee the scale needs 1,130 loads a year, and against state fine schedules it needs four to ten citations a year at 10,000 pounds over. It pays where weights are out of tolerance or in dispute. A grain-cart scale kit or a $12,200 set of wheel-load pads does the loading job for $460 to $1,655 a year.
Iowa farmers and custom operators reported paying an average of $11.15 to have a load weighed on someone else's truck scale this year, with a range of $5.00 to $19.25 (Iowa State University Extension, Mar 2026) [1]. A national truck-stop scale chain lists $15.25 for a first weigh (CAT Scale, accessed Nov 11, 2026) [2]. The alternative is to own the scale. One scale dealer publishes a price for a 70-by-11-foot steel-deck scale, installed turnkey, of $95,000 to $125,000 (American Scale, page dated Jul 10, 2022) [3]. Farm operating money cost 7.12% in the second quarter (Federal Reserve Bank of Chicago, Aug 2026) [4]. Harvest is ending, and every load that crossed an elevator scale this fall was settled on the buyer's weight. We priced the scale, its annual cost, and each thing it is supposed to earn.
1. What a 70-foot scale costs installed
What's new: Manufacturers do not publish truck-scale prices. The Rice Lake catalog page for its 70-foot, 100-ton steel-deck models shows "Consult" in the price column, on the copy indexed by search [5]. We found no extension publication that prices an on-farm truck scale. The only itemized public figures we could open are one Midwest scale dealer's cost guides. Its standard system is a 70-by-11-foot steel deck [3].
Evidence:
| Component | What it covers | Published price, $ | |
|---|---|---|---|
| Turnkey project | Scale, washdown indicator, foundation, installation, calibration, state paperwork | 95,000–125,000 | ██████████ |
| New installation, itemized total | Sum of the five lines below | 100,000–115,000 | █████████ |
| Basic installation | Scale, load cells, basic indicator, printer, installation, calibration. Buyer builds the foundation | 55,000–80,000 | ██████ |
| Scale equipment | Basic analog scale at the low end, heavy-capacity scale at the top | 45,000–80,000 | ██████ |
| Concrete foundation | Above-ground (pit-less), with ramps and approaches | about 30,000 | ██ |
| Installation and calibration labor | Setting, wiring and calibrating the scale and its peripherals | 4,000–7,500 | █ |
| Freight | Varies with distance and permits; 12-foot widths may need escorts | 2,500–4,500 | █ |
| Crane | Setting the modules | 2,500–3,500 | █ |
Sources: American Scale, "How Much Do Truck Scales Cost?", page dated Jul 10, 2022, headline since updated to 2026 [3]; American Scale, "How Much Does A Turn-Key Truck Scale Project Cost?", Jan 16, 2022 [6]. One dealer's published ranges, not a survey. Basis: 70-by-11-foot steel deck, delivered and installed in the dealer's Midwest territory. Bars scale to the $125,000 top of the turnkey range.
These prices have three weaknesses. They come from one seller. The itemized guide is dated January 2022, and the headline guide carries a 2026 title on a 2022 post date. The dealer also warns that steel surcharges of 5% to 15% can be added to a quote [3]. A buyer should treat $95,000 to $125,000 as a floor for 2026 and get a current quote.
On deck type, the same dealer says a concrete deck "may save some money" because it contains less steel, without giving a figure [3]. A new steel-deck scale and foundation installs in about a day. A concrete deck takes closer to ten days (American Scale FAQ, accessed Nov 11, 2026) [7]. We found no published price that separates the two.
"Legal for trade" is a regulatory status. A scale used to buy or sell by weight must hold a National Type Evaluation Program certificate and meet NIST Handbook 44. For a vehicle scale that means accuracy Class III L, with at least 2,000 scale divisions of 5 pounds or more (NIST Handbook 44, 2026 edition) [8]. Iowa then charges an annual license fee on each commercial device, $84 for a scale of more than 50,000 pounds capacity (Iowa Code 2025, section 214.3) [9]. The 70-foot scales in the dealer guides are certified models. We found no published price for a non-certified 70-foot scale, so we cannot say what skipping certification saves. Minnesota's current scale-inspection fee table would not open in readable form, and the rule that used to carry those fees was repealed in 2014.
2. What it costs to own each year
What's new: The purchase price matters less than the annual cost of owning the scale. That cost is depreciation, interest, calibration, licensing, taxes and insurance. The dealer puts annual truck-scale maintenance at $1,000 to $10,000 depending on the service bought, bills labor at $125 an hour plus zone travel, and recommends calibration at least twice a year [7][10].
Evidence: We use a 20-year life with no salvage value. We charge interest at the 7.12% operating-loan rate on half the cost [4]. We allow $2,000 a year for two calibration visits and minor repairs, $84 for the Iowa license, and 1% of cost for property tax and insurance. The life, the $2,000 and the 1% are our assumptions. Together they come to about 11.5% of installed cost a year.
| Installed cost, $ | Depreciation | Interest | Calibration and repairs | License | Tax and insurance | Annual cost, $ | |
|---|---|---|---|---|---|---|---|
| 125,000 (top of turnkey range) | 6,250 | 4,450 | 2,000 | 84 | 1,250 | 14,034 | ██████████ |
| 110,000 (central case) | 5,500 | 3,916 | 2,000 | 84 | 1,100 | 12,600 | █████████ |
| 80,000 (basic installation, top of range) | 4,000 | 2,848 | 2,000 | 84 | 800 | 9,732 | ███████ |
Crop Root Zone estimate. 20-year straight-line life, no salvage (assumption); interest at 7.12% on average investment (Federal Reserve Bank of Chicago, Aug 2026) [4]; $2,000 a year for calibration and repairs (assumption, inside the dealer's $1,000–$10,000 range) [10]; Iowa license fee [9]; 1% of cost for tax and insurance (assumption). The $80,000 row excludes the foundation the buyer must build. Bars scale to $14,034.
$12,600 a year
What a $110,000 turnkey 70-foot scale costs to own at 7.12% money over 20 years. Three-quarters of it is depreciation and interest, owed whether or not a truck crosses the deck. (Crop Root Zone estimate from American Scale's published prices and the Federal Reserve Bank of Chicago, Aug 2026)
The cost is fixed, so the cost per bushel depends on how much the farm weighs. A five-axle truck at 80,000 pounds gross and a 25,000-pound tare carries 55,000 pounds, or 982 bushels of corn. That is the tare this publication has used in its trucking pieces.
| Weighed per year | Loads at 982 bu | Corn acres at 200 bu | Cost per bushel, cents | Share of corn value | |
|---|---|---|---|---|---|
| 250,000 bu (7,000 st) | 255 | 1,250 | 5.0 | 1.23% | ██████████ |
| 500,000 bu (14,000 st) | 509 | 2,500 | 2.5 | 0.61% | █████ |
| 1,000,000 bu (28,000 st) | 1,018 | 5,000 | 1.3 | 0.31% | ███ |
| 2,000,000 bu (56,000 st) | 2,036 | 10,000 | 0.6 | 0.15% | █ |
Crop Root Zone estimate at $12,600 a year. Corn at $4.11 a bushel, the Barchart national average cash price in the first week of November 2026 [11]. The 200 bu/acre yield is illustrative. Bars scale to 5.0 cents.
3. Overweight fines and lost payload
What's new: Scale sellers lead with the overweight ticket. State fine schedules are public, and they show how many tickets it takes to cover the scale. Iowa prints a schedule by pounds overloaded for axles and axle groups. It assesses gross-weight violations at half that schedule and treats axle and gross overloads as separate violations (Iowa Code 2026, section 321.463) [12]. Minnesota charges a civil penalty on gross excess weight in five tiers, from one cent a pound to $610 plus 20 cents a pound above 7,000 pounds (Minnesota Statutes 2026, section 169.871) [13]. Illinois charges $100 up to 2,000 pounds over, $950 at 4,501 to 5,000 pounds, and above that $1,500 plus $150 for each further 500 pounds (625 ILCS 5/15-113, text current to Jan 1, 2025) [14].
Evidence:
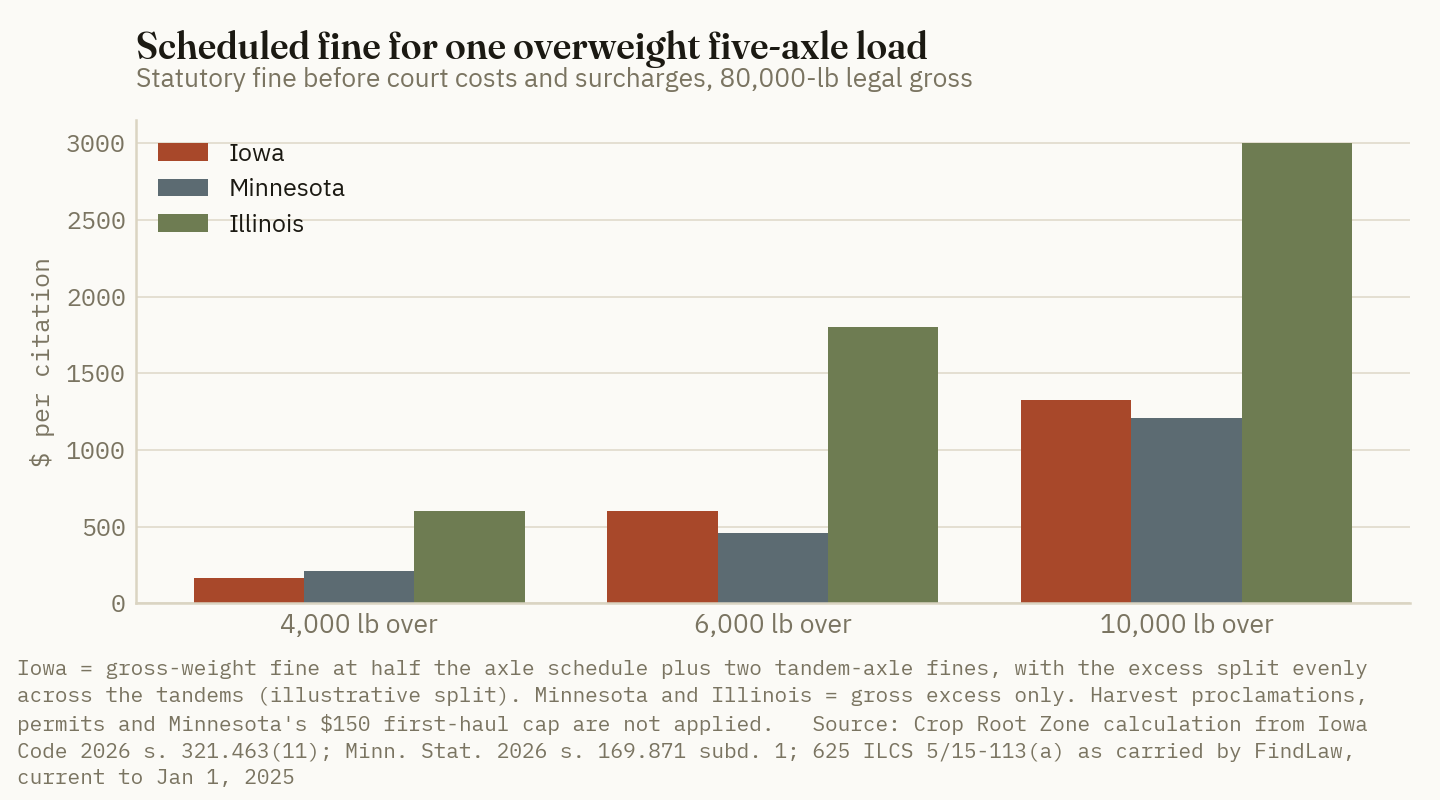
| Overload on an 80,000-lb limit | Iowa, $ | Minnesota, $ | Illinois, $ | Citations a year that equal $12,600 |
|---|---|---|---|---|
| 4,000 lb | 164 | 210 | 600 | 21 to 77 |
| 6,000 lb | 603 | 460 | 1,800 | 7 to 27 |
| 10,000 lb | 1,325 | 1,210 | 3,000 | 4 to 10 |
Crop Root Zone calculation from the statutes [12][13][14]. Iowa: gross fine at half the axle schedule plus two tandem-axle fines, with the excess split evenly across the tandems (an illustrative split). Minnesota and Illinois: gross excess only. Court costs, surcharges, harvest proclamations and permits are not included. We read the Illinois schedule on FindLaw because the legislature's own site failed a certificate check.
A farm would need to be ticketed four to ten times a year at 10,000 pounds over, in every year of the scale's life, for avoided fines alone to carry it. Minnesota also caps the penalty at $150 for a violation during a "first haul" when the vehicle has fewer than two gross-weight violations in the prior 12 months [13]. We did not check how that definition applies to every farm truck. We found no public data on how often farm trucks are weighed by enforcement, so the probability side of this calculation is unknown.
The more common cost is the opposite one. A driver without a scale loads light to stay legal. If the margin is 2,000 pounds a load, which is our assumption and not a measured figure, the truck gives up 36 bushels, or 3.6% of a 55,000-pound payload. Iowa's 2026 survey puts hauling to market at an average of $0.20 a bushel on a 25-mile one-way trip [1]. Recovering that margin is worth about 0.7 cents a bushel, or $3,600 a year on 500,000 bushels. A truck scale cannot do this job from the farmyard. The truck is loaded in the field, and the scale sees it only after it has travelled. Loading to the limit needs a scale at the point of loading. Section 5 prices that.
4. The weights a farm cannot check today
What's new: Without a scale of its own, a farm relies on its counterparty's scale to settle every load of grain sold and every load of fertilizer, lime or feed bought. Handbook 44 sets how wrong that scale may legally be. For Class III L the maintenance tolerance is one division up to 500 divisions of test load, two up to 1,000, and one more for each further 500. Acceptance tolerance for a new scale is half that [8]. On a scale reading in 20-pound divisions, 80,000 pounds is 4,000 divisions, so the scale may be off by eight divisions. That is 160 pounds, or 0.2%.
Evidence:
| Weight | How good it is | Basis |
|---|---|---|
| Commercial truck scale, in service | Within 160 lb at 80,000 lb (0.2%) | Handbook 44 maintenance tolerance, Class III L, 20-lb divisions [8] |
| Commercial truck scale, newly installed | Within 80 lb at 80,000 lb (0.1%) | Handbook 44 acceptance tolerance [8] |
| Wheel-load and portable axle-load weighers | Twice the tolerance of their class | Handbook 44, T.N.3.3, Class IIII [8] |
| Wisconsin vehicle scales tested in 2025 | 81.7% compliance on 654 scales | Wisconsin DATCP annual statistics [15] |
| Yield monitor, calibrated against a scale | Within 1% of weighed grain | Nielsen, Purdue University, Sep 5, 2018 [16] |
| Yield monitor, calibrated once at the start of harvest | Errors of 7% to 10% late in the season | Nielsen, Purdue University [16] |
| Bin inventory from measurements, FSA method | 3.62% average absolute error, 92 bins | Bhadra et al., Transactions of the ASABE, 2018 [17] |
| Bin inventory from measurements, RMA method | 5.65% average absolute error, 92 bins | Bhadra et al., 2018 [17] |
Sources as listed. The 160-lb and 80-lb figures are Crop Root Zone arithmetic on the Handbook 44 table. The Wisconsin report gives one compliance figure for vehicle scales and does not say how far out of tolerance the failing scales were or in which direction.
At the tolerance limit a scale is off 160 pounds on a full truck. That is 2.9 bushels of corn, or about $11.74 at $4.11 [11]. A net weight uses two weighings, and their errors partly cancel. An elevator scale that passes inspection therefore cannot cost a seller more than about 0.2% of the crop. The owned scale costs 0.61% of crop value at 500,000 bushels and 0.31% at one million (Section 2).
The Wisconsin figure cuts the other way. In 2025 the state tested 654 vehicle scales and reported 81.7% compliance [15]. Roughly one tested scale in five failed on something. The report does not say whether the failures were weighing errors or other defects, how large they were, or whether they favored the buyer or the seller. It does show that "the scale is certified" is not the same as "the scale is right today."
The other weights a farm relies on are worse than any truck scale. Bin inventories measured by the two federal methods averaged 3.62% and 5.65% absolute error across 92 bins [17]. On 300,000 bushels in store, 3.62% is 10,860 bushels, or about $44,600 of corn that the farm cannot say it has or does not have. A calibrated yield monitor is good to about 1%, and one calibrated only on the first day can be 7% to 10% out by the end of harvest [16]. A scale puts a known weight on every calibration load and every load into the bin.
Landlord settlement is the hardest use to price. Weighed tickets make a crop-share split a matter of record. Once a scale divides money between two parties it may count as a commercial device, which brings certification, licensing and inspection. Iowa's fee applies to "a person who uses or displays for use a commercial weighing and measuring device" [9]. We did not find a state ruling on whether crop-share settlement meets that definition. A farm should ask its weights-and-measures office before buying.
Ground Truth: A scale inside legal tolerance cannot be wrong by enough to pay for a second scale. On a 500,000-bushel farm the owned scale costs three times the largest error a passing elevator scale is allowed. Its value is as a check against scales like the roughly one in five that did not pass in Wisconsin and against input deliveries nobody reweighs, and it cannot be booked in advance. The useful first step costs $11 a load. Run a sample of loads over an independent commercial scale this winter, inbound fertilizer included, and compare the tickets. If the differences stay inside 0.2%, the capital case for a truck scale on verification grounds is closed. If they do not, the farm has found something worth more than the scale.
5. Break-even volume, and the cheaper ways to weigh
What's new: Each benefit can be turned into the annual volume at which it alone covers $12,600. A grain-cart scale and a set of portable wheel-load pads both have published prices. A Digi-Star GT 560 indicator kit with automatic unload logging lists at $3,389.40. It includes the indicator, sensor and cables, and assumes the cart already has load cells (Ag Express, accessed Nov 11, 2026) [18]. A six-pad wired Intercomp PT300 wheel-load system rated 120,000 pounds in 10-pound steps lists at $12,207.60, a four-pad set at $8,522.10 and a two-pad set at $4,656.60 (ScalesGalore, accessed Nov 11, 2026) [19].
Evidence:
| What the scale has to earn | Unit value | Volume that covers $12,600 a year |
|---|---|---|
| Replace a commercial weigh fee, Iowa average | $11.15 a load | 1,130 loads, about 1.11 million bu |
| Replace a truck-stop weigh | $15.25 a load | 826 loads, about 811,000 bu |
| Recover a 2,000-lb loading margin* | 0.73 cents/bu at $0.20/bu hauling | 1.73 million bu |
| Find a 0.2% weight error (the legal limit) | 0.82 cents/bu at $4.11 corn | 1.53 million bu, 42,900 st |
| Find a 0.5% weight error | 2.06 cents/bu | 613,000 bu, 17,200 st |
| Find a 1.0% weight error | 4.11 cents/bu | 307,000 bu, 8,600 st |
| Avoid overweight citations | $1,210 to $3,000 each at 10,000 lb over | 4 to 10 citations a year |
Crop Root Zone estimate. Fees from Iowa State University Extension, Mar 2026 [1], and CAT Scale [2]; corn price from Barchart [11]; fines from Section 3. *The 2,000-lb margin is an assumption. Stated another way, the weight-error rows mean $12,600 equals 0.2% of $6.3 million of goods weighed, 0.5% of $2.52 million or 1.0% of $1.26 million. Purchased fertilizer, lime and feed count toward that total at their own prices.
The benefits add up, but slowly. On 500,000 bushels the scale costs $12,600. If it also recovered the full loading margin, worth $3,636, the weights it checks would still have to be wrong by 0.44% of a $2.06 million crop. That is more than twice the legal tolerance, in every year.
| Way to weigh | Up-front cost, $ | Annual cost, $ | Cost per weigh at 250 loads, $ | At 1,000 loads, $ | Legal for trade |
|---|---|---|---|---|---|
| Own a 70-ft truck scale | 110,000 | 12,600 | 50.40 | 12.60 | Yes, if certified and licensed |
| Six wheel-load pads | 12,208 | 1,655* | 6.62 | 1.66 | Not this model. Class IIII weighers carry twice the tolerance |
| Grain-cart scale indicator kit | 3,389 | 460* | 1.84 | 0.46 | No |
| Pay a commercial scale | 0 | 0 | 11.15 | 11.15 | Yes |
Crop Root Zone estimate. *Ten-year life and 7.12% interest on average investment (assumptions), before calibration. Pad price for the six-scale wired PT300 system [19]. The dealer's list marks only one PT300 model as certified, a 20,000-lb by 50-lb unit at $10,015 for six. Cart kit price [18]. Commercial fee is the Iowa average [1] and excludes the detour.
The table has two limits. We did not find an independent test of grain-cart scale accuracy against certified scales, so the cart row carries no accuracy claim. A 2012 trade report quoted Saskatchewan farmers saying spindle scales on carts were less accurate than advertised. The same report quoted an axle-pad maker's claim of 0.25% (Top Crop Manager, Oct 2, 2012) [20]. Six pads also do not weigh an 18-wheeler in one draft. The truck is weighed an axle group at a time on level ground, which takes several minutes a load.
On cost per weigh, owning the scale beats the $11.15 fee only above 1,130 loads a year. Pads beat the fee above about 150 loads.
Ground Truth: A truck scale checks other people's weights, and it does that from the wrong place for loading a truck. The loading problem costs 0.7 cents a bushel and is solved in the field by a cart scale the farm probably already owns or can add for $3,400. The ticket problem is solved by pads for $12,200. Only the verification problem is left for the $110,000 scale. On the numbers above, a farm should weigh more than about a million bushels a year across its own deck, counting inputs, before verification alone can carry the scale. Below that, the scale pays only where the farm sells weight to others. Seed sales, custom drying and storage for neighbours are examples. In those cases the scale will generally have to be certified, licensed and inspected, and the farm takes on the obligations of a commercial weigher.
References
- Johanns, A.M.; Hart, C.E., "2026 Iowa Farm Custom Rate Survey," Ag Decision Maker File A3-10 (FM 1698), Iowa State University Extension and Outreach, Mar 2026 (using truck scale, per load weighed: average $11.15, median $10.00, range $5.00–$19.25, 8 responses; hauling grain to market by truck, 25 miles one way: average $0.200/bu) — https://www.extension.iastate.edu/agdm/crops/pdf/a3-10.pdf
- CAT Scale Company, "Frequently Asked Questions," accessed Nov 11, 2026 (first weigh $15.25, reweigh $5.25; no effective date shown) — https://catscale.com/contact-us/faq/
- American Scale Co., "How Much Do Truck Scales Cost?", page dated Jul 10, 2022, headline updated to 2026, accessed Nov 11, 2026 (70-by-11-ft steel deck; basic installation $55,000–$80,000; turnkey $95,000–$125,000; freight $2,500–$4,500; steel surcharges 5%–15%) — https://www.americanscaleus.com/knowledge-center/2020/10/12/how-much-do-truck-scales-cost
- Federal Reserve Bank of Chicago, AgLetter No. 2013, Aug 2026 (Q2 2026 average farm operating loan rate 7.12%; farm real estate 6.79%) — https://www.chicagofed.org/publications/agletter/2025-2029/august-2026
- Rice Lake Weighing Systems, SURVIVOR OTR truck scale catalog page (prices shown as "Consult"; read from the search index, page not opened) — https://ricelake.com/resources/catalogs/survivor-otr-sv-catalog-page
- American Scale Co., "How Much Does A Turn-Key Truck Scale Project Cost?", Jan 16, 2022 (scale $45,000–$80,000; above-ground foundation with ramps about $30,000; installation and calibration $4,000–$7,500; crane $2,500–$3,500; new installation total $100,000–$115,000) — https://www.americanscaleus.com/knowledge-center/how-much-does-a-turn-key-truck-scale-project-cost
- American Scale Co., "Frequently Asked Questions," accessed Nov 11, 2026 (service rate $125 an hour plus zone travel; calibration twice a year at the low end; steel deck about 1 day to install, concrete deck closer to 10) — https://www.americanscaleus.com/faq
- National Institute of Standards and Technology, Handbook 44, 2026 edition, Section 2.20 "Scales" (Table 3 class parameters; Table 6 maintenance tolerances; T.N.3.2 acceptance tolerances; T.N.3.3 wheel-load weighers) — https://www.nist.gov/document/2026-nist-handbook-44-section-220
- Iowa Code 2025, Section 214.3, "License fees" (commercial weighing devices; scales of 50,001 lb capacity or more, $84) — https://www.legis.iowa.gov/docs/code/2025/214.3.pdf
- American Scale Co., "Scale Service Cost Guide," Sep 30, 2022 (annual truck scale maintenance $1,000–$10,000; labor $125 to $200 an hour) — https://www.americanscaleus.com/knowledge-center/scale-service-cost-guide
- Barchart, "Corn Falling to Kick Off Tuesday," as carried by Nasdaq, first week of Nov 2026 (cmdtyView national average cash corn $4.11 1/2; read from the search index, article would not load) — https://www.nasdaq.com/articles/corn-falling-kick-tuesday
- Iowa Code 2026, Section 321.463, "Maximum gross weight — exceptions — penalties" (subsection 11 fine schedule) — https://www.legis.iowa.gov/docs/code/321.463.pdf
- Minnesota Statutes 2026, Section 169.871, "Excess weight; civil penalty" (subd. 1 schedule; subd. 1b first-haul cap) — https://www.revisor.mn.gov/statutes/cite/169.871
- Illinois Vehicle Code, 625 ILCS 5/15-113(a), as carried by FindLaw, current to Jan 1, 2025 — https://codes.findlaw.com/il/chapter-625-vehicles/il-st-sect-625-5-15-113/
- Wisconsin Department of Agriculture, Trade and Consumer Protection, Bureau of Weights and Measures, "Annual Statistics, 1/1/2025–12/31/2025" (vehicle scales: 654 units tested, 81.7%) — https://datcp.wi.gov/Documents2/WMStats2025.pdf
- Nielsen, R.L., "Yield Monitor Calibration: Garbage In, Garbage Out," Purdue University Pest&Crop newsletter, Issue 2018.23, Sep 5, 2018 — https://extension.entm.purdue.edu/newsletters/pestandcrop/?p=1051
- Bhadra, R.; Casada, M.E.; Turner, A.P.; Montross, M.D.; Thompson, S.A.; McNeill, S.G.; Maghirang, R.G.; Boac, J.M., "Stored Grain Pack Factor Measurements for Soybeans, Grain Sorghum, Oats, Barley, and Wheat," Transactions of the ASABE 61(2): 747–757, 2018 — https://uknowledge.uky.edu/bae_facpub/221
- Ag Express Electronics, "Digi-Star GT 560 Indicator Kit with AutoLog," listing accessed Nov 11, 2026 ($3,389.40) — https://store.agexpress.com/digi-star-gt-560-indicator-kit-with-autolog
- ScalesGalore, Intercomp PT300 wheel-load scale listings, accessed Nov 11, 2026 (wired 20,000 lb × 10 lb: two-scale $4,656.60, four-scale $8,522.10, six-scale $12,207.60) — https://scalesgalore.com/Intercomp_wheel_Scales.cfm
- Williams, D., "Crop farmers demand accurate truckload weighing systems," Top Crop Manager, Oct 2, 2012 — https://www.topcropmanager.com/crop-farmers-demand-accurate-truckload-weighing-systems-12156/
Disclosures
Crop Root Zone is an independent publication. Nothing here is investment advice. Market calls, where included, reflect the editors' own read and are not a recommendation to buy or sell any security.
A New Machine Shed Costs About $2.82 a Square Foot a Year to Own. A Combine Covers Its Stall Ten Times Over on Trade-In Alone. A Grain Cart Does Not.
At a $30-a-square-foot shell, 6.79% money and a 25-year life, a combine's stall costs about 0.2% of the machine's new value a year. The extension studies credit housing with about 2% a year in trade-in value alone. On trade-in alone, shed space pays above roughly $141 of machine value per square foot for harvest equipment and $564 for tillage tools and carts. Below that line, old rented space at $0.34 to $1.42 a square foot is the better bet, or the machine stays outside.
A 470-horsepower combine carried a $784,500 list price in the University of Illinois' August 2025 machinery cost estimates. Its 12-row corn head listed at another $173,500 (farmdoc, Aug 2025) [1]. The combine used in those estimates listed at $587,000 in 2021 (Schnitkey et al., farmdoc daily, Oct 14, 2025) [2]. Post-frame builders' published prices for a basic machine-storage shell now run roughly $15 to $35 a square foot [3][4]. Farm real estate money cost 6.79% in the second quarter (Federal Reserve Bank of Chicago, Aug 2026) [5]. Harvest is finishing, and a lot of equipment is about to spend the winter outside. The extension rule that housing pays for itself was set when combines cost a fraction of today's price and sheds a few dollars a square foot. We repriced both sides. The useful test is how much machine value sits on each square foot of floor, compared with what that square foot costs to own.
1. What a shed costs to build in 2026
What's new: There is no current extension survey of machine-shed construction costs. The most recent extension worked examples are old. Virginia Tech's 2001 example priced a 2,700-square-foot building at $45,000 (Howe, Virginia Cooperative Extension, Jun 2001) [6]. Georgia's bulletin, last revised in 2017, used $6.00 a square foot for an open-sided steel shed with a dirt floor (Worley and Russell, UGA Extension B1173, rev. Apr 18, 2017) [7]. Current prices come from builders, and we label them that way.
Evidence:
| Published cost basis | Building | $/sq ft | |
|---|---|---|---|
| Builder, finished: slab, insulation, liner | 40×60 to 60×100, Indiana | 48–59 | ██████████ |
| Builder, insulated or workshop barns | National guide | 25–40 | ███████ |
| Builder, shell | 40×60 to 60×100, Indiana | 28–35 | ██████ |
| Builder state averages, pole barns, before slab and site work | Iowa 26, Illinois 27, Kansas 25, N. Dakota 26.50, Minnesota 28 | 25–28 | █████ |
| Builder, basic storage barns | National guide | 15–20 | ███ |
| Extension example, 2001 | 2,700 sq ft, Virginia | 16.67 | ███ |
| Extension example, 2017 revision | 50×100 open-sided steel, dirt floor | 6.00 | █ |
Sources: Wabash Valley Post Frame Co., May 20, 2026 (published package totals: shell $68,500–$83,500 for 40×60 and $170,500–$208,500 for 60×100; complete $116,500–$142,000 and $290,500–$355,500; per-square-foot figures are Crop Root Zone division) [3]; Summertown Metals pole barn cost guide, 2025–2026 (state averages exclude site prep, slab, electrical and insulation) [4]; Howe, Virginia Cooperative Extension, Jun 2001 [6]; Worley and Russell, UGA B1173, rev. Apr 18, 2017 [7]. Builder figures are sellers' published ranges, not surveys. Bars scale to the $59 top of the finished range.
The two builder sources agree more than their headlines suggest. A bare shell with gravel inside runs high-$20s a square foot in the Corn Belt, and a building with a slab and insulation costs about twice that. A machine shed should be sized to the next combine, not this one. The Indiana builder notes "the next combine or planter is usually bigger than the current one" [3]. A steel-building supplier tells buyers to plan 20% to 30% more floor than the current fleet needs, a 16-to-18-foot clear height at the door, and a 40-to-60-foot clear apron in front (Steelco Buildings, May 12, 2026) [8].
2. What a square foot costs to own each year
What's new: Construction cost is the wrong number to weigh against a machine. The relevant number is the annual cost of owning the space: depreciation, interest on the money tied up, property tax, insurance and repairs. Georgia's bulletin uses 20-year straight-line depreciation, 8% interest on average value, 3% of cost for taxes and insurance, and 0.5% for repairs, which comes to $3,750 a year on a $30,000 shed, or $0.75 a square foot (UGA B1173) [7]. Virginia Tech's 2001 example came to $2.76 a square foot with 15-year depreciation and 8% interest [6].
Evidence: We use a 25-year life with no salvage, interest at the 6.79% farm real estate rate on half the cost, and 2% of cost a year for taxes, insurance and repairs. That 2% sits between the Virginia (1.9%) and Georgia (3.5%) assumptions. Together these come to about 9.4% of construction cost a year.
| Build cost or rent, $/sq ft | Depreciation | Interest | Taxes, insurance, repairs | Annual cost, $/sq ft | |
|---|---|---|---|---|---|
| 59.25 (builder top, finished) | 2.37 | 2.01 | 1.19 | 5.57 | ██████████ |
| 45 (insulated) | 1.80 | 1.53 | 0.90 | 4.23 | ████████ |
| 30 (central case, shell) | 1.20 | 1.02 | 0.60 | 2.82 | █████ |
| 15 (basic) | 0.60 | 0.51 | 0.30 | 1.41 | ███ |
| 6 (UGA 2017 example) | 0.24 | 0.20 | 0.12 | 0.56 | █ |
| Rent: Ohio, machinery storage, average (8 responses) | — | — | — | 1.42 | ███ |
| Rent: Ohio, median | — | — | — | 0.80 | █ |
| Rent: Minnesota, new, large, cement floor | — | — | — | 0.34 | █ |
Crop Root Zone estimate for owned space: 25-year straight-line life, no salvage; interest at 6.79% on average investment (Federal Reserve Bank of Chicago, Aug 2026) [5]; 2% of cost for taxes, insurance and repairs (assumption). Rents: Ward et al., Ohio Farm Custom Rates 2024, Ohio State University Extension (range $0.25–$3.00) [9]; Bau, "Selected Farm Rents, Rates, and Values," University of Minnesota Extension, Dec 2023 (all machine storage average $0.30, range $0.04–$1.00) [10]. Bars scale to $5.57.
$2.82 a square foot a year
What a new $30-a-square-foot machine-storage shell costs to own at 6.79% money, before anything goes inside it. Old space rents for $0.34 to $1.42. (Crop Root Zone estimate; rents from Ohio State Extension, 2024, and University of Minnesota Extension, Dec 2023)
The rent lines are the most useful row in the table. Existing machine sheds rent for half or less of what new space costs to own, and in Minnesota for about an eighth. Minnesota's newer, larger buildings with cement floors averaged $0.34 [10]. Ohio's median was $0.80 on a small sample [9]. Minnesota's own guidance says a building built specifically to rent should earn 12% to 16% of its original cost a year [10], which at $30 would be $3.60 to $4.80. Nobody is paying that. Rents are low because the space was paid for long ago and has few other uses. That makes rented space a separate and cheaper option, not a benchmark for new construction.
Ground Truth: The cheapest machine storage in most counties is a shed someone else already paid for. New space at $2.82 a square foot costs two to eight times what existing sheds rent for, and 79% of that $2.82 is interest and depreciation on new money. Before getting a builder's quote, a farm should find out whether there is empty floor within a short haul. At these rents, sheds left over from consolidated farms are an underpriced asset. Only the machines that clear the new-construction bar in Section 5 need a new roof.
3. How much floor a modern fleet takes
What's new: Purdue's machinery-storage planning guide is still the most detailed published source on stall sizes. It lists an 8- or 12-row combine base at 26 by 14.5 feet, or 377 square feet. A 12-row planter takes 429 square feet and a 4WD tractor over 300 horsepower takes 270. It recommends multiplying actual dimensions by 1.15 for maneuvering room. A combine with its header attached needs about 20% more floor (Parsons et al., Purdue AE-115) [11]. Those dimensions date from 1986. Today's machines are larger. A 2026 builder guide puts a combine with a grain head at more than 30 feet long and over 16 feet tall, and a large tractor on duals at 21 feet wide by 22 feet long [8].
Evidence: We found no manufacturer transport dimensions we could verify for current combines and sprayers. The Deere 412R sprayer page returned a 404, and a spec aggregator returned 403. The footprints below therefore scale Purdue's dimensions to current machine classes and are labelled as estimates.
| Machine | Purdue AE-115 area, sq ft (1986 class) | 2026 stall estimate incl. 15% allowance, sq ft | |
|---|---|---|---|
| Self-propelled sprayer, 120-ft boom | — | 630* | ██████████ |
| Planter, 24-row (Purdue: 12-row) | 429 | 565* | █████████ |
| High-performance disk, 42-ft (Purdue: tandem 32–38 ft) | 475 | 545* | █████████ |
| Older field cultivator | — | 500* | ████████ |
| Combine, 470 hp, header off (Purdue: 8/12-row base) | 377 | 465* | ███████ |
| Grain cart, 1,000 bu (Purdue: 650-bu gravity wagon) | 136 | 415* | ███████ |
| 12-row corn head on cart | — | 370* | ██████ |
| 35-ft grain platform on cart | — | 340* | █████ |
| 4WD tractor, over 300 hp | 270 | 310 | █████ |
| Total, nine machines | 4,140* |
Sources: Parsons, Strickland, Jones and Friday, "Planning Guide to Farm Machinery Storage," Purdue Extension AE-115 [11]; Steelco Buildings, May 12, 2026 [8]. *Crop Root Zone estimate. The tractor stall is Purdue's 270 sq ft × 1.15; duals would add about half again. Bars scale to 630 sq ft.
The fleet in the table needs about 4,140 square feet, which fits a 60-by-70 building. Footprint per dollar is where the machines differ. A sprayer and a planter each take more floor than the combine. A grain cart takes about as much as a 12-row corn head and is worth about half as much.
4. What outdoor storage costs: the evidence, and how old it is
What's new: We found no published study of the last 20 years that measures what outdoor storage does to a modern machine's resale value, repair bill or downtime. There are newer academic auction studies of remaining value. The ones we found model condition, hours, make and age, but none isolates indoor storage as a variable. Machinery Pete's listings and sale reports mention "always shedded" as a selling point but do not put a price on it. Every figure below comes from dealer surveys or engineering estimates of 1986 to 2001 vintage, as extension bulletins revised as late as 2017 report them.
Evidence:
| Machine | Purdue (1986): extra trade-in allowed for housed units | UGA B1173: higher resale after 5 years | Grisso and Melvin (1996): trade-in, % of price per year | Grisso and Melvin: trade-in + repairs + downtime, % per year |
|---|---|---|---|---|
| Combine and harvest equipment | up to 25% | 23.7% | 2.0 | 6.7 |
| Planters and drills | up to 25% | 22.1% | 1.2 | 4.9 |
| Tractors | 10–15% | 16.5% | 1.6 | 4.3 |
| Tillage | 10–15% | 10.0% | 0.5 | 1.6 |
Sources: Parsons et al., Purdue AE-115, 1986 (Midwest dealer survey) [11]; Worley and Russell, UGA B1173, rev. Apr 18, 2017 (percent of resale price) [7]; Grisso and Melvin, 1996, as tabulated by Howe, Virginia Cooperative Extension, Jun 2001 (percent of initial price, 10-year life) [6].
The three sources broadly agree. Harvest and planting equipment loses the most outside, because rubber, belts, bearings, electronics and sheet metal on those machines take the most weather damage. Tillage tools lose the least. Virginia Tech's 2020 machinery-life guide made the same ranking, saying tires, belts and hoses "deteriorate rapidly" outside [12]. That guide has since been withdrawn from Virginia Tech's site. A downtime comparison often cited in extension material, 7.6% for housed equipment against 14.3% for unhoused, traces to a University of Nebraska historical publication that returned a 403 when we tried to open it. We could not verify it, so the analysis below does not use it.
Two cautions apply. First, these percentages were measured on machines that cost a small fraction of today's prices. Nothing guarantees that a 2% annual trade-in effect still holds on a $667,000 combine, whose resale price may depend more on hours, technology package and dealer demand. Second, the repair and downtime factors were engineering estimates, not measured results. We therefore use the trade-in factor alone, the smallest and best-documented of the three, as the central case.
Ground Truth: The research that supports "house your equipment" ended about when yield monitors arrived. The direction of the effect is not in doubt. The size of it on a six-figure machine is not known. A farm that needs certainty should test its own numbers. Before trade-in, ask the dealer to price the same model with and without a shed history. That is the auction study nobody has published.
5. Where the line falls: machine value per square foot
What's new: Shed space pays when the machine's annual gain from housing exceeds the annual cost of its stall. Dividing both sides by floor area turns that into a single threshold. Divide the annual cost per square foot by the yearly benefit as a share of value, and you get the machine value per square foot above which housing pays. At $2.82 a square foot and the trade-in factor alone, the threshold is about $141 for harvest equipment, $176 for tractors, $235 for planters and $564 for tillage tools.
Evidence:
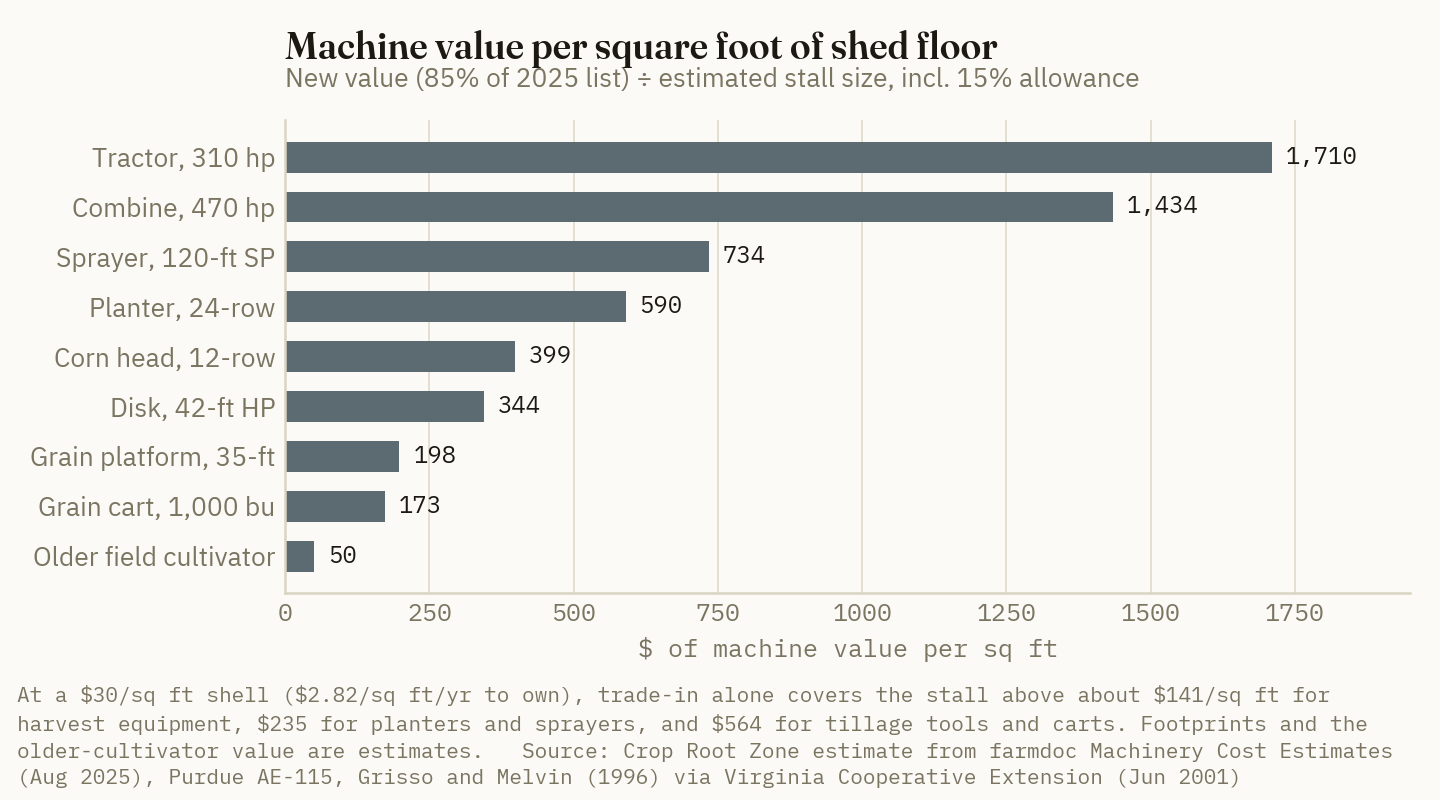
| Machine | New value, $ | Stall, sq ft | Value per sq ft, $ | Stall cost per yr, $ | Trade-in gain per yr, $ | Gain ÷ cost, trade-in only | Gain ÷ cost, all three factors |
|---|---|---|---|---|---|---|---|
| Combine, 470 hp | 666,825 | 465* | 1,434 | 1,311 | 13,336 | 10.2 | 34.1 |
| Tractor, 310 hp | 530,108 | 310 | 1,710 | 874 | 8,482 | 9.7 | 26.1 |
| SP sprayer, 120-ft | 462,136 | 630* | 734 | 1,776 | 5,546† | 3.1 | 12.8 |
| 12-row corn head | 147,475 | 370* | 399 | 1,043 | 2,950 | 2.8 | 9.5 |
| Planter, 24-row | 333,093 | 565* | 590 | 1,592 | 3,997 | 2.5 | 10.2 |
| 35-ft grain platform | 67,405 | 340* | 198 | 958 | 1,348 | 1.4 | 4.7 |
| HP disk, 42-ft | 187,295 | 545* | 344 | 1,536 | 936 | 0.6 | 2.0 |
| Grain cart, 1,000 bu | 71,612 | 415* | 173 | 1,170 | 358† | 0.3 | 1.0 |
| Older field cultivator | 25,000* | 500* | 50 | 1,409 | 125 | 0.1 | 0.3 |
Crop Root Zone estimate. New value is 85% of list per farmdoc's purchase-price convention (farmdoc Machinery Cost Estimates, Aug 2025) [1][13]. Stall cost at $2.82/sq ft (Section 2). Trade-in and total factors from Grisso and Melvin (1996) via Howe (2001) [6], applied to new value; heads use the combine factors. *Estimate. †The sprayer is not in the source table and carries the planter factors; the grain cart carries the tillage factors. Ratios above 1.0 mean housing pays.
The table splits the fleet in two. The combine, the tractor, the sprayer, the planter and the corn head cover their stalls 2.5 to 10 times over on trade-in alone. Even if the 1990s trade-in effect has shrunk by 90% on modern machines, the combine still roughly breaks even (13,336 × 0.1 ÷ 1,311 = 1.02). Even in a finished $59 building at $5.57 a square foot, all five still clear their thresholds. The grain cart, the high-performance disk and older tillage tools do not cover a new stall on trade-in alone. Only the full Grisso and Melvin factors bring the disk to 2.0 and the cart to break-even, and those include the engineering estimates for repairs and downtime.
The whole nine-machine fleet in a $30 shell costs about $11,700 a year to house, against about $37,100 a year of trade-in benefit, a ratio of 3.2. In a finished building the cost is about $23,000 a year and the ratio 1.6. Nearly all of that benefit comes from five machines.
The lower-value iron is a case for rented space. At Ohio's $0.80 median rent, the tillage-factor threshold drops from $564 to $160 per square foot. The disk ($344) clears it comfortably, and the cart ($173) just does. An older field cultivator worth $50 a square foot does not justify any roof that costs money.
Ground Truth: The question this winter is not whether a shed pays. For the five machines that carry most of a grain farm's capital, the answer is yes at any builder's price published this year. The useful question is what goes in the shed when it is full. Fill it by value per square foot: tractor and combine first, then sprayer, planter and corn head. Tillage tools, carts and platforms get whatever space is left, or a neighbour's old shed at under a dollar a square foot. A farm that parks the planter outside to make room for a disk is losing value on a $333,000 machine to protect a $187,000 one that takes about the same floor. A farm sizing a new building should size it to the high-value machines alone, plus 20% for the next combine. On the evidence available, adding floor just to house tillage tools does not pay.
References
- University of Illinois, Department of Agricultural and Consumer Economics (Lattz, D.; Schnitkey, G.), "Machinery Cost Estimates: Harvesting," Aug 2025 (470 hp combine list $784,500; 12-row corn head $173,500; 35-ft platform $79,300; 1,000-bu grain cart $84,250; purchase price 85% of list; insurance and housing 1.0% of remaining value) — https://farmdoc.illinois.edu/assets/management/machinery-costs/harvest_operations_2025.pdf
- Schnitkey, G.; Paulson, N.; Zulauf, C.; Zwilling, B., "Large Increase in Machinery Costs Suggests Need to Reconsider Machinery Purchase Decisions," farmdoc daily (15):189, Oct 14, 2025 — https://farmdocdaily.illinois.edu/2025/10/large-increase-in-machinery-costs-suggests-need-to-reconsider-machinery-purchase-decisions.html
- Wabash Valley Post Frame Co., "Pole Barn Machine Shed Costs, Indiana," May 20, 2026 (published builder package ranges) — https://wvpfco.com/blogs/building-insights/pole-barn-machine-shed-protect-equipment-indiana
- Summertown Metals, "Pole Barn Cost Guide," 2025–2026 (published builder ranges and state averages) — https://summertownmetals.com/pole-barn/pole-barn-cost-guide/
- Federal Reserve Bank of Chicago, AgLetter No. 2013, Aug 2026 (Q2 2026 average farm real estate loan rate 6.79%) — https://www.chicagofed.org/publications/agletter/2025-2029/august-2026
- Howe, J.E., "How to Evaluate the Financial Advantage of Housing Farm Equipment," Farm Business Management Update, Virginia Cooperative Extension, Jun 2001 (Table 1 from Grisso and Melvin, 1996) — https://sites.ext.vt.edu/newsletter-archive/fmu/2001-06/evaluatefinancialadvantage.html
- Worley, J.W.; Russell, L.A., "Economics of Farm Storage Buildings," University of Georgia Extension Bulletin 1173, minor revision Apr 18, 2017 — https://fieldreport.caes.uga.edu/publications/B1173/
- Steelco Buildings, "Farm Machinery Storage Buildings: Planning Space for Modern Agricultural Equipment," May 12, 2026 (builder guidance) — https://www.steelcobuildings.com/farm-machinery-storage-buildings-planning-space-for-modern-agricultural-equipment/
- Ward, B.; Richer, E.; Barker, J.; Bennett, A., "Ohio Farm Custom Rates 2024," Ohio State University Extension (machinery storage, $/sq ft/yr: average $1.42, median $0.80, 8 responses) — https://farmoffice.osu.edu/sites/aglaw/files/site-library/farmmgtpdf/Ohio%20Farm%20Custom%20Rates%20Factsheet%202024%20FinalA.pdf
- Bau, D., "Selected Farm Rents, Rates, and Values," University of Minnesota Extension, Dec 2023 (machine shed rent; new-building rent guideline 12–16% of original cost), as posted by University of Wisconsin–Madison Extension, Richland County, 2024 — https://richland.extension.wisc.edu/files/2024/05/umn-farm-2024_2-19-select-rents-rates-and-values.pdf
- Parsons, S.D.; Strickland, P.M.; Jones, D.D.; Friday, W.H., "Planning Guide to Farm Machinery Storage," Purdue University Cooperative Extension AE-115, 1986 — https://www.extension.purdue.edu/extmedia/ae/ae-115.html
- Grisso, R., "Five Strategies for Extending Machinery Life," Virginia Cooperative Extension 442-451 (BSE-327P), May 13, 2020 (listing page says the publication is no longer available; text as indexed in the PDF copy) — https://pubs.ext.vt.edu/442/442-451.html ; https://aaec.vt.edu/content/dam/pubs_ext_vt_edu/442/442-451/BSE-327.pdf
- University of Illinois, Department of Agricultural and Consumer Economics, "Machinery Cost Estimates: Field Operations," Aug 2025 (24-row planter list $391,874; 120-ft self-propelled sprayer $543,689; 42-ft high-performance disk $220,347) — https://farmdoc.illinois.edu/assets/management/machinery-costs/field_operations_2025.pdf; and Lattz, D.; Schnitkey, G.; Paulson, N.; Zulauf, C., "Machinery Cost Estimates for 2025," farmdoc daily (15):159, Sep 2, 2025 (310 PTO hp tractor list $623,657) — https://farmdocdaily.illinois.edu/2025/09/machinery-cost-estimates-for-2025.html
Disclosures
Crop Root Zone is an independent publication. Nothing here is investment advice. Market calls, where included, reflect the editors' own read and are not a recommendation to buy or sell any security.
A Quart of Potassium Silicate Costs $8.60 and Carries a Quarter-Pound of Silicon. Wheat Straw Removes 40 Pounds. In the Louisiana Wheat Trial Sellers Cite, the Lime-Only Plot Tied Every Silicon Treatment.
The one public price we found for a field-labelled liquid silicate is $85.95 for 2.5 gallons, or $34 a pound of silicon, about 150 times our estimate for silicate slag. A label-rate spray puts 0.1 to 0.5 lb of silicon on an acre and needs 0.7 to 3.6 bushels of December 2027 corn as a tank-mix partner, or 2.7 to 5.5 bushels with its own ground pass. Louisiana State pot work found sprayed silicon did not raise silicon in the rice plant. We found no land-grant field trial of foliar silicon reporting corn or soybean yield. The same chemistry is registered with EPA as a fungicide, and that is the claim a buyer can hold a seller to.
A silicon spray for row crops finally has a public price. A 2.5-gallon jug of 29% potassium silicate, labelled for cereal grains and soybeans, lists at $85.95 at one online distributor (Forestry Distributing, Nov 16, 2026) [3]. By our conversion of the product's federal label, each gallon holds about 1.0 lb of silicon, so the silicon costs roughly $34 a pound. A quart costs $8.60 and carries a quarter-pound. Rutgers puts the silicon removed in a wheat crop's straw at about 40 lb an acre (Heckman, Rutgers Cooperative Extension, Oct 2017) [12]. Our October piece on calcium silicate slag [16] left the liquid row of its price table blank and said a foliar program could not replace what a crop removes. This piece fills in the blank. It prices the spray and the pass, converts both to 2027 bushels, and sets them against the trial record for sprayed silicon specifically. That record is thinner than the one for slag, and the best-known trial in it says something different from its headline.
1. What is in the jug, and what a pass costs
What's new: The product with a public price is not sold as a fertilizer. Sil-MATRIX LC is registered with the US Environmental Protection Agency as a fungicide, miticide and insecticide, with potassium silicate at 29% as the active ingredient. Its master label covers cereal grains, including corn, wheat, rice and sorghum, and lists soybean among legume crops (Certis USA, EPA Reg. No. 70051-127, accepted Feb 26, 2021) [2]. The label rate for agronomic crops is a 0.25% to 1% solution by volume. The cap is 10 quarts an acre per application, which the label equates to 7.5 lb of active ingredient [2]. That gives 3.0 lb of potassium silicate a gallon.
Evidence: The label does not state silicon content, so we derive it. The 29% strength matches the composition PQ Corporation publishes for its AgSil 25 solution: 8.3% K2O and 20.8% SiO2 (PQ Corporation, AgSil brochure, Jun 2011) [5]. On that split, 3.0 lb of potassium silicate holds 2.14 lb of SiO2, which is 1.0 lb of silicon, and 0.86 lb of K2O. Treat both as our estimates. A buyer should ask for the analysis in writing.
| Product | Price found | Basis | $/gal | Label or maker's rate | Silicon applied, lb/acre |
|---|---|---|---|---|---|
| Sil-MATRIX LC, 2.5 gal | $85.95 | Online distributor list price, fetched Nov 16, 2026 | 34.38 | 0.25%–1% solution; 10 qt/acre cap | 0.1 to 2.5 |
| Sil-MATRIX LC, 2.5 gal | $92.50, $93.85* | Two other online listings | 37.00–37.54 | Same | Same |
| AgSil 25, 55-gal drum | $1,591* | Online listing | 28.93 | Maker's foliar guide: 49 fl oz per 100 gal water | 0.08 at 20 gal/acre |
| CropSIL, 1 liter | $95.50* | Online listing | 361 | 2–5 fl oz/acre* | Not derived |
| Sili-Max, 10% Si | No public price found | n/a | n/a | 4–8 fl oz/acre, twice | 0.064–0.128 total |
Sources: Forestry Distributing listing [3]; other listings as indexed by search on Nov 16, 2026, when the retailer pages returned rate-limit errors [4]; rates from the Sil-MATRIX LC master label [2], the PQ brochure [5] and the Huma Gro research report [8]. *Read from search-index text, not from the page itself. Silicon per acre is a Crop Root Zone conversion: 1.0 lb Si per gallon of 29% potassium silicate. These are small-package list prices. A drum or tote price from an ag retailer should be lower, and we found none published.
Spray volume sets the dose. The label's dilution table runs from 20 to 250 gallons of water an acre [2]. At a ground rig's 20 gallons, a 0.5% solution is 0.4 quart and a 1% solution is 0.8 quart. The label's text for agronomic crops calls for 50 to 250 gallons of finished spray, where 1% is 2 quarts [2]. Product cost is therefore $3.44, $6.88 or $17.19 an acre at the fetched price. The 10-quart cap costs $85.95.
Application is the other half. Iowa State's 2026 survey, from 205 responses, put self-propelled ground spraying at $9.35 an acre, aerial at $12.00 and drone at $12.50, materials not included (Iowa State University Extension, FM 1698, Mar 2026) [6]. The label asks for complete coverage of stems and foliage, a non-ionic surfactant for best results, and repeat applications no sooner than 7 days apart [2]. A program is more than one pass.
2. The dose: tenths of a pound against tens of pounds
What's new: With a silicon content attached, the spray can be set beside the soil materials on the same unit. The comparison is not close.
Evidence:
| Source of silicon | Rate | Silicon delivered, lb/acre | Share of 40 lb wheat-straw removal |
|---|---|---|---|
| Sili-Max foliar, two passes | 4–8 fl oz each | 0.064–0.128 | 0.16%–0.32% |
| Potassium silicate, 0.5% in 20 gal | 0.4 qt | 0.10 | 0.25% |
| Potassium silicate, 1% in 20 gal | 0.8 qt | 0.20 | 0.5% |
| Potassium silicate, 1% in 50 gal | 2 qt | 0.50 | 1.25% |
| Potassium silicate, label cap | 10 qt | 2.5 | 6.25% |
| Steel slag, 14% Si, LSU pot rate | 4.5 t/ha | 616 | 15 times removal |
| Wollastonite, 23% Si, LSU pot rate | 4.5 t/ha | 1,062 | 27 times removal |
Source: Sili-Max rates from the Huma Gro report [8]; potassium silicate rates from the Sil-MATRIX LC label [2] with Crop Root Zone's silicon conversion; slag and wollastonite from Agostinho et al., 2017, converted from 690 and 1,190 kg Si/ha [7]; wheat-straw removal from Rutgers FS1278 [12]. Basis: elemental silicon per acre, single application unless stated.
0.25 lb
Silicon in a quart of 29% potassium silicate, by our conversion of the label. Wheat straw removes about 40 lb an acre. (Certis USA label, Feb 26, 2021; Rutgers Cooperative Extension, Oct 2017) [2][12]
Price follows the same gap. Silicon in the jug costs about $34 a pound. Our October scenario for slag, $75 a ton delivered and spread at 17% silicon, works out to 22 cents a pound [16]. That slag price was our estimate, not a quote, so the ratio of about 150 to 1 is an estimate too. It would take a tenfold error in the slag price to change what it means.
The plant evidence matches the arithmetic. Louisiana State University grew rice in pots with wollastonite, slag or a foliar silicon solution sprayed at three growth stages, four replications. Wollastonite raised silicon in the biomass at harvest from 4.46% to 5.38%. The sprayed plants did not differ from unsprayed ones: 2.97% against 2.92% at flowering. The authors wrote that sprayed silicon "did not increase Si content and uptake by rice" (Agostinho, Tubana, Martins and Datnoff, Plants, Aug 29, 2017) [7]. Washing the sprayed leaves removed more silicon, which the authors read as dried deposit on the surface. They named root absorption as the only uptake route shown so far [7]. The study was funded in part by USDA and by a slag processor, Edw. C. Levy Co. [7]. That funding would favour the soil materials, and grain yield went the other way: the highest foliar rate gave 45.8 g a pot against 43.2 for the check and 37.2 for slag, with only the slag difference significant [7].
Rutgers reaches the same position from the field. Its fact sheet says spraying silicon fertilizers on foliage is generally not effective, that plants benefit more from soil application, and that silicon has to reach the roots continuously to suppress disease [12].
Ground Truth: A silicate spray is priced and dosed like a pesticide because that is what it is. Nothing that puts a tenth of a pound of an element on a crop that takes up tens of pounds is feeding the crop, and the one study that looked found the element stayed on the leaf surface. A seller who describes a foliar silicate as "supplying silicon" is describing the soil materials. The honest foliar claim is a film on the leaf, and a film has to be judged the way a protectant fungicide is judged: against a named disease, at a stated interval, beside an untreated strip.
3. The trial record for sprayed silicon
What's new: We searched for North American field trials, run by universities or public agencies, that applied silicon as a spray and reported yield. For corn we found none. For soybeans we found disease data without yield. For wheat there is one Louisiana field trial, published by the product's maker. The soil-applied record, covered in October [16], gains one more wheat study that found no benefit.
Evidence:
| Crop | Study | Who ran it | Design | Result |
|---|---|---|---|---|
| Rice | Agostinho et al. 2017 [7] | LSU AgCenter | Pots, 4 reps; foliar at 3 stages vs. soil wollastonite and slag | Foliar did not raise plant silicon. No yield gain over the check |
| Wheat | Huma Gro report, 2018 [8] | LSU plots, published by the manufacturer | Field, 4 reps, randomized blocks; site count and year not stated | Foliar band +10 bu/acre, broadcast +7 over control. Lime-only plot not different from any silicon treatment |
| Soybean | Lemes et al. 2011 [9] | University researchers, Plant Disease | Greenhouse and field; soil wollastonite and foliar potassium silicate | Rust progress cut by up to 43% (soil) and 36% (foliar). Soil silicon delayed onset about 3 days. No yield in the abstract |
| Wheat | Guével et al. 2007 [10] | Canadian researchers | Greenhouse; root vs. foliar soluble silicon | Root feeding cut powdery mildew by up to 80%. Foliar less effective. Neither raised growth |
| Wheat | Walsh et al. 2018 [11] | University of Idaho | Field, irrigated, 3 site-years, 4 reps; dry volcanic-tuff product, soil-applied | No significant yield effect in 2 site-years. One rate up and one rate down in the third. No protein effect |
| Corn | None found | n/a | n/a | n/a |
Source: as cited in each row. The Lemes and Guével rows rest on abstracts, the second as indexed by search; neither full paper was read. The Walsh trial used a soil-applied product and is included as new row-crop evidence since October, not as a foliar result.
The Louisiana wheat trial deserves a second reading. The report's text says the foliar band raised yield by 10 bushels and the broadcast spray by 7 over the control, from 0.064 and 0.128 lb of silicon an acre, and it stresses that this was 1,900 to 3,900 times less silicon than the dry sources [8]. The report's own Figure 1 carries mean-separation letters at the 5% level. The foliar band is marked "a", steel slag "ab", and wollastonite, the foliar broadcast and the lime plot all "abc". The control is "d" [8]. Every treatment shares a letter with every other except the control. The lime plot received no silicon, and read from the chart it stands at about the same height as the broadcast spray, near 32 bushels against roughly 24 for the control. Our October piece said the report gave no significance; the chart does, and we correct that here.
Ground Truth: In the one field trial offered for liquid silicon on wheat, lime with no silicon did statistically as well as 250 lb of silicon from slag, 250 lb from wollastonite, and a tenth of a pound from a jug. The simplest reading is that the control plot was acid and unlimed, and everything that fixed or sidestepped that problem won. The report does not give soil pH, so that is our inference and not a finding. It does mean the trial cannot separate a silicon effect from a liming effect, and the 10-bushel figure should not be quoted without the lime bar beside it. On a field that needs lime, 8 bushels were available from lime.
The Idaho work is the cleanest null for the dry route in a major wheat region. Soft white winter wheat received 140, 280 or 560 kg of silicon a hectare at planting or tillering. Yield did not respond in two of three site-years. In the third, one rate at tillering raised yield and a lower rate at the same timing cut it. The authors wrote that they could not confirm a benefit under irrigated, unstressed conditions [11]. No silicon soil test was run, and the product's maker supplied the material [11].
4. The break-even in 2027 bushels
What's new: On the morning of November 16, December 2027 corn was quoted at $4.79, November 2027 soybeans at $11.86 and July 2027 Kansas City wheat at $6.4225 (FXEmpire, delayed quotes, Nov 16, 2026) [1]. Those are futures. A cash bid is lower by the local basis, so every break-even below is slightly understated for a grower selling at the elevator.
Evidence:
| Potassium silicate program | Product, $/acre | Corn bu | Soybean bu | Wheat bu | Corn bu with a $9.35 ground pass | |
|---|---|---|---|---|---|---|
| 0.4 qt (0.5% in 20 gal) | 3.44 | 0.72 | 0.29 | 0.54 | 2.67 | █░░░░░░░░░ |
| 0.8 qt (1% in 20 gal) | 6.88 | 1.44 | 0.58 | 1.07 | 3.39 | ██░░░░░░░░ |
| 2 qt (1% in 50 gal) | 17.19 | 3.59 | 1.45 | 2.68 | 5.54 | ███░░░░░░░ |
| 10 qt (label cap) | 85.95 | 17.94 | 7.25 | 13.38 | 19.90 | ██████████ |
Source: Crop Root Zone calculation. Product at $34.38 a gallon [3]; rates from the label [2]; futures from FXEmpire, Nov 16, 2026 [1]; ground rate from Iowa State [6]. Basis: break-even bushels = cost ÷ futures price, one application. The bar column scales corn bushels with the ground pass, 19.90 = ten blocks.
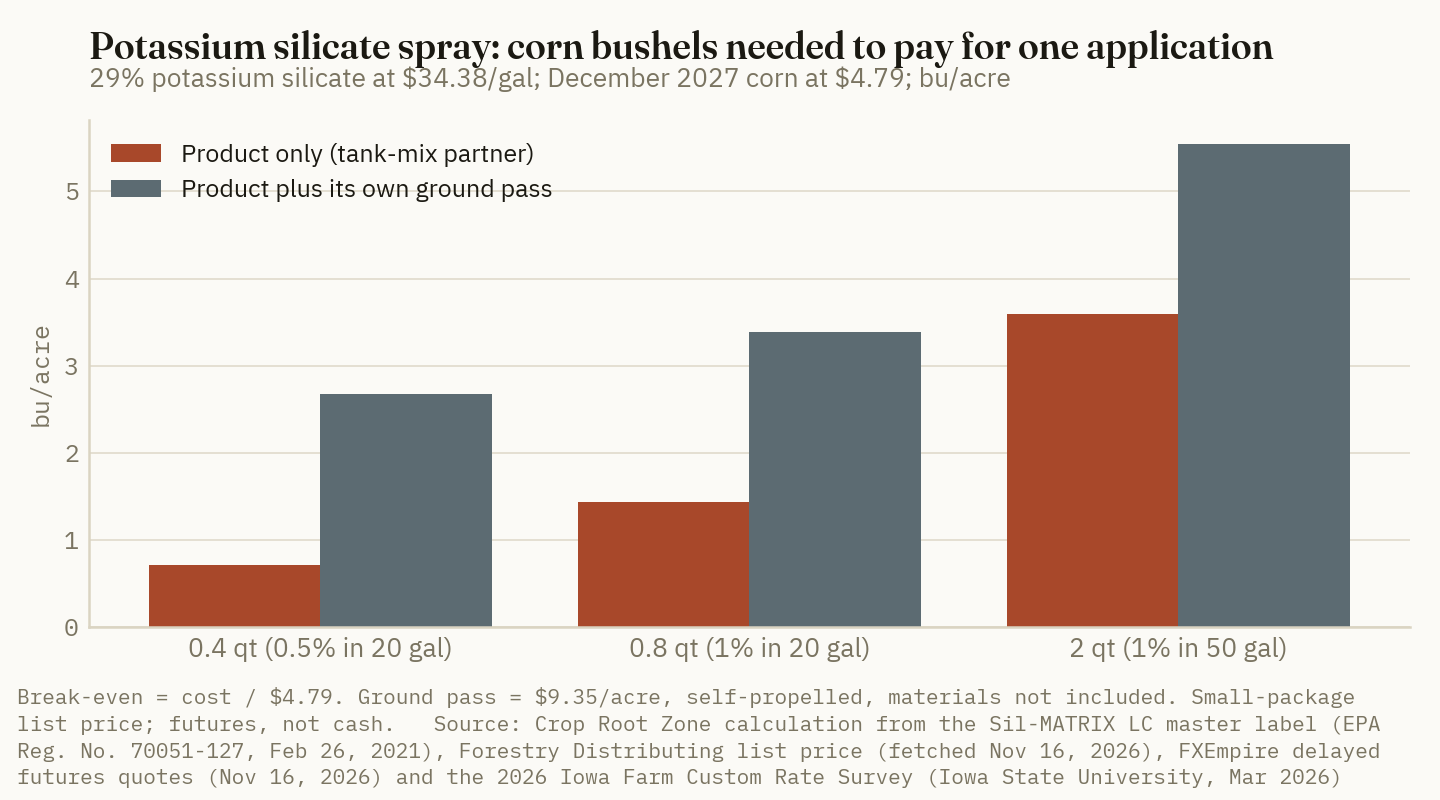
At the low rates the product is cheap enough to hide. Seven-tenths of a bushel of corn is under half a percent of a 200-bushel crop, and no strip trial resolves that. This is the same position the low-cost soybean foliar products occupy: the break-even sits below what a farm can measure, so the product is never shown to fail. The cost that can be measured is the pass. A stand-alone ground trip at 0.4 quart is $12.79 an acre, of which the silicate is 27%.
The fair comparison is a fungicide, since that is the registration. Arkansas put the cost of most soybean fungicide applications at about $30 an acre and the break-even near 3 bushels. Across 53 on-farm trials since 2020 the average gain was 3.3 bushels, and about 40% of treatments cleared the break-even (Spurlock, University of Arkansas Division of Agriculture, Jul 2, 2026) [15]. A silicate at $7 to $17 undercuts that on price. Its label claim on soybean is "suppression" of Asian soybean rust, and for cereals the named disease is powdery mildew [2]. The label advises rotating with other registered fungicides when disease is developing fast [2]. We found no field trial that reports what the silicate alone returns in bushels on either crop.
5. What the label is allowed to say
What's new: The rules now separate the two ways this chemistry is sold. California finished rulemaking on a beneficial-substance label format on November 14, 2025. The format became mandatory on January 1, 2026 for labels starting a renewal cycle, and for new and updated labels at once (California Department of Food and Agriculture, Dec 9, 2025) [14]. The state's statutory definition of a beneficial substance covers a material other than a plant nutrient that research shows to benefit plants, "excluding pesticides". The department describes the change as consistent with the Uniform Beneficial Substances Bill of the Association of American Plant Food Control Officials [14].
Evidence: California's silicon guidance, revised in March 2025, requires the guarantee to read "Soluble Silicon (Si)" under a "Contains Beneficial Substance" heading. The figure must rest on the department's own laboratory method, with a 10% investigational allowance [13]. Foliar application is accepted. Potassium silicate, sodium silicate, wollastonite, diatomaceous earth and volcanic ash are listed as acceptable sources. One line matters for the liquid market: monosilicic acid, also called orthosilicic acid, "is not a recognized source of soluble silicon" [13]. That is the form several liquid products are built around. A review by an author affiliated with a silicic-acid seller argues that silicate sprays work as pesticides while stabilized silicic acid is what raises yield (Laane, Plants, 2018; abstract as indexed) [17]. In California, the form credited with the yield effect cannot carry the guarantee.
| Sold as | Regulator | What the label can claim | What it must state |
|---|---|---|---|
| Fungicide (Sil-MATRIX LC) | US EPA, Reg. No. 70051-127 | Control of powdery mildew; suppression of Asian soybean rust on soybean; mites, aphids, whiteflies | Active ingredient 29%; rate, interval, 4-hour re-entry, seasonal cap |
| Fertilizer with silicon guarantee | State fertilizer control; California format from 2026 | A beneficial substance, not a nutrient and not a pesticide | Soluble Silicon (Si) %, by the state method, within 10% |
Source: Certis USA master label [2]; CDFA labeling aid, Mar 2025 [13]; CDFA notice, Dec 9, 2025 [14]. Basis: federal pesticide label and California fertilizer rules; other states vary.
Whether silicon has moved from "beneficial substance" to an official plant nutrient at the national level remains open. Our October piece found it listed as tentative [16]. We found no official document since then recording a final vote.
| What we can say | |
|---|---|
| Established | A 29% potassium silicate is EPA-registered for cereal grains and soybeans at 0.25% to 1% solution, capped at 10 quarts an acre [2]. One distributor lists 2.5 gallons at $85.95 [3]. LSU found foliar silicon did not raise silicon in rice plants [7]. Rutgers advises that foliar silicon is generally not effective [12]. In the Louisiana wheat trial, lime alone was not statistically different from any silicon treatment [8]. |
| Estimated | Silicon content of 1.0 lb a gallon, and every per-acre silicon figure built on it. The $34 a pound of silicon. The 150-to-1 price ratio against slag. All break-evens in Section 4. Yields read off the Huma Gro chart. |
| Unknown | Any ag-retail drum or tote price. The yield effect of a foliar silicate on corn or soybeans in a replicated public field trial. Soil pH in the Louisiana wheat plots. Whether silicon is now an official plant nutrient in the national model rules. |
Ground Truth: For 2027, take foliar silicon off the fertility plan and, if it stays anywhere, move it to the disease plan. Ask the seller which registration the jug carries. If it is the pesticide label, the claim is powdery mildew control or rust suppression, the comparison is a $30 fungicide pass, and the test is untreated strips in a year with disease. If it is a fertilizer label, the guarantee tells you how many tenths of a pound of silicon you are buying, and Section 2 tells you what that is against crop removal. A field that has a real silicon problem, which on the public record means rice or cane on a soil testing low [16], needs the dry material by the ton. No rate of spray on the label supplies it.
References
- FXEmpire, futures contract pages for corn, soybeans and Kansas City hard red winter wheat, delayed quotes timestamped Nov 16, 2026, about 13:06 UTC (December 2027 corn 479.00 cents; November 2027 soybeans 1,186.00; July 2027 KC wheat 642.25) — https://www.fxempire.com/commodities/zc/contracts ; https://www.fxempire.com/commodities/zs/contracts ; https://www.fxempire.com/commodities/ke/contracts
- Certis USA LLC, Sil-MATRIX LC Fungicide/Miticide/Insecticide, master label, EPA Reg. No. 70051-127, accepted by US EPA Feb 26, 2021 (potassium silicate 29%; 0.25%–1% solution; 10 qt/acre = 7.5 lb active ingredient per application; crop groups 6 and 15) — https://www3.epa.gov/pesticides/chem_search/ppls/070051-00127-20210226.pdf
- Forestry Distributing, "Sil-Matrix Disease and Pest Control, Certis," product listing, 2.5-gallon container at $85.95 ($84.95 each for two or more), fetched Nov 16, 2026 — https://forestrydistributing.com/sil-matrix-disease-and-pest-control-certis
- Seven Springs Farm Supply and Custom Hydro Nutrients, online product listings as indexed by search on Nov 16, 2026 (Sil-Matrix 2.5 gal at $92.50 and $93.85; AgSil 25, 55 gal at $1,591.00; CropSIL 1 liter at $95.50 with a 2–5 fl oz/acre rate). The pages returned rate-limit errors when fetched, so these figures were not read from the pages themselves — https://www.7springsfarm.com/products/sil-matrix-2-5-gallon ; https://customhydronutrients.com/collections/potassium-silicate ; https://www.7springsfarm.com/products/cropsil-3-plant-derived-silicon-1-liter
- PQ Corporation, "AgSil Potassium Silicate: Soluble Silicate for Agriculture," Report 24, June 2011 (AgSil 25: 8.3% K2O, 20.8% SiO2; foliar guide of 4.0 lb or 49 fl oz per 100 gallons of water) — https://www.engnetglobal.com/documents/pdfcatalog/PQS001_110412023954_AgSil%20brochure%206-11.pdf
- A. Johanns and C. Hart, "2026 Iowa Farm Custom Rate Survey," Iowa State University Extension and Outreach, Ag Decision Maker File A3-10, FM 1698, revised March 2026 (205 responses; spraying rates, materials not included) — https://www.extension.iastate.edu/agdm/crops/pdf/a3-10.pdf
- F. B. Agostinho, B. S. Tubana, M. S. Martins and L. E. Datnoff, "Effect of Different Silicon Sources on Yield and Silicon Uptake of Rice Grown under Varying Phosphorus Rates," Plants 6(3):35, Aug 29, 2017 (open access), DOI 10.3390/plants6030035 — https://pmc.ncbi.nlm.nih.gov/articles/PMC5620591/
- Huma Gro (Bio Huma Netics, Inc.), "Liquid Sili-Max Improves Wheat Yield at Much Higher Efficiency Than Conventional Dry Silicon Fertilizers," research report HG-180702-02, 2018, reporting research by B. Tubana, Louisiana State University (manufacturer's publication) — https://huma.us/wp-content/uploads/2023/10/Sili-Max-Improves-Wheat-Yield-and-Quality-Research-Report-HG-ENG.pdf
- E. Lemes, C. Mackowiak, A. Blount, J. Marois, D. Wright, L. Coelho and L. Datnoff, "Effects of Silicon Applications on Soybean Rust Development Under Greenhouse and Field Conditions," Plant Disease 95(3):317–324, 2011 (abstract read), DOI 10.1094/PDIS-07-10-0500 — https://repository.lsu.edu/plantcrop_pubs/96
- M.-H. Guével, J. G. Menzies and R. R. Bélanger, "Effect of root and foliar applications of soluble silicon on powdery mildew control and growth of wheat plants," European Journal of Plant Pathology 119:429–436, 2007 (abstract as indexed by search; full paper not read), DOI 10.1007/s10658-007-9181-1 — https://link.springer.com/article/10.1007/s10658-007-9181-1
- O. S. Walsh, S. Shafian, J. R. McClintick-Chess, K. M. Belmont and S. M. Blanscet, "Potential of Silicon Amendment for Improved Wheat Production," Plants 7(2):26, Mar 28, 2018 (open access), DOI 10.3390/plants7020026 — https://pmc.ncbi.nlm.nih.gov/articles/PMC6026889
- J. Heckman, "Silicon Needs of Soils and Crops," Rutgers Cooperative Extension Fact Sheet FS1278, October 2017 — https://extension.rutgers.edu/fs1278/
- California Department of Food and Agriculture, Fertilizing Materials Inspection Program, "Soluble Silicon Labeling Aid," revised March 2025 — https://www.cdfa.ca.gov/is/ffldrs/pdfs/Soluble_Silicon_Labeling_Aid.pdf
- California Department of Food and Agriculture, "Notice to Fertilizing Material Licensees: Beneficial Substance Labeling Format (Effective Rulemaking Update)," Dec 9, 2025 — https://www.cdfa.ca.gov/is/ffldrs/docs/fertilizer/Notice_to_Industry-Fertilizing_Material_Licensees-Beneficial_Substance_Labeling_Format.pdf
- T. N. Spurlock, "Is there value in automatic fungicide application in soybean?", University of Arkansas System Division of Agriculture, Arkansas Row Crops, Jul 2, 2026 — https://arkansascrops.uada.edu/posts/disease/soybean-fungicide-jul2026.aspx
- Crop Root Zone, TRZ-0289, "A Ton of Silicate Slag Has to Return 15 Bushels of Corn, or 6 Where the Field Needs Lime," Oct 16, 2026.
- H.-M. Laane, "The Effects of Foliar Sprays with Different Silicon Compounds," Plants 7(2):45, 2018 (abstract as indexed by search; the author is affiliated with ReXil Agro, a seller of silicic-acid products) — https://www.mdpi.com/2223-7747/7/2/45
Disclosures
Crop Root Zone is an independent publication. Nothing here is investment advice. Market calls, where included, reflect the editors' own read and are not a recommendation to buy or sell any security.
Six Foliar Fertilizers in a 16-State Soybean Trial Cost $3.64 to $22.27 an Acre and Need a Third of a Bushel to 2 Bushels of 2027 Beans to Pay. The Best One Added 0.13 Bushel.
The only public per-acre prices for nationally sold soybean foliar products are a 2019 retailer survey: $3.64 to $22.27. At November 2027 futures of $11.87 less an assumed 71-cent basis, that is 0.33 to 2.00 bushels before any application charge, and 1.4 to 3.1 bushels if the product needs its own $12 aerial pass. Across 46 sites the six products moved yield between minus 0.48 and plus 0.13 bushel, with a treatment p-value of 0.97. A $21 potassium product carries about $2.33 of nitrogen and potash at retail dry prices. Manganese on fields showing symptoms is the exception, and the blends tested carry 4% to 8% of a corrective manganese dose.
Foliar fertilizer for soybeans is sold on convenience. The sprayer or the airplane is already crossing the field at R3 with a fungicide, the jug rides along in the tank, and the product is priced low enough that a bushel or two covers it. That arithmetic is correct as far as it goes. At new-crop prices on November 13, the six nationally marketed products tested in the largest independent soybean foliar trial need between a third of a bushel and 2 bushels an acre to pay for themselves. The trial, run by land-grant agronomists at 46 sites in 16 states, measured what the products returned. The best of the six added 0.13 bushel. Three of the six yielded less than the untreated check. This piece prices the products and the pass, converts both to 2027 bushels and sets the result against what the replicated record shows.
1. What the 46-site trial measured
What's new: Nothing in the public record since 2021 has overturned the multi-state result, and one new trial has repeated it. Penn State tested three more foliar fertilizers at R3 in 2024 and 2025, alone and with a fungicide. None raised yield over the untreated control (Carrijo and Esker, Penn State Extension, Dec 15, 2025) [15]. The reference study remains the Science for Success trial funded by state soybean checkoffs and the United Soybean Board (Matcham et al., Agronomy Journal, Oct 27, 2021) [1].
Evidence: The design was built to answer the farm question. Agronomists in 16 states, from North Dakota to Florida, applied six commercial products and an untreated control at R3 in 2019 and 2020. Each site used a randomized complete block with four to eight replications, for 1,868 plots in all. Products were chosen with industry input as ones marketed nationally to soybean growers, and each went on at a rate within its label range. No site showed visual nutrient deficiency before application. Soil pH ran from 4.7 to 8.3, and some sites tested below 15 ppm phosphorus [1].
| Treatment | Maker | Rate per acre | Mean yield, bu/acre | Change vs. untreated, bu/acre |
|---|---|---|---|---|
| Untreated control | n/a | n/a | 59.54 | n/a |
| Smart B-Mo | Brandt | 1 pt | 59.67 | +0.13 |
| FertiRain | AgroLiquid | 3 gal | 59.66 | +0.12 |
| HarvestMore UreaMate | Stoller | 2.5 lb | 59.60 | +0.06 |
| Sure-K | AgroLiquid | 3 gal | 59.39 | −0.15 |
| Maximum NPact K | Nutrien | 1.5 gal | 59.33 | −0.21 |
| Smart Quatro Plus | Brandt | 2 qt* | 59.06 | −0.48 |
Source: Matcham et al., Agronomy Journal 113:5246–5253, 2021, Tables 1 and 5 [1]; rates as listed in the Science for Success fact sheet [2]. Basis: mean of 46 site-years, 13% moisture. Yields converted by Crop Root Zone from kg/ha at 67.25 kg/ha per bu/acre. *The journal table lists Smart Quatro Plus at 4.7 L/ha, which is 2 quarts an acre by our conversion; the fact sheet lists 1 quart.
The treatment effect had an F value of 0.23 and a p-value of 0.9663. The interaction between treatment and site was not significant either, which means no product worked better in one kind of environment than another. A second model sorted sites into low, medium and high yield groups and found the same thing [1]. Leaf tissue manganese, copper and boron rose after application, so the products got into the plant. The grain did not respond. Protein and oil were unchanged [1].
+0.13 bu/acre
Largest yield change among six foliar fertilizers across 46 sites in 16 states. It was not statistically different from zero, and neither was any other. (Matcham et al., Agronomy Journal, Oct 27, 2021) [1]
The companion fact sheet adds one detail the paper does not. Analyzed one at a time, 4 of the 46 site-years showed a significant difference among treatments, with no soil property that separated them from the other 42. All four had a pH between 6.5 and 7.3 (Science for Success, 2022) [2].
Ground Truth: Four responsive sites in 46 is close to what chance alone produces. If each site was tested at the usual 5% level, which the fact sheet does not state, 46 tests of products that do nothing would still return about 2.3 false positives by our arithmetic. A dealer who shows one plot where the foliar pass won is very likely showing one of those. The useful question to ask is how many plots were run in total, and the 16-state answer is 46 with a pooled p-value of 0.97.
2. What the product and the pass cost
What's new: We found no public 2026 list price for any of the six products, and no extension budget that prices a soybean foliar nutrient package. The only public per-acre figures are the ones the trial's authors collected by calling retailers in the study region in 2019 [1]. Application charges are current: Iowa State's 2026 custom rate survey, based on 205 responses, put aerial spraying at $12.00 an acre, drone spraying at $12.50 and self-propelled ground spraying in tall crops at $11.15 (Iowa State University Extension, FM 1698, March 2026) [6].
Evidence:
| Item | Basis | Date | $/acre |
|---|---|---|---|
| Smart B-Mo, 1 pt | Retailer phone survey, study region | 2019 | 3.64 |
| HarvestMore UreaMate, 2.5 lb | Same | 2019 | 4.86 |
| Smart Quatro Plus | Same | 2019 | 6.47 |
| Sure-K, 3 gal | Same | 2019 | 19.42 |
| Maximum NPact K, 1.5 gal | Same | 2019 | 21.04 |
| FertiRain, 3 gal | Same | 2019 | 22.27 |
| Ground spraying, self-propelled, tall crop | Iowa custom rate, average; range $6–$20 | 2026 | 11.15 |
| Aerial spraying | Iowa custom rate, average; range $9–$18 | 2026 | 12.00 |
| Drone spraying | Iowa custom rate, average; range $8–$16 | 2026 | 12.50 |
Sources: product costs from Matcham et al. 2021, Table 1, published in $/ha and converted by Crop Root Zone at 2.471 acres per hectare; the $3.64 and $22.27 endpoints match the Science for Success fact sheet [1][2]. Application rates from the 2026 Iowa Farm Custom Rate Survey, materials not included [6]. The product prices are seven years old. Treat them as a floor and replace them with a written quote.
The trial's own economics left application out, on the reasoning that these products usually share a fungicide or insecticide pass [1]. That is the favorable case. A field with no fungicide planned carries the whole trip. A ground rig adds a second cost. Purdue measured soybean yield loss from sprayer wheel tracks at 1.9% with a 90-foot boom and 1.3% with a 120-foot boom, averaged over four Indiana site-years, and found plants could not compensate for tracks made at R3 or later (Hanna, Conley, Santini and Shaner, Purdue Extension SPS-103-W, June 2007) [7]. On a 60-bushel crop, 1.3% is 0.78 bushel.
3. The break-even in 2027 bushels
What's new: November 2027 soybeans traded at $11.8725 on the morning of November 13 (FXEmpire, delayed quotes, Nov 13, 2026) [3]. January 2027 settled at $12.19 on November 12 (Brownfield Ag News, Nov 12, 2026) [5], and the Iowa state average cash bid that day was $11.48, a basis of 71 cents under January (USDA AMS, Iowa Daily Cash Grain Bids, Nov 12, 2026) [4]. No public new-crop 2027 cash bid series exists yet. We take the 71-cent spot basis off the November 2027 contract and use $11.16 as an estimated new-crop cash price. That basis is an assumption, and a grower should substitute his own.
Evidence:
| Product | Cost, $/acre | Break-even at $11.87 futures, bu | Break-even at $11.16 cash, bu | With a $12 aerial pass, bu | |
|---|---|---|---|---|---|
| Smart B-Mo | 3.64 | 0.31 | 0.33 | 1.40 | ██░░░░░░░░ |
| HarvestMore UreaMate | 4.86 | 0.41 | 0.44 | 1.51 | ██░░░░░░░░ |
| Smart Quatro Plus | 6.47 | 0.55 | 0.58 | 1.66 | ███░░░░░░░ |
| Sure-K | 19.42 | 1.64 | 1.74 | 2.82 | █████████░ |
| Maximum NPact K | 21.04 | 1.77 | 1.89 | 2.96 | █████████░ |
| FertiRain | 22.27 | 1.88 | 2.00 | 3.07 | ██████████ |
Source: Crop Root Zone calculation. Product costs from Section 2 [1][2]; futures from FXEmpire, Nov 13, 2026 [3]; basis from USDA AMS, Nov 12, 2026 [4]; aerial rate from Iowa State [6]. Basis: break-even bushels = cost ÷ price. The bar column scales product cost, $22.27 = ten blocks.
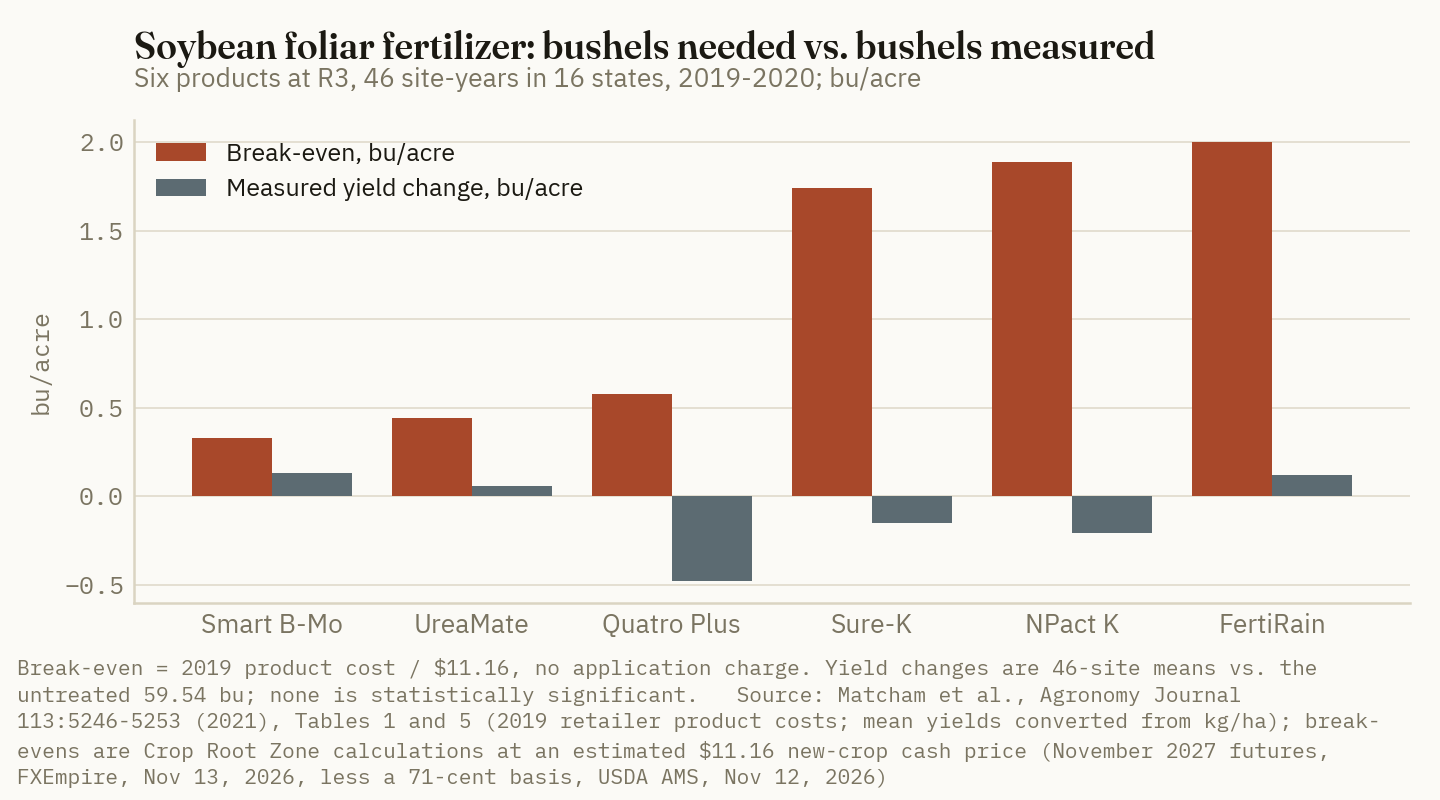
The three micronutrient products have break-evens under 0.6 bushel, which is 1% of a 60-bushel crop and below what any strip trial resolves. That is how they stay on the order: nobody can show they failed. The three N-P-K products need 1.7 to 2.0 bushels as a tank-mix partner and about 3 bushels flown on alone. A stand-alone ground pass costs more than the airplane once wheel tracks are counted. At 120 feet of boom it is $11.15 plus 0.78 bushel, or 1.78 bushels before any product, by our arithmetic.
Seven-year-old prices understate the bar. If the products cost 30% more today, which is a scenario and not a measurement, the range becomes 0.42 to 2.59 bushels with no application charge. The trial's authors ran their own numbers at $10 and $15 soybeans and found no product more profitable than the check at either price. At $15, Maximum NPact K returned $24 an acre less than untreated. At $10, Maximum NPact K, Sure-K and FertiRain returned $23, $21 and $21 less [2]. Today's price sits between the two.
Ground Truth: Take the trial's point estimates at face value, ignoring that none is significant. The best product, Smart B-Mo, gained 0.13 bushel, worth $1.45 at $11.16, against $3.64 of product. That covers 40% of the cost of the cheapest jug in the set, with free application. FertiRain's 0.12 bushel covers 6% of its cost. The realistic downside of a foliar fertilizer program is small, and that is why it survives. The loss is $4 to $22 an acre, repeated on every acre, and no single field will ever show it.
4. What is in the jug
What's new: The quantities explain the result. Published uptake data from the University of Illinois put a 60-bushel soybean crop's needs at 43 lb of P2O5 and 170 lb of K2O an acre (Bender, Haegele and Below, as summarized in Mosaic AgriSight, 2015) [8]. The foliar products deliver a small fraction of that, and they charge several times the dry-fertilizer price for it.
Evidence: Maximum NPact K supplied 2.1 kg/ha each of nitrogen and potassium, which is 1.9 lb an acre of each [1][2]. Read as elemental potassium, the more generous reading, that is 2.3 lb of K2O, or 1.3% of the crop's uptake. DTN's retail survey for October 26–30 put urea nitrogen at 73 cents a pound and potash at $510 a ton (DTN/Progressive Farmer, Nov 4, 2026) [9]. At 60% K2O, potash works out to 42.5 cents a pound of K2O. The nutrients in the 1.5-gallon rate are therefore worth about $1.37 of nitrogen and $0.96 of potash, $2.33 in all, against a 2019 product cost of $21.04. That is a ninefold markup over dry retail, by our estimate, before the product's price has been updated.
| Product | Nutrient delivered, lb/acre | Benchmark | Share of benchmark |
|---|---|---|---|
| Maximum NPact K | 2.3 K2O* | 170 lb K2O uptake by a 60-bu crop | 1.3% |
| FertiRain | 2.8 to 3.5 N** | 73 cents/lb as urea: $2.04 to $2.56 | n/a |
| Smart Quatro Plus | 0.08 Mn | 1 to 2 lb Mn corrective foliar rate | 4% to 8% |
| Smart B-Mo | 0.07 B | 0.25 lb B rate used in Michigan trials | 28% |
Sources: nutrients applied from Matcham et al. 2021, Table 1, and the Science for Success fact sheet [1][2]; crop uptake from Bender et al. via Mosaic AgriSight [8]; urea price from DTN [9]; manganese rate from Michigan State Extension [13]; boron rate from Michigan State on-farm trials [14]. *Estimated: 1.9 lb K converted to K2O. **The journal table gives 3.1 kg/ha (2.8 lb/acre); the fact sheet gives 3.5 lb/acre.
The micronutrient case rests on a different argument, that small amounts matter. The dose comparison answers it. Michigan State's recommendation for correcting manganese deficiency is foliar manganese sulfate at 1 to 2 lb of actual manganese an acre (Staton, Michigan State University Extension, via Farms.com, May 4, 2016) [13]. Smart Quatro Plus delivered 0.08 lb [2]. The blend carries one-twelfth to one-twenty-fifth of a corrective dose.
Ground Truth: A micronutrient blend at R3 is not cheap insurance against a deficiency, because it does not carry enough to fix one. A field that is short of manganese needs 12 to 25 times what the blend delivers, and it needs it when symptoms appear, which is usually weeks before R3. A field that is not short needs none. No field falls in between where 0.08 lb is the right amount. The same logic applies to the N-P-K products: 2 lb of potash on a crop that takes up 170 cannot move yield, and a field low enough for 2 lb to matter is a field that needed 100 lb of 0-0-60 last fall.
5. Where foliar does pay, and how often
What's new: The state records agree with the multi-state trial and identify the one exception. Ohio State compiled every micronutrient trial it could find in Ohio from 1976 to 2017. Soybeans showed a significant yield response in 9 of 144 trials. Six of those came from 109 manganese-only trials and three from 23 blend trials, each blend containing manganese. Boron responded in none of 9 trials and zinc in none of 3 (Sharma et al., Ohio State University Extension AGF-519, Apr 30, 2018) [10].
Evidence:
| Record | Trials | Result |
|---|---|---|
| Science for Success, 16 states, 2019–20 [1][2] | 46 site-years, six products at R3 | No treatment effect (p = 0.97); 4 sites individually significant |
| Ohio micronutrient compilation, 1976–2017 [10] | 144 soybean trials | 9 significant, all with manganese; gains of 3.3 to 11.2 bu/acre |
| Ohio foliar manganese [11] | 36 trials | 2 significant, on a sandy dry site and a high-clay, high-pH site |
| Ohio high-input study, 2013–14 [12] | 16 site-years, manganese at R3 | 1 response, 8.0 bu/acre on 63% sand |
| Michigan on-farm, 2009–14 [13] | 73 locations, four N-P-K-S products | Less profitable than the check in all cases |
| Michigan on-farm, 2009 to about 2023 [16] | 172 trials | Profitable in 15 |
| Penn State, 2024–25 [15] | 1 site, 2 years, three products at R3 | No yield gain alone or with fungicide |
Sources as numbered. The Michigan 172-trial count is from a 2024 magazine column we could reach only as indexed text, not the full page. The Ohio rows overlap: the 36 manganese trials and the 16 site-years are partly inside the 144.
The older record is the same shape. An Iowa study in the 1970s reported up to 8 bushels from foliar N-P-K-S during seed fill. Minnesota then found a benefit in 1 of 16 site-years, and Iowa work in the 1990s found gains under 1 bushel at 10 of 48 site-years [2]. The 8-bushel result is nearly 50 years old and has not been repeated.
Manganese is different because the deficiency is real, visible and tied to known soils. Ohio's responsive sites were sandy and dry, or high in clay and pH, and when they responded they gave back 3.3 to 11.2 bushels [10][11]. In Michigan, foliar manganese on high-pH lakebed soils raised yield when applied after symptoms appeared and did not when applied before [1]. We did not find a current price for manganese sulfate at that rate. Against the 1.4 to 1.7 bushels that a low-cost micronutrient product needs when flown on alone (Section 3), a 3-bushel response pays and an 8-bushel response pays several times over. An earlier Crop Root Zone piece covered the timing of that correction and its tank-mix problems; the point here is only that the payback exists and is conditional on symptoms.
Blanket manganese does not inherit that payback. If Ohio's 9-in-144 response rate held on a given farm, and responsive fields averaged 7 bushels, which is our midpoint assumption and not a published mean, the expected gain from treating every acre would be 0.44 bushel, or about $4.90. That is roughly the cost of a low-rate product with free application, and it falls short as soon as any application charge is added. Scouting recovers nearly all of the value for a fraction of the acres.
| What we can say | |
|---|---|
| Established | Six nationally sold foliar products did not change soybean yield or grain composition at 46 sites without deficiency symptoms [1]. Ohio found micronutrient responses in 6% of soybean trials, all involving manganese [10]. Wheel tracks at R3 cost 1.3% to 1.9% of yield at common boom widths [7]. Iowa custom aerial application averaged $12.00 an acre in 2026 [6]. |
| Estimated | The $11.16 new-crop cash price. Every break-even in Section 3. The $2.33 nutrient value of a $21 product. The 0.44-bushel expected gain from blanket manganese. The 30% price scenario. |
| Unknown | Any 2026 list price for the six products, or for manganese sulfate at a corrective rate. Whether newer formulations, or products applied at R1 or in multiple passes, behave differently; the multi-state trial tested one timing. Results under visible deficiency of nutrients other than manganese. The full detail behind Michigan's 172-trial count. |
A University of Minnesota agronomist on the multi-state team told DTN that grid soil sampling, at about $20 an acre, was a better use of the money (DTN/Progressive Farmer, May 19, 2023) [17]. That is close to the price of one application of the N-P-K products, and a grid sample lasts several years.
Ground Truth: For 2027, strike prophylactic foliar fertilizer from the soybean plan and write manganese sulfate into it as a conditional line. The conditions are known in advance: sandy fields that dry out, high-pH lakebed and muck soils, and any field that showed interveinal yellowing before. Budget one aerial pass on those acres only, triggered by symptoms. On every other acre, the $4 to $22 goes further in soil sampling or in potash on the fields that test low. If a retailer bundles a foliar product into the fungicide pass at no visible charge, ask for the fungicide price without it. And if the product stays in the tank anyway, leave three untreated strips, as Ohio State advises for every R3 input [18]. One season of strips will not prove the product works, but ten seasons of strips will show what the 46 sites showed.
References
- Matcham, E.G.; Vann, R.A.; Lindsey, L.E.; Gaska, J.M.; Lilley, D.T.; Ross, W.J.; Wright, D.L.; Knott, C.; Lee, C.D.; Moseley, D.; Singh, M.; Naeve, S.; Irby, J.T.; Wiebold, W.; Kandel, H.; Lofton, J.; Inman, M.; Kleinjan, J.; Holshouser, D.L.; Conley, S.P., "Foliar fertilizers rarely increase yield in United States soybean," Agronomy Journal 113(6):5246–5253, published online Oct 27, 2021 (open access), DOI 10.1002/agj2.20889 — https://mssoy.org/sites/default/files/documents/multistate-foliar-fert-results-aj-2021.pdf
- Science for Success, "Foliar Fertilizers Rarely Increase Yield in U.S. Soybean," extension fact sheet funded by the soybean checkoff, 2022 (rates and nutrients in lb/acre; product cost range of $3.64 to $22.27 an acre; 4 of 46 site-years individually significant; profit differences at $10 and $15 soybeans) — https://soybeanresearchinfo.com/wp-content/uploads/2022/01/Science-for-Success-Foliar-Fertilizers-V3.pdf
- FXEmpire, soybean (ZS) futures contract page, delayed quotes timestamped Nov 13, 2026, about 13:07 UTC (November 2027 at 1,187.25 cents; January 2027 at 1,234.25) — https://www.fxempire.com/commodities/zs/contracts
- USDA Agricultural Marketing Service and Iowa Department of Agriculture, "Iowa Daily Cash Grain Bids," report AMS_2850, Nov 12, 2026 (state average soybeans $11.48, basis −71 January; January 2027 settlement 1,219.00 cents) — https://www.ams.usda.gov/mnreports/ams_2850.pdf
- Brownfield Ag News, "Closing Grain and Livestock Futures: November 12, 2026," Nov 12, 2026 (January soybeans $12.19, down 11 3/4 cents) — https://www.brownfieldagnews.com/market-news/closing-grain-and-livestock-futures-november-12-2026/
- Johanns, A.; Hart, C., "2026 Iowa Farm Custom Rate Survey," Iowa State University Extension and Outreach, Ag Decision Maker File A3-10, FM 1698, revised March 2026 (205 responses; spraying rates, materials not included) — https://www.extension.iastate.edu/agdm/crops/pdf/a3-10.pdf
- Hanna, S.; Conley, S.; Santini, J.; Shaner, G., "Managing Fungicide Applications in Soybean," Purdue Extension SPS-103-W, June 2007 (Table 1, yield loss from wheel tracks by boom width) — https://www.extension.purdue.edu/extmedia/SPS/SPS-103-W.pdf
- The Mosaic Company, "Macronutrients for 'Macro' Soybean Yields," AgriSight Issue 10, 2015, Table 1, adapted from Bender, R.R.; Haegele, J.W.; Below, F.E., "Modern soybean varieties' nutrient uptake patterns," Better Crops with Plant Food 99(2):7–10, 2015 (University of Illinois data; a fertilizer company's summary) — https://www.cropnutrition.com/wp-content/uploads/2023/06/AgriSightIssue10.pdf
- Neeley, T., "UAN28 Continues to Lead Fertilizer Prices Higher in October's Final Week," DTN Retail Fertilizer Trends, DTN/Progressive Farmer, Nov 4, 2026 (survey week of Oct 26–30: urea $669/ton and $0.73/lb N; potash $510/ton) — https://www.dtnpf.com/agriculture/web/ag/crops/article/2026/11/04/uan28-continues-lead-fertilizer-week
- Sharma, S.; Culman, S.; Fulford, A.; Lindsey, L.; Alt, D.; Looker, G., "Corn, Soybean, and Alfalfa Yield Responses to Micronutrient Fertilization in Ohio," Ohio State University Extension fact sheet AGF-519, Apr 30, 2018 — https://ohioline.osu.edu/factsheet/agf-519
- Lindsey, L.; Culman, S.; Matcham, E., "Foliar Fertilizer Applications in Soybean," Ohio State University C.O.R.N. Newsletter 2020-21 (2 of 36 Ohio manganese trials significant) — https://agcrops.osu.edu/newsletter/corn-newsletter/2020-21/foliar-fertilizer-applications-soybean
- Bluck, G.M.; Lindsey, L.E.; Dorrance, A.E.; Metzger, J.D., "High Input Production," Ohio State University soybean production pages, reporting 2013–14 trials (foliar manganese at R3 affected yield in 1 of 16 site-years) — https://stepupsoy.osu.edu/soybean-production/high-input-production
- Staton, M., "Nutrient Management Recommendations For Profitable Soybean Production," Michigan State University Extension, republished by Farms.com, May 4, 2016 (73 on-farm locations; manganese sulfate at 1 to 2 lb actual Mn/acre) — https://www.farms.com/commentaries/nutrient-management-recommendations-for-profitable-soybean-production-106999.aspx
- Staton, M., "Foliar Fertilizing Soybeans Isn't a Profitable Decision," Michigan State University Extension, republished by No-Till Farmer, Jul 9, 2014 (boron at 0.25 lb/acre at R1 did not raise yield) — https://www.no-tillfarmer.com/articles/2579-foliar-fertilizing-soybeans-isnt-a-profitable-decision
- Carrijo, D.; Esker, P., "Foliar Fertilizers and Sugars in Soybeans," Penn State Extension, updated Dec 15, 2025 — https://extension.psu.edu/foliar-fertilizers-and-sugars-in-soybeans
- Staton, M., column in Michigan Soybean News, Spring 2024, published Mar 26, 2024 (foliar fertilization profitable in 15 of 172 on-farm trials since 2009; read as indexed text, full page not reached) — https://issuu.com/michigansoybean/docs/msn_spring_2024/s/45850459
- Jenkins, J., "Foliar Fertilizer Folly," DTN/Progressive Farmer, May 19, 2023 (Seth Naeve, University of Minnesota) — https://www.dtnpf.com/agriculture/web/ag/crops/article/2023/05/19/university-study-finds-foliar-rarely
- Lindsey, L.; Michel, A.; Lopez-Nicora, H., "To Spray or Not to Spray…Foliar Products at R3," Ohio State University C.O.R.N. Newsletter 2022-23 — https://agcrops.osu.edu/newsletter/corn-newsletter/2022-23/spray-or-not-spray%E2%80%A6foliar-products-r3
Disclosures
Crop Root Zone is an independent publication. Nothing here is investment advice. Market calls, where included, reflect the editors' own read and are not a recommendation to buy or sell any security.
A Mycorrhizal Inoculant Costs $9 to $19 an Acre and Needs 2 to 4 Bushels of 2027 Corn to Pay. The Independent Corn Trials We Found Returned Nothing, or Lost 9 Bushels.
No public 2026 list price exists. Dated price points run from $8.66 to $19 an acre, which is 1.8 to 3.9 bushels of December 2027 corn, 0.7 to 1.6 of soybeans or 1.3 to 2.9 of wheat. Company material claims 4.7 to 11.8 bushels of corn. The independent replicated trials we found show no significant difference in Iowa, a 9-bushel loss in Nebraska and a 1.9% loss in Wisconsin, all on well-fertilized ground. In a 28-product viability study, 84% of the commercial inoculants tested in sterilized soil formed no mycorrhizae at all. Where native fungi are plausibly short, after fallow, sugarbeet or canola, extension's remedy is banded phosphate at about $21 an acre, and no independent trial we found shows the inoculant doing that job.
Seed and input orders for 2027 are being written now, and arbuscular mycorrhizal fungi (AMF) inoculants are on the biologicals page of most of them. They are sold as a planter-box powder, a seed overtreat or a 2-ounce in-furrow liquid. The fungi are real symbionts. They colonize the roots of corn, soybeans and wheat and extend the plant's reach for phosphorus and zinc. Whether a purchased dose adds anything to a field that already has them is a separate question. The products are cheap, so the break-even is small: at the price points we could document, 2 to 4 bushels of December 2027 corn. The independent replicated corn trials we found did not clear it. This piece prices the product, converts the price to bushels and sets that against what is established, what is estimated and what nobody has measured.
1. What it costs an acre
What's new: No manufacturer or retailer we checked publishes a 2026 per-acre price for a row-crop AMF inoculant. The current product page for MycoApply EndoPrime SC, the most widely sold US in-furrow product, lists no price. It says one gallon treats 64 acres, which is 2 fluid ounces an acre by our arithmetic (Sumitomo Biorational/Valent product page, accessed Nov 11, 2026) [6]. The one 2026 figure is a statement from an independent Wisconsin crop adviser. He wrote in April that a potent, quality dry seed-applied product costs less than $12 an acre (Ailts, Strip-Till Farmer, Apr 6, 2026) [3]. Everything else is older.
Evidence:
| Price point | Basis | Date | $/acre |
|---|---|---|---|
| MycoApply EndoPrime SC, 2 fl oz in-furrow with 10-34-0 | Product cost used in a Nebraska Extension on-farm trial | 2019 | 8.66 |
| Rootella inoculant, carbon-program entry cost | Company program page; four-year commitment | Undated, about 2024 | 10.00 |
| Dry seed-applied AMF, "quality product" | Independent agronomist's statement; an upper bound | Apr 6, 2026 | <12.00 |
| MycoApply granular, 2 lb in-furrow | Farmer-reported cost, Practical Farmers of Iowa trial | 2019 | 12.50 |
| MycoApply, full rate, by formulation | Seed dealer article | Jan 15, 2018 | 16.00–19.00 |
Sources: Nebraska Extension On-Farm Research, 2019 [1]; Groundwork BioAg [2]; Strip-Till Farmer, Apr 6, 2026 [3]; Practical Farmers of Iowa, Dec 5, 2019 [4]; Green Cover, Jan 15, 2018 [5]. None is a 2026 list price. Application cost is excluded; the product rides on the seed or in an existing in-furrow pass.
We use $8.66 to $19 an acre as the range and $12 as the central case. That is a range built from dated quotes, not a survey. A grower should replace it with a written quote before using any figure below.
2. What it has to return
What's new: December 2027 corn was $4.8775, November 2027 soybeans $11.9125 and July 2027 Kansas City wheat $6.49 on November 11 (FXEmpire, delayed quotes, Nov 11, 2026) [7]. Nearby contracts closed November 10 at $4.49 for December corn, $12.28 for January soybeans and $5.9275 for December Chicago wheat (Brownfield Ag News, Nov 10, 2026) [8]. We use the new-crop prices, because the product goes on the 2027 crop.
Evidence:
| Product cost, $/acre | Corn, bu | Soybeans, bu | Wheat, bu | |
|---|---|---|---|---|
| 8.66 | 1.78 | 0.73 | 1.33 | █████░░░░░ |
| 10.00 | 2.05 | 0.84 | 1.54 | █████░░░░░ |
| 12.00 | 2.46 | 1.01 | 1.85 | ██████░░░░ |
| 12.50 | 2.56 | 1.05 | 1.93 | ███████░░░ |
| 16.00 | 3.28 | 1.34 | 2.47 | ████████░░ |
| 19.00 | 3.90 | 1.59 | 2.93 | ██████████ |
Source: Crop Root Zone calculation. Product costs from Section 1 [1]–[5]; futures from FXEmpire delayed quotes, Nov 11, 2026 [7]. Basis: break-even bushels = product cost ÷ new-crop futures, before local basis. The bar column scales product cost, $19 = ten blocks.
On a 200-bushel corn crop the central case is 1.2% of yield. On 60-bushel soybeans it is 1.7%, and on 50-bushel wheat 3.7%. Those yields are our assumptions. The percentages matter more than the bushels, because they are smaller than a strip trial can resolve, a point Section 4 returns to.
3. Whether the product is alive
What's new: The first question for a living input is whether the organism on the label is in the package and viable. Two independent studies and one meta-analysis since 2022 say that for many commercial AMF products it is not.
Evidence: A team spanning Australia, Switzerland and the United States tested 28 commercial inoculants in greenhouse and field trials on three continents. In sterilized soil, where any colonization has to come from the product, 84% of the inoculants produced no mycorrhizal root colonization. In non-sterilized soil the products did not raise colonization, and only one treatment increased plant biomass. Laboratory cultures of the same fungal species colonized roots readily (Salomon et al., Applied Soil Ecology, 2022) [9].
84%
Share of commercial mycorrhizal inoculants that produced no root colonization in sterilized soil, in a 28-product study across three continents. (Salomon et al., Applied Soil Ecology, 2022) [9]
University of Kansas researchers then tested 23 inoculants, most of them retail products chosen by their Amazon sales rank, against laboratory-grown fungi and field soil. Spore counts ran 72% to 100% below the label's propagule count for all but one product, and spores averaged under 2% of labelled propagules. Eight commercial products produced no colonization in any pot. The best commercial product reached about 6% root colonization, against 11% for plain field soil and 11% to 49% for laboratory cultures. Five commercial products carried a root pathogen, Olpidium. Once each product's fertilizer content was controlled for, one commercial inoculant improved crop growth and two reduced it (Koziol, Lubin and Bever, Applied Soil Ecology, 2024) [10]. The lead author discloses equity in a company that sells a competing inoculant [10].
The same group's meta-analysis in New Phytologist is paywalled and we did not reach it. The university's news account says it covered 250 trials of commercial products and that the promised colonization and growth benefit failed to appear 88% of the time (Kansas News Service via University of Kansas, Dec 5, 2024) [11]. A second-hand summary gives 302 trials. We cannot reconcile the two counts without the paper.
Two limits apply. Salomon's products are not named. The Kansas products were sold mostly to gardeners, and the growth test used lettuce and carrot. Neither study tells a buyer whether a specific row-crop seed treatment is viable, and we found no public viability test of one. Dose is the other issue. A 2018 dealer article put a full rate of MycoApply at about 120,000 propagules an acre [5]. A current Rootella sheet lists 6 grams an acre at 167,000 propagules a gram, about 1 million [12]. At 32,000 corn seeds an acre that is roughly 4 to 31 labelled propagules per seed, by our arithmetic. If a label overstates viable units by anything like the Kansas margins, the low end of that range is less than one live propagule per plant.
4. What the field trials found
What's new: Company material and independent trials point in opposite directions. The independent record for US row crops is small: three corn trials and one soybean trial that we could document, plus a sweet corn study.
Evidence:
| Trial | Who ran it | Design | Result |
|---|---|---|---|
| Valent launch data, MycoApply EndoPrime [13] | Company | 24 corn trials over two years vs. untreated | +4.7 bu/acre average; 75% wins |
| Groundwork BioAg, Rootella corn sheet [12] | Company | 4 sites (IA, KS, NE, MS); design and years not stated | +11.76 bu/acre stated average |
| Nebraska Extension on-farm, Hall County, 2019 [1] | University extension and grower | 7 reps, non-irrigated no-till corn after soybeans; 2 fl oz in-furrow | 226 vs. 235 bu: −9 bu, significant (P = 0.003) |
| Practical Farmers of Iowa, Reinbeck, 2019 [4] | Farmer-research network | 4 reps each, corn and soybeans; 2 lb in-furrow | Corn: 4 bu difference, LSD 11. Soybeans: 2 bu, LSD 14. Neither significant |
| Wisconsin nitrogen-rate trial, Eau Claire [3] | Independent agronomist, state grant | 40 replicated blocks, 5 N rates; seed-applied | −1.9% across N rates; no meaningful colonization in either treatment |
| Cornell Extension, Long Island sweet corn, 2023–24 [18] | University extension | 3 commercial products × 2 N rates, 4 reps | No difference in root colonization or, in 2024, yield |
Sources as numbered. The Wisconsin trial year is not stated in the source. The four site pairs printed on the Rootella sheet (217/230, 165/180, 183/190, 187/212) average 15 bu by our arithmetic, not the 11.76 the sheet states. The Practical Farmers report as we reached it gives the size of the difference but not its direction.
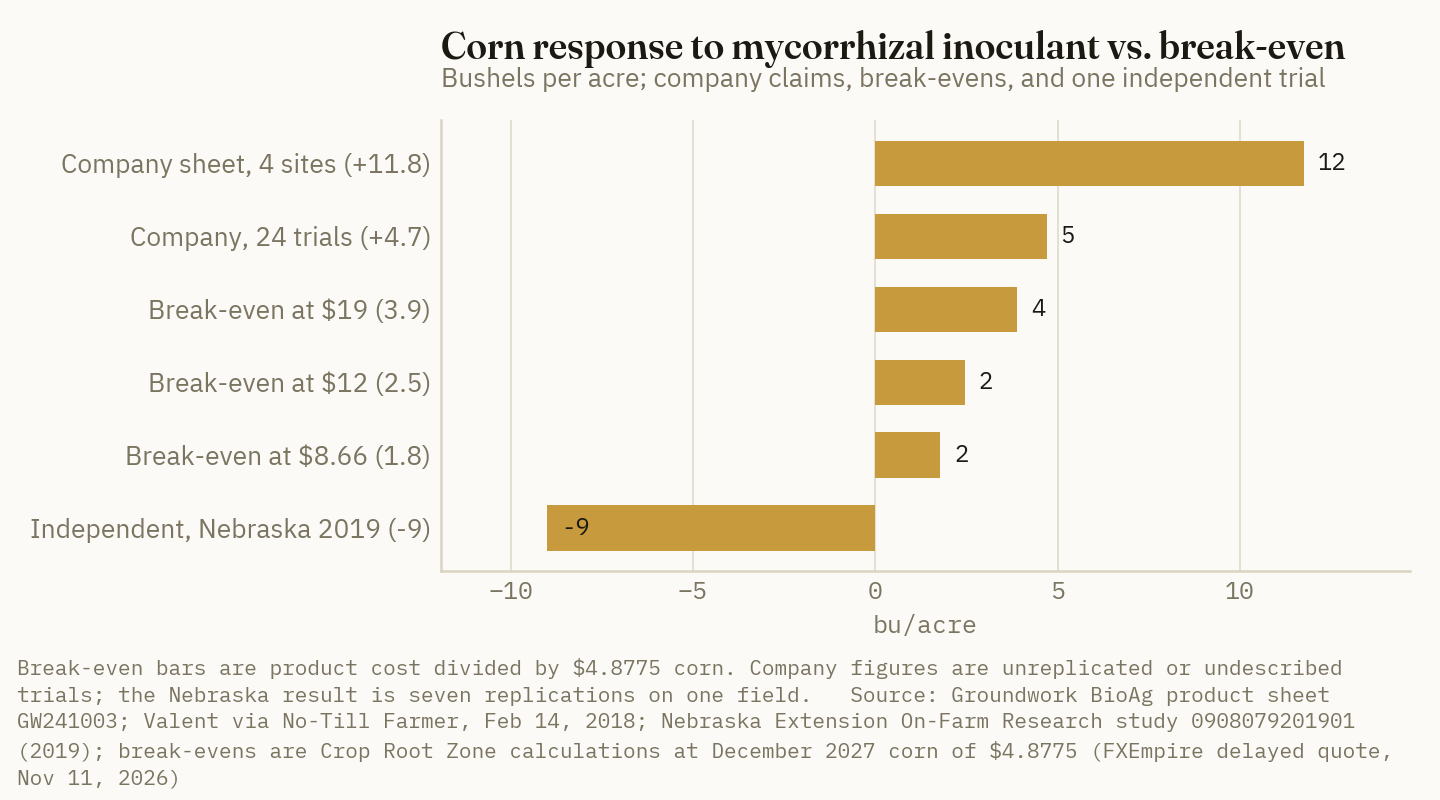
The Nebraska loss was worth $41.63 an acre at that study's $3.83 corn, product included [1]. At December 2027 futures the same 9 bushels and $8.66 come to $52.56, by our calculation. The field had received 110 lb of MAP and a 10-34-0 starter [1]. The Wisconsin agronomist attributed his result to high soil-test phosphorus, and he reports gains of 5 to 7 bushels in other fields without describing those trials [3]. All three independent corn sites were well-fertilized ground in rotation with host crops. That is where native fungi are least likely to be missing. It is also where most of the product would be sold.
The global literature is more favorable but is not about these products. A meta-analysis of field inoculation in seven cereals found a 16% average grain yield gain across 70 articles, positive in 77% of trials (Zhang et al., New Phytologist, 2019) [14]. A wheat meta-analysis of 38 field trials also found higher grain yield and called the economics unresolved (Pellegrino et al., Soil Biology & Biochemistry, 2015) [15]. Those datasets are dominated by research inocula applied at rates no planter delivers. A critical review in the same journal concluded that the field literature overstates the yield role of these fungi, partly through weak methods, and that managing them is not yet warranted for farmers (Ryan and Graham, New Phytologist, 2018) [16].
The best single field study shows the gap. Swiss researchers inoculated corn in 54 farm fields over three years. Biomass response ranged from −12% to +40%. It was significantly positive in 14 fields and negative in 2. Soil phosphorus explained under 2% of the variation. Fungal indicators in the soil microbiome explained most of it, and the authors point to pathogen load. The inoculated strain failed to establish at all in 11 of 38 fields checked (Lutz et al., Nature Microbiology, Nov 29, 2023) [17]. The inoculum was a greenhouse-grown culture applied at 450 grams per 80 centimeters of row [17]. On 30-inch rows that is about 3.3 tons an acre, by our estimate. A US label rate is 2 ounces to 2 pounds.
Ground Truth: The break-even is too small for a grower to check on his own farm in one season. The Iowa strip trial needed an 11-bushel difference to call a corn result real and 14 bushels for soybeans [4]. A $12 product needs 2.5 and 1.0. A farm trial can therefore catch a disaster, as Nebraska's did, but it cannot confirm a payback. That puts the whole decision on evidence gathered elsewhere, and for US row crops the independent evidence is one null, one small loss and one significant loss. The supportive Swiss result does not transfer. It measured biomass, at roughly 3,000 times the mass of a 2-pound label rate, with a fungus grown fresh for the purpose. A buyer who cites it is citing a different product.
5. Where a response is plausible, and what competes with it
What's new: The agronomic case for inoculation rests on fields where the native fungi have been starved. Extension calls the result fallow syndrome. Corn, wheat and other grasses lean on mycorrhizae for phosphorus and zinc, and the fungi decline when a field carries no living host for a season. That happens after prevented planting or flooding. It also happens after non-host crops, including sugarbeets and brassicas such as canola, radish and turnip. Corn is the most sensitive crop and soybeans are less so (Clark, SDSU Extension, Aug 12, 2020) [20].
Evidence:
| Situation | Why native fungi may be short | Independent evidence the inoculant pays | Extension's remedy |
|---|---|---|---|
| Corn after a fallow, flooded or prevented-plant year | No living roots for a season [20][21] | None found. Ohio State wrote a protocol in 2020; we could not open its results [22] | Band phosphate and zinc; plant soybeans instead [20][21] |
| Corn or wheat after sugarbeet or canola | Non-host crop [20] | None found. An Alberta wheat trial after canola had reported no result by 2022 [19] | Same |
| Low soil-test phosphorus | Fungi matter most where P limits | Mixed. P explained under 2% of response in Switzerland [17] | Fertilize to soil test |
| Fertilized Corn Belt ground, hosts every year | Natives present; high P suppresses colonization [3] | Negative or null [1][3][4] | None needed |
| High load of soil fungal pathogens | Best predictor in the Swiss fields [17] | 14 of 54 fields, research inoculum only [17] | No commercial test exists |
Sources as numbered. The right-hand columns are Crop Root Zone's reading of the cited work.
A University of Minnesota soil scientist told DTN in 2020 that there is "not much independent data on the effectiveness of these tools" (DTN/Progressive Farmer, Mar 18, 2020) [21]. We found nothing since that changes it. His remedy for at-risk corn was in-furrow starter, such as 5 gallons an acre of 10-34-0, plus a quart of chelated zinc. He said 30 to 40 units of phosphate may be needed, more than is safe on the seed [21]. South Dakota's guidance cites 40 lb of P2O5 banded near the row and says broadcast phosphate is unlikely to help [20].
That remedy has a price. DTN's survey for October 26–30 put 10-34-0 at $708 a ton (DTN/Progressive Farmer, Nov 4, 2026) [23]. Five gallons weighs about 58 lb, so it costs about $21 an acre and carries 20 lb of P2O5, by our estimate. That is more than the inoculant. But it supplies the nutrient the missing fungi would have fetched, and it is the practice extension recommends. In Alberta, researchers testing AGTIV on wheat and barley reported a preliminary gain of 1 to 2 bushels an acre from inoculants and fungicides together, with field results not final (Top Crop Manager, May 25, 2022) [19]. Wheat's break-even at $12 is 1.85 bushels.
| What we can say | |
|---|---|
| Established | Many commercial AMF products tested since 2022 contained little or no viable fungus [9][10]. Fallow and non-host years reduce native populations, and corn is the sensitive crop [20][21]. One replicated Nebraska trial lost 9 bushels [1]. |
| Estimated | Product cost of $8.66 to $19 an acre and the break-evens in Section 2. The Swiss inoculation rate in tons per acre. The $21 cost of a 5-gallon starter. Labelled propagules per seed. |
| Unknown | Any 2026 list price. The viability of any named row-crop seed treatment. Whether an inoculant restores yield after fallow, sugarbeet or canola. Any independent replicated US soybean or wheat response. The design behind either company's yield claim. |
Ground Truth: For 2027, sort fields before sorting products. On ground that grew corn, soybeans or wheat this year and tests adequate for phosphorus, leave the inoculant off the order. The independent record there is null to negative, and $12 on 1,000 acres buys nothing a strip trial can find. On the few fields coming out of prevented planting, sugarbeets or canola, the money goes first to a banded starter, and to soybeans over corn where the rotation allows. If a dealer offers the inoculant for those fields, ask for two things in writing: a viability assay on the lot being sold, in colonized root length and not propagule count, and replicated data from a fallow or non-host site. Neither exists in public today. Until one does, the product belongs in three or more paired strips on the at-risk field, with the starter held the same on both sides.
References
- Nebraska Extension On-Farm Research Network, "Impact of In-furrow Applied Mycorrhizae Fungi to Non-irrigated Corn," Study ID 0908079201901, Hall County, 2019 (check 235 bu/acre, MycoApply EndoPrime SC 226 bu/acre; product priced at $8.66/acre) — https://resultsfinder.unl.edu/sites/unl.edu.ianr.extension.on-farm-research.results-finder/files/pdf/0908079201901.pdf
- Groundwork BioAg, "Groundwork BioAg: A Decade of Impact and the Foundation for a Carbon Revolution," company page, undated (about 2024; Rootella Carbon inoculant entry cost of $10/acre with a four-year commitment) — https://groundworkbioag.com/groundwork-bioag-a-decade-of-impact-and-the-foundation-for-a-carbon-revolution/
- Ailts, J., "Does AMF-Treated Corn Impact Nitrogen Use Efficiency?" Strip-Till Farmer, Apr 6, 2026 — https://www.striptillfarmer.com/articles/6588-does-amf-treated-corn-impact-nitrogen-use-efficiency
- Gailans, S., "MycoApply Soil Inoculant for Corn and Soybeans," Practical Farmers of Iowa research report, Dec 5, 2019 (cooperator Jack Boyer, Reinbeck, Iowa) — https://practicalfarmers.org/research/mycoapply-soil-inoculant-for-corn-and-soybeans
- Strickler, D., article on mycorrhizal inoculants, Green Cover, Jan 15, 2018 (full rate of MycoApply about $16–$19/acre and about 120,000 propagules/acre) — https://greencover.com/blogs/articles/amfinoc
- Sumitomo Biorational (Valent BioSciences), MycoApply EndoPrime SC product page, accessed Nov 11, 2026 (no price listed; 1 gallon treats 64 acres) — https://www.sumitomobiorational.com/agriculture/products/mycoapply-endoprime-sc
- FXEmpire, futures contract pages for corn (ZC), soybeans (ZS) and KC HRW wheat (KE), delayed quotes timestamped Nov 11, 2026, about 13:05 UTC — https://www.fxempire.com/commodities/zc/contracts ; https://www.fxempire.com/commodities/zs/contracts ; https://www.fxempire.com/commodities/ke/contracts
- Brownfield Ag News, "Closing Grain and Livestock Futures: November 10, 2026," Nov 10, 2026 — https://www.brownfieldagnews.com/market-news/closing-grain-and-livestock-futures-november-10-2026/
- Salomon, M.J.; Demarmels, R.; Watts-Williams, S.J.; McLaughlin, M.J.; Kafle, A.; Ketelsen, C.; Soupir, A.; Bücking, H.; Cavagnaro, T.R.; van der Heijden, M.G.A., "Global evaluation of commercial arbuscular mycorrhizal inoculants under greenhouse and field conditions," Applied Soil Ecology 169, 2022 (abstract read via the Europe PMC record; full text not reached) — https://www.zora.uzh.ch/entities/publication/326c703f-8962-45b0-9496-5458e652ee49
- Koziol, L.; Lubin, T.; Bever, J.D., "An assessment of twenty-three mycorrhizal inoculants reveals limited viability of AM fungi, pathogen contamination, and negative microbial effect on crop growth for commercial products," Applied Soil Ecology 202, 105559, online Jul 31, 2024 (open access) — https://doi.org/10.1016/j.apsoil.2024.105559
- Llopis-Jepsen, C., "Soil health is big business, but KU researchers say many fungal products don't work as promised," Kansas News Service, republished by the University of Kansas, Dec 5, 2024; reporting Koziol, L.; McKenna, T.P.; Bever, J.D., "Meta-analysis reveals globally sourced commercial mycorrhizal inoculants fall short," New Phytologist 246(3):821–827, online Nov 21, 2024, DOI 10.1111/nph.20278 (paper not reached) — https://eeb.ku.edu/news/article/soil-health-is-big-business-but-ku-researchers-say-many-fungal-products-dont-work-as-promised
- Groundwork BioAg, "Rely on Rootella for Quality Corn," product sheet GW241003 (rates, propagule concentrations and four-site yield chart) — https://groundworkbioag.com/assets/uploads/2025/11/GW241003_Rely-on-Rootella-for-Quality-Corn-Ltr-PP_DIGITAL.pdf
- "New Mycorrhizal Fungi Treatment for Corn Launched by Valent," No-Till Farmer, Feb 14, 2018 — https://www.no-tillfarmer.com/articles/7534-new-mycorrhizal-fungi-treatment-for-corn-launched-by-valent
- Zhang, S.; Lehmann, A.; Zheng, W.; You, Z.; Rillig, M.C., "Arbuscular mycorrhizal fungi increase grain yields: a meta-analysis," New Phytologist 222(1):543–555, 2019, DOI 10.1111/nph.15570 (abstract)
- Pellegrino, E.; Öpik, M.; Bonari, E.; Ercoli, L., "Responses of wheat to arbuscular mycorrhizal fungi: A meta-analysis of field studies from 1975 to 2013," Soil Biology & Biochemistry, 2015, DOI 10.1016/j.soilbio.2015.02.020 (abstract) — https://agris.fao.org/search/en/records/65de17926eef00c2ce9fbdc9
- Ryan, M.H.; Graham, J.H., "Little evidence that farmers should consider abundance or diversity of arbuscular mycorrhizal fungi when managing crops," New Phytologist 220(4):1092–1107, 2018, DOI 10.1111/nph.15308 (abstract as indexed; full text not reached)
- Lutz, S.; Bodenhausen, N.; Hess, J.; Valzano-Held, A.; Waelchli, J.; Deslandes-Hérold, G.; Schlaeppi, K.; van der Heijden, M.G.A., "Soil microbiome indicators can predict crop growth response to large-scale inoculation with arbuscular mycorrhizal fungi," Nature Microbiology 8(12):2277–2289, online Nov 29, 2023 — https://pmc.ncbi.nlm.nih.gov/articles/PMC10730404/
- Lindback, E., "Determining if arbuscular mycorrhizal fungi inoculants increase yield and nutrient acquisition of sweet corn on Long Island, New York," Cornell Cooperative Extension of Suffolk County, 2025 report on 2023–24 trials — https://s3.amazonaws.com/assets.cce.cornell.edu/attachments/71435/myco_corn_2025_report.pdf
- King, C., "Making the most of mycorrhizal inoculation," Top Crop Manager, May 25, 2022 — https://www.topcropmanager.com/making-the-most-of-mycorrhizal-inoculation/
- Clark, J., "Fallow Syndrome: What is it and how do I deal with it?" South Dakota State University Extension, updated Aug 12, 2020 — https://extension.sdstate.edu/fallow-syndrome-what-it-and-how-do-i-deal-it
- Unglesbee, E., "Fallow Field Prep," DTN/Progressive Farmer, Mar 18, 2020 (Dan Kaiser, University of Minnesota) — https://www.dtnpf.com/agriculture/web/ag/crops/article/2020/03/18/fallow-flooded-fields-require-extra
- Karhoff, S.; Culman, S.; Hawkins, E., "Worried about Fallow Syndrome? Assess Risk with On-Farm Research," Ohio State University C.O.R.N. Newsletter 2020-10 — https://agcrops.osu.edu/newsletter/corn-newsletter/2020-10/worried-about-fallow-syndrome-assess-risk-farm-research
- Neeley, T., "UAN28 Continues to Lead Fertilizer Prices Higher in October's Final Week," DTN Retail Fertilizer Trends, DTN/Progressive Farmer, Nov 4, 2026 (survey week of Oct 26–30: 10-34-0 $708/ton) — https://www.dtnpf.com/agriculture/web/ag/crops/article/2026/11/04/uan28-continues-lead-fertilizer-week
Disclosures
Crop Root Zone is an independent publication. Nothing here is investment advice. Market calls, where included, reflect the editors' own read and are not a recommendation to buy or sell any security.
Cereal Rye Seed Costs About $13 an Acre This Fall. Ahead of Corn, the Yield It Can Take Is Worth Up to Five Times That. Ahead of Soybeans, Iowa Cost-Share Brings the Acre Close to Even.
North Dakota's fall 2026 foundation price of $14 a bushel puts 50 lb of rye at $12.50 an acre. Iowa's 2026 custom rates put drilling at $19.05. Termination adds $13 to $16 by our estimate, so a drilled acre costs $45 to $49 when it needs its own pass. Trials put the rye penalty at 2% to 5% of corn yield, worth $18 to $44 at November futures, and at roughly nothing on soybeans. Drilled into corn stalks bound for soybeans, sharing the burndown, an Iowa returning user's acre nets out within $1 of even on $20 of state cost-share plus $15 from Practical Farmers. Ahead of corn the same acre still costs $29 to $73.
The window for an established fall cover crop is closing. Cereal rye is still on the table because it is the one cover that will germinate into November soil and come back in spring. The seed is not the expensive part. North Dakota State's foundation seed program lists fall 2026 winter rye at $14 a bushel in bulk (NDSU Foundation Seed, effective Aug 7, 2026) [1], or 25 cents a pound. That puts a 50-pound drilled stand at $12.50 an acre. Iowa's 2026 custom rate survey puts drilling cover crop seed at $19.05 an acre (Iowa State University Extension, Mar 2026) [5]. Neither figure is what decides whether the acre pays. That depends on which crop goes in behind the rye in spring 2027 and how many days separate termination from planting. Below we price the acre from seed to burndown, set it against the trial evidence on yield and nitrogen, and net it against the cost-share programs open this fall. We find a wide gap between rye ahead of soybeans and rye ahead of corn.
1. What the seed costs this fall
What's new: No public survey prices cover crop rye by the bushel across the Corn Belt. The firmest fall 2026 number we found is North Dakota's foundation list. It is a certified-class price for North Dakota residents, and out-of-state growers are directed to their own state programs [1]. The rest of the evidence comes from seed dealers. In a July 27 pricing video, Green Cover said northern rye varieties were up about 7% on the year, mostly on freight. It said Elbon, a southern-Plains rye, was up about 33% after a poor season in western Oklahoma and Kansas (Green Cover, Jul 27, 2026) [2]. Those are dealer statements, not survey prices, and the video gives percentages only.
Evidence: A year ago the same dealer told DTN that 40 to 50 pounds of rye cost $10 to $12 an acre, after a 25% price drop on a large crop (DTN/Progressive Farmer, Sep 15, 2025) [3]. That is 24 to 25 cents a pound. Adding the 7% gives about 26 to 27 cents for fall 2026, by our arithmetic. That brackets the North Dakota list.
| Price point | Basis | $/bu (56 lb) | $/lb | Seed at 50 lb/ac, $ |
|---|---|---|---|---|
| NDSU foundation winter rye, fall 2026 | Bulk, foundation class, ND residents, eff. Aug 7, 2026 | 14.00 | 0.250* | 12.50* |
| Dealer quote, fall 2025 (40–50 lb for $10–12/ac) | Green Cover via DTN, Sep 2025 | 13.44–14.00* | 0.24–0.25* | 12.00–12.50* |
| Same, plus 7% for northern rye, fall 2026 | Dealer statement, Jul 2026 | 14.38–14.98* | 0.257–0.268* | 12.84–13.38* |
| Price used in Wisconsin on-farm trials, 2024 | Study input price | 11.20* | 0.20 | 10.00* |
Sources: NDSU Foundation Seed, Aug 7, 2026 [1]; Green Cover, Jul 27, 2026 [2]; DTN/Progressive Farmer, Sep 15, 2025 [3]; SARE project LNC21-456, Table 2 [4]. *Crop Root Zone conversion at 56 lb/bu, or our estimate. Dealer figures are quotes, not survey prices. Bin-run seed from a neighbor will usually be lower and is not captured here.
The seeding rate moves the seed bill more than the price does. In 74 site-years of Wisconsin strip trials, the top-quartile fields seeded under 50 lb an acre, and higher rates were among the factors most associated with yield losses (SARE project LNC21-456, Stute) [4]. Iowa State's long-running nitrogen study drilled rye at one bushel, 56 lb [7]. Its aerial work flew on 1.5 to 2 bushels, 84 to 112 lb [7]. A 7% price rise on a 50-lb stand is about 90 cents an acre. Doubling the rate costs $12 to $13.
2. What it costs to put on and take off
What's new: Iowa's 2026 custom rate survey, fielded in February with 205 respondents, priced drilling cover crop seed at $19.05 an acre (median $19.25, range $9 to $25, 39 responses). It priced aerial seeding of cover crops at $14.70 (range $10 to $18, 25 responses). Ground broadcast spraying without materials averages $8.50 an acre with a tractor and $9.35 self-propelled [5]. Those rates assumed diesel at $2.89 a gallon. Iowa's farm diesel ask was $5.65 on October 30 (USDA AMS, Oct 30, 2026) [6]. At our assumed 0.4 to 0.5 gallon an acre for a drill pass, that adds about $1.10 to $1.40 an acre to drilling, by our estimate.
Evidence: We found no 2026 public glyphosate price for termination. The Wisconsin study priced its 32-oz termination rate at $9.96 an acre in 2022, $6.86 in 2023 and $4.60 in 2024 [4]. We use $4.60 to $7.14, the 2024 figure and the three-year mean, and mark it as an estimate. Termination is either its own pass or a burndown a no-till grower would spray anyway. Ahead of corn, the 10-to-14-day lead that Iowa State recommends usually forces its own pass (Licht and Robertson, Iowa State University, Apr 16, 2021) [8]. Ahead of soybeans, rye can be killed at or just after planting, so it can ride the normal burndown [8][10].
| Cost line, per acre | Drilled after harvest, 50 lb | Aerial into standing crop, 84–112 lb |
|---|---|---|
| Seed, $0.25–0.27/lb | 12.50–13.50* | 21.00–30.24* |
| Seeding, Iowa 2026 custom average | 19.05 | 14.70 |
| Termination, own pass ($8.50–9.35 application + $4.60–7.14 glyphosate) | 13.10–16.49* | 13.10–16.49* |
| Total, own termination pass | 44.65–49.04* | 48.80–61.43* |
| Total, termination rides an existing burndown (chemical only, $0–7.14) | 31.55–39.69* | 35.70–52.08* |
Sources: seed from Section 1 [1][2][3]; seeding and spraying from Iowa State University Extension, A3-10, Mar 2026 [5]; glyphosate cost from SARE LNC21-456, Table 2 [4]. *Crop Root Zone estimate. Custom rates assume $2.89 diesel and do not include the fuel adjustment in the text. Aerial seeding rates follow Iowa State's 2014–16 aerial trials [7].
The totals sit near the published benchmarks. A three-year Minnesota farm-records study by the Environmental Defense Fund and University of Minnesota farm-management programs found a median direct cover crop cost of $42 an acre, with a range of $14 to $277 (Environmental Defense Fund, Oct 6, 2025) [23]. The Stanford team behind the satellite study discussed in Section 3 used about $40 [11].
The cheaper aerial pass is not the cheaper acre. Aerial seeding needs more seed, and in Iowa State's partial budget of rye ahead of no-till corn, broadcast rye lost $67.16 an acre more than drilled rye when the rye was not grazed. Broadcast rye made more biomass and cost more corn yield (Plastina et al., CARD Working Paper 22-WP 641, Jan 2023) [13].
| Where a drilled rye acre's cost comes from | $/acre | |
|---|---|---|
| Corn yield, 5% of 200 bu at $4.3925 (Iowa State 2009–13 result) | 43.93* | ██████████ |
| Drilling, Iowa 2026 custom average | 19.05 | ████░░░░░░ |
| Corn yield, 2% of 200 bu (Iowa State 2014–16 result) | 17.57* | ████░░░░░░ |
| Termination, own pass, midpoint | 14.80* | ███░░░░░░░ |
| Seed, 50 lb, midpoint | 13.00* | ███░░░░░░░ |
| Soybean yield, 1.3% of 60 bu at $11.8225 (Wisconsin all sites) | 9.22* | ██░░░░░░░░ |
Sources: Sections 2 and 3 [4][5][7]; prices Brownfield Ag News, Nov 9, 2026 [22]. *Crop Root Zone calculation; 200 bu corn and 60 bu soybean yields are our assumptions. Bars scale $43.93 = ten blocks, rounded.
3. What the trials say about yield and nitrogen
What's new: The trial record agrees on direction even where it differs on size. Rye costs corn more yield than soybeans, and termination timing drives most of the corn loss. Iowa State's five-farm nitrogen-rate study, 2009 to 2013, drilled rye at one bushel after harvest. It terminated the rye with glyphosate at least seven days before corn. Corn yield at the economic optimum N rate was 5% lower with rye, and the loss grew with rye biomass. Soybean yield was not affected at any of the five sites (Sawyer et al., Iowa State University, 2017 ICM Conference) [7]. A follow-up at four sites in 2014–16 terminated rye at 6 to 8 inches and planted corn at least two weeks later. That cut the penalty to 4 bushels, 204 against 208, or 2% [7].
Evidence:
| Study | Design | Corn | Soybeans |
|---|---|---|---|
| Iowa State N-rate study, 5 farms, 2009–13 [7] | Drilled 1 bu; killed ≥7 days before corn | −5% at optimum N | No effect at 5 of 5 sites |
| Iowa State practices study, 4 sites, 2014–16 [7] | Aerial 1.5–2 bu; killed at 6–8 in; corn ≥2 weeks later | −4 bu (−2%) | Not measured |
| Practical Farmers of Iowa paired strips, 12 farms, 10+ years [10] | Farmer-managed rye vs. bare | No effect in 32 of 39 trials | No effect in 20 of 29; gains in 8 |
| PFI termination trials, 5 trials, 2016–18 [10] | Rye killed near corn planting | −14 bu average | — |
| Wisconsin on-farm study, 74 site-years, 2022–24 [4] | No-till, mostly rye | −2.3% all sites; +3.3% top quartile | −1.3% all sites; +6.1% top quartile |
| Satellite study, 6 states, 2019–20 [11] | Fields with covers ≥3 years | −5.5% | −3.5% |
| National Cover Crop Survey, 657 farmers, 2026 [12] | Self-reported | +3.5 bu | +1.5 bu |
Sources as numbered. The survey row is self-reported by cover crop users, and the satellite study is observational. The PFI losses were concentrated in the study's first two years [10].
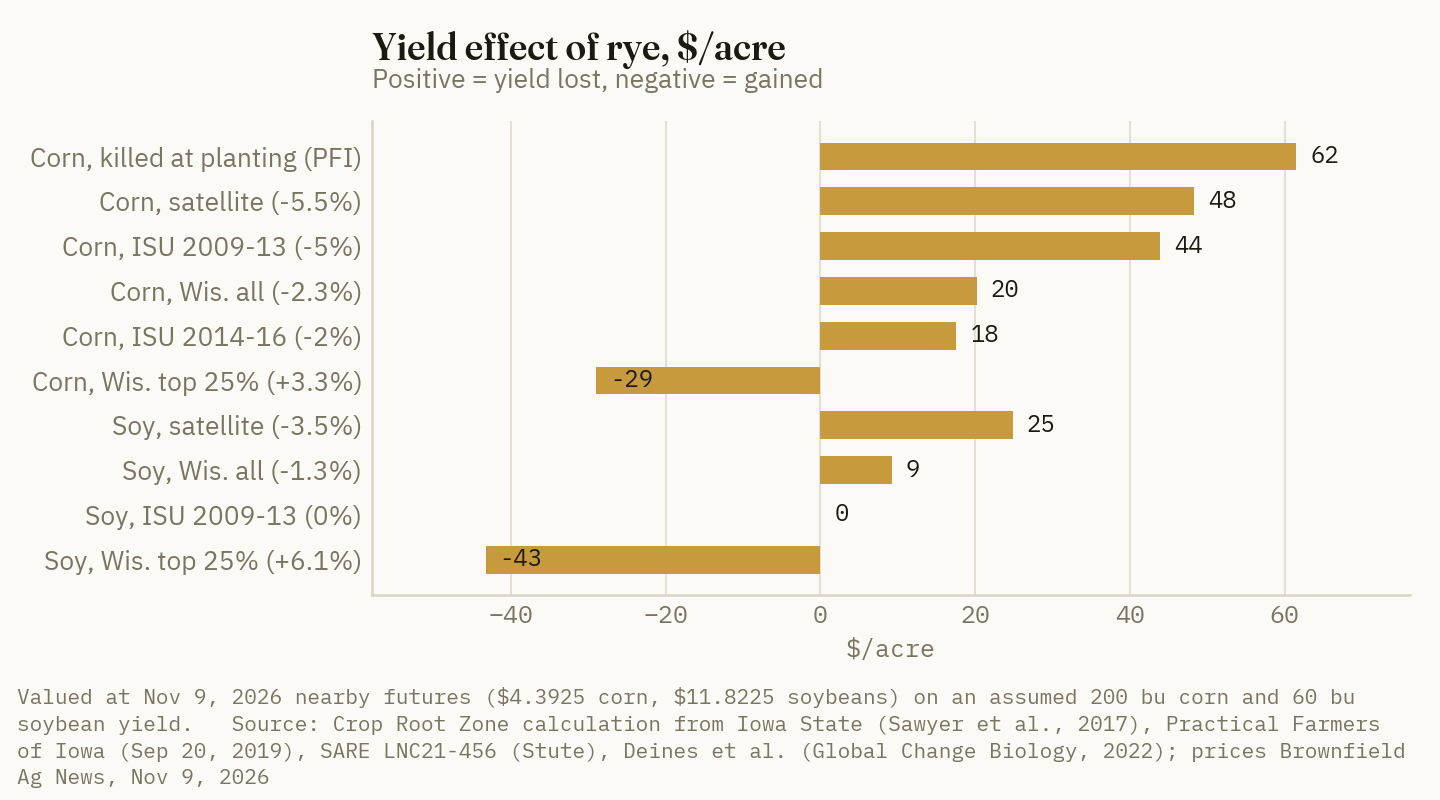
Nitrogen tie-up is real but small in this research. Iowa State's rye took up a mean of 20 lb of nitrogen an acre, with a range of 2 to 62. About 60% of the rye's nitrogen following corn had left the residue 105 days after termination. Rye roots ran a carbon-to-nitrogen ratio of 47 to 52 to 1, well past the roughly 30 to 1 at which decomposing residue ties up soil nitrogen. Even so, the economic optimum N rate with and without rye differed by only 6 lb, and the authors concluded that standard rate guidance still applies after rye. A 30-lb starter did not recover the lost yield. Tillage after termination was the only single practice in the study that did [7]. At DTN's October 26–30 retail average of $0.61 a pound of N for anhydrous, 6 lb is $3.66 an acre. At $0.80 for UAN28, it is $4.80 (DTN/Progressive Farmer, Nov 4, 2026) [21]. Iowa State's agronomists put the corn risk in stand loss and seedling disease, not the N budget. Rye terminated after planting produced worse radicle rot and the lowest corn yields in Robertson and Acharya's Boone plots [9]. Over 12 inches of rye at planting, the advice is to raise corn seeding rates 5% to 10% and consider starter N [8].
Ground Truth: The penalty from rye ahead of corn is set mostly by the spring termination date. Seed price and nitrogen move it much less. A 7% rise in seed price costs under $1 an acre, and the extra nitrogen is worth under $5. The step from killing rye two weeks before corn to killing it at planting cost 14 bushels in PFI's trials, about $61 at today's corn price. That gives a rule for this fall's seeding. If an operation cannot commit to a burndown 10 to 14 days before corn planting next spring, it should seed rye only where soybeans follow. That means this fall's corn stalks. Soybean stubble going to corn should stay bare or get a winter-killed cover. A wet April or a full applicator queue is enough to turn a $45 rye acre into a $100 one.
4. Who pays part of it this fall
What's new: The cost-share for fall 2026 is mostly state and private money. In Iowa, the Department of Agriculture and Land Stewardship (IDALS) opened its statewide sign-up on July 7. It pays $30 an acre for first-time users and $20 for returning users on up to 160 acres. First-time users can add $10 for a no-till or strip-till transition and $3 for a nitrogen inhibitor on fall fertilizer. Farms in 22 counties of the Greater Des Moines watershed can add $25 an acre on up to 500 more acres (IDALS, Jul 7, 2026) [14]. Practical Farmers of Iowa pays $15 an acre on fall-seeded covers planted by December 1 and says the payment stacks with state, EQIP and CSP money (DTN/Progressive Farmer, Aug 28, 2026; AgNavigator, Aug 17, 2026) [16].
Evidence:
| Program | Rate | Limit | Window | Stacking rule |
|---|---|---|---|---|
| Iowa IDALS statewide cost-share [14] | $30 first-time; $20 returning | 160 ac | Opened Jul 7, 2026; funding-limited | — |
| Greater Des Moines watershed, Iowa [14] | +$25 | 500 ac | 22 counties | Combines with statewide, up to 660 ac |
| Iowa crop insurance discount [15] | $5/ac off spring premium | No acre cap | Last window Dec 1, 2025–Jan 23, 2026; 2026–27 terms not yet announced | Not on acres in IDALS or NRCS cost-share |
| Practical Farmers of Iowa [16] | $15 | No cap stated | Seed by Dec 1, 2026 | Stacks with IDALS, EQIP, CSP |
| Illinois Fall Covers for Spring Savings [17] | Up to $5/ac off 2027 premium | 190,000 ac program-wide | Apply Dec 15, 2026–Jan 15, 2027 | Not on acres with other state or federal incentives |
| Illinois I-COVER, NRCS RCPP-funded [18] | $61.13 winter-killed; $85.65 single species, spring-killed; $105.40 multi-species | New adopters or new techniques; county priority | 2026 window Apr 15–May 1 (closed) | Excludes EQIP, CSP, FCSS |
| NRCS EQIP 340, Pennsylvania FY2026 cost list [19] | $76.94 single species; $92.33 historically underserved | $40,000 annual cap | FY2026 list expired Sep 30, 2026 | — |
Sources as numbered. We could not locate Iowa's FY2026 or FY2027 EQIP payment rate for practice 340. Pennsylvania's is shown only as an example of a current federal rate.
Federal money is mostly out of reach for a grower deciding this week. Iowa NRCS batched FY2026 EQIP applications on January 15, 2026 and set an August 15 obligation deadline (NRCS Iowa Bulletin 440-26-3, Apr 1, 2026) [20]. A fall 2026 seeding that is not already under contract will not draw new federal dollars this season. Illinois' I-COVER rates show what a spring-terminated rye payment can be. But its 2026 window closed May 1 and was open only to new adopters and new establishment techniques [18].
The two $5 insurance discounts cover less than a dedicated termination pass. Each is also a substitute for, not an addition to, the larger per-acre payments. Iowa's December 2025 release excludes acres enrolled in IDALS or NRCS cost-share [15]. Illinois excludes acres with any other state or federal incentive [17]. The Iowa release does not mention private programs, so whether Practical Farmers acres can also take the Iowa discount is a question to put to the agent before enrolling.
$22.54 and $11.90
The minimum cost-share per acre that would have offset the losses on the best-managed quarter of 74 Wisconsin rye sites, ahead of corn and ahead of soybeans, at 2022–24 prices. Across all sites, rye lost $55.92 an acre before corn and $43.47 before soybeans. (SARE project LNC21-456, Stute)
5. The net acre, and where it pays
What's new: This is our calculation, not a published figure. We took the cost ranges in Section 2 at their midpoints: $46.85 for a drilled acre with its own termination pass and $35.62 when termination rides an existing burndown. We added the value of the yield effects in Section 3 at November 9 futures, December corn at $4.3925 and January soybeans at $11.8225 (Brownfield Ag News, Nov 9, 2026) [22]. Then we subtracted the cost-share an Iowa grower can stack this fall. Nearby futures stand in for 2027 prices. The yield effects scale linearly with whatever price a grower uses.
Evidence:
| Drilled rye, Iowa, fall 2026 seeding | Gross cost | Yield effect | Cost-share | Net cost, $/acre | |
|---|---|---|---|---|---|
| Before soybeans, burndown shared, no yield effect, returning IDALS $20 + PFI $15 | 35.62* | 0.00 | 35.00 | 0.62* | ░░░░░░░░░░ |
| Same, first-time IDALS $30 + PFI $15 | 35.62* | 0.00 | 45.00 | −9.38* | ░░░░░░░░░░ |
| Before soybeans, Wisconsin all-site drag (−1.3%), returning + PFI | 35.62* | 9.22* | 35.00 | 9.84* | █░░░░░░░░░ |
| Before soybeans, no yield effect, insurance discount only | 35.62* | 0.00 | 5.00 | 30.62* | ████░░░░░░ |
| Before corn, own termination pass, 2% drag, returning + PFI | 46.85* | 17.57* | 35.00 | 29.42* | ████░░░░░░ |
| Before corn, 5% drag, returning + PFI | 46.85* | 43.93* | 35.00 | 55.78* | ████████░░ |
| Before corn, killed at planting (PFI −14 bu), returning + PFI | 46.85* | 61.50* | 35.00 | 73.35* | ██████████ |
| Before corn, 5% drag, Illinois I-COVER single species, spring-killed | 46.85* | 43.93* | 85.65 | 5.13* | █░░░░░░░░░ |
Source: Crop Root Zone calculation from [1]–[5], [7], [10], [14], [16], [18], [22]. *Estimates. Yields of 200 bu corn and 60 bu soybeans are assumed. Bars scale the largest net cost, $73.35, to ten blocks; net gains show no bar. The I-COVER row assumes the acre was enrolled in the spring 2026 window and leaves out PFI, because I-COVER excludes acres in any other program that uses state or federal funds, private ones included.
The table matches the independent studies where they overlap. Without cost-share, our soybean acre with Wisconsin's average drag costs $44.84, against Wisconsin's measured $43.47 [4]. Our corn acre at a 2% drag costs $64.42, against Wisconsin's $55.92 and Iowa State's $50.07 for ungrazed rye ahead of no-till corn [4][13]. The EDF Minnesota records cut the other way on corn. There, corn after covers beat the regional average acre in all three years, partly on lower fertilizer spending, while soybeans after covers trailed [23]. That is a comparison against a regional average, not a controlled trial, and it is the one dataset here that favors corn.
Ground Truth: In Iowa this fall, a cereal rye acre pays its own way in one configuration. The rye is drilled at 50 lb or less into corn stalks going to soybeans, and the termination rides the soybean burndown. For a returning user, $20 from IDALS plus $15 from Practical Farmers leaves that acre within a dollar of even. A first-time user comes out about $9 ahead before any soil benefit is counted. The binding constraint is IDALS' 160-acre cap. Past it, the acre falls back to $15 of private cost-share and costs about $20 net. If those acres can take the $5 insurance discount, about $15. Ahead of corn, no program open to a grower deciding in November closes the gap at an average manager's 2% to 5% penalty. Only an I-COVER-sized payment, or a top-quartile operator who kills rye early, gets that acre near even. So the useful decision this week is which fields get rye. On a farm short of time next April, the 2027 soybean fields should get all of it.
References
- North Dakota State University Foundation Seed Stocks, "2026 Fall Seed Prices," effective Aug 7, 2026 (winter rye $14/bu bulk, foundation class, North Dakota residents) — https://www.ag.ndsu.edu/fss/seed-prices/docs/FallPriceListNDFSS2026.pdf
- Green Cover, "Fall 2026 Cover Crop Seed Pricing: What's Changed and Why" (video, Keith Berns and Zach Louk), Jul 27, 2026 (dealer statement: northern rye up about 7%, Elbon about 33%; no dollar figures) — https://greencover.com/blogs/videos/fall-2026-cover-crop-seed-pricing-whats-changed-and-why
- Clayton, C., "Cover Crop Prices Lower This Fall," DTN/Progressive Farmer, Sep 15, 2025 (Keith Berns, Green Cover: 40–50 lb of cereal rye for about $10–12/ac) — https://www.dtnpf.com/agriculture/web/ag/crops/article/2025/09/15/now-might-good-time-try-cover-crops
- Stute, J., "Can cover crops pay? Unraveling yield enhancement on a wide scale to provide incentive for increased adoption," SARE North Central project LNC21-456 (project page, accessed Nov 10, 2026), and its Table 2, "Trial summary and prices used in the economic analysis, 2022–2024" — https://projects.sare.org/sare_project/lnc21-456/ ; https://projects.sare.org/media/pdf/T/a/b/Table-2-47.pdf
- Johanns, A.; Hart, C., "2026 Iowa Farm Custom Rate Survey," Iowa State University Extension and Outreach, Ag Decision Maker A3-10 (FM 1698), revised Mar 2026 — https://www.extension.iastate.edu/agdm/crops/pdf/a3-10.pdf
- USDA AMS Livestock, Poultry and Grain Market News, Iowa Production Cost Report (Bi-Weekly), week ending Oct 30, 2026 (No. 2 farm diesel ask average $5.65/gal, FOB) — https://www.ams.usda.gov/mnreports/ams_2863.pdf
- Sawyer, J.E.; Patel, S.; Pantoja, J.; Barker, D.W.; Lundvall, J.P., "Nitrogen dynamics with a rye cover crop," Proceedings of the 29th Integrated Crop Management Conference, Iowa State University, Nov 29–30, 2017, pp. 161–167 — https://www.agronext.iastate.edu/soilfertility/info/NitrogenDynamics-RyeCoverCrop_ICM2017.pdf
- Licht, M.; Robertson, A., "Corn after a Cereal Rye Cover Crop in 2021," Iowa State University Integrated Crop Management, Apr 16, 2021 — https://crops.extension.iastate.edu/post/corn-after-cereal-rye-cover-crop-2021
- Robertson, A.; Acharya, J., "Does planting green into a rye cover crop affect corn growth and yield?" Iowa State University Integrated Crop Management, Apr 6, 2021 — https://crops.extension.iastate.edu/post/does-planting-green-rye-cover-crop-affect-corn-growth-and-yield
- Gailans, S., "Using Science & On-Farm Research to Investigate Cover Crops in Iowa," Practical Farmers of Iowa, Sep 20, 2019 — https://practicalfarmers.org/2019/09/using-science-on-farm-research-to-investigate-cover-crops-in-iowa/
- Deines, J.M., et al. (senior author Lobell, D.B.), "Recent cover crop adoption is associated with small maize and soybean yield losses in the United States," Global Change Biology 29(3), published online Nov 2022, DOI 10.1111/gcb.16489; read via Jordan, R., Stanford University news release as republished by Phys.org, Nov 8, 2022 (the Stanford page returned 403 and PubMed required cookies) — https://phys.org/news/2022-11-crops-yields.html
- "Cover Crop Use Grows Nationally," DTN/Progressive Farmer, Sep 10, 2026 (2026 National Cover Crop Survey, CTIC, SARE and American Seed Trade Association; 657 farmers) — https://www.dtnpf.com/agriculture/web/ag/crops/article/2026/09/10/national-cover-crop-survey-shows
- Plastina, A.; Acharya, J.; Mauri Marcos, F.; Parvej, M.R.; Licht, M.; Robertson, A.E., "Net Returns to Cereal Rye Preceding No-till Corn in Integrated Iowa Operations," CARD Working Paper 22-WP 641 (revised), Iowa State University, Jan 2023 — https://www.card.iastate.edu/publications/22-wp-641
- Iowa Department of Agriculture and Land Stewardship, "Secretary Naig Opens Sign-Up for Annual Cover Crop Cost-Share Program," Jul 7, 2026 — https://iowaagriculture.gov/news/cover-crop-cost-share-program-2026
- Iowa Department of Agriculture and Land Stewardship, "Secretary Naig Opens Sign-Up Window for Iowa's Crop Insurance Discount Program," Dec 1, 2025 — https://iowaagriculture.gov/news/crop-ins-discount-prog-signup-12-25
- Jenkins, J., DTN/Progressive Farmer production blog on Practical Farmers of Iowa cover crop cost-share, Aug 28, 2026 — https://www.dtnpf.com/agriculture/web/AG/news/article/2026/08/28/production-blog-cover-crop-cost-6 ; and "Supporting cover cropping: Practical Farmers of Iowa launches 2026 cost-share program," AgNavigator, Aug 17, 2026 — https://www.agnavigator.com/Article/2026/08/17/cover-cropping-101-what-midwest-farmers-must-know-before-started/
- "Illinois Cover Crop Insurance Savings Program" (Fall Covers for Spring Savings, 2026–27), Insurance Journal, Oct 14, 2026 — https://www.insurancejournal.com/news/midwest/2026/10/14/888877.htm
- Illinois Department of Agriculture, "IDOA Launches I-COVER Program," press release, Mar 25, 2026 — https://www.illinois.gov/content/dam/soi/en/web/illinois/iisnewsattachments/32323-032526-i-cover-press-release-3.20.26.pdf.pdf
- USDA NRCS Pennsylvania, Bulletin PA 440-26-06, "Pennsylvania published cost list and payment caps for FY 2026 EQIP and CSP contracts," Mar 11, 2026 — https://nrcs-prod.azureedge.us/sites/default/files/2026-04/PA_Bulletin%20440-26-06%20PA%20Published%20Cost%20List%20and%20Payment%20caps%20for%20FY%2026%20EQIP%20%20CSP_edited.pdf
- USDA NRCS Iowa, Bulletin 440-26-3, "Fiscal Year (FY) 2026 Environmental Quality Incentives Program (EQIP) Timelines and Guidance," Apr 1, 2026 — https://nrcs-prod.azureedge.us/sites/default/files/2026-04/IAB440-26-3%20-%20FY26%20EQIP%20Timelines%20and%20Guidance.pdf
- Neeley, T., "UAN28 Continues to Lead Fertilizer Prices Higher in October's Final Week," DTN Retail Fertilizer Trends, DTN/Progressive Farmer, Nov 4, 2026 (survey week of Oct 26–30: anhydrous $0.61/lb N, UAN28 $0.80, urea $0.73) — https://www.dtnpf.com/agriculture/web/ag/crops/article/2026/11/04/uan28-continues-lead-fertilizer-week
- Brownfield Ag News, "Closing Grain and Livestock Futures: November 9, 2026," Nov 9, 2026 (December corn $4.39¼, January soybeans $11.82¼) — https://www.brownfieldagnews.com/market-news/closing-grain-and-livestock-futures-november-9-2026/
- Gauthier, V.; Hoang, M.L., "Financial impacts of cover crops in the Upper Midwest," Environmental Defense Fund, Oct 6, 2025 (with University of Minnesota Center for Farm Financial Management and Minnesota State Farm Business Management) — https://business.edf.org/insights/financial-impacts-of-cover-crops-in-the-upper-midwest/
Disclosures
Crop Root Zone is an independent publication. Nothing here is investment advice. Market calls, where included, reflect the editors' own read and are not a recommendation to buy or sell any security.
Discussion
Retail DAP is $950 a ton and MAP $991 in DTN's latest survey, the highest of the past year, and this issue's cover puts a ton of DAP at 233 bushels of Iowa corn. So: on your corn ground this fall, are you spreading full crop-removal phosphate, cutting to a reduced rate, or skipping the fields that test above a cutoff, and what soil-test P level, in ppm and by which test, is that cutoff?
Corrections are as welcome as answers. If you check our arithmetic against a primary source and find we have it wrong, reply to the email and tell us. The sharpest replies get answered in next week's Letters & Responses.