Issue 17 · 2026-11-09
This issue keeps asking who carries a cost between where it starts and the field. On potash it is not the plant. Nutrien was paid about $281 a ton for North American potash this summer, $8 less than a year ago. Its posted Midwest price has since reached $430, but DTN retail is $510, so the retail margin over the posted price has fallen from about $109 a ton to $80. Nitrogen ran the other way: a spring acre of urea now quotes $14 higher, and none of that increase came from the plant.
It runs through the other departments. On rented ground, tile is a landowner's roughly 3% investment paid for with a tenant's 6.79% money, and a standard buyout clause can leave the tenant up to $373 an acre short. A semi load of feedlot manure pays for 66 to 99 miles of road and a load of hog manure for 29 to 44. K-State prices 2027 Kansas wheat at $7.09 to $7.30; the July board works out to about $5.76 cash, short of continuous wheat's direct costs.
Why now: 2027 budgets, leases and spring bookings are being settled this month, while the plant, the dealer and the landowner each set their price. We show who pays at each step so you can check it against your own contracts.
— Crop Root Zone, Editorial Desk.
Letters & Responses
No reader correspondence reached us this week. On November 9 we searched the publication inbox from November 1 onward and found no questions, corrections or pushback about RZ-016. The same search returned more than 200 other threads from that period, none of them from a reader, so this is a real zero. We will not invent a letter to fill the space.
On RZ-016's fall nitrogen question. Last week's Discussion asked for two quotes: fall anhydrous and spring UAN28 from the same dealer, with the application and inhibitor charges itemized. No reader has sent them yet, and the question stays open. This issue's features add the plant side of the same picture. CF Industries' third-quarter urea and UAN prices were both below a year ago, while the spring urea acre rose $14, all of it after the plant gate (TRZ-0334).
Open questions (ours, not readers'). These carry forward, and this issue adds evidence to the first two.
- RZ-015's potash question. What is your dealer quoting for spring 2027 potash, and on what basis? DTN's retail average is now $510 a ton, and Nutrien's posted Midwest price is $430 (TRZ-0338).
- RZ-014's sulfur question. What sulfur source and rate are you booking for 2027 corn? The $615-a-long-ton fourth-quarter Gulf sulfur contract we could confirm from only one distributor last week is now confirmed in Mosaic's November 3 results release (see the Briefing).
- This issue's question. Discussion, at the end of the issue, asks a new question from your own operation.
Corrections, disagreements and figures from your own operation are welcome by email. We answer the sharpest ones here the following week.
In This Issue
This week's features, by department.
- Nutrien Was Paid $281 a Ton for North American Potash This Summer, $8 Less Than a Year Ago. Its Posted Price Has Since Risen $45 and Retail $16. A 2027 Corn-Soy Rotation's Potash Costs $55 an Acre, $2.50 More Than Last Fall.Third-quarter filings put Nutrien's North American potash at $310 a tonne net of freight, down 3% on lower summer fill pricing, and Mosaic's mine-gate MOP at $276, with fourth-quarter guidance of $255 to $275. Since the $385 summer fill, Nutrien's posted Midwest price has risen to $430 while DTN retail has moved from $494 to $510, so the retail premium over the posted price has fallen from about $109 a ton to $80. At Iowa State removal rates, a 210-bushel corn and 70-bushel soybean rotation needs 130 pounds of K2O, which costs $55.34 an acre at $510 retail against $52.84 a year ago. The plant's share of that acre fell 89 cents and everything after the plant rose $3.39.
- CF Industries Got $423 a Ton for Urea and $322 for UAN in the Third Quarter, Both Below a Year Ago. A Spring Acre of Urea Now Quotes $14 Higher, and None of the Increase Came From the Plant.CF's third-quarter realized prices fell 6% for urea and 3% for UAN from a year earlier, and Nutrien's urea fell 4%. Only ammonia rose, by 27% at CF and 15% at Nutrien. CF says its UAN fill opened near $280 to $290, averaged $322, and is sold into the first quarter, so much of the spring liquid ton is already bought at those prices. On 176 pounds of nitrogen, DTN's late-October quotes put a spring acre $14 higher than a year ago on urea and $8 higher on UAN32, while the CF gate price inside those acres fell $5 and $2. On anhydrous, the gate explains $12 of a $16 increase.
- NOLA Urea Goes Into Winter at $425 a Short Ton, $45 Above Last November, While India's Last Tender Paid $66 a Tonne Less Than a Year Ago. The Futures Curve Prices Only $20 of Spring Carry; the Last Three Winters Delivered $48 to $250.The November US Gulf contract settled at $425.25 a short ton on November 5, down $11.50 from the October contract in mid-October, and the March 2027 contract fell $15 to $445. A year ago the barge sat at India parity; today it is about $117 a tonne above India's last tender price, held there by Hormuz, European gas and Trinidad, not by the eastern market. Retail urea is $669, 12% above a year ago. An unbooked grower is pricing spring against a curve that assumes far less winter gain than the last three years delivered.
- Plants Got Less for UAN This Summer Than Last. Farmers Paid More. What the Third-Quarter Filings Say About the Fall Nitrogen Dollar.Third-quarter filings put UAN at the plant gate at $309 to $316 a ton, down 5% to 11% on the year, while DTN's retail UAN28 averaged $454, up 8%. On a $991 ton of retail anhydrous, the natural gas inside it cost about $102. The plant gate was $637, and $354 sat between the gate and the farm, up from about $240 a year ago. CF Industries and Nutrien report after today's close, so this rests on CVR Partners, LSB Industries and the two larger producers' second-quarter filings.
- Mosaic Got $838 a Tonne for DAP in the Third Quarter, Its Best Price of the Year, and Booked a Phosphate Gross Margin of Minus $105. Sulfur Explains Only Half of the Drop.On our reconstruction from Mosaic's November 3 filing, the DAP stripping margin fell about $94 a tonne in a year, to roughly $409, while reported phosphate gross margin fell $197. The other half of the damage is the cost of running plants at 52%. Raw materials now take about 42% of a farm ton of DAP, against 22% a year ago, and the dealer-and-freight layer over the producer's price has narrowed to about $173 a tonne. Mosaic guides fourth-quarter DAP at $820–840 with margins lower again, and its $615 sulfur contract reaches cost of goods in the first quarter of 2027, worth about $37 a tonne.
- K-State Priced the 2027 Kansas Wheat Crop at $7.09 to $7.30. The July Board Now Says $5.76. At That Price Continuous Wheat Does Not Cover Even Its Direct Costs.K-State's new Nov 1 budgets put a Kansas wheat acre $32 to $38 above last year's cost. In continuous wheat, diesel at $5.78 a gallon added three times as much as fertilizer. Repriced to July 2027 KC at $6.4575 less 70 cents, the three continuous budgets fall $3 to $16 short of direct cost and $121 to $230 short of total cost. North Central rotation wheat covers direct cost and rent with $43 to spare but misses total cost by $11. Last November's crop was rated better than this one and yielded 34 bushels. The spring urea topdress is now the largest cost still to spend, and 30 pounds of N costs 3.8 bushels, up from 3.1 at K-State's price.
- The Board Pays 30¾ Cents to Hold Corn Into July. That Covers the Interest Twice and Commercial Storage Two-Thirds of the Way. An Owned Bin Needs Only 3 to 10 Cents of Basis Gain to Beat a Harvest Sale.December corn settled at $4.40 on November 5, and Iowa's average cash bid was $3.99, 41 cents under. We priced storage from that bid to March, May and July for three routes, at a 6.66% operating rate and this fall's posted storage rates. An owned bin breaks even on 3 to 10 cents of basis gain. A rented bin needs 22 to 28 cents. Commercial space needs 31 to 43, which the basis seldom delivers. Without a hedge, the futures half of the return is still exposed.
- 2027 Corn PLC Pays Nothing Above $4.34. ARC-CO Starts Paying at $4.46, and at USDA's $4.20 Baseline It Pays $53 a Base Acre to PLC's $20 in Champaign County.The 2027 sign-up opened Nov. 2 and runs to Mar. 15. By our calculation corn's effective reference price slips to $4.34 and its ARC benchmark to $4.96. At WASDE's $4.70 and farmdoc's $5.00 budget price neither program pays, so the 2027 election is a bet on a price drop. ARC-CO covers more of that drop on corn and soybean base unless county yields beat benchmark.
- Corn Is 23 Cents of Every Dollar It Costs to Raise an Iowa Market Hog, and Meal Is 9. That Is the Lowest Corn Share Since 2006, and 2027 Hog Margins Now Depend on the Hog Price.Iowa State's latest farrow-to-finish closeout (September 2026 sales) puts corn at $40.78 and soybean meal at $15.54 of a $175.70 market hog. Corn's share is the lowest since 2006; it reached 37.8% at the 2011 peak. A 50-cent corn move shifts the breakeven by about $2.40 to $2.90 per carcass cwt, and a $25/ton meal move by $0.60 to $1.20. Forward corn, less Iowa basis, is back near the $4.22 cash price already built into that breakeven, so the feed-cost jump Purdue projected in September has mostly gone. On November 3 settlements, the 2027 lean hog curve averages $75.74 against an $86.77 breakeven. That is a loss of about $22 a head before manure credit, with June to August near breakeven and the winter months deeply negative. Hogs eat about 1.7 billion bushels of corn a year, and that demand is set for 2026/27; losses would show up in 2027/28 feed demand through the sow herd.
- Top-Level Dairy Margin Coverage Costs 15 Cents a Hundredweight for 2027, and the 2026 Margin Paid Back More Than Twice That by SeptemberDMC enrollment for 2027 runs Oct. 5 to Dec. 18 on the terms the 2025 reconciliation law set: a 6-million-pound Tier 1, production histories reset to the best of 2021-2023, and a 25% discount for herds that locked in through 2031. We rebuild the margin from its corn, soybean meal and alfalfa hay inputs. Through September, $9.50 coverage paid $0.34 per covered hundredweight of annual production against a $0.15 premium. The futures-based forecast puts every 2027 month above $9.50, while USDA's own October numbers imply a 2027 average just 15 cents over the trigger. That makes Tier 1 at $9.50 inexpensive cover on a feed bill driven by corn, and Tier 2 buy-up a poor buy at any level above $5.
- On Rented Ground, Tile Is a Landowner's 3% Investment Paid For With a Tenant's 7% Money. The Standard Buyout Clause Leaves the Tenant Up to $370 an Acre Short.A $1,470-an-acre 40-foot tile job on somewhat poorly drained ground takes a tenant paying 6.79% about 18 years to recover at $5 corn, and 20 years at last Friday's $4.41½ futures. A 15-year straight-line buyout clause of the kind extension materials print leaves the tenant up to $373 an acre short if the lease ends in year 12. A landlord paying for the same job needs only a $44 rent increase, about 30% of the yield gain, to earn a 3.0% cash return, above the 2.05% top Indiana farmland earns. Splitting the cost 50/50 with rent unchanged pays the tenant back in about 6½ years.
- A Grain Cart Costs About What a Used Farm Semi Costs to Own. Whether It Beats a Third Truck Depends on the Tractor in Front of It.farmdoc puts a 1,000-bushel cart at $7,964 a year to own and Iowa State's used-semi example at $6,950, so the two machines nearly cancel. What decides it is the tractor hour, the cart's fuel burn and the 8 to 10% of combine capacity lost to stationary unloading. With a tractor already on the farm, the cart is cheaper above roughly 700 to 1,000 acres per combine at $5.76 diesel. Charge the tractor at Iowa's $0.34 per horsepower-hour rental rate and the extra truck is cheaper at almost any acreage one combine covers.
- Hiring a Dry Fertilizer Pass Costs $8.56 an Acre in Iowa at Today's Diesel. A New Pull-Type Spinner Asked at $36,362 Beats That Past About 640 Acres a Year. Renting One at the Surveyed $7.05 Does Not.Six state surveys price hired dry spreading at $7.74 to $9.89 an acre, with a variable-rate premium of $1.28 in Ohio and $2.82 in Nebraska. A new 8-ton spinner carries about $3,980 a year of fixed cost at 5.12% real interest and breaks even near 640 acres with the tractor paid for, near 880 with it charged. A 72-foot air-boom asked at $148,500 needs about 3,450. The fertilizer on the acre is worth $79.55, nine times the spreading fee, so a 5.7% rate error costs $4.53 an acre. No public source prices a retailer's free-spreader offer or a pickup discount.
- A 2.5-Acre Grid Sample Costs About $8 an Acre. Over Four Years, It Pays if It Moves 2 Pounds of Phosphate an Acre a Year.Iowa's 2026 custom-rate survey puts GPS grid soil testing at $7.95 an acre. Built up from 2026 lab fees and per-sample collection charges, one pass costs about $1.90 to $3.40 an acre on a 10-acre composite, $3.80 to $6.70 on 5-acre zones, $7.60 to $13.50 on a 2.5-acre grid and $19 to $34 on a 1-acre grid. Spread over the sampling cycle and priced at September's $925 DAP and $495 potash, a 2.5-acre grid on a four-year cycle breaks even if it redirects about 2 lb of P2O5 an acre a year, or keeps maintenance fertilizer off about 2% of a field. A 1-acre grid needs 6.5 lb. Iowa's dense-grid strip trials saved about 4.5 lb of P2O5 and 7.5 lb of K2O a year. That covers a 2.5-acre grid easily and only just covers a 1-acre grid on a four-year cycle. Zones sampled every two years cost about the same per year as a grid every four.
- In a Warm November, a Semi Load of Feedlot Manure Pays for More Than Twice the Road a Load of Hog Manure Does. Broiler Litter Pays for 260 Miles. Each Needs a Field Short of Phosphate.At DTN's October 26–30 retail prices and Iowa State's availability factors, the nutrients a crop can still credit from November-applied manure cover a one-way semi haul of 258 to 387 miles for broiler litter, 66 to 99 for open-lot feedlot manure, 29 to 44 for deep-pit hog manure and 5 to 7 for dairy slurry, after application, when the receiving field needs phosphate and potash. Where the field needs only nitrogen and the fall takes the ammonium, only litter pays for any road. Hog manure falls furthest because 84% of its nitrogen is ammonium, the part a warm fall removes.
- A Ton of Yard-Waste Compost Carries $20 of Fertilizer at October Prices. A Crop Can Use About $10 of It the First Year, and Bulk Compost Sells for $20 to $40 a Ton.Priced at DTN's Oct 5–9 retail averages, a Pennsylvania yard-waste compost holds $20.19 of N, P and K per delivered ton and Idaho's median dairy compost $27.18, but only 0–10% of compost nitrogen is plant-available in year one, which cuts the first-year credit to about $10 and $19. Liming value adds an estimated $2 to $7. Nitrogen in yard compost bought at a $28–$32 municipal price costs $31 to $36 a pound. In row crops compost is bought for organic matter, and the trials show organic matter moves slowly.
- A Pound of Magnesium Costs Nothing in Dolomitic Lime That Was Going On Anyway, 12 to 71 Cents When the Lime Is Bought for It, and $5 to $8 in a Bag. Langbeinite's Magnesium Is Free Below $454 a Ton.At North Carolina's October 2 prices, the potash and sulfur in a ton of 0-0-22-11Mg-22S are worth $454, against a producer netback of $389. State critical levels run from 15 ppm to 100 ppm, five land-grant sources reject calcium:magnesium ratios, and no replicated corn trial we could open shows a bushel response to price against.
- Seaweed Extract Has a 16% Yield Record Worldwide. Almost None of It Was Measured in a Corn Belt Field.Ascophyllum nodosum extracts cost about $6.50 to $27 an acre in product at label rates. At the September 28 Central Illinois bids of $4.88 corn and $12.54 soybeans, that is 1.3 to 5.6 bushels of corn or 0.5 to 2.2 bushels of soybeans. Two meta-analyses put the average yield gain near 16%. The same data show smaller gains in field trials and with commercial products, and no significant effect in cooler climates or as a seed treatment. North America supplied 1.4% of the maize biostimulant studies in one global review. In the only Canadian soybean field data found, a commercial extract added 1% to 5%, and neither result was significant. California allows seaweed labels to claim only that the extract feeds soil microbes.
State of the Industry
Last week the November ammonia contract jumped and every grain fell. This week the retail survey caught up with the contract, the grain kept falling, and the ground stayed too warm to take the nitrogen.
Anhydrous crossed $1,000 at retail. DTN's survey for October 26–30 put anhydrous at $1,007 a ton, up $28 on the month and 19% on the year, its highest since the first week of July [1]. That is $20 above the week before, and the first survey taken after the Tampa settlement. Midwest wholesale ammonia is near $875 a short ton, CRU told Reuters, as imports from Trinidad fall about 34% this year [2]. The Tampa contract itself is not settled beyond doubt: Quantum's public lead gave $640 a tonne [3], while a weekly market report relayed by Fertilizer Daily on November 5 gave $645 [4]. We keep $640 until a second primary print says otherwise.
Urea went the other way. Retail urea fell $14 on the month to $669 [1]. NOLA granular barges were indicated at $425.50 a short ton on November 6 [5], and CBOT's November Gulf contract showed $425.25, down $15.25 from last week's reading, with March at $445 [6]. A pound of N now costs 61 cents in anhydrous and 73 cents in urea [1].
Phosphate held; sulfur's contract is now confirmed. The DAP benchmark was $795 on November 6, $1.50 above a week earlier [7], and an indicative NOLA DAP barge read $794 a tonne [8]. Retail DAP is $941 and MAP $987 [1]. Mosaic's results release confirmed the fourth-quarter Gulf sulfur contract at $615 a long ton, down from a third-quarter average cost of $715, and guided plant-gate DAP to $820–840 a tonne for the quarter [9]. That settles the $615 we could not confirm last week. The China-denominated sulfur benchmark fell another 1.4% to 5,151.75 yuan and is 29.6% below a month ago [10].
Potash was quiet. Retail potash is $510, up $11 on the month [1]; the NOLA indication was unchanged at $345 a short ton through November 3 [11].
Grain fell again. December corn settled at $4.41½ on November 6, down 6¼ cents. November soybeans lost 33¼ cents to $11.89 and December wheat 12¼ cents to $5.91¼ [12]. North-central Illinois elevators bid $4.12 for corn and $11.61 for soybeans [12]. A ton of retail anhydrous now costs about 244 bushels of that corn, against about 238 a week ago (our arithmetic). Corn futures sit 33½ cents under the $4.75 crop-insurance harvest price [13] (our arithmetic).
The field is the bottleneck. By November 1, 74% of corn was harvested against a 77% average, Iowa 66% against 79%; soybeans were 88% against 84% [14]. But nearly the whole Corn Belt is still above the 50°F soil threshold for fall anhydrous, and DTN's meteorologist says it may not arrive until well into December [15]. Diesel eased 6 cents to $6.292, and Illinois River barge freight slipped to $33.59 a ton [16].
What to watch. USDA's November WASDE and Crop Production are due Tuesday, November 10, at noon Eastern. The trade expects corn yield cut to 180.6 bushels from 181.2 and soybeans raised to 53.5 from 53.1, with soybean ending stocks at 332 million bushels against 315 [17]. Today's Crop Progress was not out as we closed.
| Benchmark | Level | Basis | Move |
|---|---|---|---|
| Anhydrous | $1,007/ton | Delivered retail, Oct 26–30 | +$28 MoM; +19.5% YoY; +$20 vs Oct 19–23 |
| Urea | $669/ton | Delivered retail, Oct 26–30 | −$14 MoM; +11.9% YoY |
| UAN28 | $446/ton | Delivered retail, Oct 26–30 | +$16 MoM; +8.3% YoY |
| UAN32 | $494/ton | Delivered retail, Oct 26–30 | +$11 MoM; +6.0% YoY |
| Ammonia | ~$875/st | Midwest wholesale, CRU via Reuters, Nov 2 | ~$800 in early October |
| Ammonia | $640/t | Tampa CFR, November contract | +$95 vs October; one report gives $645 |
| Urea | $425.50/st | NOLA granular barge, FOB, indicative, Nov 6 | +$1.50 vs Nov 5 |
| Urea | $425.25/st | CBOT U.S. Gulf futures, Nov 2026 | −$15.25 vs last issue; Mar 2027 at $445.00 |
| DAP | $941/ton | Delivered retail, Oct 26–30 | +$7 MoM; +1.5% YoY |
| MAP | $987/ton | Delivered retail, Oct 26–30 | +$13 MoM; +6.0% YoY |
| DAP | $795.00/t | Benchmark, Nov 6 | +$1.50 vs Oct 30; −0.6% m/m |
| DAP | $794/t | NOLA barge, FOB, indicative, Nov 5 | — |
| Sulfur | $615/lt | Q4 contract with U.S. Gulf refiners, per Mosaic | −$100 vs Mosaic's Q3 average cost of $715 |
| Sulfur | 5,151.75 CNY/t | China-denominated benchmark, Nov 9 | −1.4% vs Nov 2; −29.6% m/m |
| Potash | $510/ton | Delivered retail, Oct 26–30 | +$11 MoM; +4.7% YoY |
| Potash | $345/st | NOLA granular barge, FOB, indicative, Nov 3 | Unchanged vs Oct 27 |
| Dec corn | $4.41½/bu | CBOT settlement, Nov 6 | −6¼¢ w/w |
| Nov soybeans | $11.89/bu | CBOT settlement, Nov 6 | −33¼¢ w/w |
| Dec Chicago wheat | $5.91¼/bu | CBOT settlement, Nov 6 | −12¼¢ w/w |
| Corn, cash | $4.12/bu | N-central Illinois elevator avg, Nov 6 | −2¢ w/w; +3.5% YoY |
| Soybeans, cash | $11.61/bu | N-central Illinois elevator avg, Nov 6 | −28¢ w/w; +7.1% YoY |
| U.S. diesel | $6.292/gal | On-highway retail, wk Nov 2 | −6.0¢ w/w; +$2.54 YoY |
| Illinois River barge | $33.59/ton | Havana–Hardin to New Orleans, Nov 3 | −$0.33 vs last issue |
| Corn harvested | 74% | 18 states, Nov 1 | 60% a week earlier; 77% five-year avg |
| Soybeans harvested | 88% | 18 states, Nov 1 | 79% a week earlier; 84% five-year avg |
Sources: DTN/Progressive Farmer, Nov 4, 2026 (retail, Oct 26–30; month and year moves computed from the survey's month-ago and year-ago rows; week move against the Oct 19–23 survey in our last issue); Reuters via Fertilizer Daily, Nov 6, 2026 (CRU estimate); Quantum Commodity Intelligence, Oct 28, 2026 (public lead only) and Fertilizer Daily, Nov 5, 2026; CommodityScope, accessed Nov 9, 2026 (NOLA urea, DAP and potash; indicative assessments whose underlying sources the site does not name); Farmbucks quote page for CBOT U.S. Gulf urea futures, accessed Nov 9, 2026 (not labelled as settlements; "no recent trades"); Trading Economics, accessed Nov 9, 2026 (DAP, sulfur); Mosaic third-quarter results release, Nov 3, 2026; USDA AMS Illinois Grain Bids, Nov 6, 2026 (week moves against the Oct 30 figures in our last issue); USDA AMS Grain Transportation Report, Nov 5, 2026; USDA NASS Crop Progress, Nov 2, 2026. Trading Economics' urea print again matched a CBOT Gulf contract (January, $432.50) to the cent, so we leave it out. The Illinois distributor cost report is biweekly and has no edition newer than Oct 30.
The week's verdict: retail anhydrous broke $1,000 as corn lost another 6 cents, so a ton costs about 2.6% more corn than a week ago, and the soil is still too warm to put it on.
References
- DTN/Progressive Farmer, "UAN28 Continues to Lead Fertilizer Prices Higher in October's Final Week," Nov 4, 2026. https://www.dtnpf.com/agriculture/web/ag/crops/article/2026/11/04/uan28-continues-lead-fertilizer-week
- Fertilizer Daily, "U.S. ammonia prices near $875 a short ton as Trinidad supply falls," Nov 6, 2026, republishing Reuters (Nov 2, 2026), citing CRU and The Fertilizer Institute. https://www.fertilizerdaily.com/20261106-us-ammonia-prices-trinidad-supply/
- Quantum Commodity Intelligence, "Tampa ammonia increases by $95/mt for November," Oct 28, 2026 (headline and public lead only). https://www.qcintel.com/ammonia/article/tampa-ammonia-increases-by-95-mt-for-november-76238.html
- Fertilizer Daily, "Yara and Mosaic settle November ammonia contract at $645 a tonne," Nov 5, 2026, citing a weekly market report via Hortidaily. https://www.fertilizerdaily.com/20261105-yara-mosaic-november-ammonia-contract/
- CommodityScope, Urea prices, accessed Nov 9, 2026. https://commodityscope.com/prices/urea
- Farmbucks, "Urea (US Gulf) Futures (CBOT UFV)," accessed Nov 9, 2026. https://farmbucks.com/futures/fertilizer/urea-us-gulf
- Trading Economics, Di-ammonium Phosphate, accessed Nov 9, 2026. https://tradingeconomics.com/commodity/di-ammonium
- CommodityScope, Fertilizer prices (DAP NOLA FOB), accessed Nov 9, 2026. https://commodityscope.com/prices/fertilizers
- The Mosaic Company, third-quarter 2026 results release, Nov 3, 2026 (Form 8-K, Exhibit 99.1). https://www.sec.gov/Archives/edgar/data/0001285785/000128578526000139/pressreleaseq32026-ex991.htm
- Trading Economics, Sulfur, accessed Nov 9, 2026. https://tradingeconomics.com/commodity/sulfur
- CommodityScope, Potash prices, accessed Nov 9, 2026. https://commodityscope.com/prices/potash
- USDA Agricultural Marketing Service, Illinois Grain Bids, Nov 6, 2026. https://www.ams.usda.gov/mnreports/ams_3192.pdf
- DTN/Progressive Farmer, "Harvest Prices for 2026 Crop Insurance," Oct 30, 2026. https://www.dtnpf.com/agriculture/web/ag/crops/article/2026/10/30/crop-insurance-protection-sticks-4
- USDA National Agricultural Statistics Service, Crop Progress, Nov 2, 2026 (week ending Nov 1). https://release.nass.usda.gov/reports/prog4426.txt
- DTN/Progressive Farmer, "Warm Soil Temperatures Delay Fall Nitrogen Applications Across Midwest," Nov 4, 2026. https://www.dtnpf.com/agriculture/web/ag/crops/article/2026/11/04/warm-soil-temperatures-delay-fall
- USDA Agricultural Marketing Service, Grain Transportation Report, Nov 5, 2026. https://ams-prod.azureedge.us/sites/default/files/media/GTR11052026.pdf
- Pro Farmer, "November WASDE: Why soybeans are the biggest wildcard," Nov 6, 2026; Red River Farm Network, "Traders Position for Tuesday Crop Report," Nov 9, 2026 (Bloomberg survey). https://www.profarmer.com/news/agriculture-news/november-wasde-why-soybeans-are-biggest-wildcard ; https://www.rrfn.com/2026/11/09/traders-position-for-tuesday-crop-report/
Weekly Briefing
Fertilizer
Midwest ammonia near $875 as Trinidad barges thin — CRU puts Midwest wholesale ammonia at about $875 a short ton, up from about $800 in early October and about $600 in late June. The Fertilizer Institute says ammonia imports from Trinidad are down about 34% this year, and Nutrien shut its Trinidad nitrogen operations indefinitely in October because of gas shortages. (Reuters, Nov 2, 2026, via Fertilizer Daily, Nov 6, 2026)
Two prints for one Tampa contract — A weekly market report relayed by Fertilizer Daily puts the November Yara–Mosaic ammonia settlement at $645 a tonne CFR, up $95. Quantum Commodity Intelligence's public lead gave $640, also up $95. The two cannot both be right, and neither names the other; we use $640 until a second primary source settles it. (Fertilizer Daily, Nov 5, 2026; Quantum Commodity Intelligence, Oct 28, 2026)
Koch's half of a Moroccan phosphate plant clears Brussels — The European Commission approved Koch's purchase of 50% of Jorf Fertilizers Company I, a 1.2 million-ton-a-year DAP and MAP plant at Jorf Lasfar run by OCP Nutricrops, finding no competition concerns. The share transfer had not closed when the approval was announced on October 30. (Fertilizer Daily, Nov 8, 2026, citing 7NEWS Morocco)
Bunge closes its Argentine ammonia and thiosulfate plant — The Campana plant, which made ammonia, ammonium thiosulfate and potassium thiosulfate, closed with 137 direct jobs and about 113 contractor jobs lost. The union blames imports and costlier sulfur; sources close to Bunge cite the plant's age. Bunge had not made an official statement. (Forbes Argentina, Oct 27, 2026, via Fertilizer Daily, Nov 4, 2026)
Crops
WASDE Tuesday: corn yield seen trimmed, soybeans raised — Analysts surveyed by Bloomberg expect USDA's November 10 report to cut corn yield to 180.6 bushels an acre from 181.2 and lift soybeans to 53.5 from 53.1. Corn ending stocks are seen near 1.846 billion bushels, little changed, and soybean stocks at 332 million against 315, with guesses running from 280 to 404 million. (Pro Farmer, Nov 6, 2026; Red River Farm Network, Nov 9, 2026)
Corn harvest 74%, Iowa still 13 points behind — By November 1, 74% of corn and 88% of soybeans were harvested across 18 states, against averages of 77% and 84%. USDA says Iowa's 66% reflects record September rain. Winter wheat was 83% planted and 65% emerged, with 44% rated good to excellent. (USDA NASS, Nov 2, 2026; USDA AMS, Nov 5, 2026)
Soybeans touch an 11-week low before a Monday bounce — Futures hit their lowest in 11 weeks on November 6 as Chinese buying slowed, despite USDA confirming 136,000 tonnes of new-crop sales to China. Bloomberg reported soybeans rising on November 9 as Washington pressed Beijing to follow through on purchase pledges. (Global Agriculture, Nov 6, 2026; Bloomberg, Nov 9, 2026, headline only)
Home & Garden
Clemson's November list: put the fertilizer away — Extension agents advise against fertilizing or pruning live branches now, because new growth is easily frost-damaged, and suggest waiting until spring. They also suggest leaving fallen leaves in beds as habitat for overwintering insects, raising warm-season mowing height by half an inch, and planting crocus and daffodils now. The advice is written for South Carolina, so check your own frost dates. (Clemson Cooperative Extension, Nov 6, 2026)
Plenty of real Christmas trees, at last year's wholesale prices — In a Real Christmas Tree Board survey, 91% of wholesale growers said they do not plan to raise wholesale prices, up from 84% in 2025. Pennsylvania growers report good supply despite an April freeze that hurt some Douglas and Concolor firs. The survey comes from an industry group. (Altoona Mirror, Nov 8, 2026)
Micronutrients
Mosaic confirms the $615 Gulf sulfur contract — Mosaic says it settled fourth-quarter sulfur with U.S. Gulf Coast refiners at $615 a long ton, against a third-quarter average cost of $715. It expects more phosphate curtailments at South Fort Meade and Miski Mayo this quarter. This confirms the $615 figure we could find in only one distributor report last week. (Mosaic results release, Nov 3, 2026)
China's sulfur benchmark is down nearly 30% in a month — The yuan-denominated price fell to 5,151.75 a tonne on November 9, 29.6% below a month earlier and still 54% above a year ago. A Phospholutions sales executive argues sulfur will keep phosphorus supply tight for a couple of years. He sells phosphate products, and his claim of curtailments of up to 50% globally has not been independently confirmed. (Trading Economics, Nov 9, 2026; Fertilizer Daily, Nov 8, 2026, citing Pacific Northwest Ag Network)
Forty years of Alberta plots: manage acidity across the rotation — University of Alberta researchers using Breton Plots data from 1980 to 2020 found synthetic fertilizer acidified soil fastest, even where lime went on, and manure slowed it. Liming lifted alfalfa yield and N fixation but not cereal yields directly. Under reduced tillage, acidity concentrates in the top 3 inches. The work covers calcium and magnesium, not trace elements. (Canadian Journal of Plant Science, via Phys.org, Nov 7, 2026)
Organics
PFAS on nine of 10 Pennsylvania biosolids farms — Stroud Water Research Center sampling from 2021 to 2023 found PFAS on nine of 10 farms that had applied biosolids. Control fields that had never received them showed none on eight farms and small amounts on two, and PFAS turned up in streams draining treated fields on two farms. The work was presented as research, with no journal named and no concentrations given in the report. (Fertilizer Daily, Nov 7, 2026)
Pet-food buyers split the cost of regenerative wheat — Royal Canin and its ingredient supplier Roquette are sharing the upfront cost of moving more than 60 French farms, about 4,700 hectares, to cover crops and new rotations. Soil Capital verifies the data, and farmers keep 70% of the resulting carbon credits. No payment amounts were disclosed. (AgFunderNews, Oct 29, 2026, via Fertilizer Daily, Nov 4, 2026)
Warm soils push manure onto cover-crop fields — With most of the Corn Belt still above 50°F, Iowa State's Dan Andersen suggests that if manure pits must be emptied before soils cool, the manure go on fields with cover crops, whose living roots can take up nitrate. Swine manure is about 70% of Iowa's manure fertilizer and is less often treated with a nitrification inhibitor. (DTN, Nov 4, 2026)
Up and Coming
Koch widens access to a slow-release phosphate — Koch Agronomic Services will offer Phospholutions' RhizoSorb 8-39-0 in unnamed regions for 2027 application. The companies say it was used on more than one million acres in 2026 and can hold yields with up to 50% less phosphorus. Company claims: the release names no crops, soils or trial methods behind the 50%, and terms were not disclosed. (Fertilizer Daily, Nov 9, 2026, from a company release)
A copper catalyst turns nitrate into ammonia at 98.95% efficiency — A team publishing in PNAS reports a hydroxyl-functionalized copper framework that put up to 98.95% of its electrical charge into making ammonia from nitrate. Lab only: it ran on prepared nitrate solutions, not real wastewater, and no durability, scale-up or cost data were reported. (Fertilizer Daily, Nov 4, 2026)
Solar ammonia over farmland pencils out only at scale, a model says — Russian and Indian researchers modelled ammonia made from water and air with power from solar panels mounted above crops. Plants of up to 3 tonnes a year did not pay back, and economics improved around 150 tonnes. A model, not a plant: no efficiency or yield figures were reported, and Russia would likely need subsidies. (International Journal of Hydrogen Energy, via Fertilizer Daily, Nov 6, 2026)
Interesting
U.S. wheat export inspections hit an all-time weekly low — Just 75,413 tonnes of wheat were inspected for export in the week ending October 29, the lowest since records began in 1983. Only two ships loaded wheat, and just over half the week's total went to Mexico by rail. (USDA AMS Grain Transportation Report, Nov 5, 2026)
A South Dakota short line plans to stop running — The 37-mile Sisseton Milbank Railroad, out of service since flood washouts in August, plans to end service permanently, subject to Surface Transportation Board approval. Traffic had fallen from about 989 cars a year in 2013–2017 to 446 in 2021–2025. (USDA AMS Grain Transportation Report, Nov 5, 2026)
Ammonia-fuelled car carriers planned out of Japan — A Japanese consortium including JERA, NYK Line and K Line plans four ammonia dual-fuel vehicle carriers from the Chubu region by 2030. JERA will buy 70,000 tonnes a year of green ammonia from India's AM Green for five years. (Ammonia Energy, via Fertilizer Daily, Nov 5, 2026)
Off the Wall Discovery
A bee's plastic nest lining breaks down within a year — The cellophane bee, Colletes inaequalis, lines its underground nest with a polyester that packs like polyethylene. In natural soil the polyester fell from 73% to 40% of the lining by weight in four months, and by 11 months the lining was crumbling. Early-stage: all samples came from one site, and the researchers do not yet know why it degrades so fast. (PNAS, via Phys.org, Nov 2026)
Land plants' algal cousins went multicellular more than once — A University of Göttingen-led team sequenced 43 new transcriptomes from Zygnematophyceae, the pond algae that include Spirogyra and are the closest living relatives of land plants. Their analysis of more than 100 species suggests the group's ancestor was single-celled and that filaments evolved several separate times. Basic science, and an inference: the sample covers a fraction of more than 4,000 known species, and it changes the family tree, not anything in the field this season. (PLOS Biology, via Phys.org, Nov 5, 2026)
Nutrien Was Paid $281 a Ton for North American Potash This Summer, $8 Less Than a Year Ago. Its Posted Price Has Since Risen $45 and Retail $16. A 2027 Corn-Soy Rotation's Potash Costs $55 an Acre, $2.50 More Than Last Fall.
Third-quarter filings put Nutrien's North American potash at $310 a tonne net of freight, down 3% on lower summer fill pricing, and Mosaic's mine-gate MOP at $276, with fourth-quarter guidance of $255 to $275. Since the $385 summer fill, Nutrien's posted Midwest price has risen to $430 while DTN retail has moved from $494 to $510, so the retail premium over the posted price has fallen from about $109 a ton to $80. At Iowa State removal rates, a 210-bushel corn and 70-bushel soybean rotation needs 130 pounds of K2O, which costs $55.34 an acre at $510 retail against $52.84 a year ago. The plant's share of that acre fell 89 cents and everything after the plant rose $3.39.
The two largest potash producers selling into the United States were paid less for North American tons this summer than last. Nutrien realized $310 a tonne net of freight for North American potash in the third quarter, down from $319, and attributed the decline to "lower summer fill program pricing in North America" (Nutrien, Nov 4, 2026) [1]. Mosaic's mine-gate muriate of potash (MOP) price, which covers all its markets, was $276, against $271 a year earlier. Mosaic guided the fourth quarter to $255 to $275, so it expects no increase on its blended ton (Mosaic, Nov 3, 2026) [3]. Farm prices moved the other way. DTN's survey for Oct 26–30 put retail potash at $510 a ton, up 5% on the year and up $11 in four weeks (DTN/Progressive Farmer, Nov 4, 2026) [7]. Nutrien's posted Midwest price is $430, $45 above the summer fill (Advanced Turf Solutions, Nov 2, 2026) [10]. This piece sets out what the producers were paid, what the ton costs at each point between the mine and the field, how far retail has followed the posted price, what the producers said about supply going into 2027, and what it all means for next year's potash budget per acre.
1. What the producers were paid
What's new: Nutrien's potash segment earned $730 million of adjusted EBITDA in the third quarter, unchanged from a year earlier, on 4.07 million tonnes against 4.06 million [1]. Mosaic's potash segment earned $284 million against $329 million, on 2.1 million tonnes against 2.3 million. Mosaic said turnarounds at Colonsay and Belle Plaine and lower-than-expected ore grades at Esterhazy held production back [3]. Intrepid Potash, the only US producer, realized $394 a short ton against $381 (Intrepid Potash, Nov 3, 2026) [6].
Evidence: Realized prices, volumes and margins, with each producer's own basis:
| Q3 | Price, 2026 | Price, 2025 | YoY | $/short ton, 2026 | Volume, 2026 (kt) | Volume, 2025 (kt) | Gross margin/t, 2026 | Gross margin/t, 2025 | Basis |
|---|---|---|---|---|---|---|---|---|---|
| Nutrien, North America | 310 | 319 | −2.8%* | 281* | 1,587 | 1,562 | — | — | Net selling price, $/tonne |
| Nutrien, offshore | 253 | 250 | +1.2%* | 230* | 2,486 | 2,497 | — | — | Net selling price, $/tonne |
| Nutrien, average | 275 | 277 | −0.7%* | 249* | 4,073 | 4,059 | 159 | 169 | Net selling price, $/tonne |
| Mosaic, MOP | 276 | 271 | +1.8%* | 250* | 2,009 | 2,110 | 97 | 104 | FOB mine, all markets, $/tonne |
| Intrepid | 394/st | 381/st | +3.4%* | 394 | 59 | 62 | about 10/st* | about 41/st* | Net realized, $/short ton |
Source: Nutrien, Q3 2026 results, Nov 4, 2026 [1]; Mosaic, Q3 2026 release and performance data, Nov 3, 2026 [3][4]; Intrepid Potash, Q3 2026 release, Nov 3, 2026 [6]. *Crop Root Zone calculation; conversions at 1.10231 short tons per tonne. Intrepid's margin is its realized price less its reported cost of goods sold per ton ($384 against $340) and its volumes are short tons. Mosaic's gross margin is per tonne of all finished potash product. Nutrien does not report gross margin by region.
Three things stand out. First, the North American ton fell while the offshore ton rose. Nutrien's North American price fell $9 a tonne and its offshore price rose $3. Second, the summer step-up was smaller than last year's. From Nutrien's nine-month figures, its North American price averaged about $289 a tonne in the first half of 2026 and $310 in the third quarter, a rise of about $21. The same arithmetic for 2025 gives about $259 and $319, a rise of about $60 (Crop Root Zone calculation from [1]; the nine-month prices are rounded, so each first-half figure carries about a dollar of error). Third, the two Canadian producers went in opposite directions in North America. Nutrien sold 2% more tons there. Mosaic sold 556,000 tonnes of North American crop-nutrient potash against 649,000, a fall of 14% [4]. Mosaic's chief executive said on the call that the company could not build the inventory it needed for fourth-quarter sales and adjusted its guidance (Mosaic call via The Motley Fool, Nov 4, 2026) [5]. Together the two sold about 3% fewer North American tons than a year earlier.
Costs rose at all three. Nutrien's cost of goods sold rose to $116 a tonne from $108 and its controllable cash cost to $67 from $56, which it attributed to depreciation, maintenance and heavier turnaround activity [1]. Mosaic's cash cost of production was $73, up from $71 but down from $84 in the second quarter [4]. Intrepid's cost per ton rose $44, which left it with about $10 a ton of gross margin [6].
Ground Truth: The third quarter is the one in which a large part of North America's fall potash moves, and its producer price was lower than last year's. The farmer's higher fall price did not come from the summer ton. The tons that set the fourth-quarter producer price are being sold against a posted price $45 higher, so Nutrien's fourth-quarter North American number, due in February, is the first that will show how much of the fall increase reached the mine. Mosaic's flat guidance on its blended ton is not a contradiction. About two-thirds of its third-quarter potash volume was sold internationally [4], and the offshore market is where the price is soft (see Section 4).
2. From the mine to the field: the November chain
What's new: Every layer of the domestic chain is now quoted above its level of a year ago, but by different amounts. The Gulf barge is up about $17 a ton, the national retail average $23, and the producer's realized North American price is down about $8.
Evidence: Each point in the chain, in $/short ton and in cents a pound of K2O. Muriate at 0-0-60 carries 1,200 lb of K2O a short ton.
| Point in the chain | $/short ton | ¢/lb K2O | Year ago, $/st | Basis | |
|---|---|---|---|---|---|
| Mosaic MOP, Q3 | 250* | 20.9* | 246* | FOB mine, all markets | █████░░░░░ |
| Nutrien North America, Q3 | 281* | 23.4* | 289* | Net selling price, net of freight | █████░░░░░ |
| NOLA barge, Oct 30 | 340–350 | 28.8* | 325–330 | FOB barge | ███████░░░ |
| Corn Belt warehouse, Oct 30 | 395–435 | 34.6* | n/a | FOB warehouse | ████████░░ |
| Nutrien posted Midwest | 430 | 35.8* | n/a | FOB Midwest terminal | ████████░░ |
| Iowa distributor ask, Oct 30 | 499.80 | 41.7* | n/a | FOB distributor; range $480–$520 | ██████████ |
| DTN national retail, Oct 26–30 | 510 | 42.5* | 487 | As quoted to growers | ██████████ |
| Illinois distributor ask, Oct 30 | 517.73 | 43.1* | n/a | FOB distributor; range $480–$550 | ██████████ |
Source: Nutrien, Nov 4, 2026 [1]; Mosaic, Nov 3, 2026 [3][4]; Advanced Turf Solutions, Nov 2, 2026 [10]; USDA AMS Iowa and Illinois Production Cost Reports, Oct 30, 2026 [8][9]; DTN/Progressive Farmer, Nov 4, 2026 [7]. *Crop Root Zone calculation; ranges are taken at their midpoints. Bars scale $518 to ten blocks. The year-ago retail figure is DTN's Oct 27–31, 2025 row. The USDA state reports do not print a year-ago column, and the market summary prints one only for the barge.
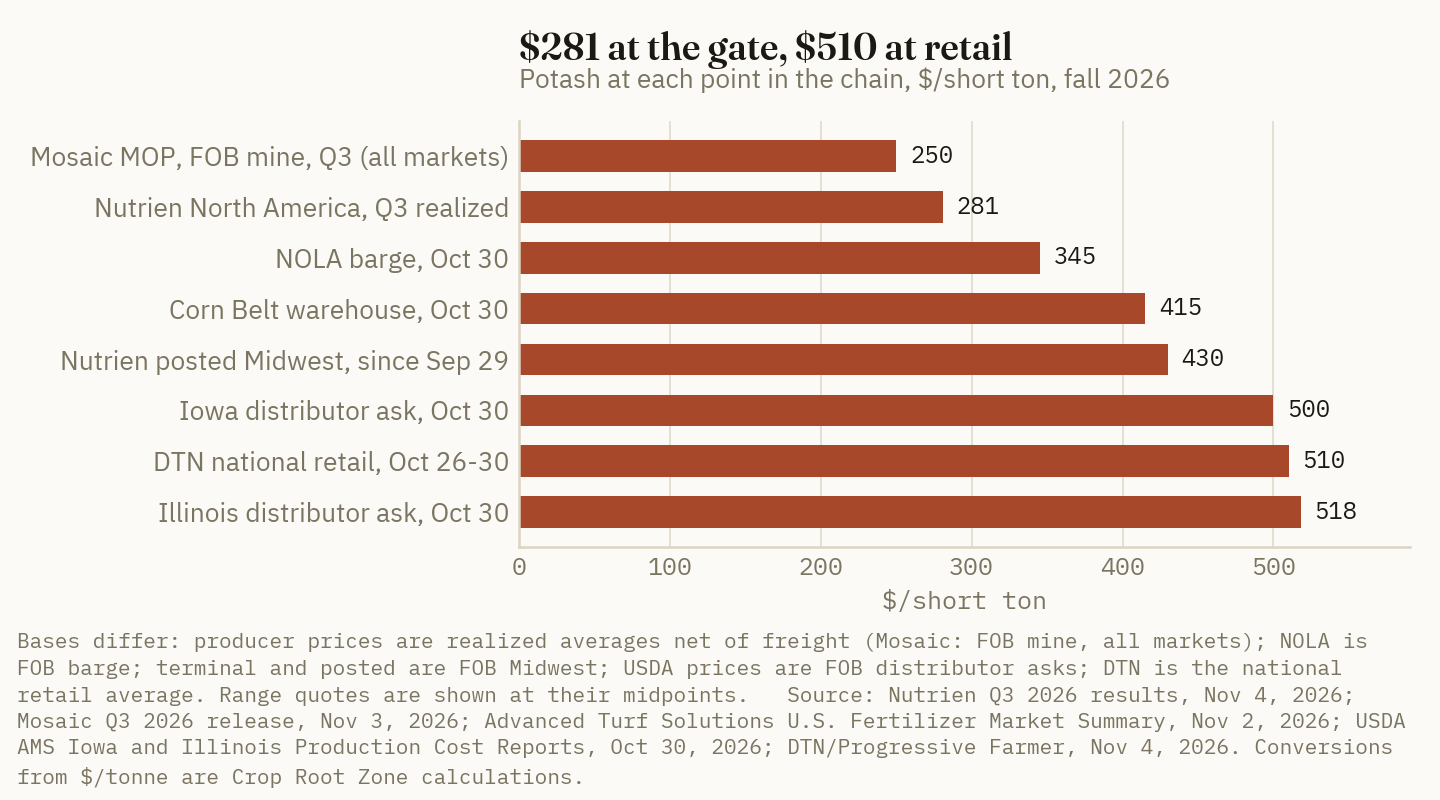
The two state reports moved up in the latest fortnight. Iowa's average ask rose $5.80 to $499.80 and Illinois's rose $2.73 to $517.73 [8][9]. On Oct 13 we wrote that the national average was likely to catch up to Illinois and print $510 to $525 before Thanksgiving if the posted price held at $430 (TRZ-0274, Oct 13, 2026) [18]. The posted price held and DTN printed $510 in the last week of October.
One step in the chain needs a caution. Nutrien's North American realized price of $281 a short ton and its summer fill of $385 FOB Midwest terminal are not the same measure. Nutrien reports net sales after freight and distribution costs, and its North American figure includes every North American customer, not only Midwest terminal buyers. Most of the roughly $100 difference is therefore likely rail freight from Saskatchewan and terminal costs. That is our inference. Nutrien does not publish the breakdown.
Measured from the mine, the ton has become more expensive to move. Retail less Nutrien's North American realized price was about $229 a ton this fall against about $198 a year ago, or 19.1 cents a pound of K2O against 16.5 (Crop Root Zone calculation from [1][7]). Some of that is real cost. Nutrien said higher fuel raised its own cost to serve this year [1]. Most of it is the timing difference between a summer ton and a fall price, which the next section measures directly.
3. The posted price moved. Retail mostly did not
What's new: Nutrien's posted Midwest price has risen $75 a ton since its winter fill in January. The national retail average has risen $28 over the same period.
Evidence: The posted price at each step this year, set against DTN's nearest survey week:
| Date | Nutrien posted, $/st FOB Midwest | Event | DTN retail, $/st | DTN week | Retail less posted | |
|---|---|---|---|---|---|---|
| Jan 8, 2026 | 355 | Winter fill announced | — | — | — | |
| Jan 23, 2026 | 375 | +$20 | 482 | Jan 19–23 | 107 | ██████████ |
| Apr 28, 2026 | 385 | +$10 | 493 | May 11–15 | 108 | ██████████ |
| Jun 11, 2026 | 385 | Summer fill rolled over | 494 | Jun 8–12 | 109 | ██████████ |
| Sep 3, 2026 | 410 | +$25 | 493 | Aug 31–Sep 4 | 83 | ████████░░ |
| Sep 29, 2026 | 430 | +$20 | 499 | Sep 28–Oct 2 | 69 | ██████░░░░ |
| Oct 30, 2026 | 430 | Unchanged | 510 | Oct 26–30 | 80 | ███████░░░ |
Source: Quantum Commodity Intelligence, Jan 8, Jan 23, Apr 28 and Jun 11, 2026 (headlines and opening lines only; the articles are behind a paywall) [11][12][13][14]; Advanced Turf Solutions, Sep 8 and Oct 5, 2026, as cited in TRZ-0274 [15], and Nov 2, 2026 [10]; DTN/Progressive Farmer, Nov 4, 2026 [7]. Retail less posted is a Crop Root Zone calculation; bars scale $109 to ten blocks. The Jan 23 increase took effect on the Friday that closed DTN's survey week. Our Oct 13 piece noted that one market summary described the June fill as $395; the dated June 11 report gives $385, and we use it here.
Through the first half the retail average sat about $107 to $109 above the producer's posted terminal price. That gap is roughly what it takes to move a ton from a Midwest terminal to a farm, including the retailer's handling, storage, spreading readiness and margin. Since the September increases it has run $69 to $83. On a fall ton bought at the $385 summer fill, a retailer quoting $510 still has $125 over its cost at the terminal. On a replacement ton bought at $430, it has $80.
Ground Truth: For potash this fall, the channel is absorbing a producer increase rather than adding its own. That is the reverse of nitrogen. In our Nov 6 piece the urea and UAN increases came almost entirely after the plant gate (TRZ-0334, Nov 6, 2026) [19]. On potash the retailer has a cushion of cheap summer tons and is selling against a posted price that has gone up faster than its quote. Once those tons are gone, the retailer's replacement cost is $430 plus freight. A spread back at the first-half $107 on today's posted price would mean retail near $537. That is a ceiling scenario, not a forecast. Our estimate is that spring retail settles in a $520 to $540 range if the posted price holds. The Gulf is the reason it may not hold, as the next section explains.
4. Offshore and supply: what the producers said about 2027
What's new: Both Canadian producers describe a tight world market for 2027. The quoted offshore price is softer than the domestic one.
Evidence: Nutrien raised its 2026 potash sales guidance to 14.3 to 14.8 million tonnes and kept its forecast of 74 to 77 million tonnes of global shipments this year. It put 2027 at 75 to 79 million [1]. Its chief executive, Ken Seitz, said he expects limited new potash capacity in 2027, and that about 1.5 million tonnes of former Soviet Union shipments were constrained in the fourth quarter (Nutrien call via The Motley Fool, Nov 5, 2026) [2]. Mosaic gave the same 1.5 million tonne figure for disrupted Baltic Sea shipments from Russia and Belarus. On the call, a Mosaic executive said Russian and Belarusian exports were likely to be about 1 million tonnes lower in the fourth quarter alone, and that China's 2027 contract talks have started earlier than usual [5]. Mosaic's release said Chinese imports have already passed last year's total [3].
| Market or producer | Quote | ≈ $/tonne | Basis |
|---|---|---|---|
| NOLA barge | $340–$350/st | 375–386* | FOB barge |
| Brazil, granular | $350–$365/t | 350–365 | CFR |
| Southeast Asia, standard | $387–$416/t | 387–416 | CFR, tender settlements |
| Western Canada mine offers | C$640–C$670/t | about 457–479* | FOB Saskatchewan |
| Nutrien offshore, Q3 realized | $253/t | 253 | Net selling price |
| Mosaic MOP, Q4 guidance | $255–$275/t | 255–275 | FOB mine, all markets |
Source: Advanced Turf Solutions, Nov 2, 2026 [10]; Nutrien, Nov 4, 2026 [1]; Mosaic, Nov 3, 2026 [3]. *Crop Root Zone conversion at 1.10231 short tons per tonne and, for the Canadian dollar, at Mosaic's third-quarter average of C$1.399 per US dollar [4]. A barge price and a vessel CFR price are not the same basis, so the comparison shows direction only.
The New Orleans barge is about $23 a tonne above Brazil on midpoints, the same relationship we described in October [18]. That is the condition under which offshore tons look for the Mississippi. The Baltic constraint is the reason fewer of them are available to make the trip this winter. Russian and Belarusian tons are the obvious candidates for that arbitrage, and both producers say about a million tonnes or more of them will not ship this quarter. The other source of new supply is not near. BHP's Jansen mine is due to begin production in mid-2027 [18].
Mosaic's blended fourth-quarter guidance is consistent with the table. Its Mosaic Fertilizantes business in Brazil bought only 252,000 tonnes of potash from Mosaic and Canpotex in the third quarter against 919,000 a year earlier [4], and Brazil's CFR price is the lowest number in the offshore table. A producer whose mix shifts toward the offshore market in the fourth quarter can see its average fall even while its domestic list price rises.
Ground Truth: The two forces on the US price point in opposite directions, but they do not act on the same timetable. The world price is soft now, which is the case for a lower spring ton. The Baltic constraint removes the tons most likely to exploit a $23 Gulf premium this winter, and the river barge season is closing as levels fall and lock work proceeds [10]. On balance we expect the posted price to hold through the first quarter and the Gulf to stay a cap on further increases, not a source of decreases. A grower waiting for imports to pull spring potash below fall is relying on tons that both producers say are stuck in the Baltic this quarter. There is one tariff risk. Canadian potash enters at zero duty today, but only one of the four US tariff layers on it is anchored by USMCA (TRZ-0310, Oct 26, 2026) [20].
5. The 2027 rotation: $55 an acre, and the soybeans pay most of it
What's new: At $510 retail, replacing the potash removed by a 210-bushel corn crop and a 70-bushel soybean crop costs $55.34 an acre over the two years, against $52.84 at last fall's $487.
Evidence: Iowa State's removal coefficients are 0.22 lb of K2O a bushel of corn grain and 1.2 lb a bushel of soybeans (Iowa State University Extension, PM 1688) [17]. The rotation removes 46.2 lb in the corn year and 84 lb in the soybean year, 130.2 lb in all.
$55.34 an acre
Potash to replace two years of removal on 210-bushel corn and 70-bushel soybeans at DTN's $510 retail average, $2.50 more than last fall. Of the increase, the plant's share fell 89 cents and the rest of the chain's rose $3.39. (Crop Root Zone calculation from DTN/Progressive Farmer, Nov 4, 2026, Nutrien, Nov 4, 2026 and Iowa State PM 1688)
The same 130.2 lb at each price in the chain:
| Price used | $/st | ¢/lb K2O | Corn year, $/acre | Soybean year, $/acre | Rotation, $/acre | vs. retail now |
|---|---|---|---|---|---|---|
| Nutrien North America, Q3 2026 | 281 | 23.4 | 10.83 | 19.69 | 30.51 | −24.83 |
| NOLA barge midpoint, Oct 30 | 345 | 28.8 | 13.28 | 24.15 | 37.43 | −17.91 |
| Nutrien posted, Midwest | 430 | 35.8 | 16.56 | 30.10 | 46.66 | −8.68 |
| DTN retail, a year ago | 487 | 40.6 | 18.75 | 34.09 | 52.84 | −2.50 |
| Iowa distributor ask, Oct 30 | 499.80 | 41.7 | 19.24 | 34.99 | 54.23 | −1.11 |
| DTN retail, Oct 26–30 | 510 | 42.5 | 19.64 | 35.70 | 55.34 | — |
| Illinois distributor ask, Oct 30 | 517.73 | 43.1 | 19.93 | 36.24 | 56.17 | +0.83 |
| Spring scenario, low* | 520 | 43.3 | 20.02 | 36.40 | 56.42 | +1.08 |
| Spring scenario, high* | 540 | 45.0 | 20.79 | 37.80 | 58.59 | +3.25 |
Source: [1][7][8][9][10][17]. All per-acre figures are Crop Root Zone calculations and exclude spreading. *The spring range is our estimate from Section 3, not a published price. These are maintenance rates for soils testing Optimum. They are not a recommendation for any field; below-optimum soils need build rates, and above-optimum soils may need none.
The table makes two points. The first is that the whole gap between the producer and the farmer is worth about $25 an acre over two years, and the change in it since last fall about $3.39. On a rotation that will spend several hundred dollars an acre on nitrogen and phosphate, potash price is a small line. The second is the soybean year. About 65% of the rotation's potash leaves with the beans. In Iowa cash terms on Nov 6, the corn year's potash costs 4.9 bushels of corn at $4.02 and the soybean year's costs 3.2 bushels of soybeans at $11.21 (USDA AMS, Nov 6, 2026) [16]. A ton of retail potash costs 127 bushels of Iowa corn against 126 a year ago, and 45.5 bushels of soybeans against 46.9 (Crop Root Zone calculation from [7][16]; six-region Iowa country-elevator averages of $4.02 for corn and $11.21 for soybeans, against $3.87 and $10.38 a year ago). On new-crop prices the corn year looks better. December 2027 corn settled at $4.8525 on Nov 6, which prices the corn year's potash at 4.0 bushels [16].
The corn ratio has moved more than the potash price. On Oct 12 a ton cost 113 bushels of Iowa corn [18]. Potash has risen $11 since then, and Iowa cash corn has fallen about 38 cents.
Ground Truth: For 2027, the potash decision is about rate, not timing. Moving the spring purchase from $510 to the $540 top of our range costs $3.25 an acre over two years. Skipping maintenance on an Optimum-testing field saves $55 but runs down soil potassium, and the soybean year that removes most of it is the year that is currently paying for it best: 3.2 bushels of $11 beans against 4.9 bushels of $4 corn. A grower who budgets potash as a corn input and trims it because corn is at $4 is cutting the input on the wrong crop. If the posted price holds at $430 into winter, buying fall-priced tons is likely to beat spring by a dollar or two an acre. That is not enough to justify applying on wet or frozen ground to capture it.
What to watch
- Nutrien's fourth-quarter North American potash price, due in February. The $45 a short ton posted increase is about $50 a tonne, so a figure near $360 would mean all of it reached the mine. A figure near $310 would mean the fall was shipped largely on fill-priced commitments.
- A 2027 winter fill program. Nutrien announced its 2026 program on Jan 8 at $355 [11]. A 2027 program at or above $430 would confirm that the producers intend to hold the fall level into spring.
- The NOLA barge. It has stayed within $340 to $360 since mid-September [10][18]. A move above $360 would mean the river is following the posted price.
- Baltic shipments and the 2027 China contract. Both producers put the fourth-quarter Russian and Belarusian shortfall at about 1 to 1.5 million tonnes [2][5]. An early China settlement would set the floor for the offshore ton.
- K+S and other offshore producers. K+S had not published its third-quarter statement when this was written, and we did not use ICL's results for this piece.
- DTN's weekly retail print. $510 is the highest in DTN's 14-row table. A print above $525 before year-end would put spring at the top of our range.
References
- Nutrien Ltd., Q3 2026 results, Exhibit 99.1 to Form 6-K, Nov 4, 2026 (potash segment net sales, volumes, net selling prices, cost and margin per tonne; 2026 and 2027 shipment outlook; nine-month figures). https://www.sec.gov/Archives/edgar/data/0001725964/000119312526447554/d139721dex991.htm
- The Motley Fool, "Nutrien (NTR) Q3 2026 Earnings Call Transcript," Nov 5, 2026. Third-party transcript; carries its own accuracy caveat. https://www.fool.com/earnings/call-transcripts/2026/11/05/nutrien-ntr-q3-2026-earnings-call-transcript/
- The Mosaic Company, Q3 2026 earnings release, Exhibit 99.1 to Form 8-K, Nov 3, 2026 (potash results, Q4 2026 guidance, market commentary). https://www.sec.gov/Archives/edgar/data/0001285785/000128578526000139/pressreleaseq32026-ex991.htm
- The Mosaic Company, Q3 2026 performance data, Exhibit 99.2 to Form 8-K, Nov 3, 2026 (quarterly MOP prices, North America and international volumes, cash cost, Mosaic Fertilizantes potash purchases, CAD/USD). https://www.sec.gov/Archives/edgar/data/1285785/000128578526000139/performancedataq32026-ex992.htm
- The Motley Fool, "Mosaic (MOS) Q3 2026 Earnings Call Transcript," Nov 4, 2026. Third-party transcript; carries its own accuracy caveat. https://www.fool.com/earnings/call-transcripts/2026/11/04/mosaic-mos-q3-2026-earnings-call-transcript/
- Intrepid Potash, Inc., Q3 2026 earnings release, Exhibit 99.1 to Form 8-K, Nov 3, 2026. https://www.sec.gov/Archives/edgar/data/0001421461/000142146126000026/ex991q32026pressrelease.htm
- DTN/Progressive Farmer, T. Neeley, "UAN28 Continues to Lead Fertilizer Prices Higher in October's Final Week," Nov 4, 2026 (survey Oct 26–30, 2026; four-weekly table from Oct 27–31, 2025). https://www.dtnpf.com/agriculture/web/ag/crops/article/2026/11/04/uan28-continues-lead-fertilizer-week
- USDA AMS, Illinois Production Cost Report (Bi-weekly), week ending Oct 30, 2026. https://www.ams.usda.gov/mnreports/ams_3195.pdf
- USDA AMS, Iowa Production Cost Report (Bi-Weekly), week ending Oct 30, 2026. https://www.ams.usda.gov/mnreports/ams_2863.pdf
- Advanced Turf Solutions, "U.S. Fertilizer Market Summary," Nov 2, 2026 (prices as of Oct 30, 2026). https://www.advancedturf.com/wp-content/uploads/2026/04/ATS-Fertilizer-Market-Update-11_2_2026.pdf
- Quantum Commodity Intelligence, "Nutrien announces potash winter fill program," Jan 8, 2026 (headline and opening lines only; paywalled). https://www.qcintel.com/ammonia/article/nutrien-announces-potash-winter-fill-program-56239.html
- Quantum Commodity Intelligence, "Nutrien increases Midwest terminal potash offers by $20/st," Jan 23, 2026 (headline and opening lines only; paywalled). https://www.qcintel.com/ammonia/article/nutrien-increases-midwest-terminal-potash-offers-by-20-st-57286.html
- Quantum Commodity Intelligence, "Nutrien increases potash prices by $10/st in Midwest," Apr 28, 2026 (headline and opening lines only; paywalled). https://www.qcintel.com/ammonia/article/nutrien-increases-potash-prices-by-10-st-in-midwest-63766.html
- Quantum Commodity Intelligence, "Nutrien rolls over summer fill potash price at $385/st FOB Midwest," Jun 11, 2026 (headline and opening lines only; paywalled). https://www.qcintel.com/ammonia/article/nutrien-rolls-over-summer-fill-potash-price-at-385-st-fob-midwest-66708.html
- Advanced Turf Solutions, "U.S. Fertilizer Market Summary," Sep 8 and Oct 5, 2026 (Nutrien's Sep 3 and Sep 29 posted-price increases), as cited in TRZ-0274 [18].
- USDA AMS, Iowa Daily Cash Grain Bids, Nov 6, 2026 (six country-elevator regions, current and year-ago corn and soybean averages; CBOT settlements). https://www.ams.usda.gov/mnreports/ams_2850.pdf
- Iowa State University Extension and Outreach, PM 1688, "A General Guide for Crop Nutrient and Limestone Recommendations in Iowa," Table 2 (removal coefficients of 0.22 lb K2O per bushel of corn and 1.2 lb per bushel of soybeans), as used in TRZ-0274 [18]. https://www.agronext.iastate.edu/soilfertility/info/PM%201688%202013.pdf
- Crop Root Zone, TRZ-0274, "Nutrien's Midwest Potash Price Is $430, Up $35 to $45 Since Summer Fill. Retail Is $499, Up $6. A Ton Now Costs 113 Bushels of Iowa Corn, Not September's 102.," Oct 13, 2026 (also the source here for the Jansen timing and the mid-September NOLA range).
- Crop Root Zone, TRZ-0334, "CF Industries Got $423 a Ton for Urea and $322 for UAN in the Third Quarter, Both Below a Year Ago. A Spring Acre of Urea Now Quotes $14 Higher, and None of the Increase Came From the Plant.," Nov 6, 2026.
- Crop Root Zone, TRZ-0310, "Canadian Potash Crosses the Border at 0% Under Four US Tariff Layers, and USMCA Holds Up Only One of Them. A 50% Duty Would Add About $121 a Ton and $12 an Acre to a Corn-Soy Rotation.," Oct 26, 2026.
Disclosures
Crop Root Zone is an independent publication. Nothing here is investment advice. Market calls, where included, reflect the editors' own read and are not a recommendation to buy or sell any security.
CF Industries Got $423 a Ton for Urea and $322 for UAN in the Third Quarter, Both Below a Year Ago. A Spring Acre of Urea Now Quotes $14 Higher, and None of the Increase Came From the Plant.
CF's third-quarter realized prices fell 6% for urea and 3% for UAN from a year earlier, and Nutrien's urea fell 4%. Only ammonia rose, by 27% at CF and 15% at Nutrien. CF says its UAN fill opened near $280 to $290, averaged $322, and is sold into the first quarter, so much of the spring liquid ton is already bought at those prices. On 176 pounds of nitrogen, DTN's late-October quotes put a spring acre $14 higher than a year ago on urea and $8 higher on UAN32, while the CF gate price inside those acres fell $5 and $2. On anhydrous, the gate explains $12 of a $16 increase.
The two largest nitrogen producers in North America were paid less for urea and UAN this summer than last. CF Industries realized $423 a ton for granular urea in the third quarter, down 6% from $450, and $322 for UAN, down 3% from $331. Ammonia rose 27%, to $532 (CF Industries, Nov 4, 2026) [1]. Nutrien's urea and ESN fell 4%, to $486 a tonne, and ammonia rose 15%, to $461 (Nutrien, Nov 4, 2026) [2]. On Wednesday we wrote that a CF UAN price near CVR Partners' $309 would confirm that the summer reset ran across the industry (TRZ-0330, Nov 4, 2026) [3]. At $322, it does. What the two releases and the calls that followed add is how much of next spring's nitrogen was priced in that reset. CF's chief commercial officer said the summer UAN program opened near $280 to $290, averaged $322, and is now sold into the first quarter (CF Industries call via The Motley Fool, Nov 5, 2026) [4]. Retail prices have not followed. This piece sets out what the two producers were paid, what they kept, what they said about spring 2027, and how much of a farmer's spring nitrogen bill the plant now accounts for.
1. What the two largest producers were paid
What's new: CF's net sales rose 12% to $1.86 billion, on 4.8 million product tons against 4.5 million. Net earnings were $436 million and adjusted EBITDA $833 million [1]. Nutrien's nitrogen segment sold 2.35 million tonnes against 2.83 million, with net sales of $960 million against $1,022 million and adjusted EBITDA down 11% to $497 million [2]. Both companies' volumes were shaped by plant outages. CF's Yazoo City complex has been down since a November 2025 incident and is expected back in the first half of 2027 [1]. Nutrien's Trinidad and New Madrid plants produced nothing in the quarter, and on October 5 Nutrien announced the indefinite shutdown of Trinidad [2].
Evidence: Realized prices by product, with the second quarter of 2026 for CF to show the size of the summer step down:
| Realized price, $/short ton | Q3 2026 | Q3 2025 | YoY | Q2 2026 | Q3 vs Q2 | Basis |
|---|---|---|---|---|---|---|
| CF ammonia | 532 | 418 | +27%* | 677 | −21%* | Average selling price, all customers |
| CF granular urea | 423 | 450 | −6%* | 593 | −29%* | Average selling price |
| CF UAN | 322 | 331 | −3%* | 441 | −27%* | Average selling price, grade not stated |
| Nutrien ammonia | 418* | 363* | +15% | — | — | Net selling price, converted from $/tonne |
| Nutrien urea and ESN | 441* | 460* | −4% | — | — | Net selling price, converted |
| Nutrien solutions, nitrates and sulfates | 244* | 247* | −1% | — | — | Net selling price, converted |
| Nutrien nitrogen average | 329* | 324* | +2% | — | — | Net selling price, converted |
Source: CF Industries, Q3 2026 earnings release, Nov 4, 2026 [1]; CF Industries, Q2 2026 earnings release, Aug 5, 2026 [5]; Nutrien, Q3 2026 results, Nov 4, 2026 [2]. Nutrien reports $461, $486, $269 and $363 a tonne for Q3 2026, against $400, $507, $272 and $357. *Crop Root Zone calculation or conversion at 1.10231 short tons per tonne. Nutrien's solutions line includes UAN, nitrates and ammonium sulfate, so it is not a UAN price.
The two companies moved together on every product. Both were paid more for ammonia and less for urea. CF's UAN fell 3%, and Nutrien's mixed solutions line fell 1%. The larger move was within 2026. CF's urea and UAN were each down more than a quarter from the second quarter, which Nutrien attributed to lower global benchmarks for most upgraded products. Its ammonia price rose on stronger benchmarks [2].
CF's volume moved the other way from its price. It shipped 1.99 million tons of UAN against 1.56 million, a 27% increase, and 1.08 million tons of urea against 0.94 million [1]. On the call, Bert Frost, the chief commercial officer, called the UAN figure the company's largest quarterly UAN volume this decade [4]. Ammonia volume fell to 1.00 million tons from 1.09 million [1].
CF's ammonia price is below CVR Partners' $637 and LSB's $528 [3]. CF does not separate its ammonia sales by customer in the release, and its average includes industrial and phosphate buyers, so it is a weaker guide to the farm ton than its urea and UAN prices.
Ground Truth: The UAN and urea volumes matter more than the prices. Almost two million tons of UAN moved at a $322 average in one quarter. That is a large part of a season's liquid nitrogen, bought by the channel at a price below last year's. For a spring 2027 UAN or urea ton, the summer price is not a stale number. It is close to what the retailer's ton actually cost.
2. Gas and margin: what the plants kept
What's new: CF paid $2.88 per MMBtu for natural gas in cost of sales, including derivatives, against $2.96 a year earlier. Henry Hub averaged $2.87 [1]. Nutrien's overall gas cost fell to $2.18 from $3.54, which it attributed to lower gas prices and a higher share of production from its North American plants after Trinidad stopped [2]. Nutrien does not split the figure by country in the release.
Evidence: At the USDA Economic Research Service rule of about 33 MMBtu of gas per ton of ammonia (USDA ERS, Aug 2007) [6], the gas in CF's ammonia ton cost about $95 in the third quarter, against $98 a year earlier. Nutrien's was about $72, against $117. These are estimates. The ERS rule is old, and modern plants run somewhat leaner.
| Producer, Q3 | Product | Realized, $/ton | Gross margin, $/ton, 2026 | Margin share, 2026 | Gross margin, $/ton, 2025 | Margin share, 2025 | |
|---|---|---|---|---|---|---|---|
| CF Industries | Ammonia | 532 | 193 | 36%* | 99 | 24%* | ██████████ |
| CF Industries | Granular urea | 423 | 180 | 43%* | 227 | 50%* | █████████░ |
| CF Industries | UAN | 322 | 135 | 42%* | 147 | 44%* | ███████░░░ |
| Nutrien | Nitrogen, manufactured | 363/tonne | 156/tonne | 43%* | 139/tonne | 39%* | ████████░░ |
Source: CF Industries, Nov 4, 2026 [1]; Nutrien, Nov 4, 2026 [2]. *Crop Root Zone calculation. Bars show 2026 gross margin per unit, scaled to $193 at ten blocks; Nutrien's is per tonne. Gross margin includes depreciation. Nutrien's gross margin before depreciation was $218 a tonne, against $195 [2].
CF's ammonia margin nearly doubled, from $99 to $193 a ton, while its gas cost fell 8 cents. Its urea margin fell $47 a ton and its UAN margin $12. Gas cost did not change enough to explain either move, so the margins followed the selling prices. Nutrien's case is clearer still. Its gas cost fell $1.36, or about $45 a ton of ammonia by the ERS rule, and its average selling price rose. Its gross margin per tonne rose by $17.
$95 a ton
The estimated natural gas in a ton of CF's third-quarter ammonia, at $2.88 per MMBtu. On a 176-pound anhydrous program that is about $10 an acre, against a delivered retail anhydrous acre of about $108. (Crop Root Zone estimate from CF Industries, Nov 4, 2026, USDA ERS, Aug 2007, and DTN, Nov 4, 2026)
Ground Truth: Nutrien's lower gas bill shows up in its margin and not in its price. Its gas cost fell by more than a third, and its nitrogen average still rose 2%. That is how a business priced off global benchmarks behaves, and it is the second quarter running in which cheap North American gas has reached the farmer as producer margin instead of a lower price [3]. The useful point for a buyer is narrower. The urea and UAN margins fell this summer, so the plant has already passed on some of the global softness. Retail has passed on less.
3. What they said about spring 2027
What's new: Neither release gives a North American spring forecast in numbers, but both companies' management described one on the November 5 calls. CF is planning around 95 to 96 million acres of US corn in 2027 and said that figure could rise if corn prices rally. It expects fall ammonia volumes to be among its highest in ten years, weather permitting, and expects nitrogen prices to follow a "positive trajectory in at least the first half" of 2027 [4]. Nutrien expects "strong demand early in 2027," because buyers deferred purchases, and expects global fundamentals to stay tight into 2027 [2][7].
Evidence: What each company said, and what it implies for the price of a spring ton:
| Statement | Company, source | What it means for a spring 2027 ton |
|---|---|---|
| Summer UAN fill opened near $280–$290, averaged $322 in Q3, and is "sold into Q1" | CF call [4] | Much of the spring UAN is bought at the gate already, below last year's $331 |
| NOLA nitrogen at about $430 a short ton for Q4, against about $360–$380 a year ago; product not named | CF call [4] | Replacement tons bought now cost more than the summer tons, by roughly 10% on the year |
| Fall ammonia among CF's highest volumes in ten years; spring ammonia program to follow | CF call [4] | More nitrogen goes on before winter, which takes some spring ammonia demand off the market |
| Corn at 95–96 million acres in 2027, possibly higher | CF call [4] | Supports spring demand. This is CF's planning figure, not a USDA estimate |
| Yazoo City back in H1 2027; AN in H2 2027 | CF release and call [1][4] | No new CF supply before spring application |
| Trinidad shut indefinitely; Q4 ammonia operating rates above 95% expected | Nutrien release and call [2][7] | Less Trinidad ammonia in the Gulf market; Nutrien's North American plants run fuller |
| Higher-cost nitrogen inventory "has now cleared our channel"; Q4 retail fertilizer margin expected to improve | Nutrien call [7] | The largest US retailer is now selling tons bought at lower prices |
Source: CF Industries, Nov 4, 2026 [1]; CF Industries Q3 2026 call, via The Motley Fool, Nov 5, 2026 [4]; Nutrien, Nov 4, 2026 [2]; Nutrien Q3 2026 call, via The Motley Fool, Nov 5, 2026 [7]. The transcripts are third-party and carry their own accuracy caveat. Frost did not state the product behind the $430 NOLA figure.
The last line deserves the most weight. Nutrien's retail segment earned $105 a tonne of gross margin on crop nutrients in the third quarter, against $119 a year earlier. The company attributed the decline to lower international volumes and to selling through higher-cost nitrogen inventory [2]. That inventory was bought earlier in the year, when CF was realizing $593 for urea and $441 for UAN [5]. Its chief financial officer, Mark Thompson, said on the call that the inventory had cleared and that fourth-quarter fertilizer margins should improve [7].
This adds to what we reported on Wednesday. Retail prices for UAN and urea did not fall with summer gate prices, and part of the reason is that retailers were still selling tons bought in the spring at second-quarter prices. Nutrien's figures support that explanation for the third quarter. They also mean the explanation no longer applies. The tons now in the channel cost the retailer less.
Ground Truth: The producers expect higher prices for spring, and they may be right. Middle East supply is constrained, Yazoo City is down and Trinidad is shut. But the tons that move first next spring were largely priced in July and August. Retail quotes can rise because replacement tons cost more at NOLA, as Frost's $430 suggests. They cannot also be justified by the cost of the tons already in the shed, since those cost less than last year's.
4. The farmer's spring bill: how much is the plant
What's new: DTN's survey for October 26–30 put retail anhydrous at $1,007 a ton, UAN28 at $446, UAN32 at $494 and urea at $669 (DTN/Progressive Farmer, Nov 4, 2026) [8]. In the first week of November 2025, the same products were $858, $414, $465 and $597 (DTN/Progressive Farmer, Nov 12, 2025) [9]. All four are higher on the year.
Evidence: The table prices a 176-pound nitrogen program, the spring rate we used in our fall-versus-spring work (TRZ-0326, Nov 2, 2026) [10], and divides each acre into CF's realized gate price and everything after it. The "after the gate" line covers freight, terminal, storage, retail margin and, for anhydrous, the nurse tank and delivery.
| $/acre at 176 lb N | Retail, late Oct 2026 | Retail, early Nov 2025 | Change | CF gate, Q3 2026 | CF gate, Q3 2025 | Change | After the gate, change |
|---|---|---|---|---|---|---|---|
| Anhydrous | 108.07* | 92.08* | +15.99* | 57.09* | 44.86* | +12.23* | +3.76* |
| Urea | 127.98* | 114.21* | +13.77* | 80.92* | 86.09* | −5.17* | +18.94* |
| UAN32 | 135.85* | 127.88* | +7.97* | 88.55* | 91.03* | −2.48* | +10.45* |
| UAN28 | 140.17* | 130.11* | +10.06* | 101.20* | 104.03* | −2.83* | +12.89* |
Source: DTN, Nov 4, 2026 [8], and Nov 12, 2025 [9]; CF Industries, Nov 4, 2026 [1]. *Crop Root Zone calculation at 1,640, 920, 640 and 560 lb N per ton. Basis: national average delivered retail against CF's average selling price. CF does not state the grade of its UAN, so the CF UAN price is applied to both grades and the true figure lies between the two rows. The retail weeks are a year and a week apart. DTN states anhydrous at +19% on its own year-ago week, against +17% on the week used here.
Read across the change columns, the products split in two. On anhydrous, $12 of the $16 increase is the plant, and the channel added about $4. On urea, the plant's part of the acre fell $5 while the farmer's acre rose $14, so the channel's share rose by about $19. On UAN32 the plant fell $2 and the channel rose $10.
The same result per pound of nitrogen:
| After the gate, ¢/lb N | Late Oct 2026 retail less CF Q3 2026 gate | Early Nov 2025 retail less CF Q3 2025 gate | |
|---|---|---|---|
| Anhydrous | 29.0* | 26.8* | ██████████ |
| Urea | 26.7* | 16.0* | █████████░ |
| UAN32 | 26.9* | 20.9* | █████████░ |
| UAN28 | 22.1* | 14.8* | ████████░░ |
Source: as above. *Crop Root Zone calculation. Bars show late October 2026, scaled to 29.0¢ at ten blocks.
Measured this way, the distance from the plant to the farm is now about 22 to 29 cents a pound of nitrogen on all four products. A year ago, urea and UAN28 carried 15 to 16 cents. The channel now charges about as much per pound to deliver urea, which is a dry product spread on the surface, as it charges for anhydrous, which needs pressure storage and a nurse tank.
Two qualifications apply. First, the gate column is a summer price set against a fall retail quote. For urea and UAN that matches the way the product moves, since CF says its fill tons are being shipped into the first quarter [4]. For ammonia it does not, because the fall ammonia ton is priced in the fourth quarter, and CF's average includes industrial sales. Second, CF is one producer. A retailer that bought from importers, or bought urea at NOLA in October, paid more than $423. Frost's $430 NOLA figure, if it refers to urea, sits close to the summer gate plus barge freight, and it is a replacement cost and not the cost of the tons already in place.
Ground Truth: For a spring 2027 nitrogen buyer, the producers' results change the negotiation for urea and UAN and leave it unchanged for anhydrous. The anhydrous increase came from the plant. Ammonia rose 27% at CF and 15% at Nutrien, and Tampa has risen since [3]. The urea and UAN increases came after the gate, at a time when the largest retailer says its expensive inventory has cleared. A grower pricing spring urea or UAN now should ask the retailer to quote against what the summer ton cost, about 46 cents a pound of nitrogen for CF's urea and 50 to 58 cents for its UAN, and not against the spring 2026 market.
5. What to watch before the spring ton is priced
What's new: The third quarter has settled what the plants were paid. Two things are still open: whether fourth-quarter producer prices rise as far as the producers expect, and whether retail urea and UAN quotes come down toward the lower cost of the tons now in the channel.
Evidence: The markers, in order of arrival:
| What to watch | Why it matters | When |
|---|---|---|
| DTN weekly retail urea, now $669 and down 2% on the month | The first product where the lower summer cost could show at retail. A further fall would mean the channel is passing it on | Weekly [8] |
| DTN retail UAN28 and UAN32, up 4% and 2% on the month | Rising while the gate cost of the fill ton fell. The clearest test of the channel spread | Weekly [8] |
| Nutrien Retail's fourth-quarter crop nutrient margin per tonne, $105 in Q3 | Nutrien expects it to improve. A large rise with flat retail prices would confirm the spread is now margin | February 2027 |
| CF's fourth-quarter ammonia and UAN prices | Shows how much of the fall ton was priced at the higher NOLA and Tampa levels | February 2027 |
| Yazoo City restart | CF expects the first half of 2027, which is likely after most spring nitrogen is bought | H1 2027 [1] |
| Winter Henry Hub | Matters to the producer's margin far more than to the farmer's price, as Section 2 shows; see our October work on winter gas (TRZ-0322, Oct 31, 2026) [11] | Ongoing |
Source: as cited.
One limit applies throughout. CF and Nutrien report average prices across customers, freight terms and grades. Neither reports a farm-delivered price, and neither states the UAN grade behind its average. The direction is clear across both companies and across CVR Partners and LSB before them [3]. Producers were paid less for urea and UAN than a year ago, and farmers are being quoted more. The size of the gap depends on the retailer, the region and when the retailer bought its tons.
References
- CF Industries Holdings, Inc., Q3 2026 earnings release, Exhibit 99.1 to Form 8-K, Nov 4, 2026. https://www.sec.gov/Archives/edgar/data/0001324404/000132440426000023/cf-11042026_ex991xearnings.htm
- Nutrien Ltd., Q3 2026 results, Exhibit 99.1 to Form 6-K, Nov 4, 2026. https://www.sec.gov/Archives/edgar/data/0001725964/000119312526447554/d139721dex991.htm
- Crop Root Zone, TRZ-0330, "Plants Got Less for UAN This Summer Than Last. Farmers Paid More. What the Third-Quarter Filings Say About the Fall Nitrogen Dollar.," Nov 4, 2026 (CVR Partners and LSB Industries Q3 2026 realized prices; DTN Q3 2026 retail averages).
- The Motley Fool, "CF Industries (CF) Q3 2026 Earnings Call Transcript," Nov 5, 2026. https://www.fool.com/earnings/call-transcripts/2026/11/05/cf-industries-cf-q3-2026-earnings-call-transcript/
- CF Industries Holdings, Inc., Q2 2026 earnings release, Exhibit 99.1 to Form 8-K, Aug 5, 2026. https://www.sec.gov/Archives/edgar/data/0001324404/000132440426000017/cf-08052026_ex991xearnings.htm
- W. Huang, "Impact of Rising Natural Gas Prices on U.S. Ammonia Supply," USDA Economic Research Service, WRS-0702, Aug 2007 (about 33 MMBtu of natural gas per ton of ammonia). https://www.ers.usda.gov/webdocs/outlooks/40459/11717_wrs0702_1_.pdf
- The Motley Fool, "Nutrien (NTR) Q3 2026 Earnings Call Transcript," Nov 5, 2026. https://www.fool.com/earnings/call-transcripts/2026/11/05/nutrien-ntr-q3-2026-earnings-call-transcript/
- DTN/Progressive Farmer, T. Neeley, "UAN28 Continues to Lead Fertilizer Prices Higher in October's Final Week," Nov 4, 2026 (survey Oct 26–30, 2026). https://www.dtnpf.com/agriculture/web/ag/crops/article/2026/11/04/uan28-continues-lead-fertilizer-week
- DTN/Progressive Farmer, "Anhydrous Again Leads Half of Retail Fertilizer Prices Higher," Nov 12, 2025 (survey Nov 3–7, 2025). https://www.dtnpf.com/agriculture/web/ag/crops/article/2025/11/12/anhydrous-leads-half-retail-prices
- Crop Root Zone, TRZ-0326, "Fall Anhydrous Is 20 Cents a Pound of N Under Spring UAN28. After the Knife, the Inhibitor and the Interest, It Can Give Up 17 Pounds an Acre. Trials Put the Fall Cost at 10 to 23.," Nov 2, 2026.
- Crop Root Zone, TRZ-0322, "Winter Gas Fell 47 Cents in Three Weeks, Taking $15 Out of a Ton of Ammonia. Tampa Rose About $86. Henry Hub Is $95 of a $987 Retail Ton.," Oct 31, 2026.
Disclosures
Crop Root Zone is an independent publication. Nothing here is investment advice. Market calls, where included, reflect the editors' own read and are not a recommendation to buy or sell any security.
NOLA Urea Goes Into Winter at $425 a Short Ton, $45 Above Last November, While India's Last Tender Paid $66 a Tonne Less Than a Year Ago. The Futures Curve Prices Only $20 of Spring Carry; the Last Three Winters Delivered $48 to $250.
The November US Gulf contract settled at $425.25 a short ton on November 5, down $11.50 from the October contract in mid-October, and the March 2027 contract fell $15 to $445. A year ago the barge sat at India parity; today it is about $117 a tonne above India's last tender price, held there by Hormuz, European gas and Trinidad, not by the eastern market. Retail urea is $669, 12% above a year ago. An unbooked grower is pricing spring against a curve that assumes far less winter gain than the last three years delivered.
The NOLA urea barge is going into winter lower than it was in mid-October and higher than it was a year ago. The November US Gulf futures contract settled at $425.25 a short ton on November 5, and the March 2027 contract at $445 (Farmbucks/CBOT, Nov 5, 2026) [1]. On October 21, when TRZ-0302 looked at Egyptian urea, the October contract was $436.75 and March was $460 [2]. Last November the barge averaged $380.25 (USDA AMS/Green Markets, retrieved Nov 6, 2026) [3]. The rest of the world has split. India's last tender drew a lowest offer of $352.10 a tonne CFR, $66 below the tender it ran a year ago, while Egyptian granular sold at about $535 FOB, its highest point this fall (Australian Fertilizer Corporation, Oct 26 and Nov 2, 2026) [4][5]. Retail urea averaged $669 a ton in the last week of October, down 2% on the month and up 12% on the year (DTN/Progressive Farmer, Nov 4, 2026) [6]. This piece sets out where the barge sits, why it is no longer priced off India, what the futures curve says about spring, and what a grower who has not booked urea faces at retail.
1. The barge: lower than October, higher than a year ago
What's new: The Gulf futures curve fell across the front of the board in the two weeks after October 21. The front month dropped from $436.75 (October contract) to $425.25 (November contract), and March 2027 fell $15, or 3.3%, to $445 [1][2]. Australian Fertilizer Corporation put the November barge at about $475 a tonne in the week to October 30, which is about $431 a short ton by our conversion and consistent with the board [5].
Evidence: The table lines up the US price chain at three dates. Mid-October and early November are on the same sources. The year-ago column uses USDA's monthly averages for the barge and DTN's survey for the same week of 2025, so it is close but not identical in basis.
| US urea price chain | Early Nov 2026 | Mid-Oct 2026 | Year ago | YoY | Basis |
|---|---|---|---|---|---|
| NOLA, front futures | 425.25 | 436.75 | 380.25 | +11.8% | $/st, FOB barge; year ago = Nov 2025 average |
| NOLA, March futures | 445.00 | 460.00 | n/a | n/a | $/st, CBOT US Gulf contract |
| Corn Belt wholesale | n/a | 505.00 | 450.63 | n/a | $/st; Sep 2026 and Nov 2025 averages |
| Illinois distributor ask | 770.00 | n/a | n/a | n/a | $/ton FOB, range 650–890 |
| National retail | 669 | 674 | 598 | +11.9% | $/ton delivered |
| Retail, $/lb N | 0.73 | 0.73 | 0.65 | +12.3% | 46% N |
| Retail minus front futures | 243.75* | 237.25* | 217.75* | +$26* | $/ton |
Sources: Farmbucks/CBOT, Nov 5, 2026 [1]; Farmbucks/CBOT, Oct 21, 2026, via TRZ-0302 [2]; USDA AMS/Green Markets monthly averages, retrieved Nov 6, 2026 [3]; USDA AMS Illinois Production Cost Report, Oct 30, 2026 [7]; DTN/Progressive Farmer, Nov 4, 2026 (survey Oct 26–30), Oct 21, 2026 (Oct 12–16) and Nov 5, 2025 (Oct 27–31, 2025) [6][8][9]. *Crop Root Zone calculations. USDA has not yet posted an October 2026 average. The Corn Belt September figure is the latest available.
Two things stand out. The first is that retail barely moved while the barge fell: DTN's urea price dropped $5 between the mid-October and end-October surveys while the front of the board fell $11.50 [6][8]. The second is that the retail-to-barge gap is wider than a year ago. At $243.75 a ton it is $26 above last fall's $217.75, by our calculation. That is a dealer margin and freight question as much as a market one, and it shows up in USDA's Illinois survey too, where distributor asks for urea ran from $650 to $890 a ton, unchanged at a $770 average [7].
Ground Truth: The barge has given back about $11 since mid-October and retail has given back $5. That lag is normal in a falling market, and it is the first thing an unbooked buyer should use: a dealer quote today is still partly priced off the September barge, which averaged $451.88 [3]. Ask for a quote tied to the current board, not the retail average.
2. The world: India pays less than last year, the US Gulf pays more
What's new: A year ago the US Gulf and India paid almost the same price for urea. India's IPL tender of November 20, 2025 drew lowest offers of $418.40 a tonne CFR east coast and $419.90 west coast, and bought 1.56 million tonnes (Argus Media, Nov 28, 2025) [10]. The NOLA barge averaged $419.15 a tonne that month, by our conversion [3]. This fall, IPL's October 7 tender drew a lowest offer of $352.10 CFR east coast and secured about 410,000 tonnes against 1.7 million sought, after Chinese producers declined the implied netbacks [4][11]. At the November futures price, NOLA is about $117 a tonne above that tender.
Evidence: The benchmarks below are the latest public quotes we could find, all in the two weeks to October 30.
| Granular or prilled urea, late Oct 2026 | $/t | Basis | |
|---|---|---|---|
| Egypt | 535 | FOB, granular | ██████████ |
| Brazil, non-Chinese | 480–485 | CFR | █████████░ |
| US NOLA barge, November | 475 | CFR-equivalent barge | █████████░ |
| Thailand | 450 | CFR | ████████░░ |
| Middle East | 440 | FOB, granular | ████████░░ |
| China, granular | 440 | FOB | ████████░░ |
| India, Oct 7 tender, lowest offer | 352.10 | CFR east coast | ███████░░░ |
| China, prilled netback | 345–350 | FOB, implied | ██████░░░░ |
Sources: Australian Fertilizer Corporation, Oct 26 and Nov 2, 2026 [4][5]; Fertilizer Daily citing IPL tender results, Oct 29, 2026 [11]. Bars scale $535 to ten blocks, using range midpoints. Prices are on different bases and are shown for scale, not as arbitrage.
The gap between the top and bottom of that column is the story of this fall. Four things hold the Atlantic granular market up while the eastern prilled market sags.
Hormuz. Fertilizer shipments through the Strait fell to zero in September and stayed there through October, on tracking data cited by Fertilizer Daily; S&P Global estimated on October 19 that about 29% of world urea trade normally moves through it (Fertilizer Daily, Oct 29, 2026) [12]. Australian Fertilizer Corporation names Oman's OMIFCO and limited Saudi volumes loaded at Yanbu on the Red Sea as among the few Middle East exports still moving [5]. That is why a $440 Middle East FOB print does not translate into cheap tonnes for New Orleans: there are few cargoes behind it.
Europe. Egypt climbed from a $480 to $530 range in mid-October to about $535 FOB, with Europe the likely destination [4][5]. Nobel Trading now puts northwest European production cost near $740 a tonne after Dutch gas passed €90/MWh on October 20 (Fertilizer Daily, Oct 29, 2026) [13]. TRZ-0302 estimated an Egyptian cargo would need NOLA at about $481 to $494 a short ton to land competitively at the Gulf [2]. The board is $56 to $69 below that band.
Trinidad. Nutrien announced the indefinite shutdown of its Trinidad nitrogen operations on October 5, 2026 (Nutrien Q3 2026 release, Nov 4, 2026) [14]. The plant has made no product since a controlled shutdown in October 2025, when Nutrien put its Trinidad urea sales at about 55,000 tonnes a month (Nutrien, Oct 21, 2025) [15]. The tonnes are not newly lost for spring 2027; they were already gone last spring. What changed is that a Caribbean source a few days' sail from New Orleans is now off the map for planning purposes.
China. China is selling, but mostly prilled urea and mostly east. Exports were about 1.43 million tonnes in January to August after quotas reopened in late May, and SunSirs reported the 2026 quota expanded to 5 to 6 million tonnes by the end of September (SunSirs, Sep 30, 2026) [16]. We found no official Chinese confirmation of that quota, and reports of its size conflict. Profercy noted in September that most Chinese output is prilled with few outlets beyond India (Profercy, Sep 23, 2026) [17]. Chinese granular was quoted at $440 FOB in late October, and Chinese cargoes into Brazil at $470 to $475 CFR [4][5].
$117/t
The premium of the November US Gulf urea contract over India's October 7 tender price. A year ago the two were within a dollar. (Crop Root Zone calculation from Farmbucks/CBOT, Nov 5, 2026, IPL tender results via Fertilizer Daily, Oct 29, 2026, Argus, Nov 28, 2025, and USDA AMS)
Ground Truth: India is still the floor of the world urea market, but this fall the US Gulf is not standing on it. NOLA is priced against the Atlantic granular market (Brazil at $480, Egypt at $535, Middle East tonnes that cannot get out), not against Chinese prilled at $350. That means a cheap Indian tender would help US spring prices less than it did a year ago. It would have to pull Chinese granular west, toward Brazil and the Gulf, to matter here.
3. Is the spring price being set now? What the curve says
What's new: The March 2027 contract at $445 sits $19.75 above the November contract [1]. That is the whole winter gain the board is pricing for the barge.
Evidence: USDA's monthly averages show what the barge actually did between November and March in the last three winters [3].
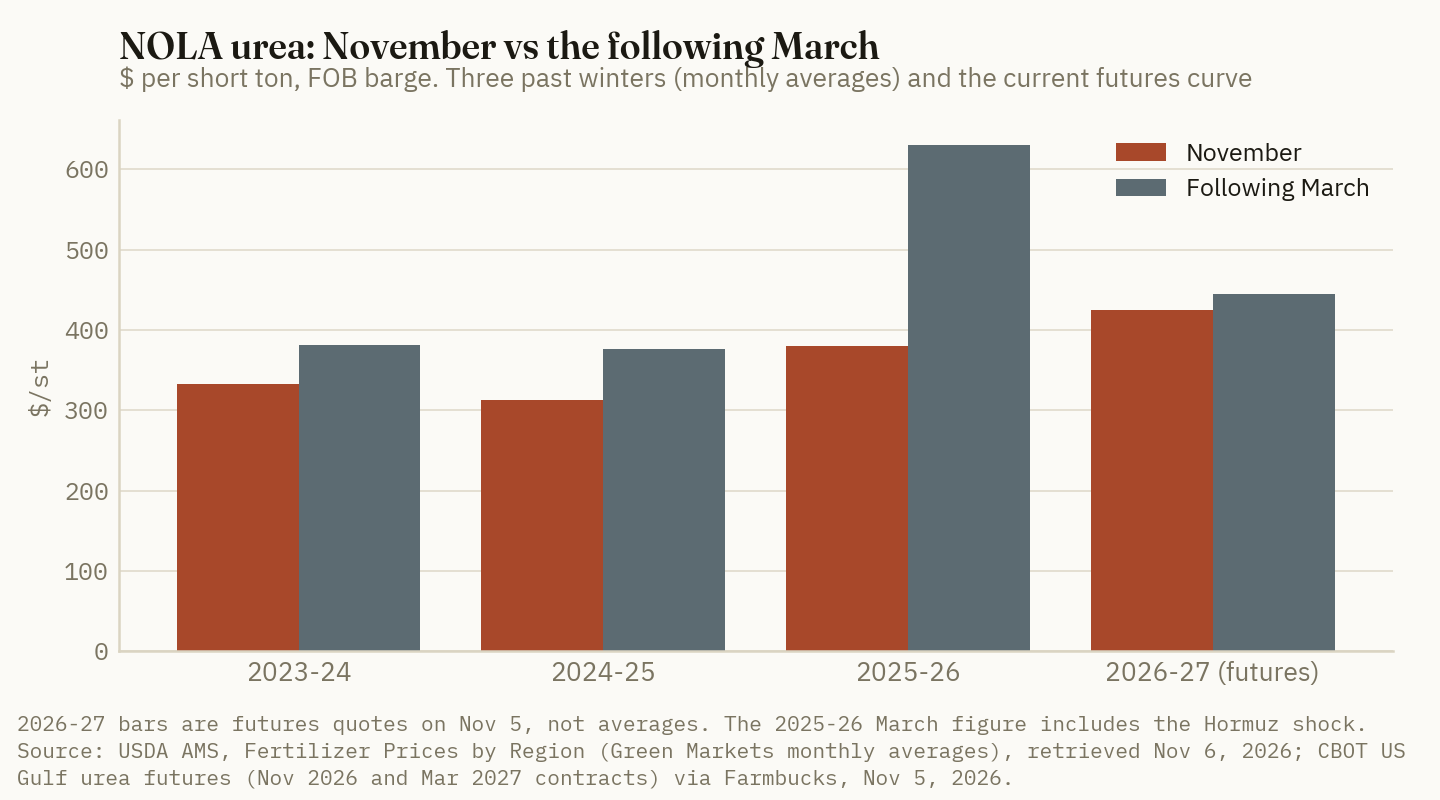
| Winter | November avg, $/st | February avg | March avg | Nov to Mar | Driver |
|---|---|---|---|---|---|
| 2023–24 | 333.13 | 350.50 | 381.20 | +48.08 | Seasonal |
| 2024–25 | 312.95 | 400.50 | 377.00 | +64.05 | Seasonal |
| 2025–26 | 380.25 | 458.38 | 630.00 | +249.75 | Seasonal to Feb, Hormuz in Mar |
| 2026–27, futures | 425.25 | 441.00 | 445.00 | +19.75 | Board, Nov 5 |
Sources: USDA AMS/Green Markets monthly averages, retrieved Nov 6, 2026 [3]; Farmbucks/CBOT, Nov 5, 2026 [1]. Changes are Crop Root Zone calculations. USDA's January 2026 row for every region repeats its July 2025 row exactly ($425.375 at NOLA), which looks like a data error, so we do not use January figures.
Three winters is a small sample, and futures are not a forecast. But the comparison is clear. In the two winters without a supply shock, the barge rose $48 and $64 by March, and last winter it was already up $78 by February, before Hormuz closed. The board is pricing about two-fifths of the smaller of those gains.
There are reasons the curve could be right. The US went into this fall with heavy imports: US urea imports more than doubled in July, as TRZ-0278 reported [18]. Brazil's season is ending with imports estimated at 20% to 30% below normal, which frees granular tonnes [5]. India is expected back with a tender of 2 to 2.5 million tonnes at a lowest price near $370 to $375 CFR, and Chinese inventories are large [4][5]. And the new MIAX physically settled NOLA urea contract, live from the October 19 trade date, gives sellers another place to hedge winter tonnes (Fertilizer Daily, Oct 21, 2026) [19].
There are also reasons it could be wrong. Nutrien said on November 4 that it expects global nitrogen fundamentals "to remain tight heading into 2027" [14]. Hormuz is not open. Europe's gas price sets Egypt's, and Egypt is still rising.
Ground Truth: The spring 2027 urea price is not being set this week; India's next tender and the Strait of Hormuz will do more to set it than anything on the US board today. What is being set now is the price of insurance. With only $20 of carry in the curve, locking March at $445 costs little against a normal winter and a great deal less than a repeat of last spring. That is the asymmetry a buyer should act on, not a view on direction.
4. What an unbooked grower faces at retail
What's new: Retail urea is $669 a ton, or $0.73 a pound of nitrogen, against $0.65 a year ago [6][9]. At that price, 150 pounds of nitrogen as urea costs about $109 an acre.
Evidence: The scenarios below hold the current $243.75 gap between DTN retail and the November futures fixed, and apply it to five spring barge levels. They are Crop Root Zone estimates, not forecasts. Retail usually moves less than the barge, so they overstate the move in both directions.
| Spring barge scenario | NOLA, $/st | Implied retail, $/ton | $/lb N | $/acre at 150 lb N | vs today |
|---|---|---|---|---|---|
| India-parity slide (L1 $375 CFR) | 340.19* | 583.94* | 0.635* | 95.21* | −13.87* |
| Today | 425.25 | 669.00 | 0.727 | 109.08* | 0 |
| March futures, Nov 5 | 445.00 | 688.75* | 0.749* | 112.30* | +3.22* |
| Average non-shock winter (+$56) | 481.31* | 725.06* | 0.788* | 118.22* | +9.14* |
| Last winter to February (+$78) | 503.38* | 747.13* | 0.812* | 121.81* | +12.73* |
| Last April's retail peak | n/a | 847.00 | 0.92 | 138.10* | +29.02* |
Sources: Farmbucks/CBOT, Nov 5, 2026 [1]; USDA AMS/Green Markets [3]; DTN/Progressive Farmer, Nov 4, 2026 and Apr 15, 2026 [6][20]. *Crop Root Zone estimates. Implied retail = scenario barge + $243.75. 150 lb N = 0.163 ton of urea at 46% N. India parity converts $375 a tonne CFR to short tons with no freight adjustment, so it is a floor marker, not a landed price. Excludes application, stabilizer and finance cost.
The table frames the decision. The downside from today, if the barge drifts to Indian parity, is about $14 an acre. The upside in a normal winter is about $9 to $13. Last spring's shock was $29. The average non-shock winter lands the barge at about $481, which happens to sit at the bottom of the Egyptian landed-cost band in TRZ-0302 [2].
Last spring is a fair warning. DTN's survey for March 9 to 13, 2026, put retail urea at $674, about where it is now. Four weeks later it was $847, up 26%, at $0.92 a pound of N (DTN/Progressive Farmer, Apr 15, 2026) [20].
The product choice is still open for a buyer who has not booked. On this week's survey anhydrous is $0.61 a pound of N against urea's $0.73 [6], and TRZ-0326 found that a stabilized fall ammonia pass gives up its whole price advantage against spring urea once application, inhibitor and fall losses are counted [22]. Spring urea that goes on the surface also carries the cost of a urease inhibitor, which TRZ-0329 estimated at 5 to 8 cents a pound of N [21].
Ground Truth: For a grower with no urea booked, we would cover half to two-thirds of the tons he is certain to need now, priced off the board rather than the retail average, and hold the rest for India's tender. If India buys at $370 to $375 and China ships into it, the open tons gain. If the tender fails again or Hormuz stays shut into January, the booked tons have done their job. In our India-parity case, the cost of having booked is about $14 an acre; the cost of being wrong on the open half was $29 an acre last April.
5. What to watch, in order
- India's next tender. Expected at 2 to 2.5 million tonnes with a lowest price near $370 to $375 CFR [4][5]. A large award to Chinese prilled would ease the east; only Chinese granular moving west would ease NOLA.
- The March 2027 contract. At $445 it is the cheapest spring cover on offer. A move back toward the $460 it held on October 21 [2] would mean the board has started to price winter carry.
- Egypt versus NOLA. At $535 FOB Egypt is $66 a tonne over the November barge before freight [5][1], by our calculation. A widening gap means Europe is pulling Atlantic tonnes away from the Gulf.
- Hormuz. Any sustained reopening would release Middle East granular into Brazil and the Gulf at once. SunSirs called it the single largest tail risk for the fourth quarter [16].
- USDA's October Green Markets average. It is not yet posted. Below the September $451.88 [3] would confirm that the fall slide reached the monthly data.
References
- Farmbucks, Urea (US Gulf) Futures (CBOT UFV), contract-month quotes as of Nov 5, 2026, 3:37 pm CT (delayed CME data) — https://farmbucks.com/futures/fertilizer/urea-us-gulf
- Crop Root Zone, TRZ-0302, "Egyptian Urea Sold Near $505 a Tonne FOB in Mid-October, $24 Above the NOLA Barge…," Oct 22, 2026 (October and March futures as of Oct 21, 2026; Egyptian landed-cost band).
- USDA Agricultural Marketing Service, Fertilizer Prices by Region (agtransport.usda.gov, dataset 8bgf-5mdv), monthly averages derived from Green Markets; urea, US Gulf NOLA and Corn Belt, Jan 2023–Sep 2026, retrieved Nov 6, 2026 — https://agtransport.usda.gov/d/8bgf-5mdv
- Australian Fertilizer Corporation, "Weekly Update – Global Fertiliser Markets – w/e 23.10.2026," media release, Oct 26, 2026 — https://ausfertcorp.com/wp-content/uploads/2026/10/afc-media-release-weekly-update-20261023.pdf
- Australian Fertilizer Corporation, "Weekly Update – Global Fertiliser Markets – w/e 30.10.2026," media release, Nov 2, 2026 — https://ausfertcorp.com/wp-content/uploads/2026/11/afc-media-release-weekly-update-20261030.pdf
- DTN/Progressive Farmer, Russ Quinn, "UAN28 Continues to Lead Fertilizer Prices Higher in October's Final Week," DTN Retail Fertilizer Trends, Nov 4, 2026 (survey week Oct 26–30, 2026) — https://www.dtnpf.com/agriculture/web/ag/crops/article/2026/11/04/uan28-continues-lead-fertilizer-week
- USDA AMS, Illinois Production Cost Report (Bi-weekly), Oct 30, 2026 — https://www.ams.usda.gov/mnreports/ams_3195.pdf
- DTN/Progressive Farmer, "UAN32, UAN28 and Anhydrous Lead Fertilizer Prices Higher," Oct 21, 2026 (survey week Oct 12–16, 2026) — https://www.dtnpf.com/agriculture/web/ag/crops/article/2026/10/21/uan32-uan28-anhydrous-lead-prices
- DTN/Progressive Farmer, "Five Retail Fertilizer Prices Higher Compared to Last Month, Led by Anhydrous," Nov 5, 2025 (table week Oct 27–31, 2025) — https://www.dtnpf.com/agriculture/web/ag/crops/article/2025/11/05/five-retail-fertilizer-prices-higher
- Argus Media, "India's IPL confirms 1.56mn t of urea in tender: Update," Nov 28, 2025 — https://www.argusmedia.com/en/news-and-insights/latest-market-news/2759724-india-s-ipl-confirms-1.56mn-t-of-urea-in-tender-update
- Fertilizer Daily, Kim Clarksen, "Brazil urea price climbs to $488/t as India books just 410,000 t in key tender," Oct 29, 2026 (citing Nobel Trading and IPL tender results) — https://www.fertilizerdaily.com/20261029-brazil-urea-price-october-2026-nobel/
- Fertilizer Daily, "Hormuz fertilizer shipments stay at zero for 2nd month as critical sulfur squeeze bites," Oct 29, 2026 (citing S&P Global, Oct 19, 2026, and WTO-AXSMarine tracking) — https://www.fertilizerdaily.com/20261029-hormuz-fertilizer-shipments-zero-october/
- Fertilizer Daily, as [11], for Brazil CFR ranges and the Nobel Trading estimate of northwest European production cost.
- Nutrien Ltd., "Nutrien Reports Third Quarter 2026 Results," news release, Form 6-K Exhibit 99.1, Nov 4, 2026 — https://www.sec.gov/Archives/edgar/data/0001725964/000119312526447554/d139721dex991.htm
- Nutrien Ltd., "Nutrien Commences a Controlled Shut Down of Its Trinidad Nitrogen Operations," Oct 21, 2025 — https://www.nutrien.com/news/press-releases/nutrien-commences-a-controlled-shut-down-of-its-trinidad-nitrogen-operations-1735
- SunSirs, "Review of the Global Urea Market (First Three Quarters of 2026) and Outlook for the Fourth Quarter," Sep 30, 2026 — https://www.sunsirs.com/commodity-news/petail-36560.html
- Profercy, Chris Yearsley, "Urea: Chinese prilled availability to be tested as India returns with fresh tender," Sep 23, 2026 — https://www.profercy.com/insights/urea-chinese-prilled-availability-to-be-tested-as-india-returns-with-fresh-tender
- Crop Root Zone, TRZ-0278, "US Urea Imports More Than Doubled in July…," Oct 14, 2026.
- Fertilizer Daily, "MIAX fertilizer futures go live with 4 physically settled NOLA contracts," Oct 21, 2026 — https://www.fertilizerdaily.com/20261021-miax-fertilizer-futures-go-live-nola/
- DTN/Progressive Farmer, "5 Fertilizers Significantly More Expensive" (survey week Apr 6–10, 2026; table week Mar 9–13, 2026), Apr 15, 2026 — https://www.dtnpf.com/agriculture/web/AG/crops/article/2026/04/15/5-fertilizers-significantly-cost-ago
- Crop Root Zone, TRZ-0329, "A Urease Inhibitor Adds About 6.5 Cents to a 73-Cent Pound of Urea Nitrogen…," Nov 2, 2026.
- Crop Root Zone, TRZ-0326, "Fall Anhydrous Is 20 Cents a Pound of N Under Spring UAN28…," Nov 2, 2026.
Disclosures
Crop Root Zone is an independent publication. Nothing here is investment advice. Market calls, where included, reflect the editors' own read and are not a recommendation to buy or sell any security.
Plants Got Less for UAN This Summer Than Last. Farmers Paid More. What the Third-Quarter Filings Say About the Fall Nitrogen Dollar.
Third-quarter filings put UAN at the plant gate at $309 to $316 a ton, down 5% to 11% on the year, while DTN's retail UAN28 averaged $454, up 8%. On a $991 ton of retail anhydrous, the natural gas inside it cost about $102. The plant gate was $637, and $354 sat between the gate and the farm, up from about $240 a year ago. CF Industries and Nutrien report after today's close, so this rests on CVR Partners, LSB Industries and the two larger producers' second-quarter filings.
The first two North American nitrogen producers to report the third quarter were paid less for UAN than a year ago. CVR Partners realized $309 a ton at the gate, down 11% from $348 (CVR Partners, Nov 3, 2026) [1]. LSB Industries' net-back price was $316, down 5% from $333 (LSB Industries, Oct 28, 2026) [2]. Farmers did not see that decline. Across DTN's July, August and September surveys, retail UAN28 averaged about $454 a ton, roughly 8% above the same three weeks of 2025 [3][4][5]. Ammonia rose at both ends, with CVR's gate price up 20% and retail anhydrous up about 29%. This piece follows the third-quarter nitrogen ton from the gas meter to the retail invoice, shows how much of the farmer's price is plant and how much is channel, and identifies what CF Industries' and Nutrien's results will test when they are released after this afternoon's close [6][7].
1. What the plants were paid in the third quarter
What's new: Two producers have reported. CVR Partners' net sales fell to $146.2 million from $163.5 million. A 41-day planned turnaround at East Dubuque left a $10.7 million net loss for the quarter [1]. LSB's net sales rose to $158.6 million from $155.4 million, and adjusted EBITDA rose to $62.3 million from $40.1 million [2]. CF Industries and Nutrien both report after the market closes today, November 4 [6][7]. Their latest published figures are for the second quarter, and they appear in Section 4 as such.
Evidence: Producer realized prices for the quarter, alongside the market indicators the two companies published:
| Q3, $/short ton unless noted | Q3 2026 | Q3 2025 | YoY | Basis |
|---|---|---|---|---|
| CVR Partners ammonia | 637 | 531 | +20% | Realized, plant gate |
| LSB ammonia | 528 | 400 | +32% | Net-back (sales less freight) |
| CVR Partners UAN | 309 | 348 | −11% | Realized, plant gate |
| LSB UAN | 316 | 333 | −5% | Net-back |
| LSB AN and nitric acid | 365 | 307 | +19% | Net-back |
| Corn Belt ammonia indicator | 746 | 657 | +14% | Wholesale market, as CVR reports it |
| Southern Plains ammonia indicator | 690 | 618 | +12% | Wholesale market, as CVR reports it |
| Corn Belt UAN indicator | 361 | 399 | −10% | Wholesale market, as CVR reports it |
| NOLA UAN | 330 | 336 | −2% | Barge, as LSB reports it |
| Tampa ammonia | 622 | 491 | +27% | Contract; conventionally quoted per metric ton CFR |
Source: CVR Partners, Q3 2026 earnings release, Nov 3, 2026 [1]; LSB Industries, Q3 2026 earnings release, Oct 28, 2026 [2]. Neither release states the UAN grade behind its price or indicator.
Every UAN measure in the table fell on the year, by 2% to 11%. Every ammonia measure rose, by 12% to 32%. Volume tells the same story as price. LSB's UAN sales fell 59%, to 55,510 tons, because of a turnaround at Pryor and a decision to shift production from UAN to ammonium nitrate for industrial demand [2]. CVR's UAN volume was flat at 327,000 tons, while its ammonia utilization fell to 80% from 95% [1].
Timing explains part of the UAN weakness. Third-quarter UAN is largely summer-fill tonnage, priced at the seasonal low after spring. CVR's management said the market firmed through the quarter after the summer reset, and its chief executive said prices have "steadily increased since the summer fill programs" [1][8]. A July-priced ton delivered in September is booked at its July price.
Ground Truth: For UAN, the third-quarter gate price measures the summer reset more than current value. It does not show what a fall or spring ton costs the plant to replace. A grower who reads "producer UAN prices down 11%" as a reason to wait for retail to follow is reading a price the market has already moved past. The better indicator is the one CVR does not give: what new-season UAN was posted at in October.
2. What farmers paid in the same quarter
What's new: DTN's monthly retail snapshots for the quarter covered July 6–10, August 3–7 and September 21–25. Retail anhydrous ran from $963 to $1,032, and retail UAN28 fell from $493 to $423 across the quarter [3][4][5]. Every product was above its year-earlier level in the September survey [5].
Evidence: The three surveys averaged, set against the same weeks of 2025:
| Retail, delivered, $/ton | Jul 6–10 | Aug 3–7 | Sep 21–25 | Q3 2026 avg | Q3 2025 avg | YoY | $/lb N, Q3 2026 |
|---|---|---|---|---|---|---|---|
| Anhydrous | 1,032 | 963 | 977 | 991* | 771* | +29%* | 0.61* |
| UAN28 | 493 | 446 | 423 | 454* | 419* | +8%* | 0.81* |
| UAN32 | 529 | 458 | 479 | 489* | 491* | 0%* | 0.76* |
| Urea | 714 | 678 | 675 | 689* | 641* | +7%* | 0.75* |
Source: DTN/Progressive Farmer retail surveys published Jul 15, Aug 12 and Sep 30, 2026 [3][4][5]. Basis: national average retail. *Crop Root Zone calculation. Averages are unweighted means of the three survey weeks. Year-ago values are DTN's stated 2025 prices where printed (July, September) and are derived from the stated percentage change for August, so they carry rounding. Per-pound N figures average DTN's printed weekly values.
UAN32 at retail was flat on the year, and UAN28 rose 8%. At the plant, UAN fell 5% to 11%. On the most direct comparison, retail UAN28 minus CVR's gate price, the gap was about $71 a ton in the third quarter of 2025 and about $145 in the third quarter of 2026.
$145 a ton
Average Q3 2026 retail UAN28 ($454) less CVR Partners' realized UAN gate price ($309). A year earlier the same gap was about $71. (Crop Root Zone calculation from DTN, Jul 15–Sep 30, 2026, and CVR Partners, Nov 3, 2026)
The gap needs two qualifications before it is used. First, the grades may differ. CVR does not state the nitrogen content of its UAN price. If its tons are mostly UAN32, the like-for-like gap against retail UAN32 is $180, up from $143. Second, DTN's average is not volume-weighted. July carries the same weight as September in the average, although few tons of UAN move at retail in July. Neither qualification changes the direction of the change: the producer's price fell while the retail price did not.
3. Where the farmer's dollar goes, from gas meter to invoice
What's new: With third-quarter gas costs and gate prices published, the farmer's price can be divided into four parts. The parts are the gas inside the product, the rest of the plant's cost and margin, the step from the gate to the regional wholesale market, and the step from wholesale to retail. CVR's East Dubuque plant paid $3.09 per MMBtu for natural gas in the quarter, and LSB paid $2.93. The NYMEX average was $2.87 [1][2].
Evidence: We use the USDA Economic Research Service rule of about 33 MMBtu of natural gas per ton of ammonia (USDA ERS, Aug 2007) [9]. On that basis, the gas in a ton of ammonia cost about $102 at CVR's third-quarter price and $97 at LSB's. UAN carries less ammonia per ton. UAN28 holds about 0.34 tons of ammonia equivalent and UAN32 about 0.39, which puts their gas at roughly $35 and $40 a ton. These figures are an estimate. The ERS rule is old, modern plants run somewhat leaner, and the UAN figures count only the ammonia feedstock, not the energy used in nitric acid and solution steps.
Anhydrous, Q3 2026, on DTN's $991 average:
| Component of retail anhydrous | $/ton | Share | |
|---|---|---|---|
| Natural gas in the ton, at $3.09 | 102* | 10%* | ██░░░░░░░░ |
| Rest of plant cost and producer margin (gate $637 less gas) | 535* | 54%* | ██████████ |
| Gate to Corn Belt wholesale ($746 less $637) | 109* | 11%* | ██░░░░░░░░ |
| Corn Belt wholesale to retail ($991 less $746) | 245* | 25%* | █████░░░░░ |
| Retail, delivered | 991* | 100% |
Source: CVR Partners, Nov 3, 2026 [1]; DTN, Jul 15–Sep 30, 2026 [3][4][5]; USDA ERS, WRS-0702, Aug 2007 [9]. *Crop Root Zone estimates. Bars scale to $535 at ten blocks. The gas line is an estimate, as stated above. The Corn Belt indicator is a wholesale market average, not a price any one retailer paid. Retail includes storage, the nurse tank, delivery and credit, and DTN's survey does not separate them.
UAN28, Q3 2026, on DTN's $454 average:
| Component of retail UAN28 | $/ton | Share | |
|---|---|---|---|
| Natural gas in the ton, ammonia content only | 35* | 8%* | █░░░░░░░░░ |
| Rest of plant cost and producer margin (gate $309 less gas) | 274* | 60%* | ██████████ |
| Gate to Corn Belt wholesale ($361 less $309) | 52* | 11%* | ██░░░░░░░░ |
| Corn Belt wholesale to retail ($454 less $361) | 93* | 20%* | ███░░░░░░░ |
| Retail, delivered | 454* | 100% |
Source: as above. *Crop Root Zone estimates. Bars scale to $274 at ten blocks. Neither CVR's realized UAN price nor its Corn Belt UAN indicator states a grade. If either is weighted toward UAN32, the UAN28 channel lines here are understated.
Two results follow from these tables. Natural gas is a small part of what a farmer pays for nitrogen at a US gas price near $3. It came to about six cents a pound of nitrogen in anhydrous, out of 61 at retail. Most of the farmer's price is what the plant charges above its feedstock and what the channel charges above the plant.
The channel's share also grew. A year earlier, the same arithmetic puts retail anhydrous $114 above the Corn Belt indicator ($771 less $657) and $240 above CVR's gate ($771 less $531). This year the figures are $245 and $354. For UAN28, the gap between retail and the Corn Belt indicator went from about $20 to $93 [1][3][4][5].
Ground Truth: At the third-quarter numbers, the farmer's fall nitrogen price was paying mostly for the distance from the plant, not for gas. The step from Corn Belt wholesale to retail anhydrous more than doubled on the year. At least part of that is retailers pricing replacement tons in a market that was tightening as fall approached. CVR's management described Corn Belt terminal ammonia as short and at the season's highest prices [8]. Part of it is the cost of holding a product whose wholesale price rose about $90 a ton in a year. But a retail spread that widens by $130 when gas costs fall is a figure a buyer should take into a negotiation. The plant's gas cost is no reason the retail quote must stay high.
4. What the producers keep
What's new: The third quarter does not provide clean producer margins. CVR's quarter was affected by $26.8 million of turnaround expense against $1.2 million a year earlier, and direct operating expenses rose to $89.5 million from $57.7 million [1]. LSB's gross profit rose to $43.1 million from $25.5 million, and its gross margin went from 16.4% to 27.2% (LSB Industries, Form 10-Q, Q3 2026) [10]. The best per-ton margin disclosures for the two largest North American producers remain their second-quarter filings, until this evening's releases.
Evidence:
| Producer, period | Product | Realized, $/ton | Gross margin, $/ton | Margin share | Gas, $/MMBtu | |
|---|---|---|---|---|---|---|
| CF Industries, Q2 2026 | Granular urea | 593 | 373 | 63%* | 3.37 | ██████████ |
| CF Industries, Q2 2026 | UAN | 441 | 252 | 57%* | 3.37 | ███████░░░ |
| CF Industries, Q2 2026 | Ammonia | 677 | 265 | 39%* | 3.37 | ███████░░░ |
| Nutrien, Q2 2026 | Nitrogen average, manufactured | 452/tonne | 236/tonne | 52%* | 2.10 | ██████░░░░ |
| LSB Industries, Q3 2026 | All products, blended | — | 130* | 27% | 2.93 | ███░░░░░░░ |
| CVR Partners, Q3 2026 | All products | — | Net loss in turnaround quarter | — | 3.09 | ░░░░░░░░░░ |
Source: CF Industries, Q2 2026 earnings release, Aug 5, 2026 [11]; Nutrien, Q2 2026 earnings release, Aug 5, 2026 [12]; LSB Industries, Q3 2026 Form 10-Q and earnings release [10][2]; CVR Partners, Nov 3, 2026 [1]. *Crop Root Zone calculation. LSB's per-ton figure is gross profit divided by total tons sold, including industrial products. Nutrien reports per metric tonne. Bars scale to $373 at ten blocks. Gross margin includes depreciation, so cash margins are higher. Nutrien's gross margin before D&A was $292 a tonne [12].
In the second quarter, CF Industries earned $252 a ton of gross margin on UAN, and its gas cost was $3.37. At the 33-MMBtu rule, and treating that ton as UAN32, the gas in it was about $43 [9][11]. These ratios are from the second quarter. They come before the summer reset and include volumes priced after the Middle East conflict lifted global benchmarks, as Nutrien noted [12]. They are not a third-quarter margin. They indicate the scale: when urea and UAN were priced from global benchmarks while US gas stayed near $3, North American plants kept more than half their realized price as gross margin.
For comparison, our August piece on CF's long-run planning deck noted that most of the increase in its mid-cycle urea price reflected the cost of building new capacity, not of operating existing plants (TRZ-0077, Aug 10, 2026) [13]. The second-quarter margins show the operating side. A US plant running on $3 gas earns well above its running cost when global prices are set by higher-cost producers elsewhere.
Ground Truth: The producer margin and the retail spread have the same cause, and a farmer pays both. Global benchmarks set the plant's price, and the plant's gas cost does not. The retailer then prices against replacement cost in a tight fall. Low US gas therefore reaches the farmer mostly as producer profit, not as a lower invoice. A grower looking for relief in nitrogen prices should look to global benchmarks: Chinese urea export policy, Indian tenders and Tampa ammonia. Henry Hub matters much less.
5. What tonight's results will test, and what to watch
What's new: Since the quarter closed, the market has continued to rise. Retail anhydrous was $987 and UAN28 $447 in the October 19–23 survey (DTN, Oct 28, 2026) [14]. The November Tampa ammonia contract was reported at $645 a tonne CFR, up $95 (Australian Fertilizer Corporation via HortiDaily, Nov 2, 2026) [15]. CVR said it held about $43 million in customer prepayments at quarter end and was booking fourth-quarter and early-2027 business at what it called "attractive pricing" [8].
Evidence: Retail UAN28 in late October was $7 below its third-quarter average, while the summer-fill UAN that depressed the producers' third-quarter gate prices is being replaced by fall tons sold at higher prices. If the producers' fourth-quarter realized prices rise and retail stays near current levels, the spread in Section 3 narrows by the amount of the increase. That would show the third-quarter spread was a timing gap. If producer prices rise and retail rises with them, the wider spread is persisting.
| What to read tonight and next | Why it matters | Where |
|---|---|---|
| CF Industries' Q3 ammonia, UAN and urea average selling prices and per-ton gross margin | The largest North American producer's realized prices for the same quarter. A UAN price near CVR's $309 would confirm the summer reset across the industry | CF release, after close Nov 4 [6] |
| Nutrien's Q3 nitrogen net selling prices and gross margin per tonne | Covers Canadian gas, and Q2 gas was $2.10. Tests whether a lower gas cost shows up at all in price | Nutrien release, after close Nov 4 [7] |
| CF's and Nutrien's comments on Q4 order books and fill | Indicates how much of the fall ton was priced before the October and November increases | Calls Nov 5 [6][7] |
| DTN's first November survey | Whether the Tampa increase has reached retail anhydrous, now $987 | DTN, weekly [14] |
| Corn Belt ammonia and UAN indicators in the producers' Q4 releases | Allows the channel-spread arithmetic in Section 3 to be repeated with fall tonnage | February 2027 releases |
Source: release dates from CF Industries, Oct 7, 2026 [6], and Nutrien [7]; other items as cited.
One limit applies to everything above. The third-quarter producer figures cover two of the smaller US producers. CVR's Coffeyville plant uses petroleum coke, not natural gas, so its gas price applies only to East Dubuque [1]. LSB's volumes were reduced by a turnaround and a shift to industrial product [2]. The direction is consistent across both companies and the published market indicators, with UAN down and ammonia up at the producer level. The magnitudes may change once CF and Nutrien report.
References
- CVR Partners, LP, "CVR Partners Reports Third Quarter 2026 Results," Exhibit 99.1 to Form 8-K, Nov 3, 2026. https://www.sec.gov/Archives/edgar/data/0001425292/000119312526444439/d162480dex991.htm
- LSB Industries, Inc., "LSB Industries, Inc. Reports Operating Results for the 2026 Third Quarter," Exhibit 99.1 to Form 8-K, Oct 28, 2026. https://www.sec.gov/Archives/edgar/data/0000060714/000119312526436180/lxu-ex99_1.htm
- DTN/Progressive Farmer, DTN Retail Fertilizer Trends, Jul 15, 2026 (survey Jul 6–10, 2026). https://www.dtnpf.com/agriculture/web/ag/crops/article/2026/07/15/uan-fertilizers-lead-nutrient-prices
- DTN/Progressive Farmer, DTN Retail Fertilizer Trends, Aug 12, 2026 (survey Aug 3–7, 2026). https://www.dtnpf.com/agriculture/web/ag/crops/article/2026/08/12/fertilizers-start-august-mixed-5-led
- DTN/Progressive Farmer, DTN Retail Fertilizer Trends, Sep 30, 2026 (survey Sep 21–25, 2026). https://www.dtnpf.com/agriculture/web/ag/crops/article/2026/09/30/anhydrous-leads-fertilizer-prices-25
- CF Industries Holdings, Inc., "CF Industries Holdings, Inc. Declares Quarterly Dividend and Confirms Dates for Third Quarter 2026 Results and Conference Call," Oct 7, 2026 (results after close Nov 4; call Nov 5). https://finviz.com/news/400084/cf-industries-holdings-inc-declares-quarterly-dividend-and-confirms-dates-for-third-quarter-2026-results-and-conference-call
- Nutrien Ltd., "Nutrien Announces Release Dates for Third Quarter 2026 Results and Conference Call," via Investing News Network, 2026 (results after close Nov 4; call Nov 5). https://investingnews.com/nutrien-announces-release-dates-for-third-quarter-2026-results-and-conference-call/
- The Motley Fool, "CVR Partners (UAN) Q3 2026 Earnings Call Transcript," Nov 3, 2026. https://www.fool.com/earnings/call-transcripts/2026/11/03/cvr-partners-uan-q3-2026-earnings-call-transcript/
- W. Huang, "Impact of Rising Natural Gas Prices on U.S. Ammonia Supply," USDA Economic Research Service, WRS-0702, Aug 2007 (about 33 MMBtu of natural gas per ton of ammonia). https://www.ers.usda.gov/webdocs/outlooks/40459/11717_wrs0702_1_.pdf
- LSB Industries, Inc., Form 10-Q for the quarter ended Sep 30, 2026. https://www.sec.gov/Archives/edgar/data/0000060714/000119312526437807/lxu-20260930.htm
- CF Industries Holdings, Inc., Q2 2026 earnings release, Exhibit 99.1 to Form 8-K, Aug 5, 2026. https://www.sec.gov/Archives/edgar/data/0001324404/000132440426000017/cf-08052026_ex991xearnings.htm
- Nutrien Ltd., Q2 2026 results, Exhibit 99.1 to Form 6-K, Aug 5, 2026. https://www.sec.gov/Archives/edgar/data/0001725964/000119312526335517/d129364dex991.htm
- Crop Root Zone, TRZ-0077, "Your Anhydrous Fell 7% in a Month. The Producer Just Raised Its Long-Run Price by 8.5%.," Aug 10, 2026.
- DTN/Progressive Farmer, T. Neeley, "Fertilizer Prices Continue to Climb: UAN28 Posts 6% Increase in Latest DTN Survey," Oct 28, 2026 (survey Oct 19–23, 2026). https://www.dtnpf.com/agriculture/web/ag/crops/article/2026/10/28/fertilizer-prices-continue-climb-6
- HortiDaily, "Energy costs drive ammonia higher as weak demand pressures other fertilizer markets," Nov 2, 2026 (Australian Fertilizer Corporation commentary: November Tampa at $645/t CFR, up $95). https://www.hortidaily.com/article/9888212/energy-costs-drive-ammonia-higher-as-weak-demand-pressures-other-fertilizer-markets/
Disclosures
Crop Root Zone is an independent publication. Nothing here is investment advice. Market calls, where included, reflect the editors' own read and are not a recommendation to buy or sell any security.
Mosaic Got $838 a Tonne for DAP in the Third Quarter, Its Best Price of the Year, and Booked a Phosphate Gross Margin of Minus $105. Sulfur Explains Only Half of the Drop.
On our reconstruction from Mosaic's November 3 filing, the DAP stripping margin fell about $94 a tonne in a year, to roughly $409, while reported phosphate gross margin fell $197. The other half of the damage is the cost of running plants at 52%. Raw materials now take about 42% of a farm ton of DAP, against 22% a year ago, and the dealer-and-freight layer over the producer's price has narrowed to about $173 a tonne. Mosaic guides fourth-quarter DAP at $820–840 with margins lower again, and its $615 sulfur contract reaches cost of goods in the first quarter of 2027, worth about $37 a tonne.
The Mosaic Company filed its third-quarter 2026 results on November 3. Its Phosphates segment realized $838 a tonne for DAP, FOB plant, up from $773 in the second quarter and $714 a year earlier, and the top of the $820–840 range it guided in August (Mosaic, Nov 3, 2026) [1][3]. On that price the segment posted a gross margin of minus $105 per tonne of finished product, an operating loss of $194 million and adjusted EBITDA of $49 million, against $280 million a year earlier [1]. The company says why in one line: "higher raw material costs and lower volumes, somewhat offset by higher prices" [1]. Our earlier pieces covered the sulfur contracts and the retail spread as they happened (Crop Root Zone, TRZ-0164, TRZ-0246, TRZ-0270, TRZ-0286) [12][13][14][15]. This piece uses Mosaic's quarterly cost disclosure to split the damage into its parts: how much is the price-to-input spread, how much is the cost of idling plants, and what that leaves for a farm buying DAP and MAP this winter.
1. The quarter in Mosaic's own numbers
What's new: Mosaic's performance data, filed with the release, gives realized prices and raw-material costs for five straight quarters. Every input except conversion cost went up, and every volume line went down [2].
Evidence: Realized sulfur averaged $715 a long ton, up from $272 a year earlier. Ammonia averaged $619 a tonne, up from $455. Blended rock rose to $91 a tonne from $80 [2]. Production fell to 1.29 million tonnes from 1.68 million, and the operating rate fell to 52% from 68% [2]. The ammonia figure matches the public Tampa contract. The Tampa settlements for July, August and September were $670, $635 and $555 a tonne CFR, an average of $620 (Fertilizer Daily, relaying Australian Fertilizer Corporation, Sep 10, 2026) [6]. The sulfur figure sits $10 above the $705 third-quarter contract Mosaic disclosed in August (Mosaic Q2 2026 earnings call, Aug 5, 2026) [3].
| Mosaic Phosphates | Q3 2025 | Q4 2025 | Q1 2026 | Q2 2026 | Q3 2026 | Basis |
|---|---|---|---|---|---|---|
| DAP realized price | 714 | 686 | 668 | 773 | 838 | $/mt, FOB plant |
| Avg finished product price | 712 | 656 | 653 | 754 | 814 | $/mt |
| Ammonia, realized | 455 | 550 | 626 | 621 | 619 | $/mt |
| Sulfur, realized | 272 | 306 | 379 | 522 | 715 | $/long ton |
| Blended rock | 80 | 84 | 86 | 90 | 91 | $/mt of rock |
| Cash conversion cost | 131 | 112 | 124 | 129 | 117 | $/production tonne |
| Operating rate | 68% | 67% | 66% | 58% | 52% | % of capacity |
| Production | 1,678 | 1,666 | 1,641 | 1,433 | 1,289 | '000 t finished product |
| Gross margin | 92 | 17 | 2 | (4) | (105) | $/t finished product sold |
Source: The Mosaic Company, Q3 2026 performance data, Form 8-K Ex. 99.2, Nov 3, 2026 [2].
Two things in the volume lines matter. First, Mosaic sold 1.40 million tonnes while producing 1.29 million, so the quarter drew down inventory [2]. The release credits lower finished-goods inventory for the rise in operating cash flow, to $284 million from $229 million [1]. Second, the mix moved. DAP and MAP sales rose to 898,000 tonnes from 760,000, while performance products, Mosaic's premium blends, fell to 405,000 tonnes from 750,000 [2]. Mosaic sold more commodity product and less premium product at a time when every tonne cost more to make.
Sulfur use fell to 569,000 long tons from 772,000 a year earlier, and ammonia use to 198,000 tonnes from 255,000 [2]. Those cuts are larger than the cut in output. That is consistent with the company's description of the quarter: "We aligned phosphate production with the availability of affordable sulfur," in chief executive Bruce Bodine's words [1].
Ground Truth: The quarter shows that Mosaic now manages its phosphate output around sulfur cost, not DAP price. It ran at 52% in the quarter it got its best price of the year, and it plans more curtailment in the fourth quarter at the South Fort Meade and Miski Mayo mines [1]. For a US buyer, the domestic supply curve now depends on the Tampa sulfur contract. A lower contract is a reason to expect more US tonnes. It is not, by itself, a reason to expect a lower price.
2. The stripping margin, rebuilt: down $94, not down $197
What's new: Mosaic did not print a third-quarter stripping margin in its release. It reported $422 a tonne for the second quarter on its August call [3]. The inputs it did publish are enough to rebuild the third-quarter figure.
Evidence: The stripping margin is the realized DAP price minus the ammonia and sulfur that go into a tonne of it. We use 0.22 tonnes of ammonia and 0.41 long tons of sulfur per tonne of DAP. Both are engineering estimates: the ammonia ratio follows from DAP's 18% nitrogen content, and the sulfur ratio is close to the 0.405 metric tonnes of sulfur per tonne of DAP we derived in October (Crop Root Zone, TRZ-0246, Oct 1, 2026) [13]. At Mosaic's second-quarter prices of $773 DAP, $621 ammonia and $522 sulfur, those ratios give $422.36, within $1 of the $422 the chief financial officer reported [3]. The fit also implies that Mosaic's measure leaves out rock. We apply the same ratios to each quarter.
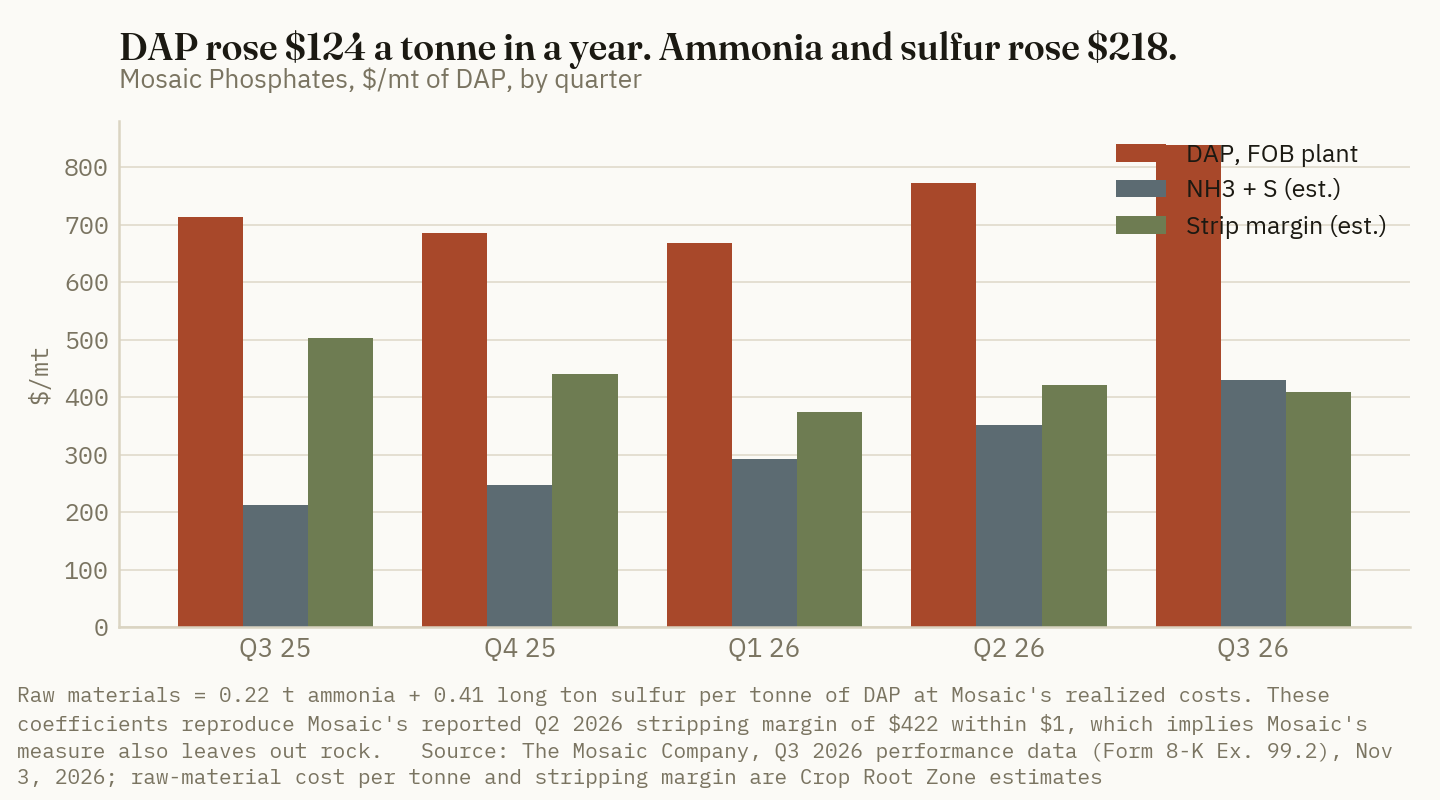
| Mosaic DAP, $/mt | Q3 2025 | Q2 2026 | Q3 2026 | Change in a year |
|---|---|---|---|---|
| Realized DAP, FOB plant | 714 | 773 | 838 | +124 |
| Ammonia, 0.22 t | 100* | 137* | 136* | +36 |
| Sulfur, 0.41 lt | 112* | 214* | 293* | +182 |
| Stripping margin | 502* | 422 | 409* | −94 |
| Rock, ~1.7 t at blended cost | 136* | 153* | 155* | +19 |
| Stripping margin after rock | 366* | 269* | 254* | −112 |
Source: The Mosaic Company, Form 8-K Ex. 99.2, Nov 3, 2026 [2]; Q2 2026 stripping margin as reported on the Aug 5, 2026 call [3]. *Crop Root Zone estimates from Mosaic's realized input costs. Rock use of about 1.7 tonnes per tonne of DAP is our assumption for illustration; actual use depends on ore grade and recovery and could run 1.5–1.9 tonnes.
On these numbers, the spread between DAP and its two purchased inputs narrowed by about $94 a tonne over the year. In August, the chief financial officer said the guided third-quarter price implied a stripping margin "well above historical averages" [3], and our estimate of about $409 is consistent with that. Sulfur did almost all the damage. Its share of a tonne of DAP rose about $182, against $36 for ammonia, which has been flat at about $620 for three quarters [2].
~$409/mt
Our estimate of Mosaic's third-quarter DAP stripping margin, down about $94 from a year earlier. Reported phosphate gross margin fell $197 over the same period. (Crop Root Zone estimate from The Mosaic Company, Form 8-K, Nov 3, 2026)
3. Where the other $100 a tonne went
What's new: If the spread fell $94 and the gross margin fell $197, about half the damage came from somewhere other than the price-to-input spread. Mosaic's cost lines show where.
Evidence: Idle, turnaround and unabsorbed fixed costs were $77 million in the quarter, against $42 million a year earlier [1]. Spread over 1.40 million tonnes sold, that is about $55 a tonne, against about $27 on 1.57 million tonnes a year ago [2]. Notable items, mainly environmental reserve adjustments, facility closure costs and restructuring, totaled $84 million [1]. Adjusted gross margin, which excludes some of them, was minus $95 a tonne [2]. Cash conversion cost moved the other way, to $117 per production tonne from $131, because idling Louisiana took a high-cost site out of the average [1][2].
The bridge below is our attribution of the $197 fall in per-tonne gross margin. It applies DAP raw-material ratios to all finished product, which understates the input cost of MAP and performance products. Treat each line as an estimate.
| Q3 2025 → Q3 2026, $/t finished product | Change | |
|---|---|---|
| Gross margin, Q3 2025 (reported) | +92 | |
| Higher average selling price | +102 | █████░░░░░ |
| Ammonia and sulfur, DAP basis | −218* | ██████████ |
| Rock, ~1.7 t at +$11/t | −19* | █░░░░░░░░░ |
| Idle, turnaround and unabsorbed fixed cost | −28* | █░░░░░░░░░ |
| Lower cash conversion cost | +14 | █░░░░░░░░░ |
| Residual: fixed cost and D&A on fewer tonnes, mix, notable items | −48* | ██░░░░░░░░ |
| Gross margin, Q3 2026 (reported) | −105 |
Source: The Mosaic Company, Form 8-K Ex. 99.1 and Ex. 99.2, Nov 3, 2026 [1][2]. *Crop Root Zone attribution. Bars scale $218 to ten blocks and show size, not sign.
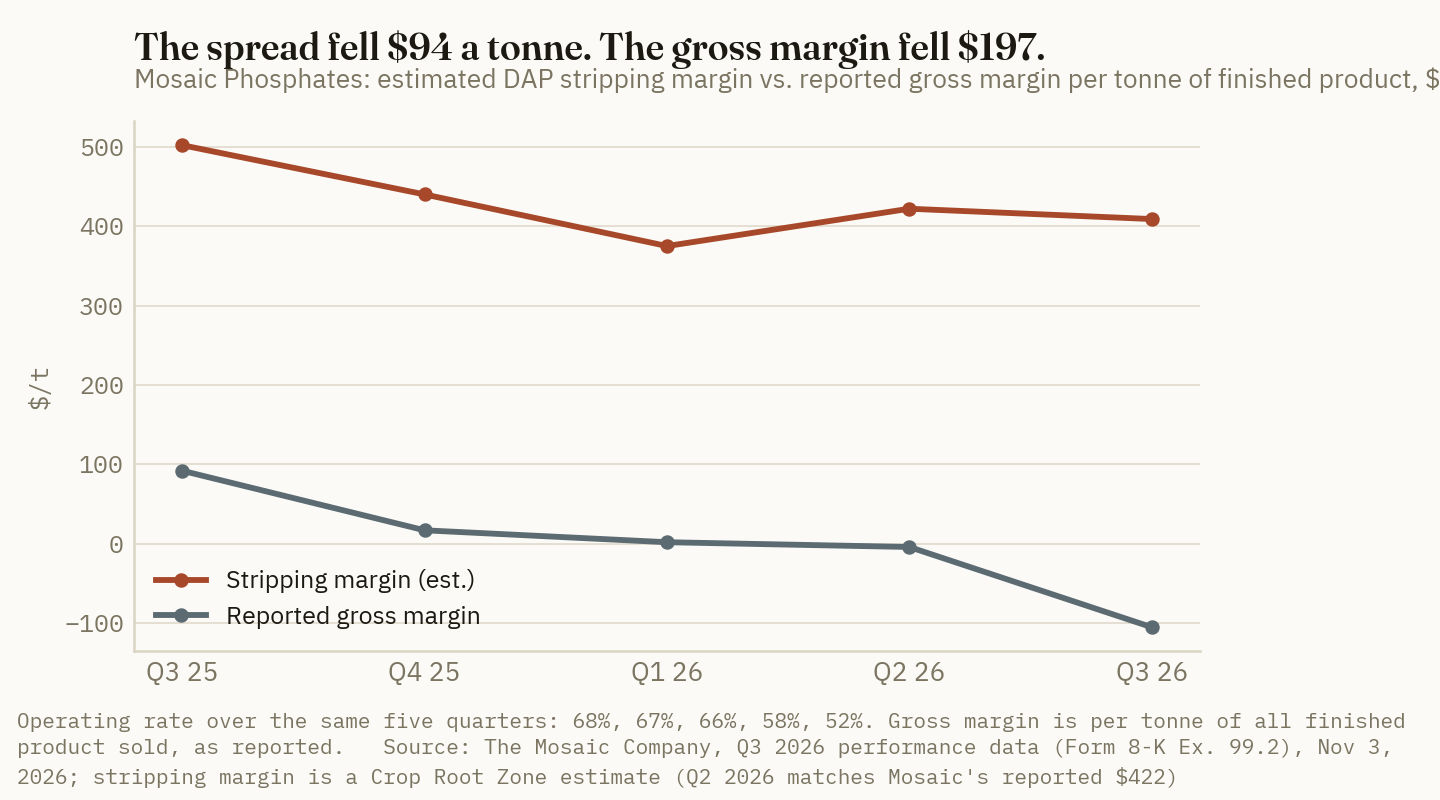
The other producers that have reported show the same squeeze. Nutrien's phosphate segment posted a manufactured-product gross margin of minus $31 a tonne in the second quarter, with cost of goods sold up to $812 a tonne from $646 (Nutrien, Aug 5, 2026) [7]; we covered that result in August (Crop Root Zone, TRZ-0078, Aug 10, 2026) [11]. Ma'aden's phosphate EBITDA fell 49% year on year to $328 million in the second quarter. The company cut its 2026 DAP production guidance to 6.0–6.5 million tonnes and withdrew its ammonia guidance, citing sulfur supply disruptions (Tradingpedia, Aug 11, 2026) [8]. OCP reported first-half 2026 revenue of MAD 48.37 billion, which TelQuel described as down 7% (Morocco World News, Sep 2026; TelQuel, Sep 11, 2026) [9][10]. As of November 4 we found no published third-quarter figures from Nutrien, Ma'aden or OCP, so Mosaic is the only producer with third-quarter numbers so far.
Ground Truth: The stripping margin, the number the trade watches, is no longer a good measure of whether US phosphate gets made. At about $409 it is still well above where producers would stop running. But curtailment has its own cost: when a plant runs at 52%, its fixed costs are spread over fewer tonnes. That added roughly $75 a tonne on our bridge (idle cost plus the residual), and it does not go away when sulfur gets cheaper. It goes away only when the plants restart. Watch Mosaic's operating rate in the first quarter of 2027, not its stripping margin, to see whether cheaper sulfur means more US supply.
4. A farm ton of DAP, traced back to the producer
What's new: Set against the same quarter's retail prices, Mosaic's numbers show how much of a farm ton is now raw material, and how little sits between the producer and the farm.
Evidence: DTN's monthly retail surveys put DAP at $911 a ton in July, $916 in August and $925 in September, and MAP at $958, $959 and $967 (DTN/Progressive Farmer, Jul 22 and Sep 23, 2026) [4][5]. The three-month average is $917 a short ton for DAP, or about $1,011 a metric tonne, and $961 for MAP, or about $1,060. For comparison, the World Bank's DAP series, FOB US Gulf, averaged $791.8 a tonne in July–September (World Bank, Oct 2, 2026) [16], about $46 below Mosaic's realized price. Mosaic's figure is FOB plant and reflects its own sales mix, so the two are not strictly comparable.
| One metric ton of DAP, Q3 2026 | $/mt | Share of retail | |
|---|---|---|---|
| US retail, delivered (DTN, Jul–Sep avg) | 1,011 | 100% | ██████████ |
| Mosaic realized, FOB plant | 838 | 83% | ████████░░ |
| ↳ Sulfur, 0.41 lt at $715 | 293* | 29% | ███░░░░░░░ |
| ↳ Rock, ~1.7 t at $91 | 155* | 15% | ██░░░░░░░░ |
| ↳ Ammonia, 0.22 t at $619 | 136* | 13% | █░░░░░░░░░ |
| ↳ Cash conversion | 117 | 12% | █░░░░░░░░░ |
| ↳ Left before idle cost, D&A and overhead | 137* | 14% | █░░░░░░░░░ |
| Freight, distribution and retail layer | 173* | 17% | ██░░░░░░░░ |
Source: DTN/Progressive Farmer, Jul 22 and Sep 23, 2026 (survey weeks Jul 13–17, Aug 17–21 and Sep 14–18, 2026) [4][5]; The Mosaic Company, Form 8-K Ex. 99.2, Nov 3, 2026 [2]. Retail converted at 1.10231 st/mt. *Crop Root Zone estimates; the rows mix a delivered retail price with an FOB-plant producer price, so the bottom line is a gap, not a measured margin.
A year earlier the picture was different. DTN had DAP at $811 in mid-July 2025 and $904 in mid-September 2025 [4][5]. The average of those two surveys, about $945 a tonne, is our rough stand-in for the quarter. On that basis Mosaic's $714 was about 76% of the farm price, and ammonia and sulfur together were about 22% of it. In the third quarter of 2026 the producer's price was about 83% of retail, and ammonia and sulfur were about 42%. The layer between plant and farm narrowed from about $231 a tonne to about $173. That fits what we measured at the NOLA barge in October (Crop Root Zone, TRZ-0286, Oct 16, 2026) [15].
At the 139 lb of DAP per acre that supplies corn's survey-average 64 lb of P2O5 (Crop Root Zone, TRZ-0209, Sep 18, 2026) [17], the sulfur in that DAP cost about $18.50 an acre in the third quarter, against about $7.00 a year earlier. Ammonia and sulfur together came to about $27 an acre, against about $13. These are our estimates, and they assume the producer's input cost passes through to the farm price in full.
Ground Truth: A grower paying about $917 a ton for DAP this past quarter was paying more for the sulfur in it than for the ammonia, and both producer and dealer margins were thin. That means the main way retail phosphate gets cheaper is through lower input costs. A smaller producer margin or a smaller dealer markup can't do much, because both are already small. Sulfur is now falling. Ammonia has been flat at about $620 for three quarters. If the US phosphate price drops in 2027, sulfur will have done nearly all of the work, and the size of the drop will track the Tampa sulfur contract.
5. The fourth quarter, the $615 contract, and what to watch
What's new: Mosaic guides fourth-quarter phosphate sales of 1.3–1.6 million tonnes at a DAP price of $820–840 a tonne. It says "fourth-quarter stripping margins and adjusted EBITDA are expected to decline further," because "higher-cost raw materials purchased and consumed during the third quarter flow through cost of goods sold," reflecting "the two- to three-month inventory cycle" [1]. It settled its fourth-quarter sulfur contract with US Gulf Coast refiners at $615 a long ton, and expects most of the earnings benefit in the first quarter of 2027 [1].
Evidence: Our earlier report of a $615 settlement relied on a single distributor survey (Crop Root Zone, TRZ-0318, Oct 29, 2026) [18]. Mosaic's filing now confirms it. The table shows what the contract changes, on our ratios.
| DAP economics, $/mt | Q3 2026 actual | Q4 2026 guidance | Q1 2027 illustration |
|---|---|---|---|
| DAP realized, FOB plant | 838 | 820–840 | 830* |
| Sulfur basis, $/lt | 715 realized | Q3 purchases at ~$705 contract | 615 contract |
| Sulfur per t DAP, 0.41 lt | 293* | ~289* | 252* |
| Ammonia per t DAP, at $619 | 136* | 136* | 136* |
| Stripping margin | 409* | "decline further" | ~442* |
Source: The Mosaic Company, Form 8-K Ex. 99.1 and Ex. 99.2, Nov 3, 2026 [1][2]; Q3 contract from the Aug 5, 2026 call [3]. *Crop Root Zone estimates. The Q1 2027 column holds DAP at the Q4 guidance midpoint and ammonia flat for illustration only. It is not a forecast, and Mosaic has given no Q1 guidance.
From the third-quarter contract of $705 to the fourth-quarter contract of $615, the cut is worth about $37 a tonne of DAP, or about $33.50 a short ton, on our ratios. That is close to the $32.40 a short ton we estimated in October on a slightly different ratio [18]. At 139 lb an acre it is about $2.30 for a corn acre. The saving reaches Mosaic's cost of goods in the first quarter of 2027 [1], after this winter's fill and before the spring pull. It reaches retail only if Mosaic passes it on, and in our view the producer has two better uses for it first: restarting idled plants and making up for losses.
Ground Truth: Mosaic's own guidance argues against cheaper phosphate this winter. The company expects a lower margin in the fourth quarter at an unchanged price, so it has no cost room to cut DAP before January. The first-quarter sulfur saving of about $37 a tonne is smaller than the roughly $55 a tonne that idle and unabsorbed costs added in the third quarter. If Mosaic restarts plants with that money, the effect is more US tonnes in spring 2027, which should hold the NOLA barge steady rather than lift it. If it keeps plants idle and holds the margin, the price will not move. Either way, we don't expect $615 sulfur to pull retail DAP below the $900s before planting.
What to watch:
- Nutrien's third-quarter phosphate results. They will show whether Mosaic's minus $105 is specific to Mosaic, which has heavy Florida sulfur-burning capacity and idled Louisiana, or common to North American producers. Nutrien's phosphate unit is also under a strategic review [7].
- The first-quarter 2027 Tampa sulfur contract, normally settled around the turn of the quarter. A second cut would add to the $37 a tonne; a rollover at $615 would leave the 2027 saving at that figure.
- Mosaic's operating rate and any restart of Louisiana. The release expects idle and unabsorbed costs to rise in the fourth quarter "before moderating in 2027" [1]. A restart announcement would be the first sign that cheaper sulfur means more US supply.
- The Tampa ammonia contract. It fell to $555 for September from $825 in May [6]. At 0.22 tonnes per tonne of DAP, each $50 move is worth about $11 a tonne, so ammonia has much less effect on phosphate cost than sulfur does.
References
- The Mosaic Company, "The Mosaic Company Reports Third Quarter 2026 Results," press release, Form 8-K Ex. 99.1, Nov 3, 2026. https://www.sec.gov/Archives/edgar/data/0001285785/000128578526000139/pressreleaseq32026-ex991.htm
- The Mosaic Company, Q3 2026 Performance Data, Form 8-K Ex. 99.2, Nov 3, 2026. https://www.sec.gov/Archives/edgar/data/0001285785/000128578526000139/performancedataq32026-ex992.htm
- The Mosaic Company, Q2 2026 earnings call, Aug 5, 2026, transcript published by The Motley Fool, Aug 11, 2026 (reported Q2 stripping margin of $422/t; Q2 sulfur $522/lt and ammonia $621/t; Q3 sulfur contract $705/lt; Q3 DAP guidance $820–840/t). https://www.fool.com/earnings/call-transcripts/2026/08/11/mosaic-mos-q2-2026-earnings-call-transcript/
- DTN/Progressive Farmer, R. Quinn, "Fertilizer Prices Continue Downward Trend," Jul 22, 2026 (survey week Jul 13–17, 2026; year-ago Jul 14–18, 2025). https://www.dtnpf.com/agriculture/web/ag/crops/article/2026/07/22/fertilizer-prices-continue-downward
- DTN/Progressive Farmer, "Fertilizer Prices Rise: Six of Eight," Sep 23, 2026 (survey week Sep 14–18, 2026; month-ago Aug 17–21, 2026; year-ago Sep 15–19, 2025). https://www.dtnpf.com/agriculture/web/ag/crops/article/2026/09/23/fertilizer-prices-rise-six-eight
- Fertilizer Daily, K. Clarksen, "Tampa ammonia price $555 for September 2026, fourth monthly decline," Sep 10, 2026 (relaying Australian Fertilizer Corporation, w/e Aug 28, 2026). https://www.fertilizerdaily.com/20260910-tampa-ammonia-price-555-september-2026-fourth-monthly-decline/
- Nutrien Ltd., Q2 2026 results, Form 6-K Ex. 99.1, Aug 5, 2026. https://www.sec.gov/Archives/edgar/data/0001725964/000119312526335517/d129364dex991.htm
- Tradingpedia, "Maaden Q2 earnings surge as aluminum prices soar," Aug 11, 2026. https://www.tradingpedia.com/2026/08/11/maaden-q2-earnings-surge-as-aluminum-prices-soar/
- Morocco World News, "OCP Group posts MAD 48.4 billion revenue in first half of 2026," Sep 2026. https://www.moroccoworldnews.com/2026/09/336877/ocp-group-posts-mad-48-4-billion-revenue-in-first-half-of-2026/
- TelQuel, "OCP Group revenue falls 7% as phosphate market tightens," Sep 11, 2026. https://telquel.ma/2026/09/11/ocp-group-revenue-falls-7-as-phosphate-market-tightens_2005107
- Crop Root Zone, TRZ-0078, "You Paid $914 a Ton for DAP. The Company That Made It Lost $31 a Tonne.," Aug 10, 2026.
- Crop Root Zone, TRZ-0164, "The Biggest US Phosphate Producer Is Cutting 206 Jobs Over a Sulfur Contract," Sep 7, 2026.
- Crop Root Zone, TRZ-0246, "The Fourth-Quarter Sulfur Price Is Not Public Yet. Every $100 a Long Ton It Settles Adds $36 to a Ton of DAP — and Lands on Spring 2027, Not This Fall.," Oct 1, 2026.
- Crop Root Zone, TRZ-0270, "Twelve Days Into the Quarter, Tampa Sulfur Is Still Unsettled at $705. Gulf Producers Cut October Prices $45 to $70, and a $50 Cut Is Worth $18 on a Ton of DAP.," Oct 12, 2026.
- Crop Root Zone, TRZ-0286, "Retail DAP Sits $131.50 Over the NOLA Barge, the Narrowest October Gap in Four Years.," Oct 16, 2026.
- World Bank, Commodities Price Data (The Pink Sheet), Oct 2, 2026 (DAP spot, FOB US Gulf, July–September 2026 average $791.8/mt). https://thedocs.worldbank.org/en/doc/74e8be41ceb20fa0da750cda2f6b9e4e-0050012026/related/CMO-Pink-Sheet-October-2026.pdf
- Crop Root Zone, TRZ-0209, "Washington Suspended the 16.60% Moroccan Phosphate Duty on July 8. Ten Weeks Later Retail DAP Is $923/st — $13 Higher Than the Week It Was Signed.," Sep 18, 2026.
- Crop Root Zone, TRZ-0318, "China Reopened Phosphate Exports on Sept. 1 and Shipped No DAP or MAP in September.," Oct 29, 2026.
Disclosures
Crop Root Zone is an independent publication. Nothing here is investment advice. Market calls, where included, reflect the editors' own read and are not a recommendation to buy or sell any security.
K-State Priced the 2027 Kansas Wheat Crop at $7.09 to $7.30. The July Board Now Says $5.76. At That Price Continuous Wheat Does Not Cover Even Its Direct Costs.
K-State's new Nov 1 budgets put a Kansas wheat acre $32 to $38 above last year's cost. In continuous wheat, diesel at $5.78 a gallon added three times as much as fertilizer. Repriced to July 2027 KC at $6.4575 less 70 cents, the three continuous budgets fall $3 to $16 short of direct cost and $121 to $230 short of total cost. North Central rotation wheat covers direct cost and rent with $43 to spare but misses total cost by $11. Last November's crop was rated better than this one and yielded 34 bushels. The spring urea topdress is now the largest cost still to spend, and 30 pounds of N costs 3.8 bushels, up from 3.1 at K-State's price.
Kansas State University has posted its 2027 crop budgets, and the wheat set is already out of date on price. The four dryland wheat cost-return budgets in K-State's 2027 Farm Management Guides, dated November 1, 2026, price hard red winter wheat at $7.19 a bushel in South Central Kansas, $7.09 in North Central and $7.30 in the Northeast (K-State, Nov 1, 2026) [1]. On Friday the July 2027 Kansas City contract settled at $6.4575. Kansas country elevators bid ordinary-protein HRW for current delivery at $5.525 to $5.725, 60 to 80 cents under December (USDA AMS, Nov 6, 2026) [2]. The same 70-cent basis we have used all fall puts the new crop at about $5.76, $1.33 to $1.54 below K-State's prices. At that price the four budgets tell a harder story than K-State's own sensitivity tables do. Those tables stop at 10% below the budget price, and today's price is 19% to 21% below it. This piece reprices K-State's new budgets to the current board, shows which cost lines actually rose, and looks at the one large cost growers can still change: the spring topdress.
1. What K-State's 2027 budgets changed, line by line
What's new: This is the first 2027 wheat set. Our September and October pieces worked from K-State's November 2025 budgets and repriced fertilizer ourselves [11][12][13]. The new set replaces that with K-State's own 2027 cost lines. So far it covers four wheat budgets: continuous wheat in South Central, North Central and Northeast Kansas, and rotation wheat in North Central Kansas. The rotation, fallow and Southeast budgets we used before had not been posted as of this morning [1].
Evidence: We compared the 2027 South Central continuous and North Central rotation budgets with their November 2025 versions, line by line [1][3].
| Cost line, $/acre | SC continuous 2026 guide | SC continuous 2027 guide | Change | NC rotation change | |
|---|---|---|---|---|---|
| Diesel | 18.93 | 33.99 | +15.06 | ██████████ |
+9.10 |
| Capital recovery (machinery) | 71.68 | 76.87 | +5.19 | ███ |
+3.97 |
| Fertilizer and lime | 60.21 | 65.33 | +5.12 | ███ |
+9.91 |
| Cash rent | 37.00 | 41.00 | +4.00 | ███ |
+3.00 |
| Custom anhydrous application | 17.69 | 21.51 | +3.82 | ███ |
— |
| All other direct lines | 83.88 | 87.00 | +3.12 | ██ |
+3.64 |
| Interest on operating capital | 5.87 | 7.90 | +2.03 | █ |
+2.01 |
| Total cost | 295.26 | 333.61 | +38.35 | +31.63 |
Source: K-State Department of Agricultural Economics, 2026 Farm Management Guides (budgets dated Nov 1, 2025) and 2027 Farm Management Guides (budgets dated Nov 1, 2026), Wheat (Continuous) South Central KS and Wheat (Rotation) North Central KS [1][3]. Basis: $/acre, middle yield (37 and 62 bu). Differences calculated by Crop Root Zone. "All other direct lines" combines seed, crop insurance, chemicals, labor, repairs and miscellaneous. Bars scale the South Central change; diesel = 10.
Fuel is the largest single change. K-State moved its diesel price from $3.22 to $5.78 a gallon, up 80%, at unchanged gallons per acre [1][3]. That figure matches the market. The EIA's Midwest retail diesel average, which includes road taxes that farm fuel does not pay, was $6.40 a gallon in the week of November 2 (EIA via FRED, Nov 3, 2026) [4]. K-State also raised its operating interest rate from 6.5% to 7.6%. Fuel, interest and the custom anhydrous application line together added $20.91 to the South Central acre. Fertilizer added $5.12.
K-State's fertilizer prices are current. Its 2027 budgets carry anhydrous at $0.49 a pound of product, about $980 a ton, and urea at $70.01 for 205 pounds, about $683 a ton, or $0.74 a pound of N [1]. DTN's retail survey for October 26–30 had anhydrous at $1,007, urea at $669 and MAP at $987, with urea at $0.73 a pound of N (DTN, Nov 4, 2026) [5]. The cost side of these budgets needs no correction from us. The price side does.
Ground Truth: Fertilizer is not what pushed the 2027 Kansas wheat acre higher. In continuous wheat it is fuel, and fuel cannot be cut. The tillage passes, the drill and the combine burn the same gallons whatever diesel costs. A grower who wants a lower cost per acre in 2027 will find more of it in the number of trips across the field than in the nitrogen rate. The continuous budget runs a chisel, a disk and a field cultivator before the drill and spends $13.63 an acre on that tillage diesel alone. The rotation budget, drilled no-till, saw its diesel line rise by $9.10 rather than $15.06. That gap is what the tillage passes cost at 2027 fuel prices.
2. The price K-State used, and the price the board gives now
What's new: K-State's prices fall between the September board and today's. The budgets do not say how they were set. K-State describes every price as its "best estimation... at the time the budget was published" [6]. The July 2027 contract has fallen $1.60 since mid-September: $8.0575 on September 15, $7.745 on September 25, $6.8525 on October 22 and $6.4575 on November 6 [2][7][11][12]. One market report tied the late-October selling to Russia agreeing to resume peace talks with the U.S. and Ukraine, which traders read as a possible return of Black Sea export supply. The same report noted that weekly U.S. wheat export sales had slipped to a six-week low. December KC fell 39½ cents in the week to October 26 (The Price Group, Oct 26, 2026) [8].
Evidence: We kept every K-State cost line and changed only the price. We used $5.76: the July settlement less 70 cents, inside the 60-to-80-cent range Kansas country elevators bid on Friday [2]. This is our estimate, not a quote, and harvest basis against July can be wider or narrower than today's spot basis against December.
| K-State 2027 budget (planning yield) | K-State price, $/bu | Return over total cost at K-State price | Return over direct cost at $5.76* | Return over direct + rent at $5.76* | Return over total cost at $5.76* | Break-even yield, total cost, at $5.76, bu* |
|---|---|---|---|---|---|---|
| SC continuous (37) | 7.19 | −67.58 | −2.71 | −43.71 | −120.58 | 57.9 |
| NC continuous (37) | 7.09 | −115.08 | −16.16 | −89.16 | −164.38 | 65.6 |
| NE continuous (41) | 7.30 | −167.05 | −11.64 | −151.64 | −230.29 | 81.0 |
| NC rotation (62) | 7.09 | +71.76 | +115.95 | +42.95 | −10.86 | 63.9 |
Source: K-State Department of Agricultural Economics, 2027 Farm Management Guides, wheat budgets dated Nov 1, 2026 [1]; USDA AMS Kansas Daily Grain Bids, Nov 6, 2026 [2]. Basis: $/acre, dryland, middle yield. *Crop Root Zone calculation at $5.7575 (July 2027 KCBT $6.4575 less an assumed 70-cent basis); K-State costs unchanged. Direct cost includes K-State's crop insurance premium line. Government and indemnity payments are excluded, as in K-State's budgets.
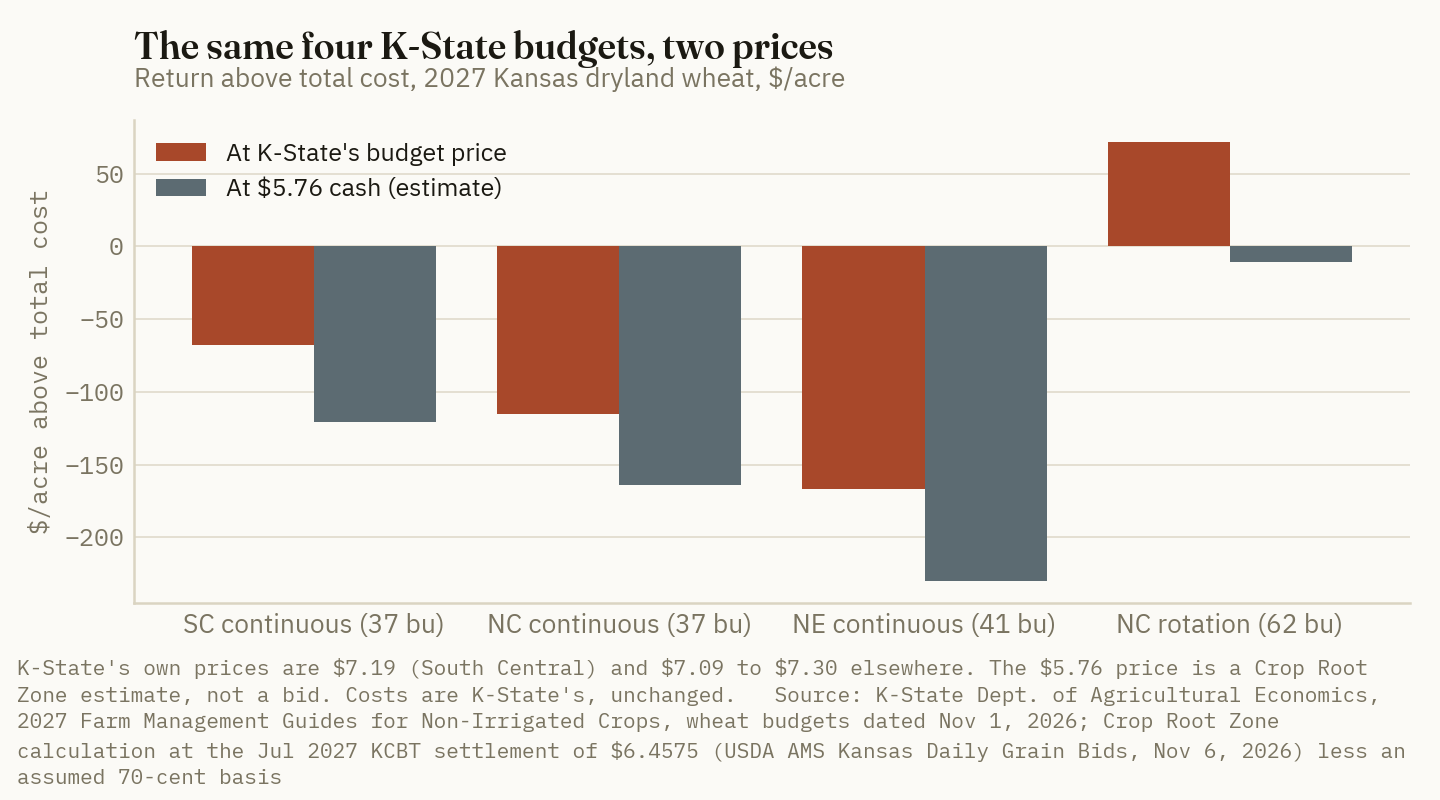
$1.33 to $1.54 a bushel
The gap between the wheat prices in K-State's November 1 budgets and the July 2027 board less a 70-cent basis on November 6. On K-State's planning yields that is $49 to $83 of revenue per acre, larger than the $32 to $38 cost increase in the two budgets we compared line by line. (Crop Root Zone calculation from K-State, Nov 1, 2026, and USDA AMS, Nov 6, 2026)
Two things stand out. First, the continuous budgets now fall short of direct cost, by $3 to $16 an acre. That means the grain does not pay for seed, fertilizer, fuel, chemicals, repairs and interest, before rent or machinery. At K-State's own prices those budgets cleared direct cost by $33 to $52. Second, at the same price the 2027 acre is worse than the 2026 acre. Last year's South Central continuous budget, at $5.76, would have lost $82.14 over total cost. This year's loses $120.58. North Central rotation would have made $20.92 and now loses $10.86. The price is not low by recent standards. Kansas country-elevator averages on Friday were $1.23 to $1.41 above a year earlier [2]. The cost base under it moved up $32 to $38.
Ground Truth: K-State's 2027 budgets show what the acre looked like when it was planted. They do not show its value now, so treat their printed returns as out of date. The useful figure for each budget is the break-even yield at today's price. That is 58 to 81 bushels on full cost for continuous wheat, and 64 for North Central rotation. Kansas has not averaged above 51 in any of the last three crops [9]. For continuous wheat the economic case now rests on two things: covering direct cost, which takes 37.5 to 43 bushels at $5.76, and the insurance floor in Section 5. A rally may still come, but planning should not assume it. A grower who priced nothing in September, when July traded $7.75 to $8, should build the sales plan from the break-even yields in this table, not from K-State's printed returns.
3. The crop in the ground: better moisture, a lower rating than last year
What's new: In September the 2027 crop was being drilled into dust. Rain since then has changed that. K-State's soil-water model had 75% of Kansas below the crop water-stress threshold on September 16 [12]. By November 4, 7% of the state was below it. Statewide plant-available water in the top two feet rose from 0.64 to 0.76 of capacity in the week to November 4 alone (K-State Agronomy eUpdate, Nov 5, 2026) [10]. K-State's nutrient specialists also expect a strong El Niño and wetter-than-normal conditions this winter (K-State Agronomy eUpdate, Oct 29, 2026) [14].
Evidence: USDA's first condition rating of the 2027 crop puts Kansas at 47% good to excellent and 20% poor to very poor. Planting and emergence are within two points of the five-year average [7][15]. Last fall's comparison shows how little that rating settles.
| Kansas winter wheat | 2026 crop, week ending Nov 23, 2025 | 2027 crop, week ending Nov 1, 2026 |
|---|---|---|
| Good + excellent, % | 62 | 47 |
| Poor + very poor, % | 6 | 20 |
| Emerged, % (5-yr avg) | 90 (91) | 66 (68) |
| Topsoil short + very short, % | 18 | 22* |
| Subsoil short + very short, % | 22 | 31* |
| Final yield, bu/acre | 34.0 | — |
| Harvested ÷ planted acres | 5.9 ÷ 6.7 million | — |
Source: USDA NASS Kansas Crop Progress and Condition, Nov 24, 2025 [16] and Oct 26, 2026 [15]; USDA NASS Crop Progress, Nov 2, 2026 [7]; USDA NASS Small Grains 2026 Summary, Sep 30, 2026 [9]. *Moisture for the week ending Oct 25, 2026; the Kansas release for Nov 1 was not posted when we checked. Ratings are from different weeks of the season because the 2025 federal shutdown delayed last year's first rating to Nov 17.
Last November's crop was rated 62% good to excellent on topsoil that was 82% adequate or surplus. It went on to the 34-bushel failure that cut Kansas production to 200.6 million bushels and left 800,000 planted acres unharvested [9]. The 2027 crop starts below that rating, with more of it in poor condition. Part of the gap is timing. Planting was late in the central and eastern districts, and on October 25 only 16% to 17% of the crop had emerged in the Northeast, East Central and Southeast districts [15].
Ground Truth: The fall rating is the weakest yield signal growers will get this season, and 2026 proved it. A 62% good-to-excellent November turned into a 34-bushel crop. What has changed this fall is soil water, and stored water counts for more than the rating. A wheat crop entering winter with a full two-foot profile has a reserve that a dry-seeded crop does not. This year that reserve was built in October, after most continuous wheat had already been drilled on the September price. It does not make the 58-to-81-bushel full-cost break-evens in Section 2 any easier to reach. It does make the rotation acre's 64 bushels plausible in a normal spring. That is the yield that decides whether the topdress in Section 4 is worth buying.
4. The cost still to spend: spring nitrogen
What's new: In K-State's three continuous budgets, all of the nitrogen goes on as custom-applied anhydrous ammonia: 60 to 74 pounds of N, plus MAP at planting [1]. On fields managed that way, the 2027 fertilizer bill is spent. The North Central rotation budget is different. It carries 205 pounds of urea, or 94 of its 101 pounds of N, at $70.01. Where that goes on in February or March, it is the largest cost on the acre that has not yet been committed.
Evidence: K-State's nitrogen recommendation for wheat contains no price term. It sets fertilizer N as 1.45 pounds per bushel of expected yield, divided by a fertilizer-efficiency factor of 0.65 for injected or split-applied N or 0.55 for broadcast fall preplant N. It then subtracts profile nitrate, 10 pounds per point of organic matter and other credits (K-State MF2586, Jan 2024) [17]. On split-applied urea at DTN's $0.73 per pound of N, each bushel of yield goal therefore adds 2.23 pounds of N and $1.63 of cost. On UAN28 at $0.80 it adds $1.78 [5][17]. The price moves the value of the bushel, not the formula's rate.
| Spring decision, NC rotation acre | Cost, $/acre | Bushels to pay at K-State's $7.09 | Bushels to pay at $5.76* | |
|---|---|---|---|---|
| Urea topdress, 94 lb N (K-State budget) | 70.01 | 9.87 | 12.16 | ██████████ |
| Extra 30 lb N as urea at $0.73 | 21.90 | 3.09 | 3.80 | ███ |
| Fungicide, Headline 8 oz (K-State budget) | 14.63 | 2.06 | 2.54 | ██ |
| Spring herbicide (K-State budget) | 4.80 | 0.68 | 0.83 | █ |
Source: K-State 2027 Farm Management Guide, Wheat (Rotation) North Central KS, Nov 1, 2026 [1]; DTN/Progressive Farmer retail survey Oct 26–30, 2026 [5]. *Crop Root Zone calculation at $5.7575 cash (July 2027 KCBT less 70 cents). Bars scale the $5.76 column; urea = 10. K-State's budgets do not state application timing for the urea; the table assumes a spring topdress.
At $5.76, the urea on a 62-bushel rotation acre has to return 12.2 bushels, up from 9.9 at K-State's price. That is still under a fifth of the planning yield, and nitrogen is the input that makes the yield possible. The ratio of N price to wheat price has risen from about 0.10 at K-State's price to 0.127 today. That is a meaningful change, but small next to the price of the grain itself. Under K-State's formula, the efficiency factor matters more than the price. Moving 94 pounds of N from a broadcast fall application (0.55) to a split spring topdress (0.65) cuts the N needed for the same yield goal by about 15%. That is worth roughly $10 an acre at $0.73 urea, and it is available every year.
Ground Truth: At $5.76 wheat the spring nitrogen decision should be made on the yield goal, not on the price of urea. The formula turns each bushel of yield goal into $1.63 of nitrogen. That makes the March stand count and the soil profile the real inputs, and this fall they point up, not down. A rotation grower who cuts the topdress to protect a thin margin is cutting the one input that can lift the acre over the 64 bushels it needs. The cost worth reviewing is the spring nitrogen on continuous ground. Those budgets already carry 60 to 74 pounds of fall anhydrous. A spring top-up there buys bushels for a field whose full-cost break-even is 58 bushels or more. Take a profile nitrate sample in February before adding a pound. K-State's formula assumes a 30-pound default credit when no profile sample is taken [17], and after a wet fall the real figure could be well above or below that.
5. The insurance floor against K-State's 2027 cost lines
What's new: The 2027 Kansas winter wheat revenue guarantee is fixed at the $8.11 projected price (USDA RMA, Sep 17, 2026) [18]. At $6.4575, the July board is now 3 cents below the 80% coverage price trigger of $6.488, and 37.5 cents above the 75% trigger of $6.0825. On October 22 it was 4 cents below the 85% trigger [13]. An 80% policy on a crop that makes its full APH would now pay on price alone. Kansas wrote 9.4% of its 2026 wheat Revenue Protection acres at that level [13].
Evidence: We set the 75% guarantee against K-State's new 2027 cost lines, taking each budget's planning yield as the APH.
| K-State 2027 budget (APH = planning yield) | 75% RP guarantee at $8.11, $/acre* | Direct cost, $/acre | Guarantee minus direct cost* | Guarantee minus direct cost and rent* |
|---|---|---|---|---|
| SC continuous (37) | 225.05 | 215.74 | +9.31 | −31.69 |
| NC continuous (37) | 225.05 | 229.19 | −4.14 | −77.14 |
| NE continuous (41) | 249.38 | 247.70 | +1.68 | −138.32 |
| NC rotation (62) | 377.11 | 241.01 | +136.10 | +63.10 |
Source: USDA RMA PM-26-056, Sep 17, 2026 [18]; K-State 2027 Farm Management Guides, Nov 1, 2026 [1]. *Crop Root Zone calculation: 75% × planning yield × $8.11. Direct cost includes K-State's own premium line of $9.89 to $10.83 rather than a quote. The guarantee is measured at futures-based insurance prices; a grower selling at cash realizes less on the bushels actually sold.
The comparison has shifted since September. On K-State's November 2025 costs, our September repricing found the 75% guarantee covered direct cost in every continuous budget, by $17 to $30 [12]. On K-State's 2027 costs it covers South Central by $9, Northeast by under $2, and falls $4 short in North Central. Higher fuel and interest have used up the margin the $8.11 price created. Rotation wheat still has a wide floor: $136 over direct cost and $63 over direct cost plus rent. Our October 23 piece set out the related point on nitrogen [13]. On a field heading for a yield below its trigger, each extra bushel reduces the indemnity by about as much as it adds in grain revenue. Extra spring N on such a field earns the grower close to nothing. The policy's good-farming-practice requirement still applies, so this is no reason to skip a field's normal program.
Ground Truth: For continuous wheat the 75% floor no longer covers direct cost and rent anywhere in K-State's 2027 set. A tenant on continuous ground at 75% coverage is now exposed to the rent on every acre unless the crop beats its APH or the price recovers. Coverage cannot be changed until next fall, so the remaining protection is in marketing. Growers can price bushels up to the guaranteed quantity, coverage × APH, because the $8.11 floor backs those bushels. They should hold the rest until the March stand shows whether the crop's own yield, not the board, can make up the gap. For rotation wheat the floor is wide enough that the topdress decision can be made on agronomy alone.
What to watch. USDA's Economic Research Service publishes its November Wheat Outlook on November 13 [19], and its HRW export forecast is the clearest test of the late-October selling. K-State has yet to post its rotation, fallow and Southeast wheat budgets for 2027. When it does, the same repricing will apply, and those systems start from higher planning yields. The Kansas weekly condition rating will run until the crop goes dormant. Our Section 3 table argues it should be read alongside the soil-water maps. On the board, each 10-cent move in July 2027 KC changes a 62-bushel rotation acre by $6.20 and a 37-bushel continuous acre by $3.70. The change at Friday's close was $1.29 since September 25.
References
- K-State Department of Agricultural Economics (G. Ibendahl, D. O'Brien, S. Lancaster, D. Shoup and co-authors), 2027 Farm Management Guides for Non-Irrigated Crops: Wheat (Continuous) Cost-Return Budgets for South Central, North Central and Northeast KS; Wheat (Rotation) Cost-Return Budget for North Central KS; all dated Nov 1, 2026; page checked Nov 9, 2026 — https://www.agmanager.info/farm-budgets/2027-farm-management-guides-non-irrigated-crops
- USDA AMS Livestock, Poultry and Grain Market News / Kansas Dept. of Agriculture Market News, Kansas Daily Grain Bids, Nov 6, 2026 (KCBT wheat settlements: Dec 2026 632.50¢, Jul 2027 645.75¢; HRW country elevator bids $5.525–5.725, 60–80 under December; year-ago averages) — https://www.ams.usda.gov/mnreports/ams_2886.pdf
- K-State Department of Agricultural Economics, 2026 Farm Management Guides for Non-Irrigated Crops: Wheat (Continuous) Cost-Return Budget in South Central KS and Wheat (Rotation) Cost-Return Budget in North Central KS, both dated Nov 1, 2025 — https://www.agmanager.info/sites/default/files/wysiwyg/Wheat%20%28Continuous%29%20Cost-Return%20Budget%20in%20South%20Central%20KS__Nov-01-2025.pdf ; https://www.agmanager.info/sites/default/files/wysiwyg/Wheat%20%28Rotation%29%20Cost-Return%20Budget%20in%20North%20Central%20KS__Nov-01-2025.pdf
- U.S. Energy Information Administration via Federal Reserve Bank of St. Louis (FRED), PADD II (Midwest) Diesel Sales Price, series GASDESMWW, week of Nov 2, 2026 ($6.402/gal), updated Nov 3, 2026 — https://fred.stlouisfed.org/series/GASDESMWW
- R. Quinn, DTN Retail Fertilizer Trends, DTN/Progressive Farmer, Nov 4, 2026 (retail survey Oct 26–30, 2026) — https://www.dtnpf.com/agriculture/web/AG/crops/article/2026/11/04/uan28-continues-lead-fertilizer-week
- K-State Department of Agricultural Economics, "Information about the Crop Budgets," AgManager.info, accessed Nov 9, 2026 — https://www.agmanager.info/sites/default/files/wysiwyg/Information%20about%20the%20Crop%20Budgets.pdf
- USDA National Agricultural Statistics Service, Crop Progress, Nov 2, 2026 (week ending Nov 1, 2026) — https://esmis.nal.usda.gov/sites/default/release-files/796135/prog4426.txt
- The Price Group, "A Red October. Ag Marketing Report 10/26/2026," Oct 26, 2026 — https://blog.pricegroup.com/2026/10/26/a-red-october-ag-marketing-report-10-26-2026/
- USDA National Agricultural Statistics Service, Small Grains 2026 Summary, Sep 30, 2026 (Kansas winter wheat: planted 7.6, 7.3 and 6.7 million acres; harvested 7.15, 6.8 and 5.9 million; yield 43.0, 51.0 and 34.0 bu/ac; production 307.5, 346.8 and 200.6 million bu, 2024–2026) — https://esmis.nal.usda.gov/sites/default/release-files/796086/smgr0926.pdf
- A. Patrignani (contact), K-State Soil Water Processes Laboratory, "Kansas Soil Moisture Update – November 4, 2026," K-State Agronomy eUpdate Issue 1128, Nov 5, 2026 — https://www.agronomy.k-state.edu/eupdates/2026/issue-1128-november-5/kansas-soil-moisture-update-nov-4-2026.html
- Crop Root Zone, TRZ-0210, "A Kansas Winter Wheat Acre Repriced to September Retail Costs $311 and Breaks Even at 41.7 Bushels...," Sep 18, 2026 (July 2027 KC settlement of $8.0575 on Sep 15, citing K-State, Sep 16, 2026).
- Crop Root Zone, TRZ-0235, "Kansas' 2027 Wheat Acre Pays in Rotation and Fallow, Not in Continuous Wheat...," Sep 28, 2026 (July 2027 KC settlement $7.745 on Sep 25, USDA AMS; K-State soil-water model, 75% of Kansas below stress threshold on Sep 16, K-State Agronomy eUpdate, Sep 17, 2026).
- Crop Root Zone, TRZ-0307, "The 2027 Kansas Wheat Guarantee Is $274 an Acre at 75% on a 45-Bushel APH...," Oct 23, 2026 (July 2027 KC settlement $6.8525 on Oct 22, USDA AMS; 2026 Kansas wheat RP acres by coverage level, USDA RMA Summary of Business, Oct 17, 2026).
- D. Ruiz Diaz, B. Rutter, C. Redmond and P. Tomlinson, "Considerations For Fall Applications of Anhydrous Ammonia," K-State Agronomy eUpdate Issue 1127, Oct 29, 2026 — https://www.agronomy.k-state.edu/eupdates/2026/issue-1127-october-29/fall-applications-of-anhydrous-ammonia.html
- USDA NASS Northern Plains Regional Field Office, Kansas Crop Progress and Condition, Oct 26, 2026 (week ending Oct 25, 2026; includes district table) — https://www.nass.usda.gov/sites/default/files/Statistics_by_State/Kansas/Publications/Crop_Progress_and_Condition/2026/KS-weekly1026.pdf
- USDA NASS Northern Plains Regional Field Office, Kansas Crop Progress and Condition, Nov 24, 2025 (week ending Nov 23, 2025) — https://www.nass.usda.gov/sites/default/files/Statistics_by_State/Kansas/Publications/Crop_Progress_and_Condition/2025/KS-weekly1124.pdf
- D. Ruiz Diaz, Soil Test Interpretations and Fertilizer Recommendations in Kansas, K-State Research and Extension MF2586, Jan 2024 (wheat N recommendation, efficiency factors, default profile-N credit) — https://bookstore.ksre.ksu.edu/pubs/MF2586.pdf
- USDA Risk Management Agency, PM-26-056 and attachment, 2027 CY projected prices and volatility factors (Kansas winter wheat $8.11), Sep 17, 2026 — https://www.rma.usda.gov/sites/default/files/2026-09/PM-26-056-attachment.pdf
- USDA Economic Research Service, Wheat Outlook and market outlook page (next release Nov 13, 2026), accessed Nov 9, 2026 — https://www.ers.usda.gov/topics/crops/wheat/market-outlook
Disclosures
Crop Root Zone is an independent publication. Nothing here is investment advice. Market calls, where included, reflect the editors' own read and are not a recommendation to buy or sell any security.
The Board Pays 30¾ Cents to Hold Corn Into July. That Covers the Interest Twice and Commercial Storage Two-Thirds of the Way. An Owned Bin Needs Only 3 to 10 Cents of Basis Gain to Beat a Harvest Sale.
December corn settled at $4.40 on November 5, and Iowa's average cash bid was $3.99, 41 cents under. We priced storage from that bid to March, May and July for three routes, at a 6.66% operating rate and this fall's posted storage rates. An owned bin breaks even on 3 to 10 cents of basis gain. A rented bin needs 22 to 28 cents. Commercial space needs 31 to 43, which the basis seldom delivers. Without a hedge, the futures half of the return is still exposed.
December corn settled at $4.40 on Thursday, and July 2027 settled at $4.7075 (USDA AMS, Nov 5, 2026) [1]. That 30¾-cent spread is the board's offer to anyone who holds corn from harvest into summer. Iowa's average cash bid the same day was $3.99, 41 cents under December. In central Illinois it was $4.18, 22 under [1][2]. Harvest was 74% complete nationally on November 1, three points behind the five-year average (DTN, Nov 2, 2026) [6]. Most of the corn still unpriced is now either in a bin or about to be. We priced the decision as it stands this week, using the operating-loan rate, this fall's posted storage rates, and Iowa State's shrink and handling factors. The answer depends on who owns the bin. A grower with paid-for steel, who hedges the deferred price, needs the basis to narrow by single digits. A grower paying the elevator to store needs a basis recovery larger than most years produce.
1. The carry: what the board pays to wait
What's new: USDA's October report raised the 2026/27 corn crop 234 million bushels to 16.0 billion, at 181.2 bushels an acre. It lifted ending stocks 282 million bushels to 1.8 billion and cut the season-average farm price a dime to $4.70 (USDA WASDE, Oct 9, 2026) [5]. A big crop with ample carryout should produce a carry in the futures curve, and it has. December closed down 4¼ cents on Thursday (Brownfield Ag News, Nov 5, 2026) [4].
Evidence: The November 5 settlements, from the futures block that USDA AMS prints on its daily state grain reports:
| CBOT corn contract | Settle ($/bu) | Over Dec 2026 (¢/bu) | Months after Dec | |
|---|---|---|---|---|
| Dec 2026 | 4.4000 | — | — | |
| Mar 2027 | 4.5450 | 14.50 | 3 | █████░░░░░ |
| May 2027 | 4.6325 | 23.25 | 5 | ████████░░ |
| Jul 2027 | 4.7075 | 30.75 | 7 | ██████████ |
| Sep 2027 | 4.6850 | 28.50 | 9 | █████████░ |
| Dec 2027 | 4.8350 | 43.50 | 12 | new crop |
Source: CBOT settlements as printed in USDA AMS Iowa Daily Cash Grain Bids, Nov 5, 2026 [1]. Bars scaled to the July spread. Dec 2027 is the 2027 crop and is shown for reference only.
Two features matter. First, the curve rises through July and then slips 2¼ cents to September. The market pays nothing to carry old-crop corn past July. Second, the carry shrinks as the hold gets longer: 4.8 cents a month to March, 4.7 to May and 4.4 to July (Crop Root Zone calculation). The early months pay best.
A "full carry" means the spread fully covers the cost of storing. There are two ways to measure it, and they give very different answers. At the third-quarter operating-loan rate of 6.66% [10], money on $3.99 Iowa corn costs 2.2 cents a bushel a month. On that basis the board pays about twice the interest: 218% of it to March, 210% to May and 198% to July. A commercial bin costs more. Topflight Grain, a cooperative based in Monticello, Illinois, posts 4.5 cents a month for corn in its 2026–27 fall policy [13]. Add interest on $4.18 corn and the monthly cost is 6.8 cents. Against that, the carry covers 71% of the cost to March, 68% to May and 64% to July (Crop Root Zone calculation). The 13-cent in-charge is not counted in those percentages.
Ground Truth: The spread structure answers most of the storage question before basis is considered. The board pays about twice the interest, so an owned bin gets back more than its cost of money. It pays only two-thirds of a commercial elevator's posted rate, so paying someone else to store corn is a bet on basis rather than on carry. The Jul–Sep inversion sets a clear deadline. Corn held unhedged past July is a bet on the 2027 crop, not a storage trade.
2. The basis: where harvest cash sits this week
What's new: Harvest basis is wide in Iowa and moderate in Illinois. Iowa's state-average bid of $3.99 was 41 under December. The interior ranged from 63 under in the Northeast to 16 under in the Southeast. Council Bluffs terminals bid 20 to 23 under [1]. Central Illinois country elevators averaged 22 under. Central Illinois processors bid 14 under to 10 over, and Mississippi River barge-loading elevators bid 26 over [2].
Evidence:
| Location (Nov 5, 2026) | Range (¢ vs Dec) | Avg cash ($/bu) | Avg basis (¢)* | Cents under Dec |
|---|---|---|---|---|
| Iowa, Northeast | −63 to −35 | 3.92 | −48 | ██████████ |
| Iowa, North Central | −48 to −40 | 3.98 | −42 | █████████░ |
| Nebraska, East | −52 to −33 | 3.98 | −42 | █████████░ |
| Iowa, state average | — | 3.99 | −41 | █████████░ |
| Iowa, Northwest | −45 to −32 | 4.02 | −38 | ████████░░ |
| Illinois, North Central | −35 to −15 | 4.12 | −28 | ██████░░░░ |
| Nebraska, Central | −40 to −20 | 4.15 | −25 | █████░░░░░ |
| Illinois, central country avg | — | 4.18 | −22 | █████░░░░░ |
| Iowa, Council Bluffs terminals | −23 to −20 | 4.19 | −22 | █████░░░░░ |
| Illinois, central processors | −14 to +10 | 4.40 | 0 | ░░░░░░░░░░ |
Sources: USDA AMS Iowa Daily Cash Grain Bids [1], Illinois Grain Bids [2] and Nebraska Daily Elevator Grain Bids [3], all Nov 5, 2026. Delivered by truck, current delivery. *Average cash price less December futures at $4.40; state averages are as printed by AMS.
Iowa's wide basis has a supply explanation. University of Illinois economists put Iowa's 2026 storage pressure at 109%, meaning September 1 grain stocks plus this year's projected corn, soybean and sorghum crops exceed the state's storage capacity by 9%. Illinois was at 105%, Nebraska 108% and Missouri 119%. The national figure was 99% (Dhakal and Janzen, farmdoc daily, Oct 7, 2026) [7]. Purdue's September basis update recorded southeast Iowa corn basis at 53 under, the lowest on record for that week (Purdue, Sep 25, 2026) [9].
Harvest timing matters as much as the level. Across 136 elevators from 2010 to 2025, corn basis typically bottomed in mid-October, near the week harvest reached 50%, and started to recover as harvest passed about three-quarters. State-level harvest lows averaged a little over 16 cents below the late-November level. The Illinois median was 19 cents, and weak years ran to 30 to 50 cents (Belman, Janzen and Vizcarrondo, farmdoc daily, Sep 17, 2026) [8]. At 74% harvested, the country is at the point where that recovery historically starts.
The Illinois report gives one forward bid that shows what elevators will pay to defer delivery. North Central Illinois elevators bid an average of $4.27 for January delivery, 27 under March. That is 15.2 cents above the same elevators' spot average [2].
Ground Truth: The best case for storage this week is in Iowa and eastern Nebraska, not central Illinois. Both regions have tight storage and are paying 40-plus cents under December. Central Illinois is already 22 under, with processors near even. The basis that a stored bushel is meant to recover has largely recovered there already. An Illinois grower who stores corn there is mostly earning the futures carry. An Iowa grower can earn the carry and part of the basis recovery as well.
3. The cost: interest, shrink and rent, route by route
What's new: Interest rates are lower than a year ago but still well above where they were before 2022. The Federal Reserve's survey of bank lending to farmers put the average third-quarter operating-loan rate at 6.66%, down 36 basis points from 2025. The 2020 rate was 3.20% (Mashange, farmdoc daily, Oct 29, 2026) [10]. The survey week was the first full business week of August, so this is the most recent quarterly rate available.
Evidence: We priced three routes from Iowa State's cost-of-storage framework (ISU Ag Decision Maker A2-33) [11]. That framework treats an existing bin's ownership cost as sunk. It counts the extra costs a stored bushel carries that a harvest sale avoids:
- Extra handling: 2.0–2.5 cents.
- Aeration: 0.2–0.3 cent.
- Shrink: 1.25% for each extra moisture point removed.
- Handling and storage loss: 0.5–1%.
We assume stored corn is dried one point further, to 14%. Topflight's own policy shrinks warehouse corn to 14% and cash sales to 15% [13]. We price that point at the Iowa custom bin-dryer average of 5.0 cents a point. Bin rental is the Iowa survey average of 3.0 cents a month (ISU Custom Rate Survey, Mar 2026) [12]. Commercial storage uses Topflight's posted rate of 13 cents in-charge plus 4.5 cents a month, with its 1.4% shrink factor [13]. Interest is 6.66% on the harvest bid.
| Cost to hold to early May (6 months), ¢/bu | Owned bin, Iowa | Rented bin, Iowa | Commercial, central IL |
|---|---|---|---|
| Harvest bid the interest is charged on | $3.99 | $3.99 | $4.18 |
| Extra handling | 2.25 | 2.25 | — |
| Extra drying, 15% to 14% | 5.00* | 5.00* | — |
| Extra drying shrink, 1 point | 4.99 | 4.99 | 5.85 |
| Handling and storage loss, 0.5% | 2.00* | 2.00* | — |
| Aeration, 6 months | 1.50* | 1.50* | — |
| Bin rent or storage charge | — | 18.00 | 40.00 |
| Interest at 6.66% | 13.28 | 13.28 | 13.92 |
| Total, to May | 29.0 | 47.0 | 59.8 |
| Total, to March (4 months) | 24.1 | 36.1 | 46.1 |
| Total, to July (8 months) | 33.9 | 57.9 | 73.4 |
Sources: ISU AgDM A2-33 [11]; ISU A3-10 [12]; Topflight Grain 2026–27 rates [13]; farmdoc daily, Oct 29, 2026 [10]. All totals are Crop Root Zone estimates. *Softest lines. The 5.0-cent drying figure is a custom rate that includes labor, so it overstates an owner's fuel cost. The loss uses the low end of ISU's range. The aeration line assumes ISU's 0.2–0.3 cent is a monthly rate. The commercial column includes no in or out handling fees and no drying; elevator schedules vary on both.
Topflight's schedule is one elevator's, and Iowa schedules can run higher. Key Cooperative posts 7 cents a month for warehouse-receipt corn from September 2026 through August 2027, plus 10 cents in and 10 cents out [14]. At that rate the commercial column rises by more than 15 cents to May. The rented-bin column is just as sensitive to how the rent is quoted. Iowa's survey also shows a per-year rate averaging 19 cents [12]. At that rate a July hold costs 52.9 cents, not 57.9 (Crop Root Zone calculation).
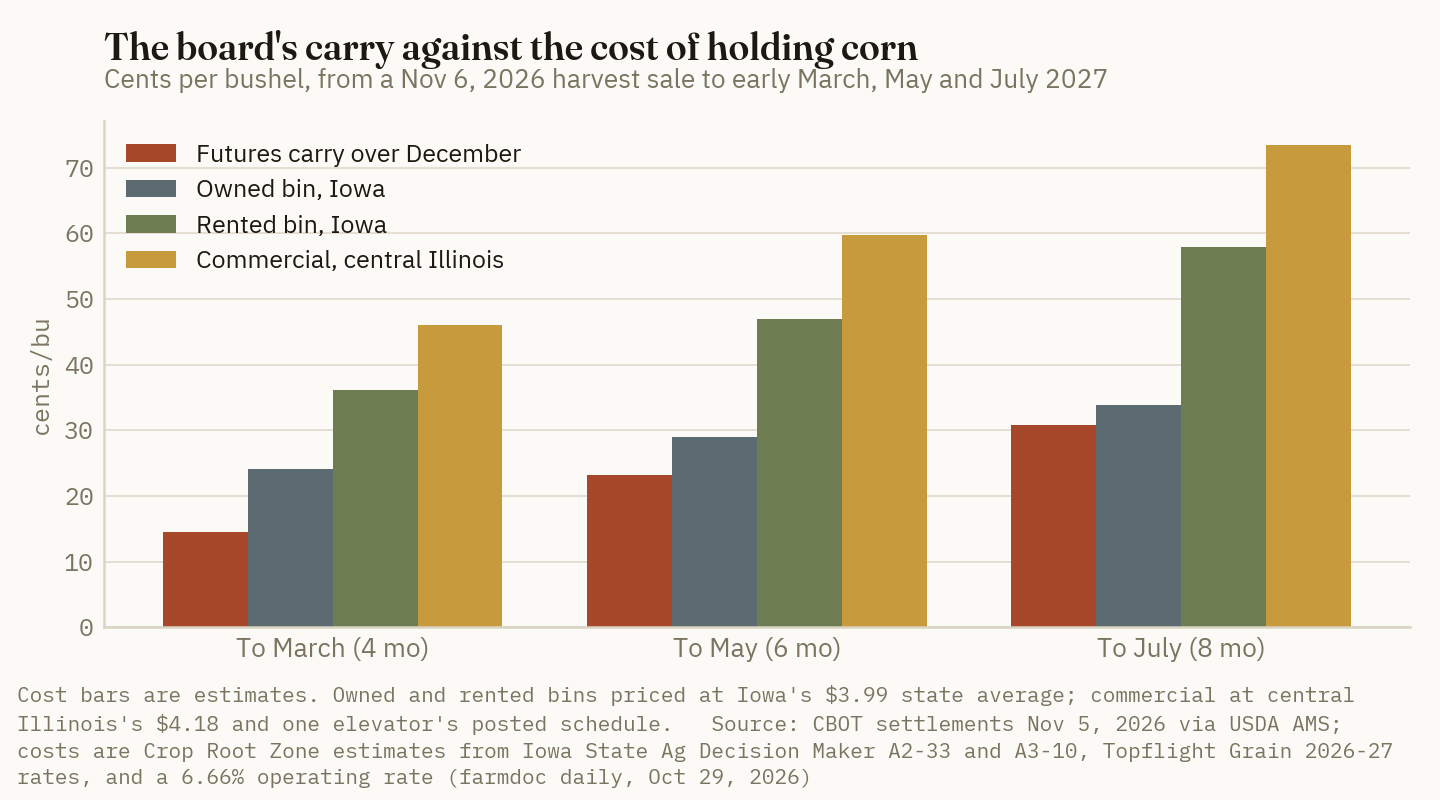
Interest is the largest line in the owned-bin column, at about 2.2 cents a month. The one-time costs total about 14 cents, and they make short holds expensive. Drying one more point costs about 10 cents a bushel in fuel and shrink. That is two-thirds of the March carry before a month of interest has accrued.
Ground Truth: Interest is not what makes stored corn expensive this year. At 6.66% it costs about 2.2 cents a month, which the board covers twice over. The real costs are rent and moisture. Commercial rent doubles the cost of an owned bin, and every point of moisture removed below 15% costs about a dime. A grower who stores corn at 14% to be safe and sells it in March has spent most of the carry on drying.
4. The break-even: how much basis each route needs
What's new: The futures carry and the storage cost are now both known, so the remaining unknown is the basis at the time of sale. We solved for the basis each route needs at its sale date to match the harvest bid. The calculation assumes the deferred futures price is locked in, by a short futures position or a hedge-to-arrive contract. Without that lock, futures can move either way, and Section 5 covers that risk.
Evidence: Each required basis is quoted against the futures contract for that delivery period, set beside this week's harvest basis.
| Route | Harvest basis now | To March: basis needed (narrowing) | To May | To July |
|---|---|---|---|---|
| Iowa, owned bin | −41Z | −31H (10¢) | −35K (6¢) | −38N (3¢) |
| Iowa, rented bin | −41Z | −19H (22¢) | −17K (24¢) | −14N (27¢) |
| Iowa, commercial at Topflight rates† | −41Z | −10H (31¢) | −5K (36¢) | +1N (42¢) |
| Central Illinois, owned bin | −22Z | −12H (10¢) | −15K (7¢) | −18N (4¢) |
| Central Illinois, rented bin† | −22Z | 0H (22¢) | +3K (25¢) | +6N (28¢) |
| Central Illinois, commercial | −22Z | +10H (32¢) | +15K (37¢) | +21N (43¢) |
Source: Crop Root Zone calculation. Required basis = harvest cash bid + storage cost − deferred futures settle (Nov 5, 2026). Cash bids and settlements from USDA AMS [1][2]; costs from Section 3. †Rates borrowed across states: Topflight is an Illinois elevator, and the bin rent is Iowa's survey average. All are estimates.
The owned-bin result is the clearest finding in the piece. In both states the owned bin breaks even with basis narrowing of only 3 to 10 cents, and the bar is lowest on the longest hold, because the carry builds faster than interest does. The farmdoc study found state-level harvest lows averaging just over 16 cents below the late-November level [8]. On that history, the usual post-harvest recovery alone would cover the owned bin's requirement.
A rented bin needs 22 to 28 cents. That is more than the typical 16-to-19-cent harvest dip, so basis has to keep strengthening into spring. In Iowa, at 41 under, that is a reasonable bet. In central Illinois it would mean country basis at or above the March, May or July futures price. Central Illinois processors are bidding 14 under to 10 over December this week [2].
Commercial storage needs 31 to 43 cents. That falls inside the 30-to-50-cent range farmdoc found only for Illinois's weak-basis years [8], and this year's Illinois basis is not unusually weak.
6 cents
How much Iowa's 41-under harvest basis has to narrow, against May futures, for corn hedged to May in an owned bin to beat selling today. Commercial storage needs 36. (Crop Root Zone calculation from USDA AMS, Nov 5, 2026; ISU Ag Decision Maker; farmdoc daily)
Short holds are a separate case, and they are where the one-time costs matter most. The North Central Illinois January bid pays 15.2 cents to wait about two months [2]. If the corn is delivered at harvest moisture, the extra drying and shrink lines drop out. Handling, 0.5% loss and two months of interest and aeration total about 9.4 cents, leaving about 6 cents ahead. Dry the same corn to 14% and the cost rises to about 19.5 cents, which loses 4 cents against the bid (Crop Root Zone calculation).
Ground Truth: Two growers can store identical corn in identical bins and get opposite results, depending on moisture and how long they hold. Corn going out by January should go in at the moisture the buyer accepts. Corn held to May or July has to be dried down, and it needs the full carry to pay for that. The poor middle option is corn dried for spring and sold in January, because it pays the spring drying cost but earns only the January premium.
5. What moves the answer, and what the table leaves out
What's new: All of the break-evens above assume the deferred futures price is locked at Thursday's settle. Most stored corn is not hedged. Carl Zulauf's study of U.S. cash prices since 1973 found that the average cash price rises from October to a peak in June at about 113% of the October level. It found that net returns to cash storage and to hedged storage ending by June do not differ statistically from zero after interest and commercial storage costs. Cash storage beyond June generally loses money (Zulauf, farmdoc daily, Oct 8, 2025) [15].
Evidence: How much each assumption moves the owned-bin break-even:
| Change | Effect on owned-bin cost (¢/bu) |
|---|---|
| Operating rate +1 point (7.66%), 8-month hold | +2.7 |
| Corn dried one more point (to 13%) | +10.0 |
| Owner's drying fuel at half the custom rate | −2.5 |
| Loss at 1% instead of 0.5% (ISU high end) | +2.0 |
| Harvest bid +10¢ (interest, shrink and loss only) | +0.5 to +0.6 |
| Unhedged: December-to-deferred spread narrows 10¢ by sale | +10.0 |
Source: Crop Root Zone sensitivities on the Iowa owned-bin case, $3.99 bid, 6.66% rate. Not forecasts.
Only the last line is large enough to change the decision. An unhedged bushel is exposed to the whole futures price, so a 10-cent fall in May futures costs it 10 cents. Rate, loss and price assumptions each move the cost by 3 cents or less. The choice between hedging and holding open, and the moisture target, each matter more than every cost line in the table combined.
Three limits apply.
- No forward spring basis is public. None of the state reports we used printed a forward basis for March, May or July delivery, so the required basis in Section 4 is a target, not a quote. Ask your elevator for a spring bid. A bid at or above the target in Section 4 means storage pays before any futures risk is taken.
- Bin ownership cost is excluded. It is left out deliberately, following ISU's sunk-cost treatment [11]. Whether to build new storage is a separate, multi-year question, which our July piece took up [16].
- The November WASDE could move both inputs. A crop revision in either direction would change the carry and Iowa's storage pressure together.
Ground Truth: This season the store-or-sell decision comes down to ownership and hedging, not to a view on prices. Owned, hedged storage needs a basis gain smaller than a normal harvest recovery, and that holds in both Iowa and Illinois. Rented space works in Iowa if basis improves beyond the harvest recovery, and seldom works in central Illinois. Commercial storage at posted rates generally loses on the carry alone. Growers without their own bins can get most of the carry by selling the cash corn and buying deferred futures or call options, but that position no longer captures any basis gain. Corn stored unhedged should be sold or hedged by July, because the market pays nothing to hold it past then.
References
- USDA AMS Livestock, Poultry and Grain Market News, Iowa Daily Cash Grain Bids, Nov 5, 2026 (CBOT settlements as of Nov 5; country elevator and terminal corn bids; state average $3.99, −41Z) — https://www.ams.usda.gov/mnreports/ams_2850.pdf ; https://mymarketnews.ams.usda.gov/viewReport/2850
- USDA AMS, Illinois Grain Bids, Nov 5, 2026 (central Illinois country average $4.18, −22Z; January-delivery bids vs March; processor and barge bids) — https://www.ams.usda.gov/mnreports/ams_3192.pdf
- USDA AMS, Nebraska Daily Elevator Grain Bids, Nov 5, 2026 — https://www.ams.usda.gov/mnreports/ams_3225.pdf
- Brownfield Ag News, "Closing Grain and Livestock Futures: November 5, 2026" (Dec corn $4.40, down 4¼) — https://brownfieldagnews.com/news/closing-grain-and-livestock-futures-november-5-2026/
- USDA World Agricultural Outlook Board, World Agricultural Supply and Demand Estimates, WASDE-676, Oct 9, 2026 — https://www.usda.gov/oce/commodity/wasde/wasde1026.pdf
- DTN/Progressive Farmer, "USDA Crop Progress: Corn 74% Harvested," Nov 2, 2026 — https://www.dtnpf.com/agriculture/web/ag/news/article/2026/11/02/usda-crop-progress-corn-74-harvested
- Dhakal, A.R. and J. Janzen, "Enough Room for the Harvest? Grain Storage Pressure in the Corn Belt," farmdoc daily (16):181, University of Illinois, Oct 7, 2026 — https://farmdocdaily.illinois.edu/2026/10/enough-room-for-the-harvest-grain-storage-pressure-in-the-corn-belt.html
- Belman, A., J. Janzen and E. Vizcarrondo, "Under Pressure: The Size and Timing of the Harvest Low in Corn Basis," farmdoc daily (16):167, University of Illinois, Sep 17, 2026 — https://farmdocdaily.illinois.edu/2026/09/under-pressure-the-size-and-timing-of-the-harvest-low-in-corn-basis.html
- Strine, J., "September 2026 Basis Update: The Harvest Dip," Purdue Center for Commercial Agriculture, Sep 25, 2026 — https://ag.purdue.edu/commercialag/home/wp-content/uploads/2026/09/20260925_Strine_CropBasis-HarvestDip.pdf
- Mashange, G., "Smaller Loans Drive Decline in Non-Real Estate Farm Lending at Commercial Banks in Q3 2026," farmdoc daily (16):197, University of Illinois, Oct 29, 2026 (Federal Reserve Survey of Terms of Lending to Farmers, via Federal Reserve Bank of Kansas City) — https://farmdocdaily.illinois.edu/2026/10/smaller-loans-drive-decline-in-non-real-estate-farm-lending-at-commercial-banks-in-q3-2026.html
- Edwards, W., "Cost of Storing Grain," Iowa State University Extension, Ag Decision Maker File A2-33, updated May 2023 — https://www.extension.iastate.edu/agdm/crops/html/a2-33.html
- Iowa State University Extension, "2026 Iowa Farm Custom Rate Survey," Ag Decision Maker File A3-10 (FM 1698), Mar 2026 — https://www.extension.iastate.edu/agdm/crops/pdf/a3-10.pdf
- Topflight Grain Cooperative (Monticello, Ill.), Service Rates, 2026–2027 Fall Policy, accessed Nov 6, 2026 — https://www.topflightgrain.com/service-rates/
- Key Cooperative, Grain (warehouse receipt storage Sep 1, 2026–Aug 31, 2027; handling and shrink), accessed Nov 6, 2026 — https://www.keycoop.com/grain
- Zulauf, C., "Net Return to Storing US Corn and Soybeans Since 1973," farmdoc daily (15):185, University of Illinois, Oct 8, 2025 — https://farmdocdaily.illinois.edu/2025/10/net-return-to-storing-us-corn-and-soybeans-since-1973.html
- Crop Root Zone, "16 Billion Bushels Need Somewhere to Go: On-Farm Storage Economics Into the 2026 Harvest," TRZ-0029, Jul 23, 2026.
Disclosures
Crop Root Zone is an independent publication. Nothing here is investment advice. Market calls, where included, reflect the editors' own read and are not a recommendation to buy or sell any security.
2027 Corn PLC Pays Nothing Above $4.34. ARC-CO Starts Paying at $4.46, and at USDA's $4.20 Baseline It Pays $53 a Base Acre to PLC's $20 in Champaign County.
The 2027 sign-up opened Nov. 2 and runs to Mar. 15. By our calculation corn's effective reference price slips to $4.34 and its ARC benchmark to $4.96. At WASDE's $4.70 and farmdoc's $5.00 budget price neither program pays, so the 2027 election is a bet on a price drop. ARC-CO covers more of that drop on corn and soybean base unless county yields beat benchmark.
FSA opened enrollment for the 2027 crop year on Monday, November 2. The window runs through March 15, 2027 (USDA FSA, Sep 15, 2026 [1]; DTN/Progressive Farmer, Sep 17, 2026 [2]). For six weeks it overlaps the 2026 sign-up, which closes December 11 (farmdoc daily, Oct 27, 2026 [3]). The parameters for 2027 are already fixed by arithmetic. The One Big Beautiful Bill Act's formulas, applied to the final 2021–2025 season-average prices, put corn's PLC effective reference price at $4.34 a bushel, down from $4.42 for 2026. ARC-CO's corn benchmark price falls to $4.96 from $5.03. USDA's latest projection for the 2026/27 crop is $4.70 (WASDE, Oct 9, 2026, via [3]). The University of Illinois' 2027 budgets assume $5.00 [4]. At either price neither program pays on corn. This piece works out where each program starts paying in 2027 and which one a central Illinois corn and soybean farm should expect to favor.
1. The 2027 numbers, and why they're already known
What's new: FSA has not posted 2027 effective reference prices or benchmark prices. It does not need to before the formula can be run. Every input is now final. NASS published the 2025/26 corn and soybean averages on September 29: $4.16 and $10.50 (USDA NASS, via Crop Root Zone TRZ-0251 [11]). Wheat's 2025/26 price of $5.06 was final in June [11].
Evidence: The effective reference price is the lesser of 115% of the statutory reference price, or the greater of the statutory price and 88% of the five-year Olympic average of season-average prices, which drops the high and low years (Federal Register, Jan 12, 2026 [5]). For 2027 the five years are 2021/22 through 2025/26. The OBBBA statutory prices are $4.10 for corn, $10.00 for soybeans and $6.35 for wheat, and they hold flat until the 0.5% annual escalator starts in 2031 [5].
ARC-CO's benchmark price is the Olympic average of the same five years, with each year's price first raised to the current year's effective reference price if it is lower. FSA's own 2026 table shows that floor at work. It lifts wheat's 2020/21 price of $5.05 and its 2024/25 price of $5.52 to $6.35 before averaging (USDA FSA, Table 4, Oct 30, 2026 [6]). We applied the same method to 2027.
| Corn 2026 | Corn 2027 | Soybeans 2026 | Soybeans 2027 | Wheat 2026 | Wheat 2027 | |
|---|---|---|---|---|---|---|
| Statutory reference price | 4.10 | 4.10 | 10.00 | 10.00 | 6.35 | 6.35 |
| PLC effective reference price (PLC pays below this) | 4.42 | 4.34* | 10.71 | 10.62* | 6.35 | 6.35 |
| ARC-CO benchmark price | 5.03 | 4.96* | 12.17 | 12.11* | 6.98 | 6.98* |
| ARC-CO pays below this, county yield at benchmark (90%) | 4.53 | 4.46* | 10.95 | 10.90* | 6.28 | 6.28* |
| ARC-CO hits its 12% cap at this price, county yield at benchmark (78%) | 3.92 | 3.87* | 9.49 | 9.45* | 5.44 | 5.44* |
Basis: $ per bushel, national season-average price. Source: 2026 values from USDA FSA Tables 3 and 4, Oct 30, 2026 [6][7]. Final season-average prices from FSA Table 4 [6], USDA's long-term baseline tables [8] and NASS via TRZ-0251 [11]. *Crop Root Zone calculation from the formula in the Federal Register [5]. These are not FSA-published values. An independent calculation published by AGSIST on Nov 5, 2026 reaches the same six 2027 figures [9].
Two things stand out. First, the 2027 decline is small: 8 cents on corn's reference price and 7 cents on its benchmark. The 2025/26 prices replacing 2020/21 in the window are low, but the Olympic average drops one low year anyway. Second, the effective-reference-price floor is now doing visible work inside ARC. Without it, the 2027 benchmark would be $4.93 for corn, $12.07 for soybeans and $6.70 for wheat. The floor adds 3, 4 and 28 cents respectively (Crop Root Zone calculation).
$4.46/bu
The 2027/28 corn season-average price below which ARC-CO starts paying in a county whose yield comes in at benchmark. PLC does not start until $4.34, 12 cents lower. (Crop Root Zone calculation from the Federal Register formula [5] and FSA Table 4 [6])
Ground Truth: In August we read ARC's corn advantage as a moving average that was "scheduled to close" (TRZ-0068 [12]). It does not close in 2027. ARC's head start over PLC on corn is 12 cents, against 11 cents in 2026, because the reference-price floor now props up the two weakest years in the window. The gap closes when the benchmark falls below about 111% of the effective reference price, the point where 90% of the benchmark drops under PLC's trigger. Our arithmetic puts that point in 2028, when 2021's $6.00 corn leaves the window. Suppose 2026/27 corn settles near WASDE's $4.70. Then the 2028 reference price drops back to the $4.10 statutory floor, the benchmark falls to about $4.50, and ARC-CO's trigger at benchmark yields falls to about $4.05, under PLC's. That is our estimate, not an FSA figure. The upshot is that 2027 is likely the last year ARC-CO carries a clear structural edge on corn. Make the 2027 election as a one-year call and do not sign a multi-year contract on the strength of it.
2. Where the price outlook sits against the triggers
What's new: No official 2027/28 price forecast exists yet. USDA's first WASDE for that crop comes in May 2027. The public anchors are the current crop's projection, USDA's long-term baseline, and the price a university budget uses.
Evidence: The October WASDE puts the 2026/27 season-average price at $4.70 for corn, $12.00 for soybeans and $6.30 for wheat [3][7]. USDA's long-term baseline, published in February but completed in November 2025, projects 2027/28 at $4.20 for corn, $10.40 for soybeans and $5.60 for wheat (USDA, Agricultural Projections to 2035, Feb 2026 [8]). That baseline is stale. It had 2026/27 corn at $4.10, 60 cents under where WASDE now has it. Farmdoc's 2027 central Illinois budgets use $5.00 corn and $12.00 soybeans (farmdoc, 2027 Crop Budgets, Aug 2026 [4]).
| 2027 corn price reference | $/bu | |
|---|---|---|
| farmdoc 2027 budget price | 5.00 | ██████████ |
| ARC-CO benchmark price, 2027* | 4.96 | ██████████ |
| WASDE 2026/27 projection (Oct) | 4.70 | █████████░ |
| ARC-CO trigger at benchmark yield, 2027* | 4.46 | █████████░ |
| PLC effective reference price, 2027* | 4.34 | █████████░ |
| USDA baseline 2027/28 (completed Nov 2025) | 4.20 | ████████░░ |
| ARC-CO cap reached at benchmark yield, 2027* | 3.87 | ████████░░ |
Basis: $ per bushel, national season-average price. Source: farmdoc [4]; USDA WASDE Oct 9, 2026 via farmdoc daily [3]; USDA long-term baseline [8]. *Crop Root Zone calculation [5][6]. Bars are scaled to $5.00.
The soybean picture is the same with wider spacing. WASDE's $12.00 for 2026/27 and the budget's $12.00 sit just under the $12.11 benchmark, well above ARC-CO's $10.90 trigger and PLC's $10.62. Only the stale baseline's $10.40 falls below both triggers. Wheat is the exception. WASDE's $6.30 is already a nickel under the $6.35 reference price for 2026, and the baseline's $5.60 for 2027/28 would make the PLC rate 75 cents.
For corn and soybeans, then, the 2027 election is not about the expected price. At the prices most forecasters hold, neither program pays. The election decides which program pays if prices fall roughly 25 to 65 cents on corn, or $1.10 or more on soybeans.
Ground Truth: Treat the 2027 election as buying a put. Do not book it as income. Farmdoc's 2027 Illinois budgets carry $17 an acre of ARC/PLC [4], but at their own $5.00 corn and $12.00 soybean prices our calculation finds no payment on either crop. A lender or landlord reading that $17 as cash flow is reading a probability-weighted figure as a receivable. Budget the 2027 payment at zero and treat the election as the choice of which put to own.
3. Champaign County: what each program pays when prices do fall
What's new: To put dollars on the downside, we ran both programs for 2027 on non-irrigated corn and soybeans in Champaign County, Illinois. It is the county farmdoc uses in its own 2026 example [3].
Evidence: FSA's 2026 county file sets Champaign's non-irrigated benchmark yields at 233.26 bushels for corn and 74.55 for soybeans (USDA FSA, ARC-CO 2026 data, Jan 16, 2026 [10]). The 2027 window drops 2020 and adds the 2025 county yield. FSA's 2025 file reports that yield as 234.2 bushels of corn and 70.72 of soybeans (USDA FSA, ARC-CO 2025 data, Sep 1, 2026 [13]). We estimate 2027 benchmarks of about 236 and 75 bushels. FSA has not published them. The county-average PLC yields are 167.9 bushels for corn and 51.3 for soybeans (USDA FSA, PLC county yields, Apr 17, 2025 [14]). An individual farm's PLC yield, on its FSA-156EZ, will differ.
| Champaign Co., Ill., 2027 | 2027/28 MYA ($/bu) | ARC-CO, yield 5% above benchmark | ARC-CO, yield at benchmark | ARC-CO, yield 5% below benchmark | PLC |
|---|---|---|---|---|---|
| Corn | 5.00 | 0.00 | 0.00 | 0.00 | 0.00 |
| Corn | 4.70 | 0.00 | 0.00 | 0.00 | 0.00 |
| Corn | 4.20 | 10.83 | 52.96 | 95.08 | 19.98 |
| Corn | 3.90 | 74.02 | 113.14 | 119.40 (cap) | 62.79 |
| Soybeans | 12.00 | 0.00 | 0.00 | 0.00 | 0.00 |
| Soybeans | 11.40 | 0.00 | 0.00 | 4.40 | 0.00 |
| Soybeans | 10.40 | 0.00 | 31.81 | 64.96 | 9.59 |
| Soybeans | 9.90 | 32.13 | 63.69 | 92.64 | 31.40 |
Basis: $ per base acre after the 85% payment-acre factor, before sequestration. All values are Crop Root Zone estimates. They use the calculated 2027 prices in Section 1, estimated 2027 benchmark yields of 236 bu (corn) and 75 bu (soybeans) built from FSA's 2025 and 2026 county files [10][13], and FSA's county-average PLC yields [14]. The bolded rows use USDA's 2027/28 baseline prices [8]. ARC-CO's cap is 12% of benchmark revenue: $140.47 an acre for corn and $108.99 for soybeans before the 85% factor.
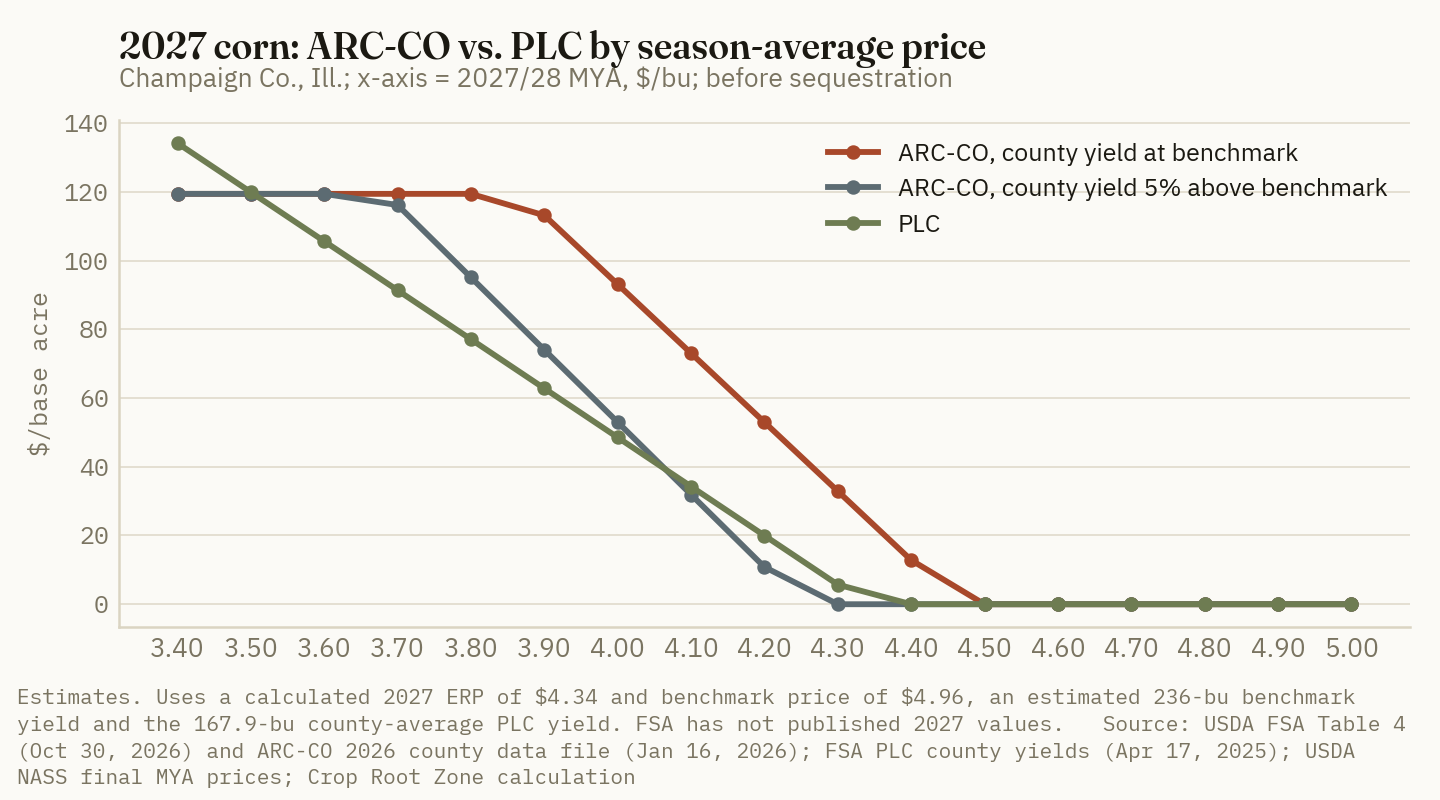
At USDA's baseline prices, ARC-CO pays about $53 a corn base acre and $32 a soybean base acre in a year with benchmark yields. PLC pays about $20 and $10. The crossover points are what matter for the election:
- Corn, county yield at benchmark: ARC-CO pays more at every price from $4.46 down to about $3.50. Below that, PLC's uncapped rate overtakes ARC-CO's $119.40 ceiling.
- Corn, county yield 5% above benchmark: PLC pays more between about $4.07 and $4.34. ARC-CO pays more from $4.07 down to $3.50.
- Soybeans, yield 5% above benchmark: PLC pays more between about $9.93 and $10.62. ARC-CO pays more below that until its cap.
Crossover prices are Crop Root Zone calculations on the assumptions above.
For reference, farmdoc's simulation for 2026, the year before this one, puts the expected Champaign corn payment at $44.98 a base acre under ARC-CO and $15.80 under PLC. It puts the chance of any payment at 54% for ARC-CO and 29% for PLC (farmdoc daily, Oct 27, 2026 [3]). That run used a 171-bushel PLC yield and 2026 parameters. Farmdoc has not published a 2027 run.
Ground Truth: The only 2027 outcome in which PLC clearly beats ARC-CO on Champaign corn is a big county crop and a price that slips no more than about 27 cents under $4.34. That is a real scenario, since big crops are what pull prices down. But PLC's edge there is small, and its payment tops out near $39 an acre before ARC-CO catches up. The corresponding ARC-CO losses, a short crop at $4.20 or any crop at $3.90, run $53 to $119. For most central Corn Belt corn and soybean base, ARC-CO is still the 2027 election. Farms with a PLC yield well above the county's 167.9 bushels should rerun the numbers with their own figure. PLC scales with that yield and ARC-CO does not.
4. Who should not default to ARC-CO, and the sign-up mechanics
What's new: The 2027 sign-up is running alongside the last five weeks of the 2026 one. DTN reports that farmers may sign a new multi-year contract covering 2026 through 2031, and that those who opt out of it enroll for 2027 in the November 2 to March 15 window [2]. For 2026, a farm that files no new election keeps its 2025 one but gets no 2026 payment [1][5]. Enrollment is a separate signed contract from the election. Under Secretary Richard Fordyce has said farms that don't enroll are ineligible for that year's payments (RFD-TV, Sep 23, 2026 [15]).
Evidence: We did not find FSA language on whether a multi-year contract lets the program election itself change in later years. A producer who signs one in December to finish 2026 should confirm with the county office whether that locks in the 2027 election. Some other points:
| Situation | 2027 lean | Why |
|---|---|---|
| Corn or soybean base, county yields near or below benchmark | ARC-CO | Pays from $4.46 corn and $10.90 soybeans, and pays more down to about $3.50 and $8.50* |
| Corn base where the county routinely beats benchmark by 5% or more | Close. Run the numbers | PLC wins between about $4.07 and $4.34* |
| Farm PLC yield well above the county average | Lean PLC | The PLC payment rises in proportion to the farm's PLC yield |
| Wheat base | PLC in most counties | ARC-CO's $6.98 benchmark is the same as 2026. The $5.60 baseline would pay 75 cents under PLC [8], and farmdoc finds a "slight edge towards PLC" for 2026 [3] |
| Farm-level losses that the county average misses | Look at ARC-IC | Farmdoc flags ARC-IC for localized yield losses [3] |
Source: Crop Root Zone calculations [5][6][10][14]; farmdoc daily [3]; USDA baseline [8]. *Champaign County assumptions from Section 3.
Timing also cuts against waiting. Enrollment closes March 15, 2027. That is the same date as the sales closing for spring crop insurance across most of the Corn Belt, and DTN notes SCO and ECO can now be added regardless of the ARC or PLC election [2]. The 2027 county yields that settle ARC-CO won't be published until mid-2028, and any 2027 payment arrives after October 1, 2028 [3][5].
Ground Truth: File the 2026 election first. It has the hard December 11 deadline and the larger stake, since the 2026 crop is in the bin and farmdoc's tools are still being updated through the November 10 WASDE [3]. Then use the November and January reports to make the 2027 election before planting. The 2027 decision is almost entirely about price risk you can't see yet, so an extra two months of information costs nothing. Making both elections in one December visit only saves a trip to the county office.
References
- USDA Farm Service Agency, "USDA Announces 2026 and 2027 Enrollment for Key Price and Revenue Safety Net Programs," Sep 15, 2026. https://www.fsa.usda.gov/news-events/news/09-15-2026/usda-announces-2026-2027-enrollment-key-price-revenue-safety-net (page timed out on our fetch; content confirmed through [2], [3] and syndicated copies)
- DTN/Progressive Farmer, "ARC/PLC Enrollment Begins," Sep 17, 2026. https://www.dtnpf.com/agriculture/web/ag/crops/article/2026/09/17/usda-opens-arcplc-enrollment-2026
- N. Paulson, H. Monaco, G. Schnitkey and C. Zulauf, "The 2026 ARC/PLC Decision: ARC-CO vs PLC," farmdoc daily (16):195, University of Illinois, Oct 27, 2026. https://farmdocdaily.illinois.edu/2026/10/the-2026-arc-plc-decision-arc-co-vs-plc.html
- G. Schnitkey and N. Paulson, "2027 Crop Budgets," Tables 1–2, farmdoc, University of Illinois, original release Aug 2026. https://farmdoc.illinois.edu/assets/management/crop-budgets/crop_budgets_2026_Aug.pdf
- Federal Register, "Changes to Agriculture Risk Coverage, Price Loss Coverage, and Dairy Margin Coverage Programs," 91 FR, Jan 12, 2026. https://www.govinfo.gov/content/pkg/FR-2026-01-12/pdf/2026-00313.pdf
- USDA Farm Service Agency, "Table 4. 2026 Benchmark and Actual Price Calculations for County Agricultural Risk Coverage (ARC-CO)," Oct 30, 2026. https://www.fsa.usda.gov/sites/default/files/2026-11/2026_ARC_CO.xlsx
- USDA Farm Service Agency, "Table 3. Projected 2026 Price Loss Coverage (PLC) Payment Rates," Oct 30, 2026. https://www.fsa.usda.gov/sites/default/files/2026-11/2026_PLC.xlsx
- USDA, USDA Agricultural Projections to 2035, OCE-2026-1, Feb 2026 (projections completed Nov 2025), Tables 6 and 8 and the wheat table. https://www.ers.usda.gov/media/20856/oce-2026-1.pdf
- AGSIST, "ARC or PLC" calculator inputs page, updated Nov 5, 2026 (independent estimate; used as a cross-check only). https://agsist.com/arc-plc
- USDA Farm Service Agency, "ARC-CO Trend Adjusted Yields, Benchmark Yields and Guarantee Revenues for Program Year 2026," data file dated Jan 16, 2026. https://www.fsa.usda.gov/sites/default/files/2026-01/arcco_2026_data%20%282026-01-16%29.xlsx
- Crop Root Zone, TRZ-0251, "The Final 2025 Corn Price Is $4.16, a Penny Above FSA's Projection…," Oct 2, 2026 (citing USDA NASS, Agricultural Prices, Sep 29, 2026).
- Crop Root Zone, TRZ-0068, "You Have 26 Days on Base Acres and No Date at All on the Election," Aug 5, 2026.
- USDA Farm Service Agency, "ARC-CO Trend Adjusted Yields, Benchmark Yields and Guarantee Revenues for Program Year 2025," data file dated Sep 1, 2026. https://www.fsa.usda.gov/sites/default/files/2026-09/arcco_2025_data%20%282026-09-01%29.xlsx
- USDA Farm Service Agency, "Program Year 2025 Average PLC Yields by County," Apr 17, 2025. https://www.fsa.usda.gov/sites/default/files/2025-04/plc_county_yields_py2025.xlsx
- T. St. James, "ARC Enrollment Deadline Could Affect 2026 Farm Payments," RFD-TV, Sep 23, 2026. https://www.rfdtv.com/arc-enrollment-deadline-could-affect-2026-farm-payments
Disclosures
Crop Root Zone is an independent publication. Nothing here is investment advice. Market calls, where included, reflect the editors' own read and are not a recommendation to buy or sell any security.
Corn Is 23 Cents of Every Dollar It Costs to Raise an Iowa Market Hog, and Meal Is 9. That Is the Lowest Corn Share Since 2006, and 2027 Hog Margins Now Depend on the Hog Price.
Iowa State's latest farrow-to-finish closeout (September 2026 sales) puts corn at $40.78 and soybean meal at $15.54 of a $175.70 market hog. Corn's share is the lowest since 2006; it reached 37.8% at the 2011 peak. A 50-cent corn move shifts the breakeven by about $2.40 to $2.90 per carcass cwt, and a $25/ton meal move by $0.60 to $1.20. Forward corn, less Iowa basis, is back near the $4.22 cash price already built into that breakeven, so the feed-cost jump Purdue projected in September has mostly gone. On November 3 settlements, the 2027 lean hog curve averages $75.74 against an $86.77 breakeven. That is a loss of about $22 a head before manure credit, with June to August near breakeven and the winter months deeply negative. Hogs eat about 1.7 billion bushels of corn a year, and that demand is set for 2026/27; losses would show up in 2027/28 feed demand through the sow herd.
Iowa State University's estimated returns for farrow-to-finish hogs sold in September 2026 put corn at $40.78 a head and soybean meal at $15.54. Total cost was $175.70 for a 270-lb market hog, so corn was 23.2% of the cost and meal 8.8% (Iowa State University, Estimated Returns to Farrow to Finish, Oct 2026 update) [1]. The September hog sold for $84.85 per carcass cwt against a breakeven of $86.77. That was a $3.88 loss before the $5.59 manure credit, and the first pre-credit loss in the series since January 2025 [1]. The market has fallen further since then. On November 3, producer-sold barrows and gilts averaged a $67.36 net carcass price (USDA AMS, LM_HG201, Nov 4, 2026) [8], and December lean hog futures settled at $58.60 (Brownfield Ag News, Nov 3, 2026) [5]. Iowa State's September closeout is the latest published, and no October update was available on November 4. This piece breaks down what a hog costs, how much corn and meal moves its breakeven, what the futures curve implies for 2027, and how much corn demand from hog feeding is at risk.
1. Where the dollar goes: corn is under a quarter of the hog
What's new: Iowa State's farrow-to-finish model is a cash barometer for a typical Iowa producer, with no hedging. Corn is priced from USDA's North Central Iowa bid, soybean meal from USDA's Iowa soybean processor report, and DDGS from USDA's Iowa ethanol-plant prices. The diets are corn, distillers grains and soybean meal, plus purchased complete feeds and supplements (Schulz, Iowa State procedure, Jan 2014) [3].
Evidence: The table ranks each cost line for the September 2026 sale month.
| Iowa farrow-to-finish, 270-lb hog, sold Sep 2026 | $/head | % of total cost | |
|---|---|---|---|
| Variable costs (labor, vet, utilities, breeding, etc.) | 48.99 | 27.9 | ██████████ |
| Corn | 40.78 | 23.2 | ████████░░ |
| Fixed costs (buildings, equipment) | 23.30 | 13.3 | █████░░░░░ |
| Complete feeds and other ingredients | 18.10 | 10.3 | ████░░░░░░ |
| Soybean meal | 15.54 | 8.8 | ███░░░░░░░ |
| Dried distillers grains | 10.25 | 5.8 | ██░░░░░░░░ |
| Death loss | 8.36 | 4.8 | ██░░░░░░░░ |
| Feed processing | 5.92 | 3.4 | █░░░░░░░░░ |
| Operating interest | 4.47 | 2.5 | █░░░░░░░░░ |
| Total | 175.70 | 100.0 | |
| Feed subtotal | 90.58 | 51.6 |
Source: Iowa State University Extension and Outreach, Estimated Returns to Farrow to Finish, Iowa, data file, Oct 2026 update (sale month Sep 2026) [1]. Percentages are Crop Root Zone calculations; bars are scaled to variable costs at 27.9%.
Corn and meal together cost $56.32, which is 62.2% of the $90.58 feed bill and 32.1% of the hog. Distillers grains are priced off corn. Including them, corn-linked feed is 37.9% of total cost. Unlike a feedlot steer, a farrow-to-finish hog has no purchased animal on the cost sheet. The pig comes from the operation's own sows, so labor, buildings and the breeding herd take the place of the calf.
The wean-to-finish model, for a finisher that buys a 12-lb weaned pig, looks different. In September the pig cost $83.11, or 37.4% of a $221.97 total. Corn was 16.5% and meal 6.3%. Those hogs lost $50.15 a head before manure credit, because the weaned pigs were bought in March, when hog futures were near their high [2].
Corn's share of a hog has fallen a long way since the 2011–2013 and 2021–2022 corn price spikes.
| Corn as % of farrow-to-finish total cost (avg of sale months) | % | |
|---|---|---|
| 2006 | 17.6 | █████░░░░░ |
| 2011 | 35.9 | ██████████ |
| 2012 | 35.8 | ██████████ |
| 2016 | 24.6 | ███████░░░ |
| 2022 | 33.6 | █████████░ |
| 2024 | 23.8 | ███████░░░ |
| 2025 | 23.4 | ███████░░░ |
| 2026, Jan–Sep | 22.5 | ██████░░░░ |
| Series average, 2002–Sep 2026 | 25.9 | ███████░░░ |
Source: Iowa State University, Estimated Returns to Farrow to Finish, data file, Oct 2026 update [1]; Crop Root Zone calculations from monthly $/head values. Rows are annual means of monthly shares; bars are scaled to 2011.
The 2026 average is the lowest annual corn share since 2006, before ethanol demand lifted corn prices. The highest single month in the series was 37.8%, in 2011. Corn's share is low partly because corn has been cheap and partly because everything else has become more expensive. Labor, buildings and veterinary costs sit in the non-feed lines, which now total $76.76 a head [1].
23.2¢
Share of each dollar of cost that went to corn for an Iowa farrow-to-finish hog sold in September 2026. Soybean meal took 8.8¢. (Iowa State University, Estimated Returns to Farrow to Finish, Oct 2026 update)
2. What 50 cents of corn and $25 of meal do to the breakeven
What's new: Iowa State does not publish ration quantities, but it is possible to back them out of its numbers. North Central Iowa cash corn averaged $4.22 a bushel over February to September 2026, the farrowing-to-sale window for the September hog (Iowa Department of Agriculture and Land Stewardship, Monthly Grain Reports, Feb–Sep 2026) [4]. Dividing the $40.78 corn line by that price gives about 9.7 bushels per hog. Pricing only the June–September finishing months gives 9.5. These are our estimates. They allow for the sow herd's share and for distillers grains replacing some corn. As a cross-check, NPPC figures put the national industry at about 11.4 bushels per head produced in 2023 [15]. Meal is harder to back out because the Iowa processor series was not reachable. At an assumed $325/ton average, the $15.54 meal line equals about 96 lb per hog (estimate, range 90–100 lb).
Purdue's regression for a swine-finishing enterprise, using 2007–2025 data, gives a second, all-in measure. Each $0.10/bu on corn adds $0.43 per cwt to feed cost, and each $10/ton on meal adds $0.37 (Langemeier, Purdue, Sep 2026) [12][13]. The regression picks up distillers and supplement prices that move with corn and meal, so it runs higher than a corn-only calculation.
Evidence:
| Breakeven shift on a 270-lb hog (202.5-lb carcass) | $/head | $/live cwt | $/carcass cwt |
|---|---|---|---|
| Corn ±$0.50/bu, Iowa State quantities (9.7 bu)* | 4.85 | 1.80 | 2.40 |
| Corn ±$0.50/bu, Purdue regression* | 5.81 | 2.15 | 2.87 |
| Meal ±$25/ton, Iowa State quantities (~96 lb)* | 1.20 | 0.44 | 0.59 |
| Meal ±$25/ton, Purdue regression* | 2.50 | 0.93 | 1.23 |
| Hog price ±$1/carcass cwt (revenue) | 2.03 | — | 1.00 |
| Hog price, Nov 3 spot vs Iowa State breakeven ($67.36 vs $86.77) | 39.31* | — | 19.41 |
Source: Iowa State University, Oct 2026 update [1]; Langemeier, "Impact of Higher Corn Prices on Swine Finishing Feed Costs," Purdue University, Sep 2026 [12]; USDA AMS LM_HG201, Nov 4, 2026 [8]. *Crop Root Zone calculations. We apply Purdue's per-cwt coefficients to a 270-lb live hog; Purdue's enterprise is wean-to-finish. Carcass conversion uses Iowa State's 75% yield.
At these coefficients, a dollar on the hog price is worth about 21 cents on corn. The hog market has moved far more than that. The gap between the November 3 cash price and Iowa State's September breakeven is $19.41 per carcass cwt. On a per-head basis that equals roughly $4 corn, which is about the price of the corn itself.
Ground Truth: For a hog operation, corn now affects the margin at the edges, and the hog price sets it. A full 50-cent corn move is worth about $5 to $6 a head. The hog market's drop since the September sale month is worth about $39. For a corn grower selling into hog country, this means local hog feeders' bids for corn will not track their own margins. Corn demand from hog barns is set by how many pigs are in them. A loss-making hog does not stop eating, and Section 4 covers why that matters.
3. The feed-cost jump Purdue projected in September has mostly gone
What's new: On September 8, Purdue's price-distribution work put the median July 2027 corn futures price at $5.50. It projected the 2027 swine-finishing feed cost index 9.7% above 2026, at 113.9 against 103.8 [12]. North Central Iowa cash corn averaged $4.85 in September, then $4.32 in October, and was $4.06 on October 30 [4]. December corn settled at $4.42½ on November 3. December meal settled at $318.00/ton [5]. Decatur meal had averaged nearly $366 in September after a 12% rise, and USDA's 2026/27 forecast is $340 (USDA ERS, OCS-26j, Oct 14, 2026) [11].
Evidence: The 2027 futures strip settled on November 3 at $4.56¼ for March corn, $4.65 for May and $4.72¼ for July. Meal settled between $317.80 and $326.60 through December 2027 (Investing.com delayed quotes, Nov 4, 2026, less the day's change) [6]. The March–July corn average is $4.645. Taking off October's $0.43 average Iowa basis [4] gives about $4.21 cash, almost the same as the $4.22 already in the September closeout. July 2027 corn at $4.72¼ is 78 cents under Purdue's $5.50 median. At Purdue's coefficient that is about $3.35 per cwt off the feed cost it projected (Crop Root Zone calculation). Meal futures sit below both the September cash average and USDA's forecast.
For this reason, we use Iowa State's September cost of $175.70 a head, or $86.77 per carcass cwt, as the 2027 breakeven in Section 4. This is an estimate. It assumes non-feed costs stay at September levels, Iowa basis stays near October's level, and meal costs no more than in the September closeout. On current futures the last assumption may overstate meal cost slightly. Iowa State's breakeven has ranged from $81.11 to $87.10 over the past 15 sale months [1]. Feed has not been what moved the margin.
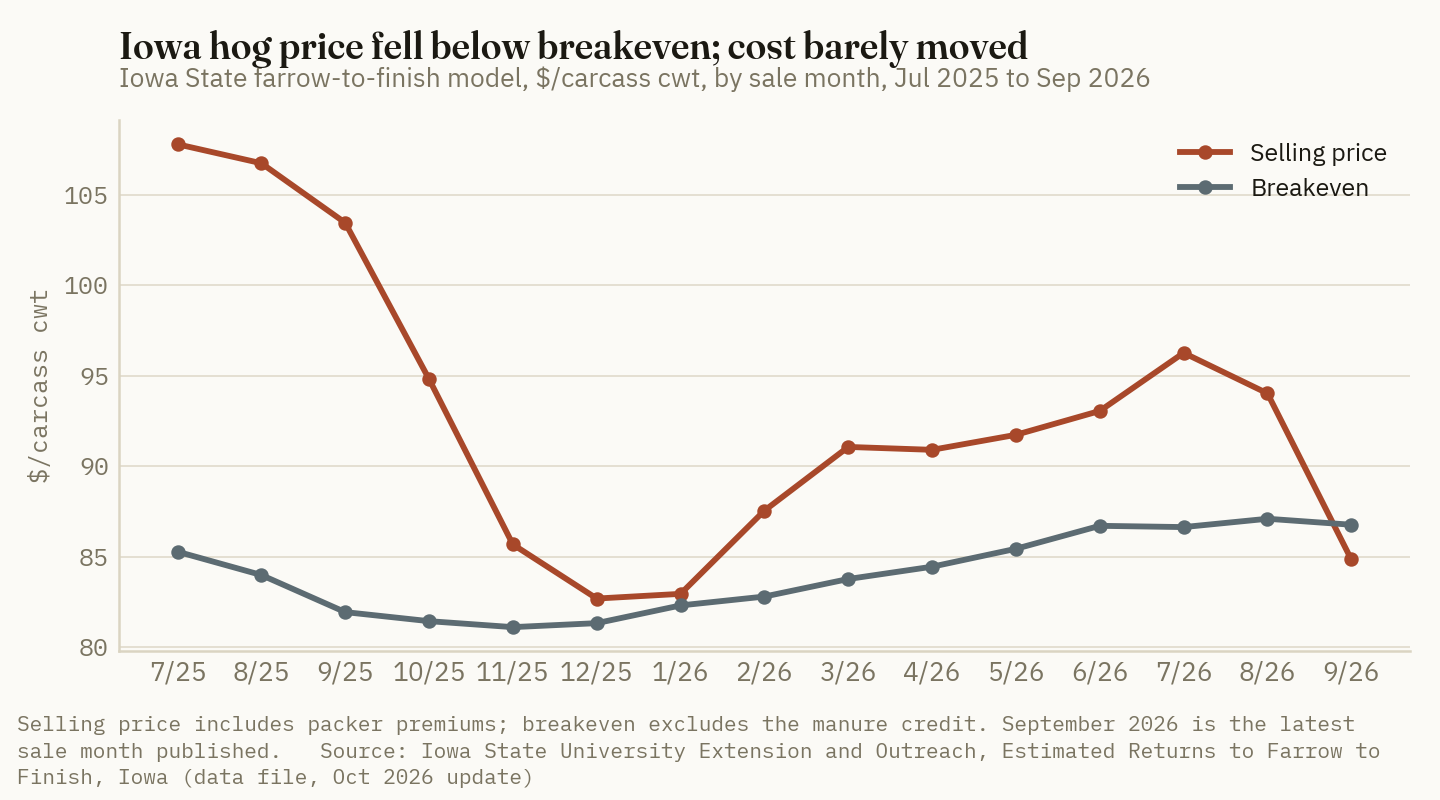
4. The 2027 curve: summer near breakeven, winter deep in the red
What's new: December lean hogs fell for a fourth straight week to $58.875 on October 30, and the CME Lean Hog Index was $67.30, its lowest since January 2024 (The Pig Site, Nov 2, 2026) [7]. The USDA pork cutout was $72.43 per cwt on November 3 [9]. In October, USDA lowered its hog price forecasts for the rest of 2026 and the first half of 2027 because of persistent weakness in the pork cutout. It now projects a fourth-quarter 2026 barrows-and-gilts price of $55.00 live, and $60, $65 and $68 for the first three quarters of 2027. Its 2027 annual forecast is $63, down from $64 (WASDE-676, Oct 9, 2026) [10].
Evidence: The table sets each lean hog contract against Iowa State's $86.77 breakeven. We treat the futures price as comparable to Iowa State's net selling price, since both are net-price series. The AMS producer-sold net price of $67.36 for November 3 slaughter [8] was close to the $67.30 index reported on November 2 [7]. The basis between the two is an assumption, not a published figure.
| Lean hog contract | Nov 3 settle, $/cwt | vs $86.77 breakeven | Margin, $/head* | |
|---|---|---|---|---|
| Dec 2026 | 58.60 | −28.17 | −57 | ██████████ loss |
| Feb 2027 | 63.53 | −23.25 | −47 | ████████░░ loss |
| Apr 2027 | 69.38 | −17.40 | −35 | ██████░░░░ loss |
| May 2027 | 76.20 | −10.57 | −21 | ████░░░░░░ loss |
| Jun 2027 | 85.28 | −1.50 | −3 | █░░░░░░░░░ loss |
| Jul 2027 | 88.55 | +1.78 | +4 | █░░░░░░░░░ gain |
| Aug 2027 | 89.60 | +2.83 | +6 | █░░░░░░░░░ gain |
| Oct 2027 | 79.23 | −7.55 | −15 | ███░░░░░░░ loss |
| Dec 2027 | 72.53 | −14.25 | −29 | █████░░░░░ loss |
| Calendar 2027, month-weighted | 75.74 | −11.03 | −22 |
Source: Brownfield Ag News, Nov 3, 2026 (Dec 2026) [5]; Investing.com delayed quotes, Nov 4, 2026, less the day's change (2027 contracts) [6]; Iowa State University, Oct 2026 update (breakeven) [1]. *Crop Root Zone calculations on a 202.5-lb carcass, before the manure credit, which was $5.59 a head in September. Calendar average maps each month to its delivery contract (Jan–Feb to Feb, Mar–Apr to Apr, Sep–Oct to Oct, Nov–Dec to Dec). Bars are scaled to the December 2026 loss.
Including a manure credit near September's level, the calendar-2027 hog loses about $16 a head on this basis. In live-weight terms, the $75.74 strip is about $56.80 per live cwt. That is below USDA's $63 forecast and well below Iowa State's $65.07 live breakeven [1][10]. Barchart's October review notes that the curve has been lower before. December 2026 hogs traded at $71.75 on August 24, and the nearby contract peaked at $110.175 in March (Hecht, Barchart via Yahoo Finance, Oct 15, 2026) [16].
One more cost cuts the other way. Iowa State's model sells a 270-lb hog. The November 3 producer-sold average was 293 lb live and 220 lb carcass [8]. Industry hogs spread fixed costs over more pounds than the model assumes. The model's per-cwt breakeven is therefore conservative for large operations and accurate for the typical Iowa producer it is meant to represent.
Ground Truth: The curve says the 2027 problem is a winter-and-spring problem. Hogs marketed December through May lose $21 to $57 a head on futures, while June–August hogs are near breakeven. For a farrow-to-finish operation, the decision that matters is the breeding decision being made now. Sows bred in November and December produce market hogs in roughly the summer of 2027, the only part of the curve that pays. Sows bred in late winter produce hogs for the October–December 2027 contracts, which are back below breakeven. We expect more pressure to cull sows after the summer 2027 hogs are committed. That puts any herd reduction into the March and June 2027 Hogs and Pigs reports, not the December one.
5. What it means for corn demand from hog feeding
What's new: On September 1, the U.S. hog inventory was 74.3 million head, down 2% from a year earlier. The breeding herd was 5.875 million, down 1%, and market hogs were 68.4 million. The June–August pig crop was 34.5 million, down 2%, with 11.96 pigs saved per litter. Producers intended to farrow 2.855 million sows in September–November, down 2%, and 2.795 million in December–February, up 2% (USDA NASS, Quarterly Hogs and Pigs, Sep 24, 2026) [14]. That survey was taken before December hogs fell from the low $70s to the high $50s. USDA's October WASDE projects 2027 pork production at 27.825 billion lb, against 27.621 billion for 2026. It holds 2026/27 corn feed and residual at 6.0 billion bushels, up 50 million from September [10].
Evidence:
| Hog-sector corn demand | Value | Basis |
|---|---|---|
| Corn fed to U.S. hogs, 2023 | ~1.7 bil bu | NPPC via 3tres3, Jul 2024 [15] |
| Soybean meal fed to U.S. hogs, 2023 | ~11.2 mil st | NPPC via 3tres3, Jul 2024 [15] |
| USDA 2026/27 corn feed and residual | 6,000 mil bu | WASDE-676, Oct 9, 2026 [10] |
| Hogs as share of feed and residual | ~28%* | 1.7 / 6.0, mixed years |
| Corn per hog, Iowa State model | ~9.7 bu* | Section 2 |
| Corn per lb of extra market weight | ~0.04 bu* | ~3.1 lb feed/lb gain, ~75% corn |
| Corn demand per 1 lb change in avg live weight | ~5 mil bu/yr* | ~125–130 mil barrows and gilts |
Source: as listed. *Crop Root Zone estimates. The hog share mixes NPPC's 2023 usage with USDA's 2026/27 total, so treat it as an order of magnitude. Feed-conversion and ration assumptions are ours.
Hogs are a larger and steadier corn customer than cattle feeders, and their demand responds to price more slowly. The market hogs that will eat corn through mid-2027 were counted on September 1 [14]. Low prices cut slaughter numbers only through the breeding herd, and a sow bred today does not reach the market until next summer.
Weight is the one short-run lever, and at today's prices it does not favor feeding lighter. We estimate that adding the last 10 lb of live weight takes about 31 lb of feed, costing roughly $3 at $4.21 corn and $320 meal. Those 10 lb sell for about $4.40 at the December futures price (live equivalent) and about $5.70 at the 2027 average. Feeding to heavier weights still adds revenue, even in a losing year. USDA cut its pork forecast partly on lighter dressed weights [10]. At about 5 million bushels per pound of live weight, a 3-lb drop would remove roughly 15 million bushels of corn demand, small next to the 50 million USDA added in October. These are estimates.
Ground Truth: Feed demand from hogs in 2026/27 is close to locked in: about 1.7 billion bushels, give or take a few million for weights. Cheaper corn will not raise it and lower hog prices will not cut it this crop year. The risk is in 2027/28. If the 2027 curve holds and producers respond the way the breeding calendar suggests, the December–February farrowing increase does not happen, and the sow herd shrinks into the 2027 summer profit window instead of expanding. Each 1% off the breeding herd that carries through to slaughter is roughly 17 million bushels of corn a year (estimate). For a corn grower marketing old-crop corn into hog country, the useful number to watch is the December 23 Hogs and Pigs breeding inventory, not the hog futures price. It will show whether the 2027/28 balance sheet should carry the same hog demand it carries now.
References
- Iowa State University Extension and Outreach, Estimated Returns to Farrow to Finish, Iowa, October 2026 update (PDF dated Oct 9, 2026, and Excel data file; latest sale month Sep 2026) — https://estimatedreturns.econ.iastate.edu/files/inline-files/farrow_to_finish_pdf.pdf ; https://estimatedreturns.econ.iastate.edu/files/inline-files/farrow_to_finish_excel.xlsx
- Iowa State University Extension and Outreach, Estimated Returns to Wean to Finish, Iowa, October 2026 update (purchase Mar 2026, sale Sep 2026) — https://estimatedreturns.econ.iastate.edu/files/inline-files/wean_to_finish_excel.xlsx
- Schulz, L. L., Procedure for Estimating Returns: Farrow to Finish, Iowa State University, Jan 2014 — https://estimatedreturns.econ.iastate.edu/files/inline-files/farrow_to_finish_procedure.pdf
- Iowa Department of Agriculture and Land Stewardship, Agricultural Diversification & Market Development Bureau, Monthly Grain Reports, January–October 2026 (Iowa district corn prices and basis; October report dated Nov 2, 2026) — https://iowaagriculture.gov/sites/default/files/ag-diversification/Monthly%20grain%20reports/2026/October%202026%20Monthly%20Grain%20Report.pdf
- Brownfield Ag News, "Closing Grain and Livestock Futures: November 3, 2026" (December corn $4.42½; December soybean meal $318.00; December lean hogs $58.60) — https://brownfieldagnews.com/news/closing-grain-and-livestock-futures-november-3-2026/
- Investing.com, Lean Hogs, US Corn and US Soybean Meal futures contracts, delayed quotes as of 11:06 CT, Nov 4, 2026. November 3 settlements derived as last price less the day's change — https://www.investing.com/commodities/lean-hogs-contracts ; https://www.investing.com/commodities/us-corn-contracts ; https://www.investing.com/commodities/us-soybean-meal-contracts
- The Pig Site, "Lean hogs set fresh lows in cash-led bear market – CME," Nov 2, 2026 (December lean hogs 58.875; February 63.75; CME Lean Hog Index 67.30) — https://www.thepigsite.com/news/2026/11/cattle-futures-slide-for-fourth-session-as-cash-prices-soften-cme
- USDA AMS Livestock, Poultry and Grain Market News, National Daily Direct Hog Prior Day Report – Slaughtered Swine (LM_HG201), Nov 4, 2026 (slaughter data for Nov 3, 2026) — https://www.ams.usda.gov/mnreports/ams_2511.pdf
- USDA AMS, National Daily Pork Report FOB Plant – Negotiated Sales – Afternoon (LM_PK602), Nov 3, 2026 — https://www.ams.usda.gov/mnreports/ams_2498.pdf
- USDA World Agricultural Outlook Board, World Agricultural Supply and Demand Estimates, WASDE-676, Oct 9, 2026 (U.S. corn supply and use; livestock text; quarterly animal product production and prices) — https://www.usda.gov/oce/commodity/wasde/wasde1026.pdf
- Bukowski, M., and Swearingen, B., Oil Crops Outlook: October 2026, OCS-26j, USDA Economic Research Service, Oct 14, 2026 — https://www.ers.usda.gov/media/29748/ocs-26j.pdf
- Langemeier, M., "Impact of Higher Corn Prices on Swine Finishing Feed Costs," Center for Commercial Agriculture, Purdue University, Sep 2026 (also farmdoc daily, Sep 11, 2026) — https://ag.purdue.edu/commercialag/home/wp-content/uploads/2026/09/20260917_Langemeier_SwineFinishing.pdf
- Langemeier, M., "Prospects for Swine Feed Costs in 2026," farmdoc daily (16):23, University of Illinois, Feb 13, 2026 — https://farmdocdaily.illinois.edu/2026/02/prospects-for-swine-feed-costs-in-2026.html
- USDA NASS, Quarterly Hogs and Pigs, released Sep 24, 2026 (inventory as of Sep 1, 2026) — https://esmis.nal.usda.gov/sites/default/release-files/796073/hgpg0926.txt
- 3tres3, "Production costs in the U.S. swine industry," Jul 25, 2024 (citing National Pork Producers Council, Jun 2024: 149.6 million hogs, 1.7 billion bu corn, 11.2 million tons soybean meal, 2023) — https://www.3tres3.com/en/latest_swine_news/production-costs-in-the-u-s-swine-industry_20599/
- Hecht, A., "Where Are Hog Futures Heading During the 2026/2027 Offseason?", Barchart via Yahoo Finance, Oct 15, 2026 — https://finance.yahoo.com/markets/commodities/articles/where-hog-futures-heading-during-190002633.html
Disclosures
Crop Root Zone is an independent publication. Nothing here is investment advice. Market calls, where included, reflect the editors' own read and are not a recommendation to buy or sell any security.
Top-Level Dairy Margin Coverage Costs 15 Cents a Hundredweight for 2027, and the 2026 Margin Paid Back More Than Twice That by September
DMC enrollment for 2027 runs Oct. 5 to Dec. 18 on the terms the 2025 reconciliation law set: a 6-million-pound Tier 1, production histories reset to the best of 2021-2023, and a 25% discount for herds that locked in through 2031. We rebuild the margin from its corn, soybean meal and alfalfa hay inputs. Through September, $9.50 coverage paid $0.34 per covered hundredweight of annual production against a $0.15 premium. The futures-based forecast puts every 2027 month above $9.50, while USDA's own October numbers imply a 2027 average just 15 cents over the trigger. That makes Tier 1 at $9.50 inexpensive cover on a feed bill driven by corn, and Tier 2 buy-up a poor buy at any level above $5.
Dairy producers have until December 18 to sign up for 2027 Dairy Margin Coverage, and the price of top-level protection has not changed. USDA's Farm Service Agency opened enrollment on October 5. Coverage levels run from $4.00 to $9.50 per hundredweight, the $4.00 catastrophic level carries no premium, and every operation pays a $100 administrative fee (USDA FSA, Sep 30, 2026) [1]. The Tier 1 premium at $9.50 is still $0.15 per cwt (7 CFR 1430.407, current Nov 1, 2026) [3]. What has changed is how much milk Tier 1 covers and how each herd's production history is set. Both changes came from the 2025 budget reconciliation law, Public Law 119-21, which USDA calls the Working Families Tax Cuts Act. Margins in 2026 also moved. They dropped below $9.50 in four of the nine months reported so far, and the cause on the feed side was crop prices: corn and soybean meal pushed DMC feed cost to $11.15 per cwt in September (USDA FSA, accessed Nov 4, 2026) [2]. This piece rebuilds the margin from its crop inputs, prices the 2027 coverage, and checks what it would have paid this year and what the markets imply for next year.
1. How the margin is built, and where the crops come in
What's new: Nothing in the formula. The DMC margin is the national all-milk price minus a feed cost per cwt of milk. That feed cost is 1.0728 × corn ($/bu) + 0.00735 × soybean meal ($/short ton) + 0.0137 × alfalfa hay ($/ton). Corn and hay are NASS prices received by farmers. Since 2020 the hay series has been premium and supreme alfalfa hay rather than a blended price. Soybean meal is the AMS central Illinois rail price (7 CFR 1430.411) [3]. The weights describe a ration in which about a bushel of corn, 15 pounds of meal and 27 pounds of hay produce one hundredweight of milk. A movement in grain or hay prices goes straight into the margin.
Evidence:
| Feed-cost component, $/cwt of milk | Jan 2026 | Jun 2026 | Sep 2026 | Jun→Sep change |
|---|---|---|---|---|
| Corn (1.0728 × $/bu) | 4.40 | 4.59 | 5.16 | +0.57 |
| Soybean meal (0.00735 × $/ton) | 2.20 | 2.35 | 2.69 | +0.34 |
| Premium/supreme alfalfa hay (0.0137 × $/ton) | 3.10 | 3.27 | 3.30 | +0.03 |
| DMC feed cost | 9.69 | 10.22 | 11.15 | +0.93 |
| All-milk price | 17.50 | 21.10 | 19.50 | −1.60 |
| DMC margin | 7.81 | 10.88 | 8.35 | −2.53 |
Source: USDA FSA, DMC Program Updates and Prices, 2026 rates table (corn $4.10, $4.28 and $4.81/bu; soybean meal $299.25, $319.68 and $365.95/ton; hay $226, $239 and $241/ton), accessed Nov 4, 2026 [2]; weights from 7 CFR 1430.411 [3]. Component values are Crop Root Zone arithmetic. Their totals match FSA's published feed cost to the cent. Basis: national monthly averages, $/cwt of milk.
From June to September the margin fell $2.53. The all-milk price accounted for $1.60 of that and feed for $0.93. Corn alone accounted for $0.57: the NASS price received rose 53 cents a bushel, to $4.81, in the month new-crop harvest began. Soybean meal added another $0.34. Hay hardly moved. In September, corn was 46% of the DMC feed bill, hay 30% and meal 24%.
The weights also give a simple conversion. Every 10 cents a bushel on corn moves the margin 10.7 cents per cwt. A $10-a-ton move in soybean meal is worth 7.4 cents, and a $10-a-ton move in hay is worth 13.7 cents. In this program a dairy farm effectively carries a short position in corn.
Ground Truth: DMC is often described as a milk-price program, but in 2026 the feed formula decided the late-summer payments. If the September all-milk price had come with June's feed cost, the margin would have been $9.28, and a $9.50 policy would have paid 22 cents rather than $1.15. A grower who also sells corn should treat DMC partly as a hedge on his own crop. The months when corn is strong are the months when the dairy margin is weakest.
2. What 2026 has paid so far
What's new: FSA has posted final margins for January through September 2026. Four months came in under the top $9.50 coverage level: January at $7.81, February at $8.46, August at $9.34 and September at $8.35. March was 7 cents above the trigger, at $9.57 [2]. A DMC payment equals the shortfall below the coverage level, multiplied by the coverage percentage and by one-twelfth of the production history (7 CFR 1430.409) [3]. A shortfall of $1 for one month is therefore worth 1/12 of a dollar on each cwt of annual covered production.
Evidence:
| 2026 month | DMC margin, $/cwt | Shortfall vs $9.50, $/cwt | |
|---|---|---|---|
| January | 7.81 | 1.69 | ██████████ |
| February | 8.46 | 1.04 | ██████░░░░ |
| March | 9.57 | 0.00 | ░░░░░░░░░░ |
| April–July | 9.93–10.88 | 0.00 | ░░░░░░░░░░ |
| August | 9.34 | 0.16 | █░░░░░░░░░ |
| September | 8.35 | 1.15 | ███████░░░ |
| Jan–Sep total | 4.04 |
Source: USDA FSA, DMC margins, 2026 rates table, accessed Nov 4, 2026 [2]; Crop Root Zone calculation. Bars scale the shortfall; January = 10. The October margin is not yet published. The DMC Decision Tool forecast it at $8.79 on Nov 3, 2026 [5], which would add a further $0.71.
Spread across a year's covered production, the $4.04 of monthly shortfalls through September comes to $0.34 per cwt at $9.50. That is 2.2 times the $0.15 premium and three times the $0.1125 premium paid by herds on the six-year lock-in. If the October forecast holds, the figure rises to about $0.40.
To put that in dollars, take a herd with a 6-million-pound production history covered at 95% and $9.50. This is an illustration, roughly 250 cows at 24,000 pounds a head. Covered production is 57,000 cwt, so the premium is $8,550 plus the $100 fee, or $6,412.50 plus the fee under the lock-in. January through September paid $19,190, which is 4,750 cwt a month times $4.04. Payments are subject to any sequestration reduction in force when they are issued, and we have not applied one. At the World Dairy Expo announcement, Agriculture Secretary Brooke Rollins said more than 13,500 operations had used DMC through 2026, with payments above $98 million nationally (Progressive Dairy, Oct 5, 2026) [4].
3. The 2027 terms: what changed in 2026 and carries forward
What's new: FSA's announcement says the reconciliation law extended DMC through 2031 and that its changes took effect with the 2026 program year [1]. All three carry into 2027:
- Tier 1 goes from 5 to 6 million pounds. This is the volume that qualifies for the low Tier 1 premiums and for the $8.50, $9.00 and $9.50 levels. Production above 6 million pounds is Tier 2. Tier 2 is capped at $8.00 coverage and its premiums are much higher (7 CFR 1430.407) [3].
- Production histories were reset. Operations marketing milk on or before January 1, 2023 use their highest annual marketings from 2021, 2022 or 2023. Newer operations use their first year of marketings, even a partial one (USDA FSA, DMC program page, accessed Nov 4, 2026) [6].
- A one-time lock-in. Operations that fixed a coverage level and percentage for 2026–2031 during 2026 enrollment pay 25% less premium. The election had to be made during the 2026 period. Operations that started after that period can still lock in from their first year (7 CFR 1430.407(j)) [3]. Locked-in herds must still certify, sign a 2027 contract and pay the $100 fee [1].
Evidence:
| Coverage level, $/cwt | Tier 1 premium, $/cwt (first 6M lb) | Tier 1 with 6-yr lock-in | Tier 2 premium, $/cwt (above 6M lb) | 2026 Jan–Sep payout, $/cwt of annual cover |
|---|---|---|---|---|
| 9.50 | 0.150 | 0.1125 | not offered | 0.337 |
| 9.00 | 0.110 | 0.0825 | not offered | 0.198 |
| 8.50 | 0.105 | 0.0788 | not offered | 0.073 |
| 8.00 | 0.100 | 0.0750 | 1.813 | 0.016 |
| 7.50 | 0.090 | 0.0675 | 1.413 | 0.000 |
| 6.00 | 0.050 | 0.0375 | 0.310 | 0.000 |
| 5.00 | 0.005 | 0.0038 | 0.005 | 0.000 |
| 4.00 | none | none | none | 0.000 |
Source: 7 CFR 1430.407(e), Table 1, and (j), eCFR text current Nov 1, 2026 [3]; payout column is a Crop Root Zone calculation from FSA 2026 margins [2]. Lock-in column = Table 1 × 0.75, rounded. Coverage percentage is elected from 5% to 95% in 5-point steps and applies to both tiers [3]. Premiums are due by September 1 of the coverage year [3].
$1.80
The sum of monthly shortfalls below $9.50 needed in a year for Tier 1 coverage to pay back its $0.15 premium. That is twelve months × $0.15. With the lock-in the figure is $1.35. In 2026, January's shortfall alone was $1.69. (Crop Root Zone calculation from 7 CFR 1430.407 and USDA FSA 2026 margins)
Enrollment details for 2027 are announced and complete: October 5 to December 18, 2026, at the county FSA office, with coverage from $4.00 to $9.50 [1][6]. FSA's 2027 release describes no further program changes beyond those already in force for 2026. The higher Tier 1 cap matters most to mid-size herds. For a herd with exactly 6 million pounds of history, the final million pounds now costs $0.15 per cwt at $9.50. Under the old rules it was Tier 2 milk, which could be covered no higher than $8.00, at $1.813.
4. What the markets imply for 2027
What's new: There are two current forward views, and they differ by almost a dollar.
The first is the DMC Decision Tool that FSA links from its program page [6]. It projects all-milk, corn, hay and soybean meal from futures market values and government prices. Its forecast dated November 3, 2026 has the 2027 margin averaging $10.63, from an all-milk average of $21.18 less feed of $10.56. The lowest month is July 2027 at $10.04, and no month is below $9.50 (DMC Decision Tool, forecast Nov 3, 2026) [5]. The forecast has risen over the past month. Progressive Dairy reported a projected 2027 average DMC margin of $9.34 as of October 2, with January through September below $9.50, and $10.06 as of October 28 [4][7].
The second view is USDA's own. The October WASDE puts the 2027 all-milk price at $20.45, Class III at $16.90 and Class IV at $18.90. It puts the 2026/27 season-average corn price at $4.70 and soybean meal at $340 per short ton (USDA WAOB, WASDE-676, Oct 9, 2026) [8]. WASDE has no hay forecast. Using the Decision Tool's 2027 hay average of $238, the WASDE prices give a DMC feed cost of about $10.80 and a 2027 margin of about $9.65. That is our estimate, and it is an annual average, so the monthly path could still dip below $9.50 for part of the year.
The dairy futures board has weakened since the tool's October 2 run. After a heavy Milk Production report in late October, Class III traded in the $16 to $17 range and Class IV in the $19s (Progressive Dairy, Oct 29, 2026) [7]. On October 29, November 2026 Class III settled at $16.79 and Class IV at $19.72 (USDA AMS Dairy Market News, week of Oct 26–30, 2026) [9]. For comparison, the September 2026 all-milk price was $19.50, against a Class III of $16.04 and a Class IV of $18.94 [2][9].
Evidence:
| 2027 margin view | All-milk, $/cwt | Corn, $/bu | SBM, $/ton | Hay, $/ton | Feed cost, $/cwt | Margin, $/cwt |
|---|---|---|---|---|---|---|
| DMC Decision Tool, Nov 3, 2026 (12-mo avg) | 21.18 | 4.53 | 331 | 238 | 10.56 | 10.63 |
| WASDE Oct 2026 prices (our estimate) | 20.45 | 4.70 | 340 | 238* | 10.80* | 9.65* |
| Progressive Dairy projection, as of Oct 2 | — | — | — | — | — | 9.34 |
| Progressive Dairy projection, as of Oct 28 | — | — | — | — | — | 10.06 |
Sources: DMC Decision Tool forecast, Nov 3, 2026 [5]; USDA WASDE-676, Oct 9, 2026 [8]; Progressive Dairy, Oct 5, 2026 [4]. *Estimate: WASDE gives no hay price, so the tool's 2027 hay average is used. WASDE corn and meal are marketing-year averages, not calendar 2027.
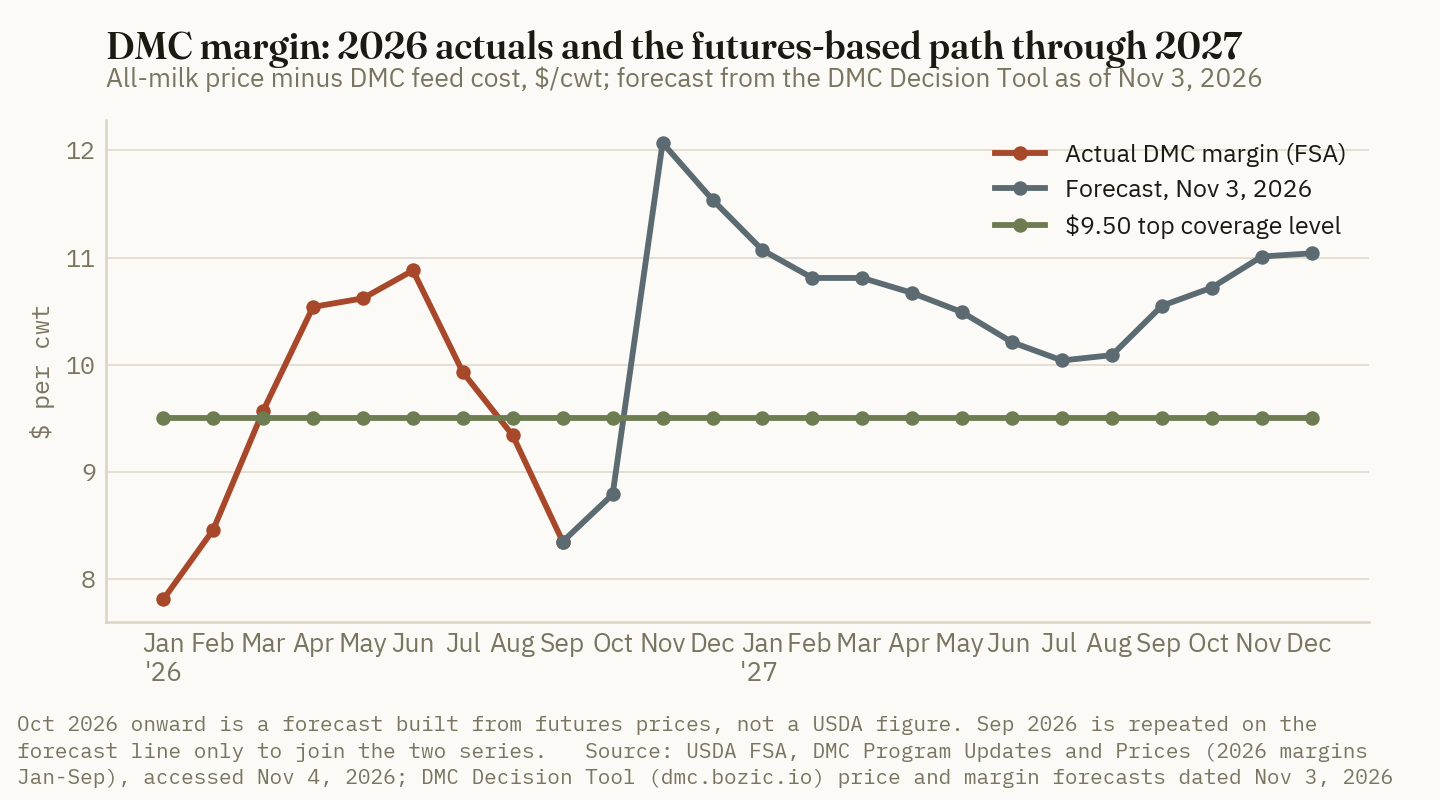
The sensitivities from Section 1 show how much room the forecast has. The tool's weakest 2027 month, July at $10.04, sits 54 cents above the trigger. That cushion would be gone if July corn came in a little more than 50 cents a bushel above forecast, or if meal rose about $75 a ton, or if the all-milk price fell 54 cents. The corn and milk moves have both happened within a single quarter this year. Corn rose 53 cents from June to September 2026, and the all-milk price fell $1.60 over the same months [2].
| Shock to the 2027 forecast | Margin change, $/cwt | Enough to breach $9.50 in July 2027? |
|---|---|---|
| Corn +$0.55/bu | −0.59 | Yes |
| Soybean meal +$50/ton | −0.37 | No |
| Alfalfa hay +$30/ton | −0.41 | No |
| All-milk −$1.00/cwt | −1.00 | Yes |
| Corn +$0.25 and all-milk −$0.50 | −0.77 | Yes |
Source: Crop Root Zone calculation from 7 CFR 1430.411 weights [3] applied to the DMC Decision Tool's July 2027 margin forecast of $10.04 (Nov 3, 2026) [5]. Scenarios are illustrative, not forecasts.
5. The coverage decision, by tier
What's new: Nothing in the premium schedule changed for 2027, so the decision comes down to the cost of each layer against how often it has paid.
Evidence: Applying today's Tier 1 premium schedule to FSA's published margins for each full year since DMC began gives this payout at $9.50 coverage:
| Year | Avg DMC margin, $/cwt | Months below $9.50 | $9.50 payout per cwt of annual cover | |
|---|---|---|---|---|
| 2019 | 9.61 | 7 | 0.54 | ██░░░░░░░░ |
| 2020 | 9.45 | 5 | 0.81 | ███░░░░░░░ |
| 2021 | 6.92 | 11 | 2.59 | █████████░ |
| 2022 | 10.73 | 2 | 0.19 | █░░░░░░░░░ |
| 2023 | 6.70 | 11 | 2.81 | ██████████ |
| 2024 | 11.98 | 2 | 0.09 | ░░░░░░░░░░ |
| 2025 | 11.15 | 1 | 0.01 | ░░░░░░░░░░ |
| 2026 (Jan–Sep) | 9.50 | 4 | 0.34 | █░░░░░░░░░ |
Source: USDA FSA, DMC margins 2019–2026, accessed Nov 4, 2026 [2]; Crop Root Zone calculation. Bars scale the payout; 2023 = 10. 2019 margins used a blended alfalfa hay price [2]. The Tier 1 premium at $9.50 was $0.15 in every year shown, but the Tier 1 cap was 5 million pounds before 2026 [3].
$9.50 coverage paid more than its $0.15 premium in 2019, 2020, 2021, 2022, 2023 and 2026. It fell short in 2024 and 2025, when margins averaged above $11. The 2019–2025 average payout was $1.00 per cwt, almost seven times the premium. Two years when corn ran above $6, 2021 and 2023, account for most of that.
Tier 2 is a different matter. At $8.00, its highest level, the premium is $1.813 per cwt. In 2026 through September it would have paid $0.016. Across 2019–2025, $8.00 coverage paid an average of $0.49, and it did not cover the Tier 2 premium in any year. The best year was 2023, at $1.62. For a 20-million-pound herd at 95%, 13 million pounds of covered milk falls in Tier 2. At $8.00 that costs $235,690 in premium. At $5.00 it costs $650.
Ground Truth: For 2027 the Tier 1 decision is not close, even on the futures forecast that shows no payments. At $9.50 the first 6 million pounds cost $0.15 per cwt. The layer has covered its cost in six of eight years, and the trigger is less than $0.60 below the forecast for its weakest 2027 month. On the WASDE prices it is about $0.15 below. The real decision is about Tier 2. With the board pointing to margins of $10 to $11, buying Tier 2 above $5.00 means paying $0.31 to $1.81 per cwt. At the top of that range, $8.00 coverage did not earn back its premium in any year of the program's history, not even in 2021 and 2023, when corn spent months above $6. A herd with a large Tier 2 volume is better protected by hedging part of its 2027 corn and meal requirement directly, through forward purchases or LGM-Dairy, than by buying Tier 2 margin coverage. The crop price behind 46% of the DMC feed bill is the one it can actually lock.
What to watch. NASS's October prices, due in late November, will set the October 2026 margin, and the tool's estimate is $8.79. The November WASDE on November 10 will update the 2027 all-milk and corn forecasts. Corn harvest basis will feed into the NASS price received and therefore into the DMC corn line. Enrollment closes December 18. An operation that does not elect a level by then defaults to catastrophic coverage at $4.00 [3]. Since 2019 the margin has been below $4.00 in only one month, July 2023, at $3.52 [2].
References
- USDA Farm Service Agency, "USDA Announces 2027 Dairy Margin Coverage Enrollment," news release, Sep 30, 2026 (enrollment Oct 5–Dec 18, 2026; coverage $4.00–$9.50; $100 administrative fee; Tier 1 raised from 5 to 6 million lb; reauthorization through 2031; 25% lock-in discount) — https://www.fsa.usda.gov/news-events/news/09-30-2026/usda-announces-2027-dairy-margin-coverage-enrollment
- USDA Farm Service Agency, Dairy Margin Coverage (DMC) Program Updates and Prices, monthly corn, premium alfalfa hay, soybean meal, all-milk, feed cost and margin tables 2019–2026 (2026 final through September), accessed Nov 4, 2026 — https://www.fsa.usda.gov/resources/programs/dairy-margin-coverage-program-dmc/prices-updates
- Code of Federal Regulations, 7 CFR Part 1430 Subpart D, Dairy Margin Coverage Program, §§1430.402, 1430.406, 1430.407 (Table 1 premiums; Tier 1 at 6 million lb; 2026–2031 lock-in), 1430.409 (payments), 1430.411 (feed-cost formula), as amended at 91 FR 1057–1059, Jan 12, 2026; eCFR text as of Nov 1, 2026 — https://www.ecfr.gov/current/title-7/subtitle-B/chapter-XIV/subchapter-B/part-1430/subpart-D
- J. Coyne, "Enrollment begins for 2027 Dairy Margin Coverage program," Progressive Dairy, Oct 5, 2026 (Rollins remarks; Oct 2 projection of 2027 average margin $9.34, low of $8.57 in July 2027) — https://www.agproud.com/articles/64230-enrollment-begins-for-2027-dairy-margin-coverage-program
- Dairy Margin Coverage Decision Tool (linked from USDA FSA's DMC page), Price and Margin Forecast and Benefit Estimator for 2026 and 2027, forecast dated Nov 3, 2026, retrieved Nov 4, 2026 — https://dmc.bozic.io/
- USDA Farm Service Agency, Dairy Margin Coverage Program (DMC) program page (important dates, production-history rules, DMC improvements), accessed Nov 4, 2026 — https://www.fsa.usda.gov/resources/income-support/dairy-margin-coverage-program-dmc
- J. Coyne, "Dairy Risk Management Calendar: November 2026," Progressive Dairy, Oct 29, 2026 (Class III $16–17, Class IV in the $19s after the Milk Production report; 2027 average DMC margin forecast $10.06 as of Oct 28) — https://www.agproud.com/articles/64349-dairy-risk-management-calendar-november-2026
- USDA World Agricultural Outlook Board, World Agricultural Supply and Demand Estimates, WASDE-676, Oct 9, 2026 (2027 all-milk $20.45, Class III $16.90, Class IV $18.90; 2026/27 corn season-average price $4.70/bu; soybean meal $340/short ton) — https://www.usda.gov/oce/commodity/wasde/wasde1026.pdf
- USDA AMS, Dairy Market News weekly report, Vol. 93, Report 44, week of Oct 26–30, 2026 (CME Class III and IV futures settlements; 2026 Federal order class prices) — https://www.ams.usda.gov/mnreports/dywweeklyreport.pdf
Disclosures
Crop Root Zone is an independent publication. Nothing here is investment advice. Market calls, where included, reflect the editors' own read and are not a recommendation to buy or sell any security.
On Rented Ground, Tile Is a Landowner's 3% Investment Paid For With a Tenant's 7% Money. The Standard Buyout Clause Leaves the Tenant Up to $370 an Acre Short.
A $1,470-an-acre 40-foot tile job on somewhat poorly drained ground takes a tenant paying 6.79% about 18 years to recover at $5 corn, and 20 years at last Friday's $4.41½ futures. A 15-year straight-line buyout clause of the kind extension materials print leaves the tenant up to $373 an acre short if the lease ends in year 12. A landlord paying for the same job needs only a $44 rent increase, about 30% of the yield gain, to earn a 3.0% cash return, above the 2.05% top Indiana farmland earns. Splitting the cost 50/50 with rent unchanged pays the tenant back in about 6½ years.
December corn settled at $4.41½ on Friday, Nov. 6, and January soybeans at $11.93¾ (Brownfield Ag News, Nov 6, 2026). That is about 93 cents a bushel below the $5.34¼ December corn settled at on Sept. 16, when fall tiling began (Brownfield Ag News, Sep 16, 2026). The Federal Reserve held its target range at 3.75% to 4.00% on Oct. 28, after raising it in September (FOMC statement, Oct 28, 2026). Plastics pipe producer prices read 416.4 in September, 3.7% above a year earlier and essentially flat on August (BLS via FRED, accessed Nov 9, 2026). Our September piece asked whether a tile acre pays on owned ground at these costs and rates (Crop Root Zone, Sep 17, 2026). This piece asks who should pay when the ground is rented, which is the case on 58% of Iowa farmland. A tenant financing at a farm-loan rate, a landlord whose land earns about 2% in cash, and an Iowa lease that can end on six months' notice look at the same investment very differently. The standard lease clauses meant to protect the tenant leave most of that gap in place.
1. Most tile goes in on someone else's land
What's new: Rented land is now the majority case. Iowa State's 2022 ownership and tenure survey found 58% of Iowa farmland under some rental agreement, up from 53% in 2017. Fixed cash rent covered 42% of all farmland, flexible cash rent 9% and crop share 7%. Landowners who do not farm held 55% of it (Hart, Tong and Zhang, CARD Agricultural Policy Review, Spring 2023). Ohio State's farm office describes three ways to pay for tile on leased ground: the landowner pays, the tenant pays, or they share. It calls tenant-paid tile the more common arrangement (Moore, Ohio State Farm Office, Dec 1, 2022). farmdoc's tile break-even analysis put it bluntly: tile is a land improvement and the landowner's responsibility, and "when the landowner is not the farmer, aligning benefits with costs becomes problematic" (Schnitkey et al., farmdoc daily, Nov 29, 2022).
Evidence: Rents set the background. Illinois cropland averaged $261 an acre in 2026, down $3 from 2025 and $8 from 2024. The Illinois Society of Professional Farm Managers and Rural Appraisers' mid-year survey expects 2027 rents only a few dollars below 2026 across every quality class (Paulson et al., farmdoc daily, Sep 15, 2026). Iowa averaged $270, down $1 (Iowa State via Pro Farmer, May 22, 2026). Indiana top-quality rent fell 4.1% to $305 (Purdue via Pro Farmer, Aug 2026).
| Cash rent and basis | 2026, $/acre | 2027 outlook, $/acre | |
|---|---|---|---|
| Illinois, excellent productivity (ISPFMRA) | 384 | 380 | ██████████ |
| Illinois, good productivity (ISPFMRA) | 325 | 322 | ████████ |
| Central Illinois, high productivity, farmdoc 2027 budget | — | 321 | ████████ |
| Indiana, top quality (Purdue) | 305 | — | ████████ |
| Illinois, average productivity (ISPFMRA) | 277 | 273 | ███████ |
| Iowa, statewide average (Iowa State) | 270 | — | ███████ |
| Illinois, statewide cropland (USDA NASS) | 261 | — | ███████ |
| Indiana, average quality (Purdue) | 260 | — | ███████ |
| Illinois, fair productivity (ISPFMRA) | 227 | 222 | ██████ |
Sources: Paulson, Schnitkey, Tsay and Zulauf, farmdoc daily, Sep 15, 2026 (ISPFMRA mid-year survey and USDA NASS); Tibbs, University of Illinois Extension, Oct 9, 2026 (farmdoc 2027 budget rent); Pro Farmer, May 22, 2026 (Iowa State survey); Purdue Agricultural Economics Report, Aug 17, 2026, via Pro Farmer. Bars scale the 2026 figure, or the 2027 figure where no 2026 figure is given.
The ISPFMRA respondents assumed $4.50 corn and $11.50 soybeans when they made those 2027 projections. farmdoc noted that 2027 pricing was then nearer $5 and $12, which argued for smaller rent cuts (farmdoc daily, Sep 15, 2026). Friday's nearby futures are back toward the survey's assumptions. farmdoc's 2027 central Illinois budget shows $36 an acre for corn and $86 for soybeans after a $321 rent, at $5.00 and $12.00 (Tibbs, University of Illinois Extension, Oct 9, 2026). A tenant with that margin is the party usually asked to put $1,000 to $2,000 an acre into the landlord's soil.
Ground Truth: The flat 2027 rent outlook takes the usual tenant argument off the table. Tenants have often justified paying for tile on the grounds that the landlord would raise the rent anyway once yields improved. With professional managers expecting rents a few dollars lower, and farmdoc showing $36 corn margins after rent, a tenant has little room to absorb a 17-year capital project. The tenant also has more leverage than usual to ask the owner to pay for it.
2. The tenant's math: the lease is shorter than the payback
What's new: The extension rules of thumb on lease length were written as simple payback. Ohio State's example assumes $1,000 an acre of tile returning $100 a year. It concludes the tenant should have "at least a 10-year lease," and suggests 12 to 15 years (Moore, Ohio State Farm Office, Dec 1, 2022). That is the payback with free money. At the 6.79% average farm real estate rate Seventh District lenders reported for the second quarter (Federal Reserve Bank of Chicago, AgLetter, Aug 2026), the same $100 a year takes 17.3 years to repay $1,000 (Crop Root Zone estimate).
Evidence: We use the 40-foot pattern job from our September estimate: about $1,470 an acre for laterals, built from Iowa State's 2026 custom installation rate of $1.15 a foot and NC State's per-foot pipe and labor costs. That estimate stands because the pipe index has moved less than 0.5% since August (Crop Root Zone, Sep 17, 2026; ISU Ag Decision Maker A3-10, Mar 2026; NC State Extension, Feb 19, 2025). Yield responses are Iowa State's planning figures and its nine-year measured trial (Wallaces Farmer, Apr 20 and Mar 24, 2017). The rotation is half corn and half soybeans, with drying and storage of about $0.11 a bushel deducted from extra corn (farmdoc daily, Sep 1, 2026).
| Yield response, corn / soy (bu/acre) | Soil basis | Benefit at $5.00 / $12.00, $/acre/yr | Payback at 0% | Payback at 6.79%, $5.00 / $12.00 | Payback at 6.79%, Nov 6 futures |
|---|---|---|---|---|---|
| 13 / 6 | Iowa State, measured | 67.76 | 21.7 | never | never |
| 20 / 8* | Interpolated | 96.86 | 15.2 | never | never |
| 30 / 12 | Somewhat poorly drained | 145.29 | 10.1 | 17.7 | 20.1 |
| 54 / 18 | Very poorly to poorly drained | 239.91 | 6.1 | 8.2 | 9.0 |
Crop Root Zone estimate, years, on a $1,470/acre 40-ft job paid entirely by the tenant with rent unchanged. Prices: farmdoc daily, Sep 1, 2026; Brownfield Ag News, Nov 6, 2026 ($4.41½ Dec corn, $11.93¾ Jan soybeans, futures with no basis deducted). Rate: Federal Reserve Bank of Chicago, Aug 2026. *Scenario, not a published figure. "Never" means the yearly benefit does not cover interest on the cost.
17.7 years
How long a tenant paying 6.79% needs to recover a $1,470 40-foot tile acre on somewhat poorly drained ground at $5 corn. That rises to 20.1 years at Friday's $4.41½ futures. (Crop Root Zone estimate from farmdoc daily, Iowa State and Federal Reserve Bank of Chicago data)
Most rented ground is not leased for 18 years. Iowa farm leases, written or oral and whatever their stated term, renew automatically for another year unless written notice is served by Sept. 1. The tenancy then ends the following March 1 (Iowa Code § 562.6). A properly served notice ends the lease on schedule, whatever the tenant has buried in the ground. The tenant's protection has to be written into the lease.
Ground Truth: The 10-year lease rule is a zero-interest rule. At today's farm real estate rate, a tenant who pays for tile on somewhat poorly drained ground needs about 18 years, and about 20 at Friday's prices. On ground that responds like Iowa State's measured trial, a tenant never recovers the cost while carrying the debt. Before anything else in the negotiation, a tenant should look up the drainage class for the field in the county soil survey. If the ground is only moderately well drained, the tenant should not be paying for the tile at all.
3. The buyout clause that leaves the tenant's interest unpaid
What's new: The standard protection is a pro-rata buyout. If the landowner ends the lease early for any reason other than tenant breach, the landowner repays the unused share of the tile cost. The share is the remaining lease years divided by the total. Ohio State's example is a $1,000 job under a 10-year lease ended in year 4 for a solar project, with $600 an acre owed back (Moore, Ohio State Farm Office, Dec 1, 2022). Courts will enforce such a clause. In Hettinger v. City of Strawberry Point, the Iowa Court of Appeals held a tenant entitled to the unused, pro-rata share of lime he had paid for under a seven-year spreading clause after his lease was ended (Tidgren, Iowa State CALT, May 13, 2016).
Evidence: A straight-line clause repays principal at an even rate and treats the tenant's money as free. The yield benefit repays the tenant on an amortization schedule. Early on, most of the benefit goes to interest, so the tenant's unrecovered cost falls more slowly than the refund does. The gap is what the tenant loses if the lease ends in that year.
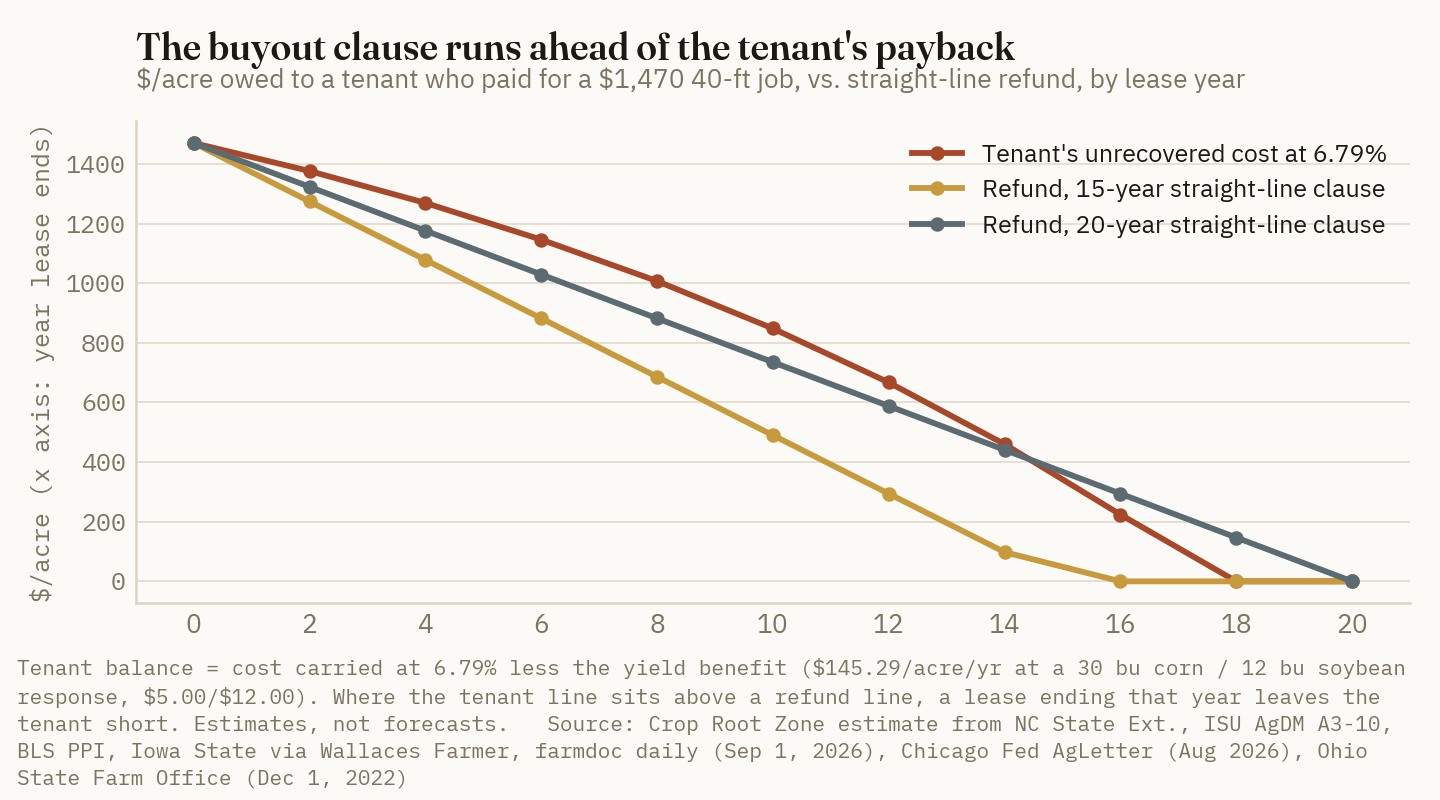
| Lease ends after year | Tenant's unrecovered cost, $/acre | Refund, 10-yr clause | Refund, 15-yr clause | Refund, 20-yr clause | Refund, 25-yr clause |
|---|---|---|---|---|---|
| 1 | 1,425 | 1,323 | 1,372 | 1,396 | 1,411 |
| 3 | 1,324 | 1,029 | 1,176 | 1,250 | 1,294 |
| 5 | 1,210 | 735 | 980 | 1,102 | 1,176 |
| 10 | 848 | 0 | 490 | 735 | 882 |
| 15 | 346 | 0 | 0 | 368 | 588 |
| Largest shortfall | 848 (yr 10) | 373 (yr 12) | 125 (yr 8) | 34 (yr 4) |
Crop Root Zone estimate on a $1,470/acre 40-ft job at a 30 bu corn / 12 bu soybean response, $5.00/$12.00, 6.79%. Unrecovered cost = cost carried at 6.79% less $145.29/acre a year of yield benefit. Refund = cost × (clause years − years elapsed) ÷ clause years, per the Ohio State Farm Office sample provision, Dec 1, 2022.
The 10-year clause is the most dangerous because it expires before the investment is recovered. A tenant whose lease ends in year 10 gets nothing back and still has $848 an acre unrecovered. The 12-to-15-year clause Ohio State suggests is better but still leaves up to $373 an acre short. A clause has to run about 25 years before the shortfall shrinks to a rounding error, and few landowners will sign a 25-year buyout on a field they may want to sell.
Ground Truth: Fix the formula, not the length. Write the buyout on the unpaid balance of a stated amortization schedule: for example, the remaining principal on a 20-year loan at a named rate. Do not use the straight-line fraction. Once both parties have a schedule, the number owed is printed for every year, the landlord can see the exposure in advance, and the tenant's interest is covered. Courts already enforce pro-rata reimbursement clauses. They can enforce an amortization table just as well.
4. The landlord's math: tile earns what the land earns
What's new: A landowner prices capital differently from a tenant. Indiana's top-quality farmland averaged $14,909 an acre in June (Purdue Agricultural Economics Report, Aug 17, 2026) and rented for $305 (Purdue via Pro Farmer, Aug 2026). That is a 2.05% cash yield. Owners hold land at that return because they expect appreciation and because land lasts. Purdue's survey authors warned that higher interest rates are pushing the price-to-rent ratio up and could weigh on land prices (Purdue, Aug 17, 2026).
Evidence: The table shows the rent increase a landlord needs to recover a $1,470 tile acre at different costs of capital. It sets those against two market references. One is a rent rise equal to about 30% of the yield gain, which is the share farmdoc's 2027 budget rent takes of average corn-soybean gross revenue. The other is the only survey of tiled versus untiled rents we found.
| Rent increase on a $1,470 tile acre | $/acre/yr | |
|---|---|---|
| Required: 6.79% loan, 30-year recovery | 116 | ██████████ |
| Required: 4% cost of capital, 30 years | 85 | ███████ |
| Required: 2.05% (land's cash yield), 30 years | 66 | ██████ |
| Required: 2.05%, 50 years | 47 | ████ |
| Market share: 30% of gain, 30 / 12 response | 44 | ████ |
| Market share: 30% of gain, 13 / 6 response | 20 | ██ |
| Observed: NW Ohio, tiled vs. untiled problem fields | 12–32 | ██ |
Crop Root Zone estimate. Capital recovery at the stated rate and life. 30% share: farmdoc's $321 2027 rent ÷ about $1,075 average gross revenue at 245 bu × $5.00 corn and 77 bu × $12.00 soybeans (Tibbs, University of Illinois Extension, Oct 9, 2026). Observed: Ohio State's Brian Roe, survey of 161 northwest Ohio farmers, $12–$28 for corn fields and $18–$32 for soybean fields, reported by No-Till Farmer, Oct 1, 2013. Land yield from Purdue, Aug 2026. Bars scale to $116.
Two results stand out. First, a rent increase of about $44, around 30% of the 30/12 yield gain, gives the landlord a 3.0% cash return on the tile. That is above the 2.05% the land itself pays. Over 40 years without counting any effect on land value, the internal return is only about 0.9%. Second, the observed rent premium of $12 to $32 sits right where a 30% share of the conservative 13/6 gain would put it, which is $20. Northwest Ohio renters were paying roughly a market share of a modest response, not enough to finance the tile from rent alone.
The rest of the landlord's return comes from the sale price. Michigan State's 2018 land value survey found tiled cropland worth about $1,000 an acre more than untiled cropland statewide (Wolf, Michigan State University, 2018). Illinois appraisers quoted by Farm Progress have cited differences of up to $2,000 an acre between poorly drained farms and well-drained farms with similar soils (Farm Progress, Aug 15, 2017). Neither is a controlled measure. Both suggest the market pays at least part of the tile's cost back to whoever owns the land when it sells.
Ground Truth: Tile on rented ground is a land-rate investment that is usually paid for with operating-rate money. On somewhat poorly drained ground, a landlord who pays for the job and takes a rent increase of about $44 earns more cash on the tile than on the land, and keeps any increase in land value. The tenant pays nothing up front and keeps about $101 an acre a year of the gain. On the conservative 13/6 response, the landlord's $20 increase earns 1.4% before any decline in the tile's value. On ground like that, neither party should be paying for 40-foot spacing.
5. Three ways to split it, priced side by side
What's new: Ohio State's sample provisions cover all three structures: landlord pays with higher rent, tenant pays with early-termination protection, and a shared cost with agreed percentages, contractor, design and completion date, with each party claiming its own expensing or depreciation (Moore, Ohio State Farm Office, Dec 1, 2022). The question is which one fits a lease that may run five years.
Evidence: All cases use the 30/12 response at $5.00/$12.00. The tenant's money costs 6.79%.
| Structure | Tenant outlay, $/acre | Rent change, $/acre/yr | Tenant net gain, $/acre/yr | Tenant payback, yr | Tenant NPV if lease ends in yr 5, $/acre | Landlord cash return on its outlay |
|---|---|---|---|---|---|---|
| Tenant pays all | 1,470 | 0 | 145 | 17.7 | −871 | Free asset, no outlay |
| 50/50 split | 735 | 0 | 145 | 6.4 | −136 | Land-value gain only |
| Landlord pays, market-share rent | 0 | +44 | 101 | none needed | +419 | 3.0% |
| Landlord pays, land-yield rent (2.05%, 30 yr) | 0 | +66 | 79 | none needed | +327 | 4.5% cash, full recovery at 2.05% |
| Landlord pays, loan-rate rent (6.79%, 30 yr) | 0 | +116 | 29 | none needed | +121 | 7.9% cash, full recovery at 6.79% |
Crop Root Zone estimate. NPV discounted at 6.79% with no buyout clause. Excludes taxes, which differ between an active tenant and a non-farming landlord (see our September piece on 15-year depreciation and recapture), repairs, and any change in land value.
The 50/50 split with rent unchanged is the only tenant-funded structure that fits inside a lease of normal length. The tenant's half pays back in about 6½ years at 6.79%. The landlord's half is paid back through land value rather than rent. On the conservative 13/6 response, the same split stretches the tenant's payback to about 20 years. Even sharing the cost does not rescue tile on ground that does not need much of it.
Ground Truth: The strongest offer a tenant can bring to a landlord this winter is: you pay for the tile, I'll pay a rent increase equal to about 30% of the value of the yield gain Iowa State's planning figures give for your drainage class, written as a fixed dollar step. On somewhat poorly drained ground that is about $44, which still leaves the tenant about $100 an acre a year with no capital at risk. If the landlord will not finance it, the tenant's fallback is a 50/50 split with the tenant's half protected by an amortization-schedule buyout, not a straight-line one. A tenant who pays the whole cost on a year-to-year lease is giving the landlord a $1,470-an-acre asset on credit, with no interest and no fixed repayment date.
References
- Brownfield Ag News, "Closing Grain and Livestock Futures: November 6, 2026," Nov 6, 2026 — https://www.brownfieldagnews.com/market-news/closing-grain-and-livestock-futures-november-6-2026/ ; and "Closing Grain and Livestock Futures: September 16, 2026," Sep 16, 2026 — https://www.brownfieldagnews.com/market-news/closing-grain-and-livestock-futures-september-16-2026/
- Federal Open Market Committee, statement of Oct 28, 2026 (target range held at 3.75%–4.00%, 10–2 vote), as reported Oct 28, 2026 — https://investinglive.com/central-banks/fomc-decision-oct-28/
- U.S. Bureau of Labor Statistics, Producer Price Index by Industry: Plastics Pipe and Pipe Fitting Manufacturing: Plastics Pipe (PCU3261223261221), via Federal Reserve Bank of St. Louis FRED, accessed Nov 9, 2026 — https://fred.stlouisfed.org/series/PCU3261223261221
- Hart, C.; Tong, J.; Zhang, W., "The Continuing Evolution of Iowa Farmland Ownership and Tenure: Results from the 2022 Survey," CARD Agricultural Policy Review, Iowa State University, Spring 2023 — https://agpolicyreview.card.iastate.edu/spring-2023/continuing-evolution-iowa-farmland-ownership-and-tenure-results-2022-survey
- Moore, R., "Lease Terms When Installing Drainage Improvements," Ohio State University Farm Office, Dec 1, 2022 — https://farmoffice.osu.edu/blog-tags/drainage-improvements
- Crop Root Zone, TRZ-0204, "A 40-Foot Tile Job Now Costs About $1,470 an Acre and Needs 24 Bushels of Corn a Year to Carry at 6.8%," Sep 17, 2026 (cost build from NC State Extension, rev. Feb 19, 2025, and ISU Ag Decision Maker A3-10, Mar 2026).
- Iowa State University Extension and Outreach, Ag Decision Maker File A3-10, "2026 Iowa Farm Custom Rate Survey," Mar 2026 — https://www.extension.iastate.edu/agdm/crops/pdf/a3-10.pdf
- Poole, C.; Youssef, M.; Skaggs, W., "Agricultural Subsurface Drainage Cost in North Carolina," NC State Extension, revised Feb 19, 2025 — https://content.ces.ncsu.edu/agricultural-subsurface-drainage-cost-in-north-carolina
- Schnitkey, G.; Paulson, N.; Baltz, J.; Rhea, B.; Zulauf, C., "Evaluating Returns Necessary to Justify Installation of Tile Drainage," farmdoc daily, Nov 29, 2022 — https://farmdocdaily.illinois.edu/2022/11/evaluating-returns-necessary-to-justify-installation-of-tile-drainage.html
- Paulson, N.; Schnitkey, G.; Tsay, J.; Zulauf, C., "Illinois Cash Rents in 2026 and Outlook for 2027," farmdoc daily (16):165, Sep 15, 2026 — https://farmdocdaily.illinois.edu/2026/09/illinois-cash-rents-in-2026-and-outlook-for-2027.html
- Tibbs, R., "Cautiously optimistic 2027 crop budget outlook," University of Illinois Extension Farm Focus, Oct 9, 2026 — https://extension.illinois.edu/blogs/farm-focus/2026-10-09-cautiously-optimistic-2027-crop-budget-outlook
- Walsten, M., "2026 Average Iowa Cash Rent Eases," Pro Farmer, May 22, 2026 (Iowa State University Extension survey FM 1851) — https://www.profarmer.com/news/agriculture-news/2026-average-iowa-cash-rent-eases
- Purdue University, "2026-08 PAER: Purdue Farmland Values and Cash Rent Survey Results," Purdue Agricultural Economics Report, Aug 17, 2026 — https://ag.purdue.edu/commercialag/home/paer-publication/2026-08-paer-purdue-farmland-values-and-cash-rent-survey-results/
- Pro Farmer, "Indiana's Farmland Values Hold Steady," Aug 2026 (Purdue survey cash rents) — https://www.profarmer.com/news/agriculture-news/indianas-farmland-values-hold-steady
- Federal Reserve Bank of Chicago, AgLetter No. 2013, "Second Quarter Midwest Farmland Values Unchanged," Aug 2026 — https://www.chicagofed.org/publications/agletter/2025-2029/august-2026
- Paulson, N.; Schnitkey, G.; Zulauf, C.; Zwilling, B., "Illinois Crop Budgets for 2027," farmdoc daily, Sep 1, 2026 — https://farmdocdaily.illinois.edu/2026/09/illinois-crop-budgets-for-2027.html
- Swoboda, R., "Does tiling pay?," Wallaces Farmer / Farm Progress, Apr 20, 2017 (Iowa State rules of thumb) — https://www.farmprogress.com/farm-operations/does-tiling-pay-
- Swoboda, R., "Drainage design — for profit and water quality," Wallaces Farmer / Farm Progress, Mar 24, 2017 (Iowa State Southeast Research Farm) — https://www.farmprogress.com/farm-business/drainage-design-for-profit-and-water-quality
- Iowa Code § 562.6, Farm tenancies — termination notice — https://www.legis.iowa.gov/docs/code/562.6.pdf
- Tidgren, K.A., "Farm Tenant Entitled to Recoup Unused Lime Costs," Iowa State University Center for Agricultural Law and Taxation, May 13, 2016 (Hettinger v. City of Strawberry Point, Iowa Ct. App. No. 15-0610, May 11, 2016) — https://www.calt.iastate.edu/post/farm-tenant-entitled-recoup-unused-lime-costs
- Lessiter, F., "Tile Pays On Rented Land," No-Till Farmer, Oct 1, 2013 (Brian Roe, Ohio State University survey of northwest Ohio farmers) — https://www.no-tillfarmer.com/blogs/1-covering-no-till/post/3940-tile-pays-on-rented-land
- Wolf, C., "2018 Michigan Agricultural Land Values," Michigan State University, 2018 — https://www.canr.msu.edu/news/wolf_landvalues18
- Farm Progress, "Does adding tile add value to farmland?," Aug 15, 2017 — https://www.farmprogress.com/management/does-adding-tile-add-value-to-farmland-
Disclosures
Crop Root Zone is an independent publication. Nothing here is investment advice. Market calls, where included, reflect the editors' own read and are not a recommendation to buy or sell any security.
A Grain Cart Costs About What a Used Farm Semi Costs to Own. Whether It Beats a Third Truck Depends on the Tractor in Front of It.
farmdoc puts a 1,000-bushel cart at $7,964 a year to own and Iowa State's used-semi example at $6,950, so the two machines nearly cancel. What decides it is the tractor hour, the cart's fuel burn and the 8 to 10% of combine capacity lost to stationary unloading. With a tractor already on the farm, the cart is cheaper above roughly 700 to 1,000 acres per combine at $5.76 diesel. Charge the tractor at Iowa's $0.34 per horsepower-hour rental rate and the extra truck is cheaper at almost any acreage one combine covers.
Iowa had 26% of its corn harvested on October 18, against a five-year average of 50%, and 57% of its soybeans against 74% (USDA NASS, Oct 19, 2026) [13]. A late harvest puts weight on every hour the combine spends not combining. It also brings back a question most Corn Belt farms answered years ago: is the next dollar of harvest capacity a grain cart, with a tractor and an operator, or one more semi and driver? More than 80% of Iowa respondents to an Iowa State survey owned at least one cart, and 60% owned more than one (Iowa State University, AgDM A3-16, Jun 2016) [8]. This piece prices the choice at this month's diesel. The cart costs about what the truck costs. The tractor pulling it decides the answer.
Our October 5 piece priced the haul mile and the hour at the dump line [15]. Our October 6 piece priced harvest weight exemptions [17], and our September 30 piece priced combine header loss [18]. None of those is repeated here. This piece prices the step before the road: getting grain from the combine to the truck.
1. What the market charges for a cart, and what owning one costs
What's new: Iowa's 2026 custom survey prices a hired grain cart, with tractor, fuel and operator, at an average of $9.25 an acre in corn and $8.10 in soybeans, from 72 responses each (Iowa State University, AgDM A3-10, Mar 2026) [1]. Nebraska's statewide average for running a cart to the field edge is $5.83 an acre, from six responses (University of Nebraska–Lincoln, EC823, Apr 24, 2026) [2]. farmdoc puts the full cost of owning and running a 1,000-bushel cart at $20.20 an acre in corn and $11.00 in soybeans, at $3.00 diesel and $22 labor (Lattz and Schnitkey, farmdoc, Aug 2025) [3].
Evidence: The custom surveys price the cart and the truck as separate services.
| Service (2026 surveys) | Unit | Average | Median or most common | Range | Responses |
|---|---|---|---|---|---|
| Iowa: grain cart, corn | $/acre | 9.25 | 8.75 | 3.00–22.00 | 72 |
| Iowa: grain cart, soybeans | $/acre | 8.10 | 8.00 | 2.00–19.00 | 72 |
| Iowa: cart with auger, rental only, corn | $/acre | 6.70 | 6.00 | 6.00–12.00 | 7 |
| Iowa: tractor rental, no operator or fuel | $/hp-hour | 0.34 | 0.35 | 0.14–0.50 | 18 |
| Iowa: semi rental | $/bu, round trip | 0.20 | 0.20 | 0.18–0.22 | 5 |
| Iowa: truck to market, 25 miles one way | $/bu | 0.200 | 0.200 | 0.090–0.350 | 97 |
| Iowa: harvest machine operator wage | $/hour | 24.45 | 25.00 | 15.00–40.00 | 81 |
| Nebraska: cart to field edge | $/acre | 5.83 | 5 | 4–8 | 6 |
| Nebraska: truck to storage or elevator | $/bu | 0.16 | 0.15 | 0.07–0.30 | 22 |
Basis: hired service including machine, fuel and operator unless marked rental. Iowa assumed $2.89 diesel; Nebraska respondents expected $2.93. Source: Iowa State University Extension, AgDM A3-10, Mar 2026 [1]; University of Nebraska–Lincoln, EC823, Apr 24, 2026 [2]. Iowa ranges exclude the single highest and lowest response.
The hired cart costs less than half of farmdoc's cost to own one. Iowa's gap between the $46.05 combining average and the $82.00 complete-harvest average for corn is $36 an acre. That $36 buys the cart and the haul to farm storage [1].
We repriced the owned cart for a farm running one combine over 2,500 acres, 60% corn and 40% soybeans. Illinois farm diesel averaged $5.76 a gallon in the week ending October 16, in a range of $5.39 to $6.01 (USDA AMS, Oct 16, 2026) [11]. That is almost double the $3.00 in farmdoc's figures. Two published fuel figures for the cart disagree by nearly five times. farmdoc's cart line implies about 0.85 gallons an acre in corn and 0.33 in soybeans [3]. Iowa State's fuel table gives 0.18 and 0.08 gallons for hauling grain from the field plus half a mile (Iowa State University, AgDM A3-27, Feb 2026) [6]. We carry both, as "heavy" and "light" fuel.
| Cart cost per acre, 2,500 acres, 60/40 corn and soybeans | $/acre | |
|---|---|---|
| Hired, Nebraska average, to field edge | 5.83 | ███░░░░░░░ |
| Owned, tractor already on farm, light fuel | 6.00* | ███░░░░░░░ |
| Hired, Iowa average, weighted 60/40 | 8.79* | █████░░░░░ |
| Owned, tractor already on farm, heavy fuel | 9.18* | █████░░░░░ |
| Owned, tractor rented at $0.34/hp-hour, light fuel | 13.27* | ███████░░░ |
| Owned, tractor rented at $0.34/hp-hour, heavy fuel | 16.45* | █████████░ |
| farmdoc full cost, repriced, 1,900 acres, tractor overhead charged | 18.68* | ██████████ |
Basis: $/acre including operator labor at $24.45 an hour times 1.1. Source: Lattz and Schnitkey, farmdoc, Aug 2025 [3]; Iowa State University AgDM A3-10 [1], A3-24 [5], A3-27 [6] and A3-29 [4]; University of Nebraska–Lincoln [2]; USDA AMS, Oct 16, 2026 [11]. *Crop Root Zone calculation. Owned rows spread farmdoc's $7,964 yearly cart cost over 2,500 acres and run the cart for as many hours as the combine, 178 a year at Iowa State's median capacities of 12.8 acres an hour in corn and 16.4 in soybeans. The rented tractor is an assumed 300 hp. The last row reprices farmdoc's own corn and soybean lines for diesel and wage only.
Ground Truth: The custom cart rate is priced as if the tractor costs nothing. A hired cart at $8.79 an acre sits between our owned cart on a tractor that would otherwise be parked ($6.00 to $9.18) and well below any cart whose tractor is paid for by the hour ($13.27 and up). The people quoting $9.25 are almost all running a tractor that planted in May. A farm that has to buy or rent horsepower for harvest should hire the cart before it buys one.
2. What a cart actually replaces: a third to two-thirds of a truck
What's new: No extension survey we found reports the number of trucks a combine needs with and without a cart. We built that number from published capacity figures. Iowa State's field-capacity guide says a combine's acres an hour may fall about 8 to 10% when it has to stop to unload (Iowa State University, AgDM A3-24, Feb 2026) [5]. The same guide says harvest performance is now often limited by grain cart availability and truck turnaround time, not by the combine [5].
Evidence: The cart does two jobs. It lets the combine unload on the move, which saves the 8 to 10%. It also fills a truck in minutes instead of leaving the truck under the spout while the combine fills it. That second job is the one a truck can replace. In our model, a 12-row combine harvests 12.8 acres an hour, Iowa State's median [5], in 200-bushel corn, an assumption. That is 2,560 bushels an hour. A semi carries about 1,000 bushels, close to the "nearly 1,000 bushels" Iowa State's survey reported for farm semis [8]. Without a cart, a truck spends 23 minutes being filled. With one, we assume five minutes for the transfer. We also assume a 45 mph average and a 30-minute stop at the buyer. All three are our assumptions, not survey data.
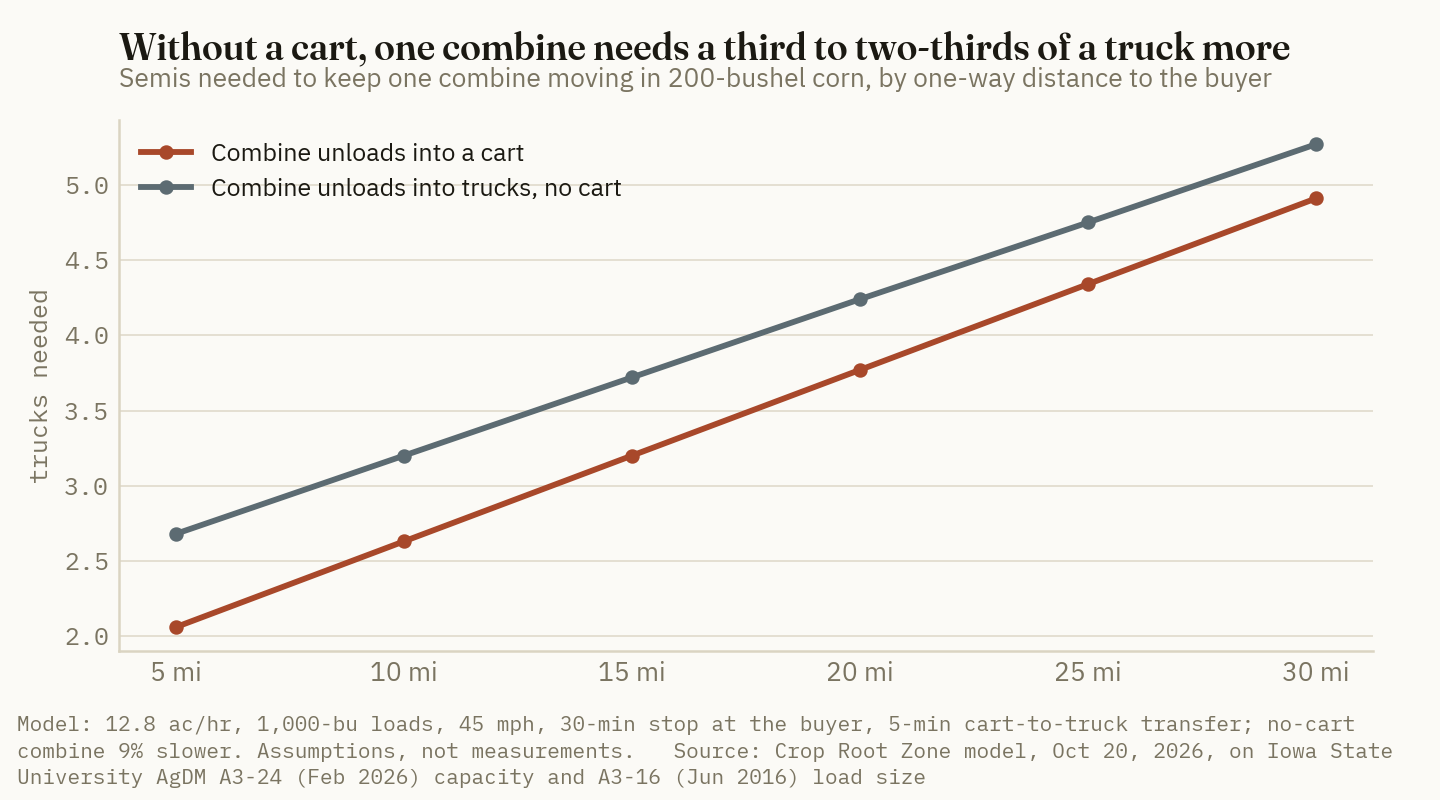
The gap is 0.65 trucks at 2 miles and 0.36 at 30. It narrows because the combine without a cart is also 9% slower, so it needs grain hauled away more slowly. Fleets come in whole trucks, so rounding matters more than the fraction.
| One-way distance | Trucks needed, with cart* | Trucks needed, no cart* | Whole trucks, with cart | Whole trucks, no cart |
|---|---|---|---|---|
| 2 miles | 1.72 | 2.37 | 2 | 3 |
| 5 miles | 2.06 | 2.68 | 2 or 3 | 3 |
| 8 miles | 2.40 | 2.99 | 3 | 3 |
| 15 miles | 3.20 | 3.72 | 3 or 4 | 4 |
| 25 miles | 4.34 | 4.75 | 5 | 5 |
Basis: one combine, 200-bushel corn, 1,000-bushel loads. Source: Crop Root Zone model on Iowa State University AgDM A3-24, Feb 2026 [5] and A3-16, Jun 2016 [8]. *Model output on assumed speed, stop and transfer times. "2 or 3" and "3 or 4" mean the combine waits about 3 to 6% of the time with the smaller fleet.
At 2 miles, the extra truck really is the substitute for the cart: two trucks with a cart or three without. At 8 miles, a farm with three semis gains no truck from a cart; it gains only the combine's 8 to 10%. At 25 miles the fleet is five trucks either way. Each extra 10 miles adds about 1.1 trucks with a cart and 1.0 without. That is the distance question we priced on October 5 [15], and it does not change the cart decision.
3. What the slower combine costs
What's new: The case for the cart beyond truck count rests on the 8 to 10% [5]. On 2,500 acres at Iowa State's median capacities, a combine with a cart needs about 178 field hours. Without one, at a 9% loss, it needs about 196. The difference is 17.6 hours.
Evidence: We price those hours two ways.
Out of pocket. The crew is four people in both setups: the combine operator plus either a cart operator and two drivers, or three drivers. Iowa State's survey counted 4.4 full-time equivalents per harvesting operation [8]. Four people at $24.45 an hour [1], times Iowa State's 1.1 labor factor [4], cost $107.58 an hour. Combine repairs follow the ASABE curve in Iowa State's cost guide, which puts accumulated repairs at 6% of list price by 1,500 hours and 9% by 1,800 [4]. On farmdoc's $784,500 list price for a 470-hp combine held seven years [3], each hour in that band adds about $78 of repairs. The combine also burns fuel while it travels to unload. We assume half its working rate of 1.25 gallons an acre [6], or about $51 an hour at $5.76. The total is about $237 an hour, or $4,171 a year on 2,500 acres.
Timeliness. Purdue's field crops team put corn field losses at 0.5% to 2% per week of harvest delay, accelerating after mid-November (Purdue University, Oct 30, 2009) [10]. Seventeen field hours at 12 hours a day, the working day in Iowa State's sizing example (Iowa State University, AgDM A3-28, Jan 2017) [9], is about 1.5 field days. Iowa State's rule is that fall weather allows fieldwork about 75% of the time [9], so the harvest runs about two calendar days longer and the average acre comes off about one day later. At the Iowa average bids of $4.24 corn and $11.85 soybeans on October 19 (USDA AMS, Oct 19, 2026) [14], with assumed yields of 200 and 60 bushels, the 2,500 acres carry about $1.98 million of crop. One day of delay at 0.5% to 2% a week costs $1,387 to $5,546.
17.6 hours
The extra combine time that stationary unloading adds on 2,500 acres at Iowa State's 8 to 10% capacity loss. It costs about $4,200 in crew, repairs and fuel, plus $1,400 to $5,500 of field loss. (Crop Root Zone calculation on Iowa State University AgDM A3-24 and A3-29, farmdoc and Purdue, Oct 20, 2026)
Both costs grow faster than acreage. Out-of-pocket cost rises in step with acres. The timeliness cost rises with the square of acres, because more acres mean both a longer delay and more crop exposed to it. That is why the cart's case strengthens with size. Purdue's 2% end is the one to use this fall. Iowa's corn harvest is 24 points behind its five-year average [13], so the last acres will be cut after mid-November, when Purdue says losses speed up [10].
4. The break-even
What's new: Set the cart's costs against an extra truck's costs and the capacity penalty, and the two machines nearly cancel. farmdoc puts owning a new 1,000-bushel cart, bought at 85% of its $84,250 list price and held 10 years at 5.5% interest, at $7,964 a year, repairs included [3]. Iowa State's worked example of a used farm semi, a $45,000 tractor and a $25,000 trailer at 5% interest, costs $6,950 a year to own (Iowa State University, AgDM A3-41, Aug 2017) [7]. Labor cancels: one person runs the cart or drives the third truck.
Evidence: Annual cost of each option, for one combine:
| Annual cost, $ | 1,000 acres | 2,500 acres | 4,000 acres |
|---|---|---|---|
| Cart ownership, 1,000 bu (farmdoc) | 7,964 | 7,964 | 7,964 |
| Cart fuel, light (Iowa State)* | 887 | 2,218 | 3,548 |
| Cart fuel, heavy (farmdoc)* | 4,070 | 10,176 | 16,282 |
| Tractor rental, 300 hp at $0.34/hp-hour* | 7,269 | 18,173 | 29,076 |
| Cart, tractor on farm, light fuel | 8,851 | 10,182 | 11,512 |
| Cart, tractor on farm, heavy fuel | 12,034 | 18,140 | 24,246 |
| Cart, tractor rented, light fuel | 16,120 | 28,354 | 40,588 |
| Extra semi ownership (Iowa State, 2017 prices) | 6,950 | 6,950 | 6,950 |
| Extra combine hours from stationary unloading* | 7.0 | 17.6 | 28.2 |
| Crew, repairs and fuel for those hours* | 1,668 | 4,171 | 6,674 |
| Field loss, 0.5% to 2% a week* | 222–887 | 1,387–5,546 | 3,550–14,198 |
| Extra truck, total | 8,840–9,506 | 12,508–16,667 | 17,173–27,822 |
Basis: one combine, 60% corn and 40% soybeans, $5.76 farm diesel plus 10% lubrication, labor for the cart operator or third driver excluded because it is the same in both. Source: Lattz and Schnitkey, farmdoc, Aug 2025 [3]; Iowa State University AgDM A3-10 [1], A3-24 [5], A3-27 [6], A3-28 [9], A3-29 [4], A3-41 [7]; Purdue University, Oct 30, 2009 [10]; USDA AMS, Oct 16 and Oct 19, 2026 [11][14]. *Crop Root Zone calculation. The semi uses Iowa State's 2017 example prices without adjustment.
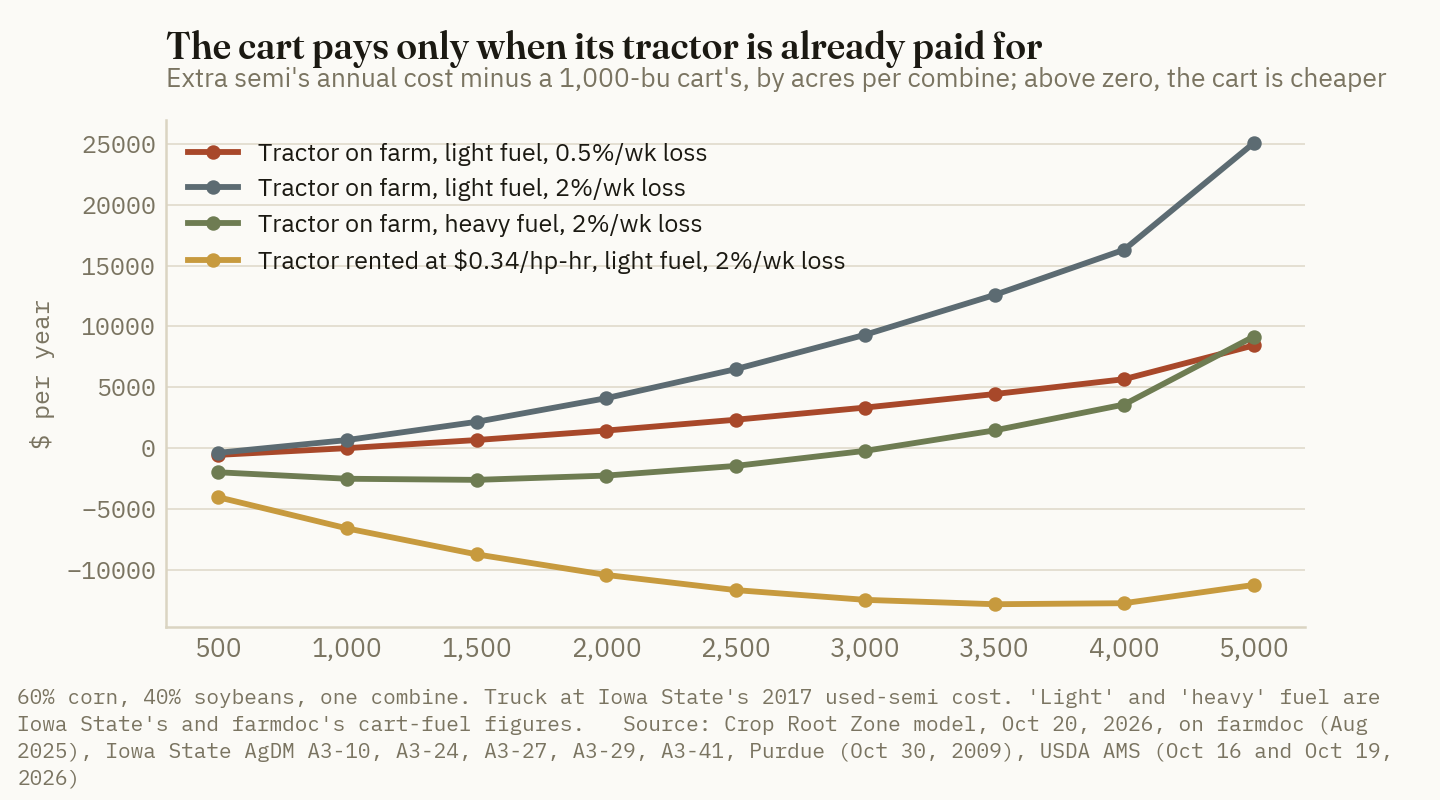
The crossovers, against the $6,950 truck:
- Tractor on farm, light fuel: the cart is cheaper above about 1,010 acres at a 0.5% weekly loss and 720 acres at 2%.
- Tractor on farm, heavy fuel: about 3,080 acres at 2%. At 0.5% it is past 11,000 acres, which no single combine covers.
- Tractor rented at $0.34 per horsepower-hour: about 7,470 acres at 2% with light fuel, and never with heavy fuel.
The truck figure is the weak cell. It is Iowa State's 2017 example, and current used semis and new hopper trailers cost more. We could not open current dealer listings to measure that. As a scenario, a $65,000 tractor and a $56,000 trailer would cost about $11,444 a year on Iowa State's method. That is our assumption, not a quote. At that price the cart is cheaper at every acreage when the tractor is on the farm and light fuel applies. With a rented tractor, the truck still wins above about 370 to 590 acres.
Ground Truth: The cart and the truck are close to a wash as pieces of steel. The tractor hour is not. A farm whose planting tractor would otherwise sit through October should own the cart from about 1,000 acres per combine. A farm that has to buy, rent or pull horsepower from fall tillage to run a cart should add a truck or hire the cart, at nearly any acreage one combine can cover. The fuel gap between farmdoc and Iowa State is the biggest unknown here, and it is cheap to close. Fill the cart tractor's tank on Monday, top it off on Saturday and divide by the acres cut. Above about half a gallon an acre in corn, the farm is on farmdoc's curve, and the cart needs more acres than most single-combine farms have.
5. What the arithmetic leaves out
Who drives. The labor cancels in the cost table, but the people do not. A third semi on public roads needs a driver qualified to run it. A cart needs a tractor operator who never leaves the farm. Iowa's survey prices both at the same $24.45 hourly wage [1]. Nebraska's respondents assumed $28.79 [2]. Neither survey separates truck drivers from tractor operators, so we cannot price the difference in who is available.
Where the trucks go. Without a cart, loaded semis come to the combine. In a wet fall that means trucks on soft ground, or a combine that runs to the field edge every load. Iowa State's 8 to 10% is an average and does not cover a field where trucks cannot enter. We did not price soil compaction or the days a truck cannot reach the combine. Both favor the cart.
Bigger combines. We used a 12-row machine at 12.8 acres an hour. Iowa State's table runs to 16-row heads at 17.0 acres an hour [5]. A faster combine fills its tank sooner, so each stop costs a larger share of its time. The model scales the hours, not the 8 to 10%, so a larger machine likely understates the cart's value.
Wear that hours trigger. ASABE's resale tables reduce a combine's value with annual hours as well as age. At age seven, for example, a combine used 300 hours a year keeps 39% of list and one used 500 hours keeps 34% [4]. We charged repairs for the extra hours but not that loss of resale value, which also favors the cart.
The dump line and the road. Distance, waiting at the elevator and legal weight set how many trucks a farm needs in the first place. Those questions are in our October 5 and October 6 pieces [15][17]. Highway diesel was $6.259 in the Midwest in the week of October 12 (EIA, week of Oct 12, 2026) [12], about 50 cents above farm diesel. That gap prices the truck's miles, and those miles are the same with or without a cart. The choice here moves combine hours and truck count, not miles.
What to check before buying either. Count last fall's combine hours and the minutes the combine sat waiting, from the yield-monitor or telematics log. If the combine waited mostly at the field edge, the bottleneck is the handoff and the cart solves it. If it waited because no truck had come back, the bottleneck is the road and the next machine is a truck. Then measure the cart tractor's fuel and set it against the two figures above. Our September 15 piece found used combines paying from about 1,420 acres [16]. On the same logic, the cart pays from about 700 to 1,000 acres per combine, but only on a tractor the farm already owns and would not otherwise use.
References
- A. Johanns and C. Hart, Iowa State University Extension and Outreach, Ag Decision Maker File A3-10, "2026 Iowa Farm Custom Rate Survey" (FM 1698), Mar 2026 — https://www.extension.iastate.edu/agdm/crops/pdf/a3-10.pdf
- G. McClure and J. Jansen, University of Nebraska–Lincoln, "2026 Nebraska Agricultural Custom Rates," EC823, Apr 24, 2026 — https://cap.unl.edu/sites/unl.edu.ianr.agecon.center-for-ag-profitability/files/media/file/2026-nebraska-custom-rates-report_ada.pdf
- Dale Lattz and Gary Schnitkey, University of Illinois farmdoc, "Machinery Cost Estimates: Harvesting," Aug 2025 (Tables 1, 2, 4 and 5 and Appendix Table 1) — https://farmdoc.illinois.edu/assets/management/machinery-costs/harvest_operations_2025.pdf
- Iowa State University Extension and Outreach, Ag Decision Maker File A3-29, "Estimating Farm Machinery Costs" (PM 710), revised Mar 2026 (Tables 1a and 3, from ASABE data) — https://www.extension.iastate.edu/agdm/crops/pdf/a3-29.pdf
- Iowa State University Extension and Outreach, Ag Decision Maker File A3-24, "Estimating the Field Capacity of Farm Machines" (PM 696), revised Feb 2026, updated by K. A. Rosentrater — https://www.extension.iastate.edu/agdm/crops/pdf/a3-24.pdf
- Iowa State University Extension and Outreach, Ag Decision Maker File A3-27, "Fuel Required for Field Operations" (PM 709), revised Feb 2026 — https://www.extension.iastate.edu/agdm/crops/pdf/a3-27.pdf
- W. Edwards, Iowa State University Extension and Outreach, Ag Decision Maker File A3-41, "Estimating Grain Transportation Costs," Aug 2017 — https://www.extension.iastate.edu/agdm/crops/html/a3-41.html
- W. Edwards and A. Plastina, Iowa State University Extension and Outreach, Ag Decision Maker File A3-16, "Grain Harvesting Equipment and Labor in Iowa," Jun 2016 — https://www.extension.iastate.edu/agdm/crops/html/a3-16.html
- Iowa State University Extension and Outreach, Ag Decision Maker File A3-28, "Farm Machinery Selection" (PM 952), revised Jan 2017 — https://www.extension.iastate.edu/agdm/crops/pdf/a3-28.pdf
- Purdue University Field Crops Team, "Managing the 2009 Harvest: Resources for Drying, Storing, Grain Quality, Crop Insurance and Marketing," Oct 30, 2009 — https://www.agry.purdue.edu/Ext/corn/news/articles.09/HarvestConcerns2009.pdf
- USDA Agricultural Marketing Service, Illinois Production Cost Report (Bi-weekly), report 3195, week ending Oct 16, 2026 — https://www.ams.usda.gov/mnreports/ams_3195.pdf
- U.S. Energy Information Administration, Gasoline and Diesel Fuel Update, week of Oct 12, 2026 — https://www.eia.gov/petroleum/gasdiesel/
- USDA National Agricultural Statistics Service, "Crop Progress," week ending Oct 18, 2026, released Oct 19, 2026 — https://release.nass.usda.gov/reports/prog4226.txt
- USDA AMS Livestock, Poultry and Grain Market News, "Iowa Daily Cash Grain Bids" (Report 2850), Oct 19, 2026 — https://www.ams.usda.gov/mnreports/ams_2850.pdf
- Crop Root Zone, TRZ-0256, "An Extra Mile to a Better Bid Costs 0.4 to 0.5 Cents a Bushel at $6.53 Diesel. An Extra Hour in the Dump Line Costs 3 to 12 Cents, and Iowa's $1 Soybean Premium Had a Delivery Date of October 2.," Oct 5, 2026.
- Crop Root Zone, TRZ-0196, "A New Combine Has to Cover About 2,700 Acres a Year to Beat Iowa's Custom Rate. Diesel Moved That Line by 60 Acres; a Slow Soybean Queue Moves It 500.," Sep 15, 2026.
- Crop Root Zone, TRZ-0260, "Iowa's 90,000-Pound Harvest Window Closes October 10 With 7% of Its Corn Cut. Nebraska Allows 25% Over Until Late December, and 10,000 Extra Pounds Is Worth 2 to 7 Cents a Bushel.," Oct 6, 2026.
- Crop Root Zone, TRZ-0244, "Every Soybean Left on a Square Foot Costs $3.13 an Acre This Fall. A 15-Minute Loss Check Pays if It Saves a Tenth of a Bushel.," Sep 30, 2026.
Disclosures
Crop Root Zone is an independent publication. Nothing here is investment advice. Market calls, where included, reflect the editors' own read and are not a recommendation to buy or sell any security.
Hiring a Dry Fertilizer Pass Costs $8.56 an Acre in Iowa at Today's Diesel. A New Pull-Type Spinner Asked at $36,362 Beats That Past About 640 Acres a Year. Renting One at the Surveyed $7.05 Does Not.
Six state surveys price hired dry spreading at $7.74 to $9.89 an acre, with a variable-rate premium of $1.28 in Ohio and $2.82 in Nebraska. A new 8-ton spinner carries about $3,980 a year of fixed cost at 5.12% real interest and breaks even near 640 acres with the tractor paid for, near 880 with it charged. A 72-foot air-boom asked at $148,500 needs about 3,450. The fertilizer on the acre is worth $79.55, nine times the spreading fee, so a 5.7% rate error costs $4.53 an acre. No public source prices a retailer's free-spreader offer or a pickup discount.
Iowa's 2026 custom rate survey puts dry bulk fertilizer spreading at $8.15 an acre, materials excluded, with a median of $8.00 and a range of $4.00 to $13.50 across 59 responses (Iowa State University, AgDM A3-10, Mar 2026) [1]. That rate assumed $2.89 diesel. Illinois farm diesel averaged $5.63 in the week ending October 2, the latest report posted as of October 13 (USDA AMS, Oct 2, 2026) [8], which moves the pass to about $8.56. Dealers on October 13 were asking a median $36,362 for a new 8-ton pull-type spinner spreader across 14 listings (Machinery Pete, accessed Oct 13, 2026) [13]. This piece prices the hired pass in six state surveys, builds an ownership cost for the spinner, a used spinner and an air-boom machine, and sets each against hiring and renting. Unlike the anhydrous bar, the sprayer and the strip-till rig in this series [20][21][22], the small spreader pays at ordinary farm size. The harder question is whether the farm can spread as evenly as the machine it replaces.
1. What a hired dry pass costs in six surveys
What's new: The four large 2026 surveys price fixed-rate dry spreading between $8.15 and $9.68 an acre. Two of them publish a variable-rate line. Two publish a rental rate for the spreader alone, and that rental rate sits within about $2 of the full hired pass.
Evidence:
| Survey | Service | Average $/acre | Median or most common | Range | Responses | At $5.63 diesel* |
|---|---|---|---|---|---|---|
| Iowa 2026 | Dry bulk, applied | 8.15 | 8.00 | 4.00–13.50 | 59 | 8.56 |
| Kansas 2026 | Dry fertilizer application, statewide | 8.40 | — | 5.50–15.00 | 131 | 8.81 |
| Nebraska 2026 | Dry, solid broadcast | 9.66 | 8 | 8–17 | 14 | 10.07 |
| Nebraska 2026 | Dry, variable rate | 12.48 | 12 | 9–22 | 12 | 12.89 |
| Ohio 2026 | Dry bulk, fixed rate | 9.68 | 10.00 | 5.50–20.00 | 73 | 10.02 |
| Ohio 2026 | Variable-rate fertilizer application | 10.96 | 10.25 | 1.50–25.00 | 54 | 11.30 |
| Wisconsin, 2025 season | Bulk dry, broadcast | 9.89 | 9.00 | 6.00–25.00 | 26 | not adjusted |
| Indiana 2025 (stale) | Broadcasting bulk dry fertilizer | 7.74 | — | — | 27 | not adjusted |
| Indiana 2025 (stale) | Precision fertilizer application | 7.90 | — | — | 14 | not adjusted |
| Iowa 2026 | Rental, dry bulk applicator, no tractor, fuel or labor | 7.05 | 7.50 | 5.00–9.00 | 8 | — |
| Ohio 2026 | Rental, dry bulk fertilizer applicator | 7.67 | 8.00 | 4.00–10.00 | 9 | — |
Basis: $/acre, materials excluded; custom rows include operator, power unit and fuel. Source: Iowa State University, AgDM A3-10, Mar 2026 [1]; University of Nebraska–Lincoln, 2026 [2]; Ohio State University Extension, Jun 29, 2026 [3]; Kansas Department of Agriculture and Kansas State University LUSO, 2026 [4]; University of Wisconsin–Madison Extension, survey launched Mar 2026 for the 2025 season [5]; Purdue University, Apr 2025 [6]. Iowa's ranges exclude the single highest and lowest response; Ohio's and Wisconsin's are reported minimum and maximum. *Crop Root Zone estimate: survey rate plus 0.15 gallons an acre [10] times the gap between $5.63 [8] and each survey's fuel basis: $2.89 in Iowa, $2.93 in Nebraska, $3.36 in Ohio (the low end of the range its authors describe), and Iowa's $2.89 assumed for Kansas, which publishes none. Wisconsin and Indiana state no fuel basis and are shown as published.
Three notes on the table. Kansas's text and district table give $8.40 from 131 reports; its history table prints $8.73 for the same year, and we use the figure the district table supports [4]. Illinois has no custom rate survey, and the University of Illinois machinery cost file we use as its benchmark has no dry spreader row at all (Lattz and Schnitkey, farmdoc, Aug 2025) [7]. Indiana's figures are from questionnaires collected in late 2024 and early 2025 and are 18 months old [6].
Diesel. Iowa State's fuel table puts spreading dry fertilizer with a bulk cart at 0.15 gallons an acre (Iowa State University, AgDM A3-27, Feb 2026) [10]. The $2.74 gap between Iowa's survey basis and $5.63 is worth 41 cents. A fuel surcharge on a spreading invoice above about 40 cents an acre is a rate increase.
Variable rate. Nebraska charges $2.82 more for variable-rate dry spreading than for constant-rate, a 29% premium [2]. Ohio's two averages differ by $1.28, or 13% [3]. Ohio's variable-rate minimum of $1.50 suggests some respondents reported a surcharge and others a full rate, so the Ohio gap is the softer of the two. That reading is ours. Iowa publishes a variable-rate surcharge for seeding and none for fertilizer, as our October piece on grid sampling noted [23]. Kansas publishes none [4]. Indiana's 2025 precision line sat 16 cents above its broadcast line [6].
Rental. Iowa's eight rental responses average $7.05 an acre for the spreader alone. Ohio's nine average $7.67 [1][3]. Kansas received rental reports for fertilizer applicators but too few to summarize [4]. In Iowa the complete hired pass costs only $1.10 more than the bare machine.
Ground Truth: At Iowa's surveyed rates, renting a spreader is the most expensive of the three options. Add 97 cents of fuel and 82 cents of labor to the $7.05 rental and the pass costs $8.84 with the farm's tractor counted as free, against $8.56 hired. Iowa's own worksheet for estimating a rental rate would put this machine near $3.17 an acre: 60% of the $8.15 custom rate, the share the worksheet assigns to tillage machinery, less $1.72 for a 150-horsepower tractor at the surveyed $0.34 per horsepower-hour and 29.7 acres an hour [1][11]. The surveyed rental is more than twice that. Either the rental responses describe small jobs, or the hired pass is priced on the fertilizer sale that comes with it. The surveys do not say which. A grower quoted a per-acre spreader rental above about $6.75 in Iowa should hire the pass instead, unless the rental is the only way to spread on the right day.
2. What the machines are asked at
What's new: We read dealer listings for one brand of pull-type spinner and one maker's air-boom line on October 13. These are asking prices from one listing site on one day. Sale prices are lower, and neither sample is a market average.
Evidence:
| Machine | Listings priced | Low ask | Median ask | High ask | Basis |
|---|---|---|---|---|---|
| New 2026 spinner, 8-ton, 60- to 90-foot spread (Dalton Mobility 800 and 800WS) | 14 | $32,434 | $36,362 | $38,935 | Two dealers, in Iowa and North Dakota [13] |
| New 2026 spinner, 10- to 12-ton (Dalton Mobility 1200WS) | 6 | $49,056 | $53,323 | $56,762 | One Iowa dealer [13] |
| Used spinner, 6- to 10-ton, 2015 to 2023 or year not stated | 6 | $8,950 | $24,500 | $30,500 | Six dealers in Iowa, Missouri, Nebraska and North Dakota [13] |
| New 2026 air-boom, 11-ton, 72-foot booms (Salford Valmar 8711) | 3 | $148,500 | $148,500 | $148,500 | One North Dakota dealer [14] |
| Used air-boom, 11-ton, 72-foot, 2020 and 2024 | 2 | $76,000 | — | $133,700 | Dealers in North Dakota and South Dakota [14] |
Basis: dealer asking prices in US dollars, freight and setup not included. Source: Machinery Pete, Dalton Ag Products pull-type fertilizer spreader listings (40 listings, 34 priced) [13] and Salford pull-type fertilizer spreader listings (first page, 49 of 67 listings) [14], both accessed Oct 13, 2026. Medians are Crop Root Zone calculations.
The cheapest new 8-ton units, at $32,434, are described as running on tractor hydraulics with no rate controller mentioned. The units at $38,935 are listed with variable-rate controls [13]. That $6,500 gap is the listed price of being able to follow a prescription map. The site's general pull-type spreader page showed 560 listings, but most of its first page was one Montana dealer's units marked "call for price," so we did not use it as a sample (Machinery Pete, accessed Oct 13, 2026) [15]. We did not reach auction-result pages and have no sold-price series.
3. What a spinner costs to own, and where it beats hiring
What's new: On Iowa State's ASABE-based method [9], the conventions of our sprayer and strip-till pieces [20][22] and this month's diesel, a new 8-ton spinner carries about $3,980 a year of fixed cost and $2.34 an acre of variable cost. It matches Iowa's hired rate at about 640 acres a year.
Evidence:
| Input | Value | Basis |
|---|---|---|
| Purchase price | $36,362* | Median ask, 14 new listings [13]; no discount taken |
| Years held | 10 | Convention of this series [20][22] |
| Resale at end | $12,727* | 35% after 10 years, ASABE "other" class [9], applied to the ask |
| Real interest rate | 5.12%* | 7.12% operating-loan rate [12] less 2% inflation [9] |
| Field capacity | 29.7 acres/hour | 60 feet at 6 mph, 68% field efficiency [11] |
| Capital recovery | $3,730/year | (36,362 − 12,727) × 0.13026 + 12,727 × 0.0512 |
| Insurance and housing | $245/year | 1% × (36,362 + 12,727) ÷ 2 [9] |
| Fixed cost | $3,976/year | Sum of the two lines above |
| Fuel and lube | $0.97/acre | 0.15 gal × $5.63 × 1.15 [8][9][10] |
| Labor | $0.82/acre | $22 × 1.1 ÷ 29.7 [1][9] |
| Repairs | $0.55/acre* | ASABE fertilizer-spreader curve at 337 hours [9] |
| Variable cost, tractor treated as paid for | $2.34/acre | Sum of the three lines above |
| Tractor | $1.72/acre* | 150 hp × $0.34 per hp-hour ÷ 29.7 [1] |
| Variable cost, tractor charged | $4.05/acre |
Source: Crop Root Zone calculation on the method in Iowa State University AgDM A3-29, Mar 2026 [9], with inputs from AgDM A3-10 [1], A3-24 [11] and A3-27 [10]; Machinery Pete, accessed Oct 13, 2026 [13]; Federal Reserve Bank of Chicago, Aug 2026 [12]; USDA AMS, Oct 2, 2026 [8]. *Crop Root Zone assumption or estimate. Every cost cell is model output.
The assumptions, in order of how much they matter:
- Interest. The Seventh District's average operating-loan rate was 7.12% at the end of the second quarter, the latest AgLetter published (Federal Reserve Bank of Chicago, Aug 2026) [12]. Iowa State's method subtracts 2% expected inflation [9]. This is the rate our sprayer and strip-till pieces used, unchanged [20][22].
- Tractor. We have no sourced horsepower requirement for an 8-ton spreader. We assumed 150 horsepower, the size in Iowa's own rental worksheet, at Iowa's surveyed tractor rental rate [1]. Earlier pieces in this series used farmdoc's tractor overhead, which is not available here because farmdoc has no spreader row [7].
- Repairs. ASABE's fertilizer-spreader curve is the steepest of the implement curves Iowa State prints: 13% of list by 300 hours, 40% by 700 and 63% by 1,000 [9]. At 1,000 acres a year the machine logs 337 hours in ten years and accumulates about 15% of its price. Our estimate runs from $0.47 an acre at 500 acres a year to $0.69 at 2,000. We hold it at $0.55.
- Speed. Iowa State's capacity table lists a 60-foot spreader at 6 mph and at 12 mph [11]. We use 6. At 12 mph labor halves and the break-even against Iowa falls from 639 acres to 600.
Break-even acres equal fixed cost divided by the gap between the hired rate and the owner's variable cost.
| Hired benchmark, diesel-adjusted | $/acre | Break-even, tractor paid for | Break-even, tractor charged |
|---|---|---|---|
| Iowa, dry bulk applied | 8.56 | 639 | 882 |
| Kansas, statewide | 8.81 | 614 | 836 |
| Ohio, fixed rate | 10.02 | 517 | 666 |
| Nebraska, solid broadcast | 10.07 | 514 | 661 |
| Ohio, variable rate | 11.30 | 444 | 549 |
| Nebraska, variable rate | 12.89 | 377 | 450 |
Basis: acres spread per year. Source: Crop Root Zone calculation, $3,976 ÷ (hired rate − $2.34 or $4.05), using unrounded figures; hired rates from the Section 1 table [1][2][3][4]. The variable-rate rows apply only to a spreader with a rate controller. At the $38,935 asked for units so equipped [13], fixed cost is $4,257 and those two rows become 475 and 404 acres with the tractor paid for.
639 acres
What a new 8-ton pull-type spinner, bought at the $36,362 median asking price, has to spread each year to cost the same as hiring Iowa's dry bulk pass at current diesel, with the tractor treated as already paid for. That is about 22 field hours. (Crop Root Zone calculation, Oct 13, 2026)
| Acres spread a year | Own, tractor paid for, $/acre | Own, tractor charged, $/acre | Paid-for column, scaled |
|---|---|---|---|
| 200 | 22.21 | 23.93 | ██████████ |
| 300 | 15.59 | 17.31 | ███████░░░ |
| 400 | 12.28 | 13.99 | ██████░░░░ |
| 600 | 8.96 | 10.68 | ████░░░░░░ |
| 800 | 7.31 | 9.02 | ███░░░░░░░ |
| 1,000 | 6.31 | 8.03 | ███░░░░░░░ |
| 1,500 | 4.99 | 6.70 | ██░░░░░░░░ |
| 2,000 | 4.32 | 6.04 | ██░░░░░░░░ |
Basis: $/acre, $3,976 ÷ acres + variable cost; read each row against Iowa's $8.56. Source: Crop Root Zone calculation, inputs as above. Bars scale the paid-for column, with 200 acres = 10 blocks. Repairs are held at $0.55 an acre, which overstates them slightly at low use and understates them at high use.
Sensitivities. Each point of interest is worth about 45 acres: the Iowa break-even is 589 at Iowa State's 4% example rate and 729 if the full 7.12% is charged. Price moves it from 570 acres at the low ask to 684 at the high one. Diesel moves it by seven acres, because the owner burns the fuel the custom operator passes through.
Acres spread are not acres farmed. A farm that spreads a two-year phosphate and potash rate ahead of corn covers half its ground each fall. On that practice, 639 acres spread is about 1,280 acres of corn and soybeans. Spring urea, ammonium sulfate or pelletized lime through the same machine adds acres back.
Against renting. Owning beats Iowa's $7.05 rental once fixed cost plus repairs falls below it, at about 610 acres. Against Ohio's $7.67 the line is about 560.
4. The used spinner and the air-boom
What's new: A used spinner breaks even at roughly 470 acres. A new air-boom machine needs about 3,450 acres against fixed-rate hire and about 1,800 against Nebraska's variable-rate price. Both figures rest on thinner inputs than Section 3.
Evidence:
| Machine | Purchase | Resale assumed | Fixed cost, $/year | Variable, tractor paid for, $/acre | Break-even vs Iowa $8.56 | Break-even, tractor charged |
|---|---|---|---|---|---|---|
| New 8-ton spinner | $36,362 | $12,727 | 3,976 | 2.34 | 639 | 882 |
| Used spinner | $24,500 | $7,272* | 2,775 | 2.64* | 468 | 659 |
| New 72-foot air-boom | $148,500 | $51,975 | 16,237 | 3.86* | 3,451 | 4,961 |
Basis: acres spread per year, 5.12% real interest, 10 years. Source: Crop Root Zone calculation on Iowa State University AgDM A3-29 [9], prices from Machinery Pete, accessed Oct 13, 2026 [13][14]. *Crop Root Zone assumptions: used resale is 20% of the new ask, ASABE's "other" class at 20 years; used repairs are $0.85 an acre, the ASABE curve from 370 to 707 hours at 1,000 acres a year; air-boom repairs are $2.21 an acre, the same spinner-type curve at 562 hours and 2,000 acres a year; air-boom capacity is 35.6 acres an hour from Iowa State's formula at 72 feet, 6 mph and 68% efficiency [11]; air-boom fuel is the 0.15-gallon bulk-cart figure [10], which does not count the fan.
The used row has two weak points. Six listings spanning 6 to 10 tons and $8,950 to $30,500 are not a price series, and the starting hours on a used spreader are unknown. Iowa State's guide suggests multiplying age by the buyer's own annual use [9], which is what we did.
The air-boom row is weaker still. ASABE has no air-boom spreader category, so the repair line applies a spinner curve to a machine four times the price. We ran it at 6 mph. All three priced new listings came from one dealer [14]. Against Nebraska's $12.89 variable-rate price the break-even is about 1,800 acres, and against Ohio's $11.30 about 2,180, with the tractor paid for. The direction is reliable and the numbers are not: an air-boom is a purchase for a farm spreading several thousand acres a year, or for one that values the pattern.
5. What the arithmetic leaves out
What's new: Four things sit outside the break-evens. The largest is spread accuracy, because the product costs nine times the pass.
Evidence:
The product dwarfs the fee. Illinois distributors asked an average $936 a ton for MAP and $516.36 for potash, F.O.B., in the week ending October 2 [8]. At the upper annual rates in Iowa's long-term trials, 56 pounds of P2O5 and 70 of K2O, that is $79.55 an acre of fertilizer, as our October 12 piece calculated [20]. The hired pass is $8.56.
| Rate error | Cost at $79.55 of product per acre | Share of the $8.56 hired fee | |
|---|---|---|---|
| 1% | $0.80 | 9% | █░░░░░░░░░ |
| 2% | $1.59 | 19% | ██░░░░░░░░ |
| 5% | $3.98 | 46% | █████░░░░░ |
| 5.7% | $4.53 | 53% | █████░░░░░ |
| 10.8% | $8.56 | 100% | ██████████ |
Basis: $/acre of fertilizer over-applied, or under-applied and not delivered to the crop. Source: Crop Root Zone arithmetic on USDA AMS asking prices, Oct 2, 2026 [8], and the rates in [20]. The 5% row is Ohio State's outer tolerance for metering calibration [16]. The 5.7% row is the uncalibrated spreader in a University of Georgia example [17]. Bars scale the fee-share column, with 100% = 10 blocks.
Ohio State's calibration guide says the metering system should land within 5% of target and that 1% to 2% is attainable [16]. That is the rate. The pattern is separate. The guide calls for a pan test under ASABE Standard S341.4 and ISO 5690, with baffled pans on 2.5-foot spacing across twice the swath: 47 pans for a 60-foot swath and 63 for 80 feet [16]. A University of Georgia example shows why rate alone misleads. A spreader set for 300 pounds of potash on a 50-foot swath averaged 317 pounds before calibration with a coefficient of variation of 49.5%. After calibration it averaged 310 pounds with a CV of 12.5%. The extension target is 15% or less (University of Georgia Extension, Feb 13, 2022) [17].
Blends are the harder case, and fall phosphate and potash usually go on as a blend. An Auburn University thesis spread a 10-26-26 blend through a dual-disc spinner and found the two nutrients landed in different patterns at every feed rate and disc speed: a "W" shape for P2O5 and an "M" for K2O. DAP granules travelled farther than potash (Thaper, Auburn University, 2014) [19]. Iowa State's guidance is that a pattern check should be run on every material, that swath width should not be adjusted to hit a field rate because streaking results, and that an operator unsure of the pattern can make two half-rate trips (Hanna and Sawyer, Iowa State University, Apr 9, 2001) [18]. Two trips double the owner's fuel, labor and hours. The same guide notes that custom application is typically done with a pneumatic spreader [18], which meters to each outlet instead of throwing product.
We found no US trial that prices the yield cost of an uneven phosphate and potash pattern in corn or soybeans. Figures from New Zealand and Manitoba reached us only as search-result summaries of pages that would not open, and we have not used them.
Ground Truth: A grower saves about $2.25 an acre by owning a new spinner at 1,000 acres instead of hiring, or $2,250 a year. A 3% rate error on $79.55 of product costs $2.39 an acre and erases it. The ownership case therefore depends on a scale ticket and a set of pans more than on the purchase price. The cheap check is the one Ohio State describes: weigh the load in and out, divide by the acres the controller logged, and compare with the target [16]. A farm that will not do that each fall, and again when the blend changes, is better served by the retailer's machine even above 640 acres. A farm that will do it gets something the hired pass cannot give at any price, which is its own choice of day.
Capacity and timing. Iowa State lists a 60-foot spreader at 29.7 acres an hour at 6 mph and an 80-foot machine at 79.1 acres an hour at 12 mph [11]. The second figure is closer to a retailer's floater. An 8-ton box holds about 72 acres of a 221-pound blend at the rates above (our arithmetic), so 640 acres is nine loads and about 71 tons. The owner's 22 field hours fit inside three fall days. What no survey prices is the wait for the hired machine after a late harvest, and we found no current public report of fall 2026 application backlogs.
Tendering. The hired rate includes getting product to the field. Our ownership cost includes no tender, wagon or road time to the plant. That raises every break-even in Sections 3 and 4.
Retailer spreaders and fertilizer price. Retailers that send a pull-type spreader out with the product are common in farmer accounts, sometimes at no charge. We found no retailer that publishes those terms and no survey that separates a free spreader from a rented one. The only public prices are the Iowa and Ohio rental lines in Section 1. We also could not source a discount for picking product up or for taking it without application. The USDA Illinois prices above are already F.O.B. distributor asks [8], so the public benchmark is a pickup price, and a quote that bundles delivery and spreading cannot be checked against it line by line. Ask for the product price, the freight and the application charge separately.
Who should own one. A farm spreading more than about 650 acres a year with a tractor already on hand, a scale it trusts and an operator willing to run a pan test has a sourced cost case for a new spinner, and a used one works from about 470 acres. A farm spreading every other year on fewer than 1,300 acres does not reach the line on phosphate and potash alone. Below about 400 acres spread, a spreader has to cost less than about $22,800 to match Iowa hire, which means a used machine. Renting at $7 an acre is a timing purchase. An air-boom needs a variable-rate program across several thousand acres to pay. For everyone else, the cheapest pass in this series is still the one the retailer makes: $8.56 an acre, against $17.05 for anhydrous [21] and $32.12 for a strip-till pass with dry fertilizer [20], each at the diesel price of its own week.
References
- Iowa State University Extension and Outreach, Ag Decision Maker File A3-10, "2026 Iowa Farm Custom Rate Survey" (FM 1698), revised March 2026 — https://www.extension.iastate.edu/agdm/crops/pdf/a3-10.pdf
- University of Nebraska–Lincoln, Center for Agricultural Profitability, "Nebraska Agricultural Custom Rates 2026" (report), 2026 — https://cap.unl.edu/sites/unl.edu.ianr.agecon.center-for-ag-profitability/files/media/file/2026-nebraska-custom-rates-report_ada.pdf
- Ohio State University Extension, "Ohio Farm Custom Rates 2026," summary dated June 29, 2026 — https://farmoffice.osu.edu/sites/aglaw/files/site-library/Ohio%20Farm%20Custom%20Rate%20Summary%202026%20June%2029.pdf
- Kansas Department of Agriculture and Kansas State University Land Use Survey Office, "Kansas Custom Rates 2026," accessed Oct 13, 2026 — https://www.agmanager.info/sites/default/files/pdf/CustomRates_2026.pdf
- University of Wisconsin–Madison Division of Extension, "Custom Rates for 2025 Wisconsin Farm Operations," survey launched March 2026, posted August 2026 (Table 4; the table's own heading reads 2024) — https://farms.extension.wisc.edu/files/2026/08/Custom-Rates-for-2025-Wisconsin-Farm-Operations.pdf
- Michael Langemeier, Purdue University Center for Commercial Agriculture, "2025 Indiana Farm Custom Rates," April 2025 (stale; 97 respondents, late 2024 to early 2025) — https://ag.purdue.edu/commercialag/home/wp-content/uploads/2025/04/20250417_Langemeier_2025IndianaFarmCustomRates.pdf
- Dale Lattz and Gary Schnitkey, University of Illinois farmdoc, "Machinery Cost Estimates: Field Operations," August 2025 (Table 1; no dry fertilizer spreader row) — https://farmdoc.illinois.edu/assets/management/machinery-costs/field_operations_2025.pdf
- USDA Agricultural Marketing Service, Illinois Production Cost Report (Bi-weekly), report 3195, week ending Oct 2, 2026 (latest posted as of Oct 13, 2026) — https://www.ams.usda.gov/mnreports/ams_3195.pdf
- Iowa State University Extension and Outreach, Ag Decision Maker File A3-29, "Estimating Farm Machinery Costs" (PM 710), revised March 2026 (Tables 1b, 2 and 3) — https://www.extension.iastate.edu/agdm/crops/pdf/a3-29.pdf
- Iowa State University Extension and Outreach, Ag Decision Maker File A3-27, "Fuel Required for Field Operations" (PM 709), revised February 2026 — https://www.extension.iastate.edu/agdm/crops/pdf/a3-27.pdf
- Iowa State University Extension and Outreach, Ag Decision Maker File A3-24, "Estimating the Field Capacity of Farm Machines" (PM 696), revised February 2026 — https://www.extension.iastate.edu/agdm/crops/pdf/a3-24.pdf
- Federal Reserve Bank of Chicago, AgLetter No. 2013, August 2026 (second-quarter 2026 survey; rates at end of period) — https://www.chicagofed.org/publications/agletter/2025-2029/august-2026
- Machinery Pete, Dalton Ag Products pull-type fertilizer spreader dealer listings (40 listings, asking prices), accessed Oct 13, 2026 — https://www.machinerypete.com/applicators/pull-type-fertilizer-spreaders/dalton-ag-products
- Machinery Pete, Salford pull-type fertilizer spreader dealer listings (first page, 49 of 67 listings, asking prices), accessed Oct 13, 2026 — https://www.machinerypete.com/applicators/pull-type-fertilizer-spreaders/salford
- Machinery Pete, pull-type fertilizer spreader dealer listings (category page, first page of 560 listings), accessed Oct 13, 2026 — https://www.machinerypete.com/applicators/pull-type-fertilizer-spreaders
- Trey Colley, John Fulton, Dewey Mann and Kaylee Port, Ohio State University Extension, "Spinner-Disc Spreader Set Up and Calibration," Ohioline FABE-561, May 24, 2018 — https://ohioline.osu.edu/factsheet/fabe-561
- University of Georgia Extension, Precision Ag and Irrigation, "Proper Spreader Calibration is Important for Precision Fertilizer Applications," Feb 13, 2022 — https://precisionagirrigation.extension.uga.edu/2022/02/proper-spreader-calibration-is-important-for-precision-fertilizer-applications
- Mark Hanna and John Sawyer, Iowa State University Integrated Crop Management, "Equipment considerations: dry granular fertilizer," IC-486(4), Apr 9, 2001 — https://crops.extension.iastate.edu/encyclopedia/equipment-considerations-dry-granular-fertilizer
- Ravinder Thaper, "Effect of vane shape and fertilizer product on spread uniformity using a dual-disc spinner spreader," M.S. thesis, Auburn University, Jun 27, 2014 (abstract read; full text not opened) — https://etd.auburn.edu/handle/10415/4208
- Crop Root Zone, TRZ-0272, "A Hired Fall Strip-Till Pass With Banded Dry Fertilizer Costs About $32 an Acre in Iowa. A New 16-Row Rig Asked at $249,000 Beats That Past About 1,300 Acres. The Trials Do Not Let It Cut the P and K Rate.," Oct 12, 2026.
- Crop Root Zone, TRZ-0232, "Hiring an Iowa Anhydrous Pass Costs About $17 an Acre at Today's Diesel. A New Toolbar Beats It Only Past About 1,500 Acres, and Only if the Tractor Is Treated as Free.," Sep 25, 2026.
- Crop Root Zone, TRZ-0268, "A New 120-Foot Sprayer Needs About 5,600 Acre-Passes a Year to Beat Iowa's $9.35 Custom Rate. A Seven-Year-Old One Needs 3,300. A Pull-Type Needs 1,150.," Oct 9, 2026.
- Crop Root Zone, TRZ-0240, "A 2.5-Acre Grid Sample Costs About $8 an Acre. Over Four Years, It Pays if It Moves 2 Pounds of Phosphate an Acre a Year.," Sep 29, 2026.
Disclosures
Crop Root Zone is an independent publication. Nothing here is investment advice. Market calls, where included, reflect the editors' own read and are not a recommendation to buy or sell any security.
A 2.5-Acre Grid Sample Costs About $8 an Acre. Over Four Years, It Pays if It Moves 2 Pounds of Phosphate an Acre a Year.
Iowa's 2026 custom-rate survey puts GPS grid soil testing at $7.95 an acre. Built up from 2026 lab fees and per-sample collection charges, one pass costs about $1.90 to $3.40 an acre on a 10-acre composite, $3.80 to $6.70 on 5-acre zones, $7.60 to $13.50 on a 2.5-acre grid and $19 to $34 on a 1-acre grid. Spread over the sampling cycle and priced at September's $925 DAP and $495 potash, a 2.5-acre grid on a four-year cycle breaks even if it redirects about 2 lb of P2O5 an acre a year, or keeps maintenance fertilizer off about 2% of a field. A 1-acre grid needs 6.5 lb. Iowa's dense-grid strip trials saved about 4.5 lb of P2O5 and 7.5 lb of K2O a year. That covers a 2.5-acre grid easily and only just covers a 1-acre grid on a four-year cycle. Zones sampled every two years cost about the same per year as a grid every four.
The combines are rolling, and on most Corn Belt farms the soil probe follows them. Iowa State's guidance treats the window after harvest and before fall fertilization as one of the two best times to sample (Iowa State University, PM 287, Sep 2003). Illinois Extension calls fall after harvest "an ideal season" (University of Illinois Extension, accessed Sep 29, 2026). This year's samples will be priced against expensive phosphate. DTN's mid-September retail survey had DAP at $925 a ton, MAP at $967 and potash at $495 (DTN, Sep 23, 2026). That makes phosphate about $1.01 a pound of P2O5 and potash about 41 cents a pound of K2O. The sampling itself is not cheap either. Iowa's 2026 custom-rate survey puts GPS grid soil testing at $7.95 an acre (Iowa State University, FM 1698, Mar 2026). This piece treats the sample as a field operation. It asks what each common density costs per acre, how long a map lasts, and how many pounds of fertilizer a finer map has to redirect to cover its cost at today's prices.
1. What a soil sample costs in 2026
What's new: The 2026 Iowa Farm Custom Rate Survey drew 205 responses covering 4,698 rates. It lists GPS grid soil testing at an average of $7.95 an acre, a median of $8.00 and a range of $3.00 to $12.50, from 18 responses (Iowa State University, FM 1698, Mar 2026). The survey does not state the grid size or whether the lab fee is included. Nebraska's 2026 custom-rate report carries no soil-sampling line, and Ohio State's summary of its 2026 report lists none (University of Nebraska–Lincoln, 2026 Nebraska Agricultural Custom Rates; Ohio State University Farm Office, Jun 26, 2026). For most growers, the Iowa figure is the only public survey price.
Evidence: Because the survey leaves the grid size open, we built the cost from its two parts: a per-sample collection fee and a per-sample lab fee. Lab schedules are public:
| Lab | Package | $/sample | Includes | Volume terms |
|---|---|---|---|---|
| UW Soil and Forage Lab (Wisconsin) | Farm field routine | 11.00 | pH, lime requirement, OM, P, K, recommendations | 5% off 25–50 samples, 10% off 50+ per month |
| MU Soil and Plant Testing Lab (Missouri) | Package 1, routine | 15.00 | pH, buffer pH, OM, Mehlich-3 P, K, Ca, Mg, S, micros, CEC | "Discounts for large numbers" on request |
| Ward Laboratories (Nebraska) | S-1 Basic | 17.35 | pH, CEC, nitrate, P, K, Ca, Mg, Na | Grid pricing on request |
| Ward Laboratories (Nebraska) | S-4 Routine | 23.65 | S-1 plus OM, S, Zn, Fe, Mn, Cu | Grid pricing on request |
Source: UW Soil and Forage Lab fee brochure, Aug 1, 2025; MU Soil and Plant Testing Laboratory, tests and fees, accessed Sep 29, 2026; Ward Laboratories, 2026 Fee Schedule, effective Jan 1, 2026. Prices per sample, excluding shipping.
Collection fees vary more. New Vision Co-op in Minnesota lists grid sampling at $8 to $10 per sample, depending on grid size (New Vision Co-op, page updated Jul 17, 2026). An informal survey of providers in eastern North Carolina found $6 to $10 an acre for collection alone on a 2.5-acre grid, which works out to $15 to $25 per sample (NC State Extension, AG-439-36, rev. Jun 25, 2025). We use the Minnesota per-sample fee and the $11-to-$23.65 lab range. Multiplying by the number of samples per acre gives the cost of one pass:
| Method | Acres per sample | Samples per acre | Collection + lab, $/acre per pass | |
|---|---|---|---|---|
| Composite by soil area | 10 | 0.1 | 1.90–3.37* | █░░░░░░░░░ |
| Management zones | 5 | 0.2 | 3.80–6.73* | ██░░░░░░░░ |
| Grid, 2.5 acre | 2.5 | 0.4 | 7.60–13.46* | ████░░░░░░ |
| Grid, 1 acre | 1 | 1.0 | 19.00–33.65* | ██████████ |
| Iowa survey, GPS grid | n/a | n/a | 7.95 avg (3.00–12.50) | ███░░░░░░░ |
Source: Iowa State University, FM 1698, Mar 2026 (survey row); lab and collection fees as above. *Crop Root Zone estimates: $8–10 collection plus $11–23.65 lab per sample. Bars scale to the 1-acre midpoint ($26.33) = 10 blocks. The zone row excludes the cost of building the zones (Section 2).
The survey average falls at the bottom of our 2.5-acre build-up. That is what volume lab pricing on a few hundred grid samples would produce, and it suggests the Iowa figure mostly reflects 2.5-acre work at bulk lab rates. Iowa State says no one grid size fits all fields but suggests a minimum of one sample per 2.5 acres. For zones or soil-area sampling, it says each sample should cover no more than about 10 acres (PM 287, Sep 2003). Those are the two ends of the table above.
Ground Truth: The lab fee, not the probe, sets the cost of density. Going from a 2.5-acre to a 1-acre grid multiplies the sample count by 2.5, and with it the lab bill. The labor does not scale down, because the truck still stops at every point. A grower quoted a flat per-acre price for 1-acre sampling that is less than about twice the 2.5-acre price is probably getting fewer cores per sample or a thinner lab package. Ask which, before comparing quotes.
2. The cycle is half the price
What's new: A map is used more than once, so its cost per crop year depends on how often it is redone. The guidance ranges from two to five years. Iowa State says a new soil test should be planned every two years for most systems. It allows three or four years when fields are near Optimum and on maintenance fertilization (Iowa State University, PM 1688, Feb 2023). Illinois Extension suggests every two to four years at optimum fertility. Nebraska's CropWatch guidance puts phosphorus resampling at about every five years and pH at 8 to 10 years after lime (University of Nebraska–Lincoln CropWatch, undated). One Kansas consulting firm says "on average, a grid soil sample will last four years" (Crop Quest, accessed Sep 29, 2026).
Evidence: Zone sampling needs a map of the zones first. Yield maps and imagery a grower already owns cost nothing extra. A soil electrical-conductivity survey does cost money. The most recent public figure we found is from Louisiana State University's AgCenter: $4 to $9 an acre, with a surface map "useful for 10 years" (LSU AgCenter, Louisiana Agriculture, Summer 2001). The price is 25 years old, so we use it only as an order of magnitude. One Kansas co-op describes zone sampling as costing more in the first year and "much lower priced in subsequent years" (American Plains Co-op, Mar 11, 2019). Spreading each pass over its cycle gives:
| Method | Every 2 years, $/acre/yr | Every 4 years, $/acre/yr |
|---|---|---|
| Composite, 10 acres | 0.95–1.68* | 0.48–0.84* |
| Zones, 5 acres, plus EC map over 10 years | 2.30–4.27* | 1.35–2.58* |
| Grid, 2.5 acres (build-up) | 3.80–6.73* | 1.90–3.37* |
| Grid, 2.5 acres (Iowa survey $7.95) | 3.98 | 1.99 |
| Grid, 1 acre | 9.50–16.83* | 4.75–8.41* |
Source: Crop Root Zone calculation from Section 1 costs; Iowa State University, FM 1698, Mar 2026; LSU AgCenter, 2001 (EC mapping at $4–9 an acre, 10-year life). *Estimates.
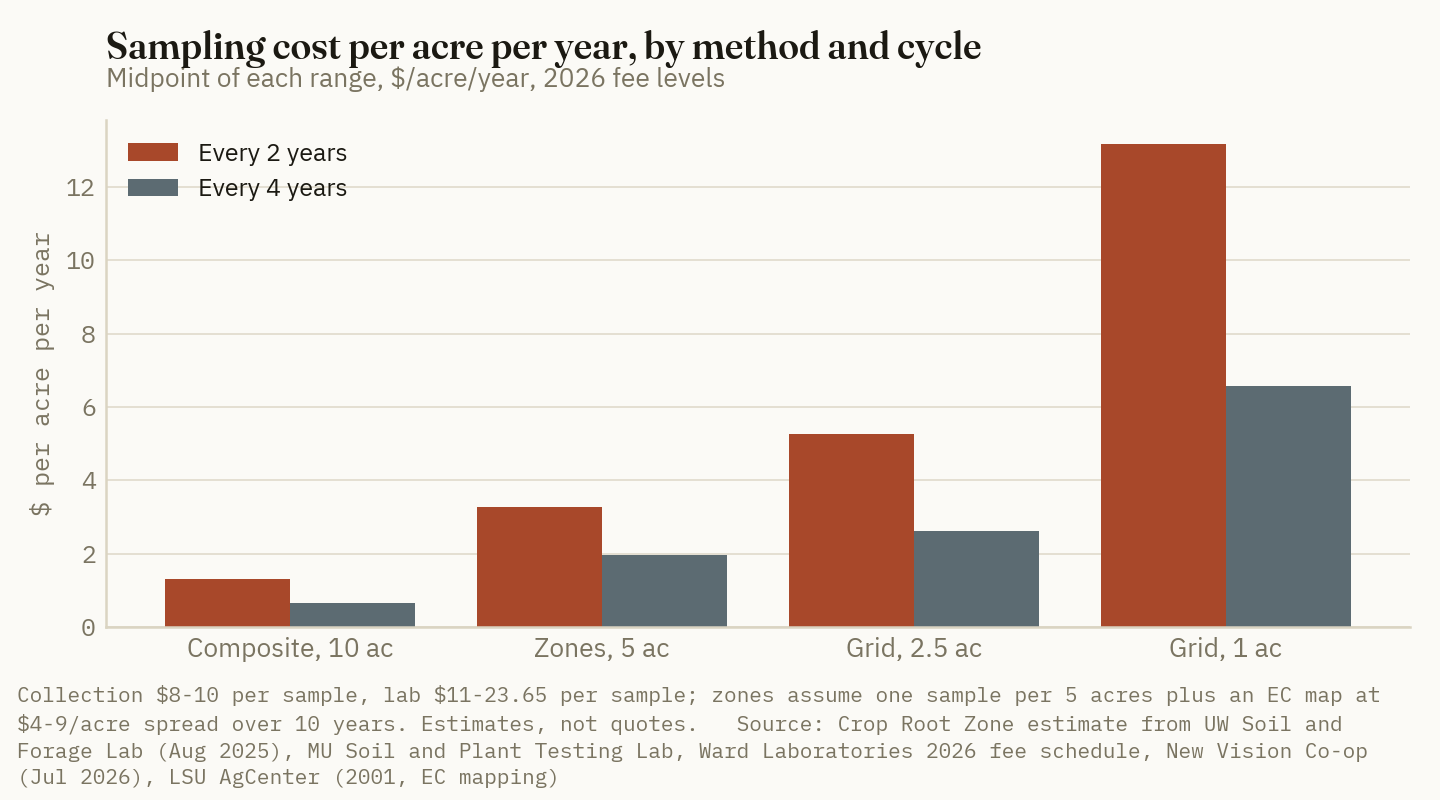
The table shows a choice that quotes by the acre hide. A 2.5-acre grid sampled every four years costs about $1.90 to $3.40 an acre a year. Zones resampled every two years cost about $2.30 to $4.30. For roughly the same money, a grower can have a finer map that is on average two years old when the spreader uses it, or a coarser map that is never more than two years old. Twenty-five years ago, Iowa State researchers warned that expensive sampling "widely spaced over time" may not compare well with cheaper sampling every other year, because the spaced-out approach does not produce useful soil-test trends (Mallarino and Wittry, Iowa State ICM Conference, Dec 2001).
Ground Truth: At today's prices the cycle deserves as much thought as the density. A field on a drawdown, where P&K was skipped this fall to save money, needs a fresh reading more than a fine one. That favors cheaper zones every two years over a grid every four. A field that has never been gridded, with a long manure or build-up history, needs the fine map once. After that it can often be resampled by zone. A four-year grid bought as a habit and read as if it were current is the worst of both.
3. What a better map has to save
What's new: At DTN's September 14–18 averages, P2O5 in DAP costs $1.01 a pound, before any credit for its nitrogen, and K2O in potash costs $0.41 (Crop Root Zone calculation from DTN, Sep 23, 2026). Iowa State's removal coefficients are 0.32 lb P2O5 and 0.22 lb K2O per bushel of corn, and 0.72 lb P2O5 and 1.2 lb K2O per bushel of soybeans. At its default yields of 210 bushels of corn and 70 of soybeans, a corn-soybean rotation removes an average of 58.8 lb P2O5 and 65.1 lb K2O an acre a year (PM 1688, Feb 2023, Table 2). Replacing that costs about $86 an acre a year at September prices.
Evidence: A better map earns money in two ways. It moves fertilizer off ground that does not need it, and it moves fertilizer onto ground that does. Only the first is a clean saving. Converting each method's annual cost into pounds of nutrient, or into a share of the maintenance bill, gives the break-even:
| Method and cycle | Cost, $/acre/yr (mid) | Break-even, lb P2O5/acre/yr | or lb K2O/acre/yr | Share of $86 maintenance bill | |
|---|---|---|---|---|---|
| Composite, every 4 yr | 0.66* | 0.7 | 1.6 | 0.8% | █░░░░░░░░░ |
| Zones, every 4 yr | 1.97* | 2.0 | 4.8 | 2.3% | ██░░░░░░░░ |
| Grid 2.5 ac, every 4 yr (survey) | 1.99 | 2.0 | 4.8 | 2.3% | ██░░░░░░░░ |
| Zones, every 2 yr | 3.28* | 3.3 | 8.0 | 3.8% | ██░░░░░░░░ |
| Grid 2.5 ac, every 2 yr (survey) | 3.98 | 4.0 | 9.6 | 4.6% | ███░░░░░░░ |
| Grid 1 ac, every 4 yr | 6.58* | 6.5 | 16.0 | 7.7% | █████░░░░░ |
| Grid 1 ac, every 2 yr | 13.16* | 13.1 | 31.9 | 15.3% | ██████████ |
Source: Crop Root Zone calculation; DTN retail averages, Sep 14–18, 2026 (DAP $925/st, potash $495/st, delivered retail); Iowa State University PM 1688, Feb 2023 (removal at 210 bu corn, 70 bu soybeans). *Midpoints of estimated ranges from Section 2. Bars scale to the 1-acre, two-year cost = 10 blocks.
2.3%
The share of a field that a 2.5-acre grid on a four-year cycle has to keep out of the maintenance program to pay for itself at $1.01/lb P2O5 and $0.41/lb K2O. On a 160-acre field, that is about 3.7 acres, or one and a half grid cells. (Crop Root Zone calculation from Iowa State University FM 1698 and PM 1688; DTN, Sep 23, 2026)
The best public test of whether a denser map finds those acres is Iowa State's on-farm research. Mallarino and Wittry ran replicated strip trials on 11 Iowa fields, six for P and seven for K, over one to three corn-soybean cycles. They compared uniform rates set from each strip's average soil test with variable rates set from grid-point samples on 0.5- to 1-acre cells. On average, the variable-rate method applied 9 lb P2O5 an acre less and 15 lb K2O less per two-year application. It applied less in about half the fields, about the same in a quarter, and more in the rest (Mallarino and Wittry, Iowa State ICM Conference, 2006). Yield was a wash. In roughly 50 site-years there were significant yield differences between methods in four site-years for P and two for K, and they went each way about equally often.
Repriced at September 2026 retail, those pound savings are worth about $4.52 an acre a year for P and $3.09 for K, or $7.62 on a field that needs both (Crop Root Zone calculation).
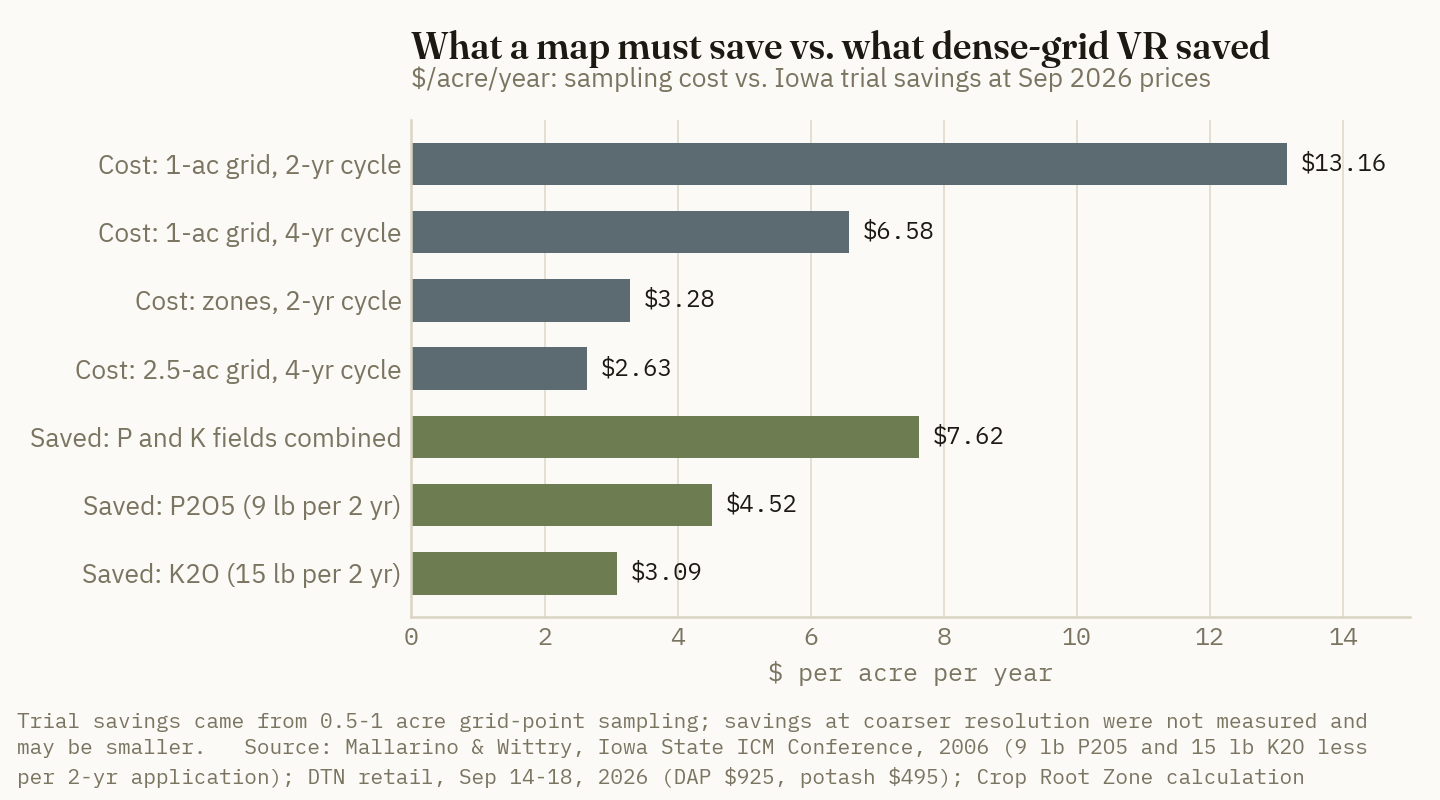
Two caveats keep that chart from being an endorsement. First, the Iowa savings came from 0.5- to 1-acre cells, which the authors said were "not recommended for crop production." Nobody has shown that a 2.5-acre grid captures the same savings. Second, a Cornell study of 20 New York corn fields, 1,149 acres sampled at 0.5-, 1- and 2.5-acre resolution, found that grid sampling raised lime or nutrient recommendations on 12 fields by finding deficiencies a whole-field average missed. It lowered input costs on only 7 (Marcaida, Workman and Ketterings, Cornell University, Jun 9, 2025; Agronomy Journal 117:e70074). A grid is a diagnostic. On a field that has been underfed in patches, it adds to the fertilizer bill before it saves anything.
Ground Truth: At $1-a-pound phosphate, a 2.5-acre grid does not need a large effect to pay. It needs to find about one acre in every 43 that tests High but that a composite would have treated as Optimum, and a variable-rate spreader to skip it. A 1-acre grid needs three times that. On the Iowa evidence, it roughly breaks even on a four-year cycle and loses money on a two-year cycle. Iowa State recommends no P or K for a single year on High ground and half of removal for a two-year application (PM 1688). So the saving per reclassified acre is the whole maintenance rate only if the grower actually skips it. A map that does not change the spreader's rate is a cost with no return.
4. Grid or zone: which fields get which
What's new: The most direct field comparison of the two methods comes from Iowa. Mallarino's 2019 review of the Iowa work concluded that 2.5-acre grids and multi-layer zones "almost always" describe soil-test variability and predict yield response better than traditional sampling by soil type. It also found that a 2.5-acre grid is often more effective for P and K than zones in fields with long histories of fertilization or manure, because current soil-test values seldom track stable soil properties or landscape. Zones did better on fields with strongly contrasting slopes, where K and yield follow the landscape, and for pH and lime where calcareous and acid soils are mixed. Zones built from several data layers are likely better than grids coarser than about 4 to 5 acres (Mallarino, North-Central Extension-Industry Soil Fertility Conference, Nov 2019).
Evidence: The Cornell group reached a compatible rule from the other direction. Grid sampling for P was most useful in fields testing 40 to 100 lb P an acre on the Northeast test. Fields that tested uniformly low or excessively high were described well enough by a field composite (Cornell CALS, Jan 2026). The group suggested one high-resolution 0.5-acre pass to define fertility zones, then 2.5-acre sampling within those zones in later years (Marcaida et al., Jun 9, 2025). Core count matters as much as the method. Mallarino put the minimum at 10 to 15 cores per composite if results are to land within about 20% of the true mean (Mallarino, Nov 2019). Illinois asks for 10 to 15 cores "whether grid or zone sampling" (University of Illinois Extension). Nebraska's grid guidance allows five cores in a tight radius around each point (UNL CropWatch).
| Field condition | Better first choice | Why |
|---|---|---|
| Long manure or build-up history, gentle landscape | Grid, 2.5 acres | Soil-test P and K no longer follow soil type (Mallarino, 2019) |
| Strongly rolling ground, eroded knolls, deposition areas | Zones | K and yield follow landscape (Mallarino, 2019) |
| Calcareous and acid soils mixed | Zones built from imagery or EC | pH patterns map well from canopy chlorosis (Mallarino, 2019) |
| Uniformly Very High or uniformly Low | Composite | Every cell gets the same rate anyway (Cornell, 2026) |
| Mid-range test levels, mixed history | Grid once, then zones | Finds the pattern, then tracks it cheaply (Cornell, 2025) |
Source: Mallarino, North-Central Extension-Industry Soil Fertility Conference Proceedings, Nov 2019; Marcaida, Workman and Ketterings, Cornell University, Jun 2025 and Jan 2026.
Retailers are selling less of both. The 2025 CropLife–Purdue dealership survey of 93 retailers found fewer dealers offering precision soil sampling, one of the long-standing staples of precision agriculture (CropLife–Purdue survey, via Global Ag Tech Initiative, 2025).
Ground Truth: A field's history is the cheapest data layer a grower has, and it should pick the method before any sampler is hired. A quarter-section with twenty years of hog manure on the near side and none on the far side needs a grid. The pattern is man-made and no soil map will find it. A rolling, uniformly managed field is better served by zones drawn from yield and elevation. On that field, a 2.5-acre grid pays mostly for precision in the wrong places.
5. Getting the fall pass right
Timing and consistency. Iowa State advises against sampling shortly after lime, fertilizer or manure, or when soil is excessively wet. Its P, K and pH calibrations rest on fall or spring samples (PM 287, Sep 2003). Illinois adds that samples should be taken at the same time of year each cycle (University of Illinois Extension). A 2026 fall sample compared with a 2022 spring sample mixes seasonal effects with real change. That matters most on fields being drawn down.
What the quote covers. Before comparing two per-acre prices, ask for four things: acres per sample, cores per sample, the lab package, and whether the map and prescription file are included. The difference between Ward's $17.35 basic package and $23.65 routine package is $2.52 an acre on a 2.5-acre grid. Whether a field needs sulfur and micronutrient readings every cycle is a separate decision from whether it needs a grid.
The spreader. A map pays only through a changed rate. Iowa's 2026 survey puts custom dry bulk spreading at $8.15 an acre from 59 responses. It lists a $3.90 surcharge for variable-rate seeding but no separate variable-rate fertilizer line (FM 1698, Mar 2026). A grower paying a VR surcharge to a retailer should add it to the cost column in Section 3 before assuming a grid pays.
Prices. Every break-even here moves with phosphate. If DAP falls back toward $700 a ton, the break-even pounds for each method rise by about a third. At that price the Iowa trial savings on a field needing both nutrients fall to about $6.50 an acre a year, just under the 1-acre grid's four-year midpoint cost.
References
- Iowa State University Extension and Outreach, FM 1698 / Ag Decision Maker A3-10, "2026 Iowa Farm Custom Rate Survey," revised Mar 2026 — https://www.extension.iastate.edu/agdm/crops/pdf/a3-10.pdf
- DTN/Progressive Farmer, "Fertilizer Prices Rise for Six of Eight Major Fertilizers" (survey week Sep 14–18, 2026), Sep 23, 2026 — https://www.dtnpf.com/agriculture/web/ag/crops/article/2026/09/23/fertilizer-prices-rise-six-eight
- UW Soil and Forage Analysis Laboratory, Fees/Brochure (2025 brochure dated Aug 1, 2025), accessed Sep 29, 2026 — https://uwlab.soils.wisc.edu/fees/
- University of Missouri Soil and Plant Testing Laboratory, "Tests and fees," accessed Sep 29, 2026 — https://extension.missouri.edu/programs/soil-and-plant-testing-laboratory/spl-submit-samples/spl-tests-fees
- Ward Laboratories, Inc., 2026 Fee Schedule, effective Jan 1, 2026 — https://www.wardlab.com/wp-content/uploads/2026/03/2026-Fee-Schedule-Web.pdf
- New Vision Co-op, Agronomy Services, page updated Jul 17, 2026 — https://newvision.coop/services/
- R. Austin, L. Gatiboni and J. Havlin, NC State Extension, AG-439-36, "Soil Sampling Strategies for Site-Specific Field Management," Aug 10, 2020, reviewed Jun 25, 2025 — https://content.ces.ncsu.edu/soil-sampling-strategies-for-site-specific-field-management
- Iowa State University Extension, PM 287, "Take a Good Soil Sample to Help Make Good Decisions," revised Sep 2003 — https://crops.extension.iastate.edu/files/inline-files/PM287.pdf
- Iowa State University Extension and Outreach, PM 1688, "A General Guide for Crop Nutrient and Limestone Recommendations in Iowa," revised Feb 2023 — https://store.extension.iastate.edu/product/A-General-Guide-for-Crop-Nutrient-and-Limestone-Recommendations-in-Iowa
- University of Illinois Extension, "Soil Sampling," accessed Sep 29, 2026 — https://extension.illinois.edu/crops/soil-sampling
- University of Nebraska–Lincoln CropWatch, "Soil Sampling for Precision Agriculture," undated, accessed Sep 29, 2026 — https://cropwatch.unl.edu/soil-sampling-precision-agriculture/
- Crop Quest, Inc., "Grid Sampling," accessed Sep 29, 2026 — https://www.cropquest.com/precision-ag-services/grid-sampling/
- American Plains Co-op, "Grid Sampling vs Zone Sampling," Mar 11, 2019 — https://www.apcoop.com/news/gb-agronomy-news/grid-sampling-vs-zone-sampling
- LSU AgCenter, "Mapping and Interpreting Electrical Conductivity in Production Fields," Louisiana Agriculture, Summer 2001 — https://www.lsuagcenter.com/portals/communications/publications/agmag/archive/2001/summer/mapping-and-interpreting-electrical-conductivity-in-production-fields
- A. P. Mallarino and D. Wittry, "Management Zones Soil Sampling: A Better Alternative to Grid and Soil Type Sampling?", 13th Integrated Crop Management Conference, Iowa State University, Dec 5–6, 2001 — https://www.agronext.iastate.edu/soilfertility/info/ICM_2001_ZoneSampling_Publ.pdf
- A. P. Mallarino and D. J. Wittry, "Variable-Rate Application for Phosphorus and Potassium: Impacts on Yield and Nutrient Management," Integrated Crop Management Conference, Iowa State University, 2006 — https://www.agronext.iastate.edu/soilfertility/info/mallarino_Variable-PK%202.pdf
- A. P. Mallarino, "Efficacy of Variable-Rate Application Technology for Phosphorus, Potassium, and Lime Management," 49th North-Central Extension-Industry Soil Fertility Conference Proceedings, Des Moines, IA, Nov 5–6, 2019 — https://www.agronext.iastate.edu/soilfertility/info/Mallarino%20Variable-Rate%20Proceed%20NC%20Soil%20Fert%20Conf%202019.pdf
- M. Marcaida III, K. Workman and Q. M. Ketterings, "To Grid or Not to Grid: Precision Soil Sampling for Lime, P, and K Management of Corn Fields," Cornell University, What's Cropping Up? blog, Jun 9, 2025 (summarizing Agronomy Journal 117:e70074, 2025) — https://blogs.cornell.edu/whatscroppingup/2025/06/09/to-grid-or-not-to-grid-precision-soil-sampling-for-lime-p-and-k-management-of-corn-fields/
- Cornell CALS, "Grid sampling streamlines phosphorus loss risk assessments," Jan 2026 (summarizing Marcaida et al., Soil Science Society of America Journal, 2025) — https://cals.cornell.edu/news/2026/01/grid-sampling-streamlines-phosphorus-loss-risk-assessments
- B. Erickson and J. Lowenberg-DeBoer, "The 2025 CropLife/Purdue Precision Adoption Survey: Making Way for New Ag Tech," via Global Ag Tech Initiative, 2025 — https://www.globalagtechinitiative.com/in-field-technologies/the-2025-croplife-purdue-precision-adoption-survey-making-way-for-new-ag-tech/
- Ohio State University Farm Office, "2026 Ohio Farm Custom Rates Released," Jun 26, 2026 — https://farmoffice.osu.edu/blog/fri-06262026-837am/2026-ohio-farm-custom-rates-released
- G. McClure, University of Nebraska–Lincoln, "Nebraska Agricultural Custom Rates 2026" — https://cap.unl.edu/sites/unl.edu.ianr.agecon.center-for-ag-profitability/files/media/file/2026-nebraska-custom-rates-report_ada.pdf
Disclosures
Crop Root Zone is an independent publication. Nothing here is investment advice. Market calls, where included, reflect the editors' own read and are not a recommendation to buy or sell any security.
In a Warm November, a Semi Load of Feedlot Manure Pays for More Than Twice the Road a Load of Hog Manure Does. Broiler Litter Pays for 260 Miles. Each Needs a Field Short of Phosphate.
At DTN's October 26–30 retail prices and Iowa State's availability factors, the nutrients a crop can still credit from November-applied manure cover a one-way semi haul of 258 to 387 miles for broiler litter, 66 to 99 for open-lot feedlot manure, 29 to 44 for deep-pit hog manure and 5 to 7 for dairy slurry, after application, when the receiving field needs phosphate and potash. Where the field needs only nitrogen and the fall takes the ammonium, only litter pays for any road. Hog manure falls furthest because 84% of its nitrogen is ammonium, the part a warm fall removes.
Retail fertilizer firmed again in the last week of October. Anhydrous averaged $1,007 a ton, DAP $941 and potash $510, up 19%, 2% and 5% on the year (DTN/Progressive Farmer, Nov 4, 2026) [1]. The same day, DTN reported that outside northern North Dakota and northern Minnesota almost no Corn Belt soil was near the 50°F mark that fall ammonia and manure applications wait for. Its meteorologist said the threshold might not arrive until well into December (DTN/Progressive Farmer, Nov 4, 2026) [2]. Storage does not wait for soil temperature, and many pits, lots and litter sheds will be emptied this month anyway. That leaves two questions for every load: how much of the nutrient value will the crop still be able to credit next season, and how far can the load travel before the haul costs more than that credit? We answered both for four common manures on one basis, the 25-ton semi load. The answer has less to do with the species than with the soil test of the field receiving the load.
1. What each manure carries at November prices
What's new: We used the method from our September swine and October dairy pieces (TRZ-0194, TRZ-0269) [15][16]. Nitrogen is valued at the anhydrous price. Phosphate is valued at DAP, after taking out DAP's nitrogen at the urea price, and potash at the 60% K2O price. The two USDA state reports for the same week run lower on nitrogen. Iowa's distributor ask for anhydrous averaged $902.33 a ton, FOB (USDA AMS, Oct 30, 2026) [3].
Evidence:
| Nutrient | Priced from | DTN retail, $/st | $/lb nutrient | USDA AMS Iowa, $/st | USDA AMS Illinois, $/st |
|---|---|---|---|---|---|
| N | Anhydrous, 82% N | 1,007 | 0.614* | 902.33 | 981.11 |
| P2O5 | DAP, less 360 lb N at urea | 941 | 0.738* | MAP 976.00 | 932.14 |
| K2O | Potash, 60% K2O | 510 | 0.425* | 499.80 | 517.73 |
| N (netting only) | Urea, 46% N | 669 | 0.727* | not reported | 770.00 |
Sources: DTN/Progressive Farmer, Nov 4, 2026, retail survey week of Oct 26–30 [1]; USDA AMS Iowa and Illinois Production Cost Reports, week ending Oct 30, 2026, distributor ask, FOB [3][4]. Basis: DTN figures are average retail prices; AMS figures are FOB distributor asks. *Crop Root Zone calculation.
For the manure, we used published book values rather than any one farm's test. Swine, dairy and broiler litter come from the MidWest Plan Service averages that Iowa State and Minnesota both reproduce (Sawyer, Iowa State University, Jan 24, 2009; Minnesota Department of Agriculture and University of Minnesota Extension, Nov 2012) [5][6]. Open-lot feedlot manure is Nebraska's as-is analysis of 18 pounds of nitrogen a ton, of which 2 pounds are ammonium, plus 18 of phosphate and 14 of potash (Wortmann, University of Nebraska–Lincoln, Jan 9, 2009) [7]. First-year nitrogen availability follows Iowa State's PMR 1003. It sets swine pit manure at 90–100%, poultry at 50–60%, and beef and dairy at 30–50%, and credits 90–100% of manure phosphate and potash. We used the midpoints. For the solids we applied Iowa State's volatilization factor of 0.75–0.90 for broadcast without incorporation, taking 0.825 (Mallarino and Sawyer, Iowa State University, PMR 1003, Apr 2023) [8]. The liquids are injected, with no correction.
| Manure, book analysis | Unit | N-P2O5-K2O, lb | Every nutrient, $ | First-year N credited, lb | First-year value, field needs P and K, $ | Of which N |
|---|---|---|---|---|---|---|
| Swine finishing, deep pit | 1,000 gal | 50-42-30 | 74.46* | 47.5* | 72.92* | 40%* |
| Dairy cow, liquid | 1,000 gal | 31-15-19 | 38.18* | 12.4* | 26.76* | 28%* |
| Beef feedlot, open lot | ton | 18-18-14 | 30.29* | 5.9* | 22.89* | 16%* |
| Broiler litter | ton | 46-53-36 | 82.67* | 20.9* | 67.25* | 19%* |
Sources: book values [5][6][7]; availability and volatilization factors [8]; prices [1]. *Crop Root Zone calculation. Phosphate and potash credited at 100%, Iowa State's value for maintaining a soil test in the Optimum category [8].
Two things in the table matter for the rest of this piece. Hog manure is the only one of the four where nitrogen is close to half the first-year value. The others are mostly phosphate and potash. And feedlot manure carries little nitrogen by the time it is spread. Minnesota's handling table, adapted from Purdue, puts storage losses at 50% of the nitrogen for open lots and 35% for litter, against 20% for a covered pit (Minnesota Department of Agriculture, Nov 2012, adapted from Purdue University ID-101, 2001) [6]. The book values already reflect that loss, so we do not deduct it a second time.
2. November takes the nitrogen and leaves the phosphate
What's new: Iowa State's rule is not to apply manure in the fall until the four-inch soil temperature is 50°F and cooling. Its guide says the rule matters most for manure with a large share of its nitrogen as ammonium. It also says Iowa research has found fall versus spring timing "usually is not an agronomic issue" for phosphorus and potassium [8]. This November, much of the Corn Belt will not reach 50°F before pits have to be pumped [2].
Evidence: No state guide publishes a factor for manure applied into warm November soil. We used Cornell's dairy nitrogen guide as the bounding case. For fall application it assumes 100% of the ammonium is lost to leaching or denitrification (Cornell University, accessed Nov 9, 2026) [9]. We credited the organic fraction at the 0.35 first-year factor Penn State uses, as applied in our dairy piece [16]. Iowa State measured the ammonium share at 65–100% of total nitrogen in pit swine manure, averaging 84%, and 10–40% in solid poultry manure, averaging 20% [8]. Dairy slurry is about half ammonium on Penn State's book values [16], and feedlot manure 2 pounds in 18 [7]. For litter we used a measured loss rather than the Cornell rule. A Mississippi review of three years of trials by Tewolde and colleagues reports that fall-applied litter lost up to 15% of its fertilizer potency (Heatherly, Mississippi Soybean Promotion Board, Jan 2025) [10]. We applied that 15% to litter's nitrogen only.
| Manure | Unit | First-year N, book, lb | First-year N, fall-loss case, lb | First-year value, book, $ | First-year value, fall-loss case, $ | Lost to the fall |
|---|---|---|---|---|---|---|
| Swine finishing, deep pit | 1,000 gal | 47.5 | 2.8* | 72.92 | 45.48* | 38%* |
| Dairy cow, liquid | 1,000 gal | 12.4 | 5.4* | 26.76 | 22.48* | 16%* |
| Beef feedlot, open lot | ton | 5.9 | 4.6* | 22.89 | 22.08* | 4%* |
| Broiler litter | ton | 20.9 | 17.7* | 67.25 | 65.32* | 3%* |
Sources: Crop Root Zone calculation from [1][7][8][9][10][16]. Field needs phosphate and potash. *Estimate. The fall-loss case is a bound, not a forecast: it credits no ammonium. Applying Cornell's rule to litter instead of the Mississippi figure would leave 10.6 lb of nitrogen, worth $6.52, and cut litter's value by a further $4.37 a ton.
The fall-loss case is harsh by design. Iowa does not write off fall ammonium, and a cold, dry spring can bring most of it through to the crop. But Iowa's own trials show what warm-soil application has cost. Corn yielded 19 bushels less where manure went on in early fall than in late fall, across 12 site-years (Iowa State University Integrated Crop Management, Oct 9, 2023) [12]. At 3,000 gallons an acre, an assumed rate, the gap between the book and fall-loss nitrogen credit for hog manure is $82 an acre. Nineteen bushels at the October 30 December corn futures close of $4.4775 is $85 (Brownfield Ag News, Oct 30, 2026) [17].
Ground Truth: A warm fall takes value from hog manure that it does not take from other manures. Feedlot manure and litter lose a few percent of their first-year value in our bounding case. Hog manure loses more than a third, all of it nitrogen. In a year when the pits must be pumped before soils cool, the hog manure that goes on early should be routed and priced as a phosphate and potash product, sent first to fields where the soil test calls for both. That holds even if the field goes to soybeans next year and the nitrogen is partly wasted. Iowa State's Dan Andersen told DTN that cover-cropped fields are the place for early manure, since the roots take up nitrate [2]. A field short of phosphate that also has a cover crop stand is the best destination for an early pit.
3. The truck charges by the mile, not by the nutrient
What's new: None of the 2026 surveys we found prices manure hauling by distance. Iowa's 2026 custom rate survey, fielded in February, does price three things that bracket it: loading and spreading solid manure at $7.20 a ton, injecting liquid manure at $18.15 per 1,000 gallons, and hauling livestock by semi at $4.70 per loaded mile (Iowa State University Extension, Mar 2026) [11]. A January 2025 Mississippi review prices litter hauling directly at $0.20 per ton-mile under 80 miles and $0.16 beyond, with $10 a ton each to load and spread [10].
Evidence:
| Rate | Source and year | Published figure | Per ton-mile, $ |
|---|---|---|---|
| Semi hauling, livestock | Iowa, 2026, 9 responses, range $3.50–5.75 | $4.70/loaded mile | 0.188* |
| Semi hauling, grain, 25 vs. 100 miles one-way | Iowa, 2026 | $0.200 vs. $0.405/bu | 0.098* |
| Litter hauling, under 80 miles | Mississippi, 2025 | $0.20/ton-mile | 0.20 |
| Litter hauling, 80 miles or more | Mississippi, 2025 | $0.16/ton-mile | 0.16 |
| Liquid tanker, each added mile | Iowa applicator survey, fall 2013 | $3.50/1,000 gal | 0.84* |
| Liquid tank spreaders, each added mile, modelled | Michigan, 2012 | $1.07/1,000 gal | 0.26* |
| Loading and spreading solid manure | Iowa, 2026, 7 responses, range $5.00–9.00 | $7.20/ton | |
| Injecting liquid manure | Iowa, 2026, 16 responses, range $11.00–29.00 | $18.15/1,000 gal |
Sources: Iowa State University Extension, A3-10, Mar 2026 [11]; Heatherly, Jan 2025 [10]; Andersen, Iowa State University, May 9, 2016 [13]; Harrigan, Michigan State University, Feb 24, 2012, as reported in TRZ-0269 [16]. *Crop Root Zone conversion: a 25-ton semi load, a 1,000-bushel grain load of 28 tons, and 4.17 tons per 1,000 gallons. The grain figure is the added cost from 25 to 100 miles, so it excludes loading time.
The Iowa survey assumed diesel at $2.89 a gallon [11]. Iowa's farm diesel ask averaged $5.65 on October 30 [3]. At an assumed 6 miles a gallon over a loaded-and-empty round trip, that adds about $0.92 per loaded mile, or 3.7 cents a ton-mile, by our estimate. That takes the Iowa semi figure to about $0.225, and we use that as the high rate. We use the Mississippi long-haul rate, $0.15 to $0.16, as the low rate. We also treat the $4.70 as covering the empty return, as a loaded-mile livestock rate normally does. If a hauler charges the return separately, every distance below halves.
The truck does not care what it carries. Twenty-five tons of litter and 6,000 gallons of hog manure cost about the same per mile. What differs is the value inside the load.
| Manure | First-year value of a 25-ton load, book, $ | Fall-loss case, $ | |
|---|---|---|---|
| Broiler litter | 1,681* | 1,633* | ██████████ |
| Beef feedlot, open lot | 572* | 552* | ███░░░░░░░ |
| Swine finishing, deep pit, 6,000 gal | 437* | 273* | ██░░░░░░░░ |
| Dairy cow, liquid, 6,000 gal | 160* | 135* | █░░░░░░░░░ |
Source: Crop Root Zone calculation from Sections 1 and 2. Field needs phosphate and potash. Bars scale the fall-loss case, $1,633 = ten blocks, rounded, with dairy rounded up to one block. *Estimate.
4. The break-even radius, and what sets it
What's new: This is our calculation, not a published figure. For each load we took the first-year credit, subtracted application ($180 for 25 tons of solids at Iowa's $7.20, $108.90 for 6,000 gallons at $18.15) and divided the remainder by the cost per loaded mile ($3.75 to $5.62). The liquids also need a transfer from semi to applicator at the field. We charged only the injection rate for that, so the liquid distances flatter the liquids.
Evidence:
| Receiving field, and nitrogen case | Broiler litter | Beef feedlot | Swine, deep pit | Dairy, liquid |
|---|---|---|---|---|
| Needs P and K; book nitrogen | 267–400* | 70–105* | 58–87* | 9–14* |
| Needs P and K; fall-loss case | 258–387* | 66–99* | 29–44* | 5–7* |
| Needs N only; book nitrogen | 25–37* | none | 12–18* | none |
| Needs N only; fall-loss case | 16–25* | none | none | none |
Source: Crop Root Zone calculation. One-way semi miles at $0.225 and $0.15 per ton-mile, after application [1][3][7][8][9][10][11]. "None" means the first-year credit does not cover application, before any haul. *Estimates, indicative only: book analyses, survey application rates and a fuel adjustment we made ourselves.
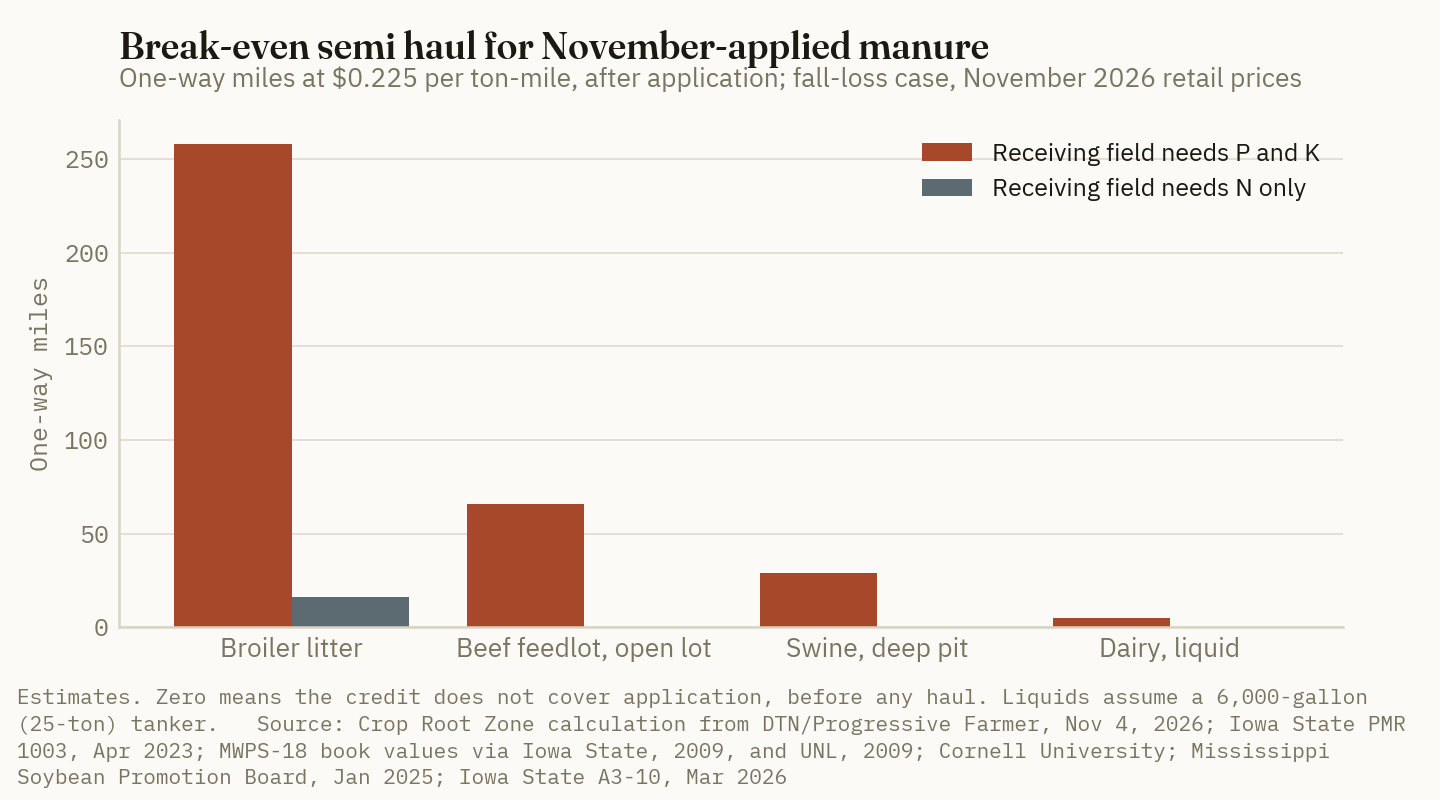
66 vs. 29 miles
How far a semi load of open-lot feedlot manure and of deep-pit hog manure can travel at $0.225 a ton-mile before the haul uses up a November application's first-year credit, on a field short of phosphate and potash. At book nitrogen the hog load goes 58. (Crop Root Zone calculation from DTN/Progressive Farmer, Nov 4, 2026; Iowa State University PMR 1003 and A3-10)
The litter result agrees with older work. Virginia and Oklahoma studies found break-even litter hauls of roughly 110 to 400 miles at $0.11 to $0.16 a ton-mile, depending on the litter's value [18][19]. We read those figures from a search summary and did not open the studies, so we cite them only as context. Most hog manure is not moved by semi. It goes by applicator tanker from the pit, and there the per-mile charge is much higher. At the 2013 Iowa survey's $3.50 per 1,000 gallons per added mile, the fall-loss credit on a field needing P and K covers 7.8 added miles. At Michigan's modelled $1.07, it covers 25.5 [13][16]. Both rates predate this year's diesel. Dairy slurry by tanker covers about 1 to 4 miles in the same case, which matches the conclusion of our October piece [16].
Ground Truth: In November the receiving field's soil test sets the hauling radius more than the manure species or the fertilizer price does. Move the same feedlot load from a field short of phosphate and potash to one that needs only nitrogen, and its radius falls from 66–99 miles to nothing. It no longer pays to be spread at the edge of the lot. The fertilizer market pays litter across state lines and feedlot manure across a county or two. It pays hog manure tens of miles only when P and K are short, and dairy slurry close to nothing beyond the farm. A feedlot or hog operation making manure agreements this fall should get its neighbors' soil-test maps before it signs. Each field that tests optimum or low is worth a semi load and some road. Each field that tests very high is worth only the nitrogen, and in a warm fall even that may be lost.
5. What changes the answer
What's new: A North American soil-test summary for 2020 put 46% of samples below the critical level for phosphorus and 44% for potassium (Soil Test Levels in North America, 2020 summary, as indexed by search) [14]. Those fields are where the radius exists. Our read is that fields with a long manure history are the likeliest to sit at the other end, which is why the nearest field is often the wrong one. Our calculation credits 100% of phosphate and potash on a field that needs them and nothing on one that does not. Iowa's half-rate rule for high-testing soils would sit between the two [8].
Evidence: Several inputs move the answer more than this fall's price changes do.
| Change | Effect, by our calculation |
|---|---|
| Iowa AMS anhydrous ($0.55/lb N, FOB) instead of DTN retail ($0.614) | Book hog manure −$3.03 per 1,000 gal; about 3 miles off the hog radius at $0.225 |
| Southern litter analysis, 62-69-60 (Arkansas, n=297), instead of 46-53-36 | Litter fall-loss value rises from $65 to $91 a ton; radius about 370 miles at $0.225 |
| Mississippi's $20 a ton to load and spread litter instead of Iowa's $7.20 | Litter radius falls by about 57 miles at $0.225 |
| Hauler bills the empty return as well | Every distance in Section 4 halves |
| A hog pit that tests 15% below book on total N and P | Removes about a fifth of the hog radius on a field that needs P and K |
Sources: Crop Root Zone calculation from [1][3][8][10][11]. The Arkansas analysis is one of nine listed in the Mississippi review [10]. The last row is an illustration, not a measured variance. *All effects are estimates.
Two limits on this analysis should be stated plainly. First, the book values are averages. Iowa State's guide recommends testing every manure source and keeping a history of results [8]. A farm's own analysis replaces every number in Sections 1 and 2. Second, we found no current per-mile rate for liquid manure in Nebraska, Minnesota, Purdue's Indiana work or Pennsylvania. The Nebraska livestock custom-rate PDF we tried returned a 404, and the per-mile rates for liquids above are 12 and 13 years old. A grower's own quote, with the mileage written on it, is the number to use.
Ground Truth: This week the decision is routing, not price. Our recommendation runs in four steps. Rank the receiving fields by soil-test phosphate and potash before the trucks are booked. Send hog manure that must come out before soils cool to the P-short and cover-cropped fields nearest the barn. Credit its nitrogen at no more than the organic fraction until a late-spring nitrate test says otherwise. Save the farther, nitrogen-only corn fields for manure applied once the four-inch soil temperature is under 50°F and falling, or for spring. Feedlot manure and litter can go to the far fields now, but only to far fields that need phosphate. At 66 miles for a feedlot load and 29 for a hog load, a 10-cent move in anhydrous changes less than one wrong field does.
References
- Neeley, T., "UAN28 Continues to Lead Fertilizer Prices Higher in October's Final Week," DTN Retail Fertilizer Trends, DTN/Progressive Farmer, Nov 4, 2026 (survey week of Oct 26–30, 2026: anhydrous $1,007/ton, urea $669, DAP $941, potash $510) — https://www.dtnpf.com/agriculture/web/ag/crops/article/2026/11/04/uan28-continues-lead-fertilizer-week
- Wilde, M., "Warm Soil Temperatures Delay Fall Nitrogen Applications Across Midwest," DTN/Progressive Farmer, Nov 4, 2026 — https://www.dtnpf.com/agriculture/web/ag/crops/article/2026/11/04/warm-soil-temperatures-delay-fall
- USDA AMS Livestock, Poultry and Grain Market News, Iowa Production Cost Report (Bi-Weekly), week ending Oct 30, 2026 (anhydrous ask average $902.33/ton, MAP $976.00, potash $499.80, FOB; No. 2 farm diesel $5.65/gal) — https://www.ams.usda.gov/mnreports/ams_2863.pdf
- USDA AMS Livestock, Poultry and Grain Market News, Illinois Production Cost Report (Bi-weekly), week ending Oct 30, 2026 (anhydrous $981.11/ton, DAP $932.14, urea $770.00, potash $517.73, FOB) — https://www.ams.usda.gov/mnreports/ams_3195.pdf
- Sawyer, J., "What Are Average Manure Nutrient Analysis Values?" Iowa State University Agronomy Extension, Jan 24, 2009 (adapted from MidWest Plan Service MWPS-18 Section 1) — https://www.agronext.iastate.edu/soilfertility/currenttopics/WhatAreAverageManureNutrientAnalysisValues_1-24-09.pdf
- Minnesota Department of Agriculture and University of Minnesota Extension, "Nutrient & Manure Management Tables," Nov 2012 (Table 2 adapted from Purdue University ID-101, 2001; Table 3 from MWPS-18, 2004) — https://www.mda.state.mn.us/sites/default/files/2018-05/nutmantables.pdf
- Wortmann, C., "Take Advantage of Manure Resources for Your Operation," CropWatch, University of Nebraska–Lincoln, Jan 9, 2009 — https://cropwatch.unl.edu/take-advantage-manure-resources-your-operation/
- Mallarino, A.P.; Sawyer, J.E., "Using Manure Nutrients for Crop Production," PMR 1003, Iowa State University Extension and Outreach, Apr 2023 (Tables 1 and 2; fall application guidance) — https://www.iowadnr.gov/media/6196/download?inline=
- Cornell University, Nitrogen Management on Dairy Farms, "Ammonium N" (undated web page), accessed Nov 9, 2026 — https://dairyn.cornell.edu/pages/20cropsoil/250credits/254ammonium.shtml
- Heatherly, L., "Poultry Litter as Fertilizer for Soybean," Mississippi Soybean Promotion Board, Jan 2025 (Table 1 handling costs; Table 2 litter analyses; summary of Tewolde et al.) — https://mssoy.org/sites/default/files/2025-01/POULTRY%20LITTER%20WHITE%20PAPER%20JAN%202025.pdf
- Johanns, A.; Hart, C., "2026 Iowa Farm Custom Rate Survey," Iowa State University Extension and Outreach, Ag Decision Maker A3-10 (FM 1698), revised Mar 2026 — https://www.extension.iastate.edu/agdm/crops/pdf/a3-10.pdf
- TeBockhorst, K.; Mensing, T., "Delay Manure Applications if You Want to Cut Your Nitrogen Bill," Iowa State University Integrated Crop Management, Oct 9, 2023 — https://crops.extension.iastate.edu/cropnews/2023/10/delay-manure-applications-if-you-want-cut-your-nitrogen-bill
- Andersen, D., Iowa State University, "What does manure application cost?" The Manure Scoop, May 9, 2016 (fall 2013 survey of 41 commercial applicators) — http://themanurescoop.blogspot.com/2016/05/what-does-manure-application-cost.html
- "Soil Test Levels in North America, 2020 Summary," key findings page hosted by The Fertilizer Institute (read from the search index on Nov 9, 2026; soiltest.tfi.org redirected to another site and we did not open the summary) — https://soiltest.tfi.org/about/Key_Findings_2020
- Crop Root Zone, TRZ-0194, "A Thousand Gallons of Deep-Pit Hog Manure Carries $28 of Nitrogen at September Prices. Iowa's Average Charge to Inject It Is $18.15," Sep 15, 2026.
- Crop Root Zone, TRZ-0269, "A Thousand Gallons of Dairy Slurry Carries $28.86 of Nutrients at October Prices. A Crop Can Use $18.79 of It the First Year. Wisconsin's Average Dragline Charge Is $17.50," Oct 9, 2026 (reporting Penn State Extension's 0.35 organic-N factor and book split, and Harrigan, Michigan State University, Feb 24, 2012).
- Brownfield Ag News, "Closing Grain and Livestock Futures: October 30, 2026," Oct 30, 2026 (December corn $4.4775, as reported in TRZ-0325) — https://brownfieldagnews.com/news/closing-grain-and-livestock-futures-october-30-2026/
- Virginia litter-transport analyses (break-even of 111 miles at $0.11 per ton-mile; 129 miles without backhaul), early 2000s, read from the search index on Nov 9, 2026; not opened — https://ageconsearch.umn.edu/record/19383/files/sp05ca03.pdf
- Oklahoma State University Extension, "An Alternative Poultry Litter Storage Technique for Improved Handling, Transport and Application: The Mass Reduction System" (398 miles for normal litter at $0.16 per ton-mile), undated, read from the search index on Nov 9, 2026; not opened — https://extension.okstate.edu/fact-sheets/an-alternative-poultry-litter-storage-technique-for-improved-handling-transport-and-application-the-mass-reduction-system.html
Disclosures
Crop Root Zone is an independent publication. Nothing here is investment advice. Market calls, where included, reflect the editors' own read and are not a recommendation to buy or sell any security.
A Ton of Yard-Waste Compost Carries $20 of Fertilizer at October Prices. A Crop Can Use About $10 of It the First Year, and Bulk Compost Sells for $20 to $40 a Ton.
Priced at DTN's Oct 5–9 retail averages, a Pennsylvania yard-waste compost holds $20.19 of N, P and K per delivered ton and Idaho's median dairy compost $27.18, but only 0–10% of compost nitrogen is plant-available in year one, which cuts the first-year credit to about $10 and $19. Liming value adds an estimated $2 to $7. Nitrogen in yard compost bought at a $28–$32 municipal price costs $31 to $36 a pound. In row crops compost is bought for organic matter, and the trials show organic matter moves slowly.
A ton of finished yard-waste compost posted by a Pennsylvania county solid waste authority held 17.8 pounds of nitrogen, 5.8 pounds of phosphate and 12.8 pounds of potash as delivered when Penn State's lab tested it in March 2025 (Chester County Solid Waste Authority, Mar 24, 2025) [4]. At the retail fertilizer prices DTN published on October 14 (DTN/Progressive Farmer, Oct 14, 2026) [1], those nutrients are worth $20.19. A crop will not see most of the nitrogen in the first year. Oregon State's extension guides put first-year plant-available nitrogen from finished compost at 0% to 10% of total N (Sullivan et al., Oregon State University, Oct 2018 and May 2019) [2][3]. On that basis the first-year credit is about $10.12 a ton, by our calculation. A New York county sells bulk screened compost for $14 to $16 a cubic yard (Onondaga County Resource Recovery Agency, Jul 1, 2026) [11], roughly $28 to $32 a ton at the standard conversion, before anyone spreads it. This piece works through what is in a ton, what a crop can use, what the lime is worth, what compost costs, and what the trials show it does for yield and soil organic matter.
1. What is in a ton
What's new: Little about compost chemistry has changed. What has changed is the price of what it might replace. Retail potash averaged $502 a ton in the week of October 5–9, and DAP $934 [1]. The question for a buyer is how many of those dollars a ton of compost actually displaces.
Evidence: Compost varies with its feedstock more than any fertilizer does, so we use three public lab reports and one published range. The Chester County report is a yard-waste compost made from grass clippings, leaves and woody material [4]. The Ulster County, New York, report is a municipal compost from a forced-aeration static pile whose feedstocks are not listed on the report (Ulster County Resource Recovery Agency, Sep 24, 2018) [5]. The dairy column is the median of 33 dairy-manure compost samples from 11 southern Idaho dairies (Chen and Schott, University of Idaho, Apr 29, 2021) [6]. Oregon State's standard ranges come from the U.S. Composting Council's proficiency-testing database [2].
| Per ton as delivered | Yard waste, Chester Co., PA | Municipal, Ulster Co., NY | Dairy manure, Idaho median (range) | Oregon State standard range, dry basis |
|---|---|---|---|---|
| Solids, % | 61.2 | 73.6 | 71.8 (31–86) | not given |
| Total N, lb | 17.8* | 24.0* | 13.6 (7.2–30.4) | 1–2% |
| P2O5, lb | 5.8* | 9.6* | 13.3 (6.9–29.9) | 0.7–2.1%* |
| K2O, lb | 12.8* | 10.4* | 22.4 (8.7–51.5) | 0.6–1.8%* |
| Calcium, lb | 23.4* | 112.6* | 34.1 (10.1–63.9) | 1.5–3.5% |
| Magnesium, lb | 6.8* | 6.4* | 12.1 (5.9–20.5) | 0.25–0.7% |
| Organic matter, lb | 786* | 566* | not reported | not given |
| C:N ratio | 22.2 | 13.1 | 10.3 (6.6–14.7) | 10–15, stable compost |
| pH | 7.7 | 7.7 | 9.3 (7.6–9.9) | 6–8 by feedstock |
Sources: Chester County Solid Waste Authority, Penn State Agricultural Analytical Services Laboratory report C18116, Mar 24, 2025 [4]; Ulster County Resource Recovery Agency, Penn State report C10888, Sep 24, 2018 [5]; Chen and Schott, University of Idaho BUL 997, Apr 29, 2021, lb per ton as received [6]; Sullivan, Bary, Miller and Brewer, Oregon State University EM 9217, Oct 2018 [2]. *Crop Root Zone conversion: percent as-is × 20 for pounds per ton; Idaho solids from dry matter of 1,436 lb per ton (range 628–1,716); Oregon State's P and K ranges converted from elemental P × 2.291 and K × 1.205.
Three things stand out. First, a ton of compost is roughly a 0.9-0.3-0.6 to 0.7-0.7-1.1 fertilizer by weight, as delivered. Second, the manure compost carries more than twice the phosphate and nearly twice the potash of the yard compost per ton. Oregon State's guide says a phosphorus reading above 0.7% of dry weight usually means manure was in the feedstock [2]. Third, the spread inside one product class is wide. Idaho's dairy composts ranged fourfold in nitrogen and sixfold in potash, and one dairy's compost held almost five times the potassium of another's [6].
The Ulster County calcium figure, 7.65% of dry weight, is above the 4% that Oregon State says points to soil, gypsum or lime in the feedstock [2]. We do not know which applies there. It is a reminder that a compost's liming value has to be measured, not inferred from its name.
2. Why the nitrogen barely counts
What's new: The nitrogen number on a compost analysis is mostly organic nitrogen that the composting process has already stabilized. More than 95% of total N in compost is typically organic, and inorganic N is usually under 5% [2]. Chester County's yard compost held 96.5 mg/kg of ammonium against 8,900 mg/kg of total N as delivered [4].
Evidence: Oregon State's field guide ties first-year availability to the compost's C:N ratio and total N. Above a C:N of 20 or below 1% N, it credits nothing and warns that nitrogen tie-up is possible. Between 10 and 20, or 1% to 2% N, it credits about 5% of total N. Below 10, or above 2% N, it credits 10% to 20% [2]. The companion calculator puts finished-compost release at 0% to 10% of total N ten weeks after application, and notes that research shows only a weak link between a compost's N concentration and the nitrogen it actually supplies [3].
Field work in the upper Midwest is in the same range. In Wisconsin corn trials in 1993 and 1994, 6% to 17% of the total N in a 270-day-old municipal solid waste compost became available in the first year (Wolkowski, Journal of Environmental Quality, 2003) [8]. In Minnesota, annual mineralization of two municipal composts applied every year was estimated at 0% to 12%, and 3% to 6% for a single large application (Mamo, Rosen and Halbach, Journal of Environmental Quality, 1999) [9]. Penn State's compost-report guidance puts organic-N release at roughly 10% to 20% a year, depending on C:N, moisture and temperature (Penn State AASL, accessed Oct 20, 2026) [7]. We read the two journal papers as abstracts only.
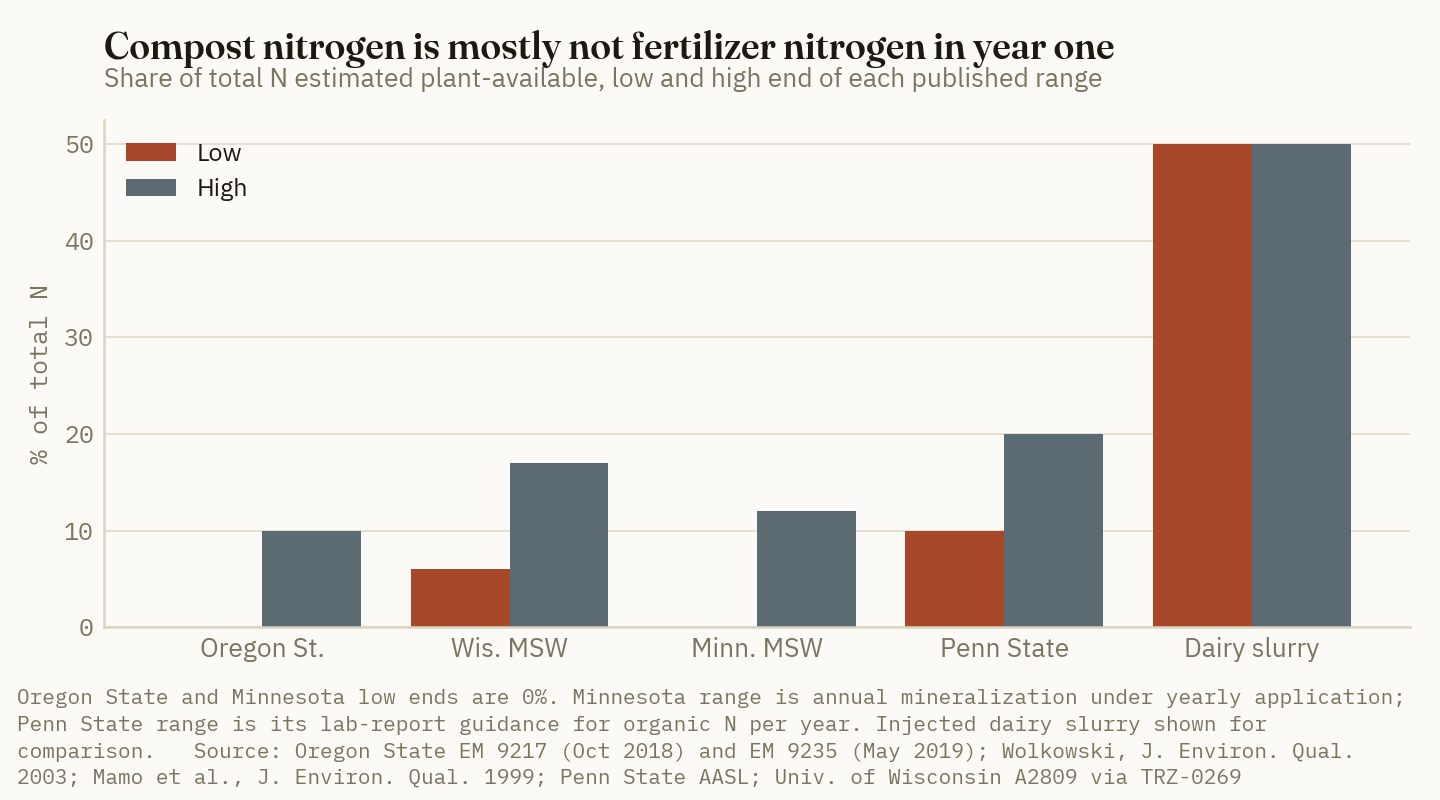
For comparison, Wisconsin credits injected dairy slurry with 50% of its total N in the first year, as worked through in our dairy manure piece (TRZ-0269, Oct 9, 2026) [25]. The gap is the ammonium. Oregon State's calculator notes that manures more fresh than composted usually smell of ammonia and finished compost does not, and it puts fresh manures and finished composts in separate release classes [3].
Applying the guide to the three analyses: Chester County's yard compost, at a C:N of 22.2 but 1.46% N dry, falls between the zero tier and the 5% tier. Ulster County's at 13.1 and Idaho's median at 10.3 fall in the 5% tier, though Idaho's median dry-basis N, 0.95% by our calculation, would put it in the zero tier on the N test [2][6]. We use 5% for all three. That is about 0.9 pound of available nitrogen per ton of yard compost and 0.7 pound per ton of dairy compost.
Oregon State does credit compost with slow release after year one: about 3% to 5% of the applied N per year in years 2 through 5 after a single high-rate application [2]. That nitrogen is real, but it arrives on the soil's schedule, not the corn crop's.
Ground Truth: Priced as nitrogen, compost is the most expensive source this publication has covered. Bulk yard compost at Onondaga County's $28 to $32 a ton, our conversion, buys about 0.9 pound of first-year nitrogen, or $31 to $36 a pound. Anhydrous was 60 cents [1], and feed-grade feather meal worked out to $2.54 a pound of available N in our organic nitrogen comparison (TRZ-0273, Oct 12, 2026) [26]. Even doubling the credit to 10% leaves compost nitrogen above $15 a pound. A grower buying compost should not cut a single pound of the planned N rate on account of it in the first season, and should add N if the C:N is above 20.
3. What a ton is worth at October prices, and the lime
What's new: At October 5–9 retail prices, the phosphate and potash in a ton of compost are worth more than its nitrogen once availability is counted, and the lime is worth less than either.
Evidence: We price nitrogen at anhydrous ammonia's $977 a ton, or 59.6 cents a pound of N, the cheapest retail form. Phosphate is valued from DAP at $934 less its 360 pounds of N at urea's 73 cents, over 920 pounds of P2O5: 72.9 cents a pound. Potash at $502 for 0-0-60 is 41.8 cents a pound of K2O [1]. This is the method of TRZ-0269 [25]. We count phosphate and potash at full value. Oregon State treats compost potassium as equivalent to fertilizer potassium [2]. Penn State's lab says the plant availability of total compost phosphorus "has not yet been established" [7], so the phosphate line is an upper bound.
| Component, per ton as delivered | Pounds | $/ton | |
|---|---|---|---|
| Yard compost, Chester Co., PA | |||
| N, total content | 17.8 | 10.60* | ██████████ |
| N, first-year credit at 5% | 0.9 | 0.53* | ░░░░░░░░░░ |
| P2O5 | 5.8 | 4.23* | ████░░░░░░ |
| K2O | 12.8 | 5.35* | █████░░░░░ |
| Lime, estimated, 5%–17.9% CCE dry basis | 61–219* | 1.66–5.96* | ██░░░░░░░░ |
| First-year credit, N-P-K, before lime | 10.12* | ||
| Dairy compost, Idaho median | |||
| N, total content | 13.6 | 8.13* | ████████░░ |
| N, first-year credit at 5% | 0.7 | 0.41* | ░░░░░░░░░░ |
| P2O5 | 13.3 | 9.66* | █████████░ |
| K2O | 22.4 | 9.39* | █████████░ |
| Lime, estimated, 5%–17.9% CCE dry basis | 72–257* | 1.95–6.99* | ██░░░░░░░░ |
| First-year credit, N-P-K, before lime | 19.46* |
Source: Crop Root Zone calculation. Analyses from [4] and [6]; prices from DTN/Progressive Farmer, Oct 14, 2026, retail averages for Oct 5–9, 2026 [1]; lime at 2.72 cents per pound of effective calcium carbonate, delivered and spread, from TRZ-0257 [23]. Basis: short ton as delivered, nutrients at retail before application. *Calculated. Lime pounds are estimates; neither lab report measured CCE. Bars scale dollars per ton, $10.60 = 10 blocks; lime bars show the low end.
Total N-P-K content is $20.19 a ton for the yard compost and $27.18 for the dairy compost. The first-year credit is $10.12 and $19.46. If the Chester County material is credited at Oregon State's zero tier for its C:N, the yard figure falls to $9.59. Valuing nitrogen at urea's 73 cents instead of anhydrous adds about $2.40 to the yard compost's content value and 12 cents to its first-year credit.
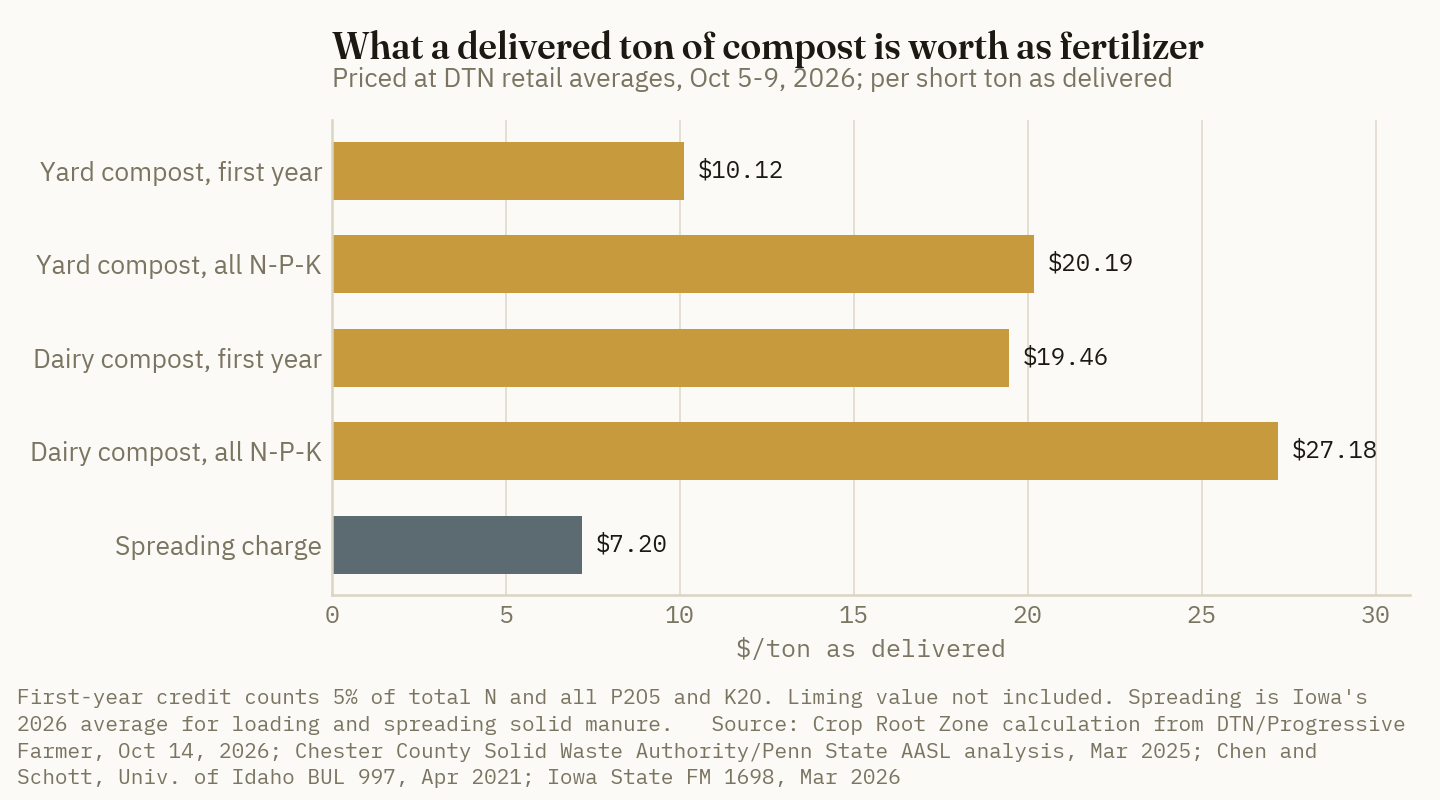
The lime. Compost is alkaline, and some labs report its calcium carbonate equivalent (CCE). Oregon State's guide says a compost at 5% CCE supplies the equivalent of 100 pounds of calcium carbonate per dry ton, and that composts above 5% are usually too alkaline for blueberries [2]. Neither lab report we used measured CCE, so we bracket it. At the low end we use that 5% reference point. At the high end we use the one direct measurement we found: an Australian retail compost tested at 178.7 grams of CaCO3 per kilogram, about 17.9%, in a 2024 University of Adelaide lab study built on titratable alkalinity (Iticha, Mosley and Marschner, SOIL, 2024) [20]. A 1999 greenhouse study on an acid Oxisol found 20 tonnes per hectare of compost equal to 0.6 to 1.7 tonnes of calcium carbonate, or 3% to 8.5% of the compost's weight, by our arithmetic (Van den Berghe and Hue, Compost Science & Utilization, 1999) [21]. On that bracket the lime in a ton of yard compost as delivered is worth an estimated $1.66 to $5.96, and in a ton of dairy compost $1.95 to $6.99. Ag lime delivers about 1,124 effective pounds a ton for $30.58 spread [23]. A grower would need roughly 5 to 18 tons of compost to match one ton of quarry lime, on these estimates. Average wood ash, by comparison, carries about 645 effective pounds a ton as received (TRZ-0265, Oct 8, 2026) [24].
$10.12 a ton
The first-year fertilizer credit in a delivered ton of Pennsylvania yard-waste compost at October 5–9 retail prices. Its total N-P-K content is worth $20.19; the difference is nitrogen a crop will not see that season. (Crop Root Zone calculation from Chester County Solid Waste Authority, Mar 24, 2025; DTN/Progressive Farmer, Oct 14, 2026; Oregon State EM 9217, Oct 2018)
4. What compost costs, and where the numbers cross
What's new: We found no national survey of bulk compost prices. The public price points are municipal fee schedules, one extension price collection and one university market study.
Evidence:
| Seller or source | Product | Published price | $/ton, as delivered | Basis |
|---|---|---|---|---|
| Onondaga Co., NY (OCRRA), 2026 | Bulk, ½-inch screened | $14–$16/cu yd | 28–32* | At the site; delivery extra |
| Onondaga Co., NY (OCRRA), 2026 | Bulk "premium," ¼-inch screened | $16–$20/cu yd | 32–40* | At the site; delivery extra |
| Onondaga Co., NY (OCRRA), 2026 | Bagged, 40 lb | $3.50–$5.00/bag | 175–250* | At the site |
| Iowa City, IA, 2026 | Finished compost | $20/ton† | 20† | At the facility |
| Ulster Co., NY (UCRRA), 2026 | Compost | $40/ton† | 40† | At the facility; 5 tons per sale maximum since May 28, 2026† |
| Texas A&M AgriLife, Jan 14, 2026 | Chicken manure compost | $43/ton | 43 | Basis not stated |
| Michigan on-farm trial, 2014–15 | Yard compost | $7 + $4 freight + $4 spreading | 15 | Delivered and spread, 50-yd loads |
| Michigan State market study, 2021 | Farmer willingness to pay | up to $25/cu yd | up to ~50* | Bulk |
Sources: OCRRA 2026 Compost Master Fee Schedule, Jul 1, 2026 [11]; Iowa City and UCRRA pages as indexed by search on Oct 20, 2026 [12][13]; Whitney, Texas A&M AgriLife Extension, Jan 14, 2026 [14]; Schweihofer, SARE FNC14-976 final report, Jan 2016 [16]; Gould and Ghimire, Michigan State University Extension, as reported by BioCycle, Jun 8, 2021 [15]. *Crop Root Zone conversion at 1,000 lb per cubic yard, Oregon State's rule of thumb for screened compost at 50% moisture [2]; wetter compost weighs more and costs less per ton. †Figure as indexed by search; the source page blocked automated access on Oct 20, 2026, and we could not read it directly.
Spreading adds cost. Iowa's 2026 custom-rate survey puts loading and spreading solid manure at $7.20 a ton on seven responses, and spreading lime at $8.30 on 31 (Iowa State University Extension, Mar 2026) [10]. On the yard compost, the first-year credit plus low-end lime is $11.78 a ton. Take out $7.20 to spread it and $4.58 is left to pay for the compost and the haul. On the dairy compost, the same arithmetic leaves $14.21. Counting all of the nitrogen eventually, the yard compost leaves $14.65 and the dairy compost $21.93, before haul.
Only one price in the table clears those numbers. The Michigan trial's 2014–15 yard compost cost $15 a ton delivered and spread [16]. That is below the yard compost's full eventual N-P-K value plus low-end lime, $21.85, and above its first-year value of $11.78. Every municipal price we found is above the yard compost's first-year credit before spreading.
The Michigan State study is the market's own answer. Farmers and nursery operators said they would pay up to $25 a cubic yard for compost with proven soil-health benefits, while production costs at four farm composting operations ran $19.39 to $34.46 a yard, and many farmers were reluctant to use compost because they did not see its value (Gould and Ghimire, 2021, via BioCycle, Jun 8, 2021) [15]. A $25-a-yard willingness to pay is roughly $50 a ton at 1,000 pounds a yard. That is not a fertilizer price. It is a price for something else.
Ground Truth: The dairy column is the only one where compost behaves like a fertilizer purchase. At $19.46 of first-year P and K and N per ton, Idaho's median dairy compost can pay for spreading and a short haul on ground that tests low in both phosphate and potash, as manure does. The yard compost cannot. Its first-year credit covers the spreader and about $4.58 more, so at any municipal price we found the grower is paying $15 to $35 a ton for something other than nutrients. That is a legitimate purchase if the target is organic matter on eroded or degraded ground. It should be budgeted as a soil-building cost per acre, with its own expected payback, and not netted against the fertilizer bill.
5. What the trials say about yield and organic matter
What's new: The best North American row-crop evidence comes in two forms: modest rates on working farms, which show little, and very large one-time rates on research plots, which show durable gains.
Evidence:
| Study | Design | Result |
|---|---|---|
| Michigan, three farms, 2014–15 | Yard compost at 5 tons/acre vs. control, corn-soybean, strip trials | No difference in soil tests after two years; no difference in corn value per acre net of compost cost at two sites ($445.81 vs. $434.83; $760.90 vs. $779.75); a 6.3% soybean yield trend at a third |
| Ontario, Brookston clay loam, single application fall 1998 | Yard-waste, pig-manure and food-waste composts at 75 Mg/ha (33.5 dry tons/acre*) | Soil organic carbon in the top 30 cm 12.3%, 16.6% and 0% above control after about ten years |
| Ontario, same site, 11 years | Food-waste compost at 75, 150 and 300 dry Mg/ha, once | Organic carbon 65% above control at the 300 rate after 11 years; cumulative corn yield 2,200–6,500 kg/ha above control (35–104 bu/acre*) |
| Wisconsin, 1993–94 | Municipal solid waste compost aged 7, 36 and 270 days at 22.5–90 Mg/ha | The 270-day compost raised corn grain yield over the younger composts; rate affected yield only at the loamy sand site in 1994 |
| Global meta-analysis, 2022 | More than 2,000 observations | Benefits largest in drier, warmer climates and on acidic, sandy or clay soils, with up to 40% higher yield than conventional practice |
Sources: Schweihofer, SARE FNC14-976 final report, Jan 2016 [16]; Yang, Reynolds, Drury and others, Canadian Journal of Soil Science 94(3), 2014, abstract as indexed [17]; Reynolds, Drury, Tan and Yang, Canadian Journal of Soil Science 95(3), 2015, abstract [18]; Wolkowski, 2003, abstract [8]; Zhao and others, Nature Food 3, 2022, abstract [19]. *Crop Root Zone conversion: 1 Mg/ha = 0.446 short tons/acre; 62.77 kg/ha = 1 bu/acre of corn. The Michigan per-acre values are gross corn value at $3.30/bu less compost at $7/ton, as reported.
The Michigan result is what the arithmetic predicts. Five tons of Chester County-type yard compost adds about 3,930 pounds of organic matter an acre. Spread through the conventional 2 million pounds of soil in a six-inch acre-furrow slice, that is about 0.2 percentage point of organic matter before any of it decomposes, by our calculation. That is inside the noise of a routine soil test. The Michigan cooperators concluded that two years was too short to show value over the cost of the compost plus application [16].
The Ontario results show what large rates do. The site's baseline is important: before the compost went on, the soil had lost 60% of its organic carbon and 43% of its plant-available water capacity relative to virgin soil [18]. On that degraded clay, a single 300-tonne-per-hectare dose restored organic carbon and air capacity to their optimal ranges and kept them there for 11 years [18]. At USDA's October 9 season-average price of $4.70 a bushel (USDA WASDE-676, Oct 9, 2026) [22], the 35 to 104 bushels of cumulative extra corn is worth $165 to $487 an acre over 11 years. Spread over the 33.5 to 134 dry tons an acre applied, that is $1.23 to $14.55 a dry ton, by our calculation. The abstract does not tie each yield gain to a rate, so the range pairs the extremes.
Two practical limits apply to any purchase. Penn State's lab warns that compost applied at nitrogen-based rates nearly always oversupplies phosphorus and potassium, and that repeat applications should be watched on the soil test for P, K and salt buildup [7]. That is a manure-plan issue on any farm already near its phosphorus limit. And Oregon State recommends a pea bioassay for persistent broadleaf herbicides such as clopyralid and aminopyralid, which survive composting and can injure sensitive crops at parts-per-billion levels [2].
Ground Truth: The trials point to where compost pays in row crops, and it is narrow. It is the eroded knob, the cut-and-fill area, the low-organic-matter sand or the degraded clay, where the soil is far enough below its potential that a large dose moves yield for a decade. Those acres justify a one-time rate measured in tens of tons, priced per acre as land improvement, the way the Ontario plot was. On a productive silt loam already near its organic-matter equilibrium, five tons every year or two buys about a fifth of a point of organic matter that the soil will partly burn off, at $75 to $196 an acre at the prices in Section 4. That is a cost a grain balance sheet will rarely recover.
References
- DTN/Progressive Farmer, Russ Quinn, "UAN32 Leads Fertilizer Prices Higher Again in First Week of October," Oct 14, 2026 (retail averages, week of Oct 5–9, 2026: anhydrous $977/ton, urea $672, DAP $934, potash $502; anhydrous $0.60/lb N, urea $0.73/lb N) — https://www.dtnpf.com/agriculture/web/ag/crops/article/2026/10/14/uan32-leads-fertilizer-prices-higher
- Sullivan, D.M.; Bary, A.I.; Miller, R.O.; Brewer, L.J., "Interpreting Compost Analyses," Oregon State University Extension Service EM 9217, Oct 2018 (standard nutrient ranges, Table 3; first-year PAN by C:N, Table 2; 3–5% annual release years 2–5; 5% CCE = 100 lb CaCO3 per dry ton; 1,000 lb/cu yd rule of thumb; pea bioassay) — https://s3.wp.wsu.edu/uploads/sites/2056/2023/05/Interpreting-Compost-Analysis.pdf
- Sullivan, D.M.; Andrews, N.; Sullivan, C.; Brewer, L.J., "OSU Organic Fertilizer and Cover Crop Calculator: Predicting Plant-available Nitrogen," Oregon State University Extension Service EM 9235, May 2019 (finished compost PAN 0–10% of total N at 10 weeks) — https://extension.oregonstate.edu/catalog/pub/em-9235-osu-organic-fertilizer-cover-crop-calculator-predicting-plant-available
- Chester County Solid Waste Authority (Pennsylvania), Compost Analysis Report, Penn State Agricultural Analytical Services Laboratory lab ID C18116, sampled Mar 13, 2025, reported Mar 24, 2025 (feedstocks grass clippings, leaves, woody material) — https://www.chestercountyswa.org/DocumentCenter/View/1878
- Ulster County Resource Recovery Agency (Kingston, NY), Compost Analysis Report, Penn State Agricultural Analytical Services Laboratory lab ID C10888, Sep 24, 2018 (static pile, forced aeration; feedstocks not listed) — https://ucrra.org/wp-content/uploads/2020/02/Sept.-2018-Penn-State.pdf
- Chen, L.; Schott, L., "Should Producers Test Solid Dairy Manure and Dairy Manure Compost Before Land Application?," University of Idaho Extension BUL 997, Apr 29, 2021 (Table 1, 33 compost samples from 11 dairies, lb/ton as received) — https://www.uidaho.edu/extension/publications/bul-0997
- Penn State Agricultural Analytical Services Laboratory, "Compost Analysis Report" sample report and interpretation, accessed Oct 20, 2026 (organic N release approximately 10–20% per year; P and K availability not established; N-based rates oversupply P and K) — https://agsci.psu.edu/aasl/compost-testing/compost-sample-report
- Wolkowski, R.P., "Nitrogen Management Considerations for Landspreading Municipal Solid Waste Compost," Journal of Environmental Quality 32(5):1844–1850, 2003 (abstract) — https://doi.org/10.2134/jeq2003.1844
- Mamo, M.; Rosen, C.J.; Halbach, T.R., "Nitrogen Availability and Leaching from Soil Amended with Municipal Solid Waste Compost," Journal of Environmental Quality 28(4):1074–1082, 1999 (abstract) — https://doi.org/10.2134/jeq1999.00472425002800040003x
- Johanns, A.; Hart, C., "2026 Iowa Farm Custom Rate Survey," Iowa State University Extension and Outreach, FM 1698, revised Mar 2026 (loading and spreading solid manure $7.20/ton, 7 responses; spreading lime $8.30/ton, 31 responses) — https://www.extension.iastate.edu/agdm/crops/pdf/a3-10.pdf
- Onondaga County Resource Recovery Agency, "2026 Compost Master Fee Schedule," Master Fee Update effective Jul 1, 2026 — https://ocrra.org/wp-content/uploads/2026/06/2026_Master_Fees-Jul1.pdf
- City of Iowa City, "Composting: Food and Yard Waste," Public Works Resource Management page, 2026 (finished compost $20/ton; figure as indexed by search, page returned HTTP 403 on Oct 20, 2026) — https://www.icgov.org/government/departments-and-divisions/public-works/resource-management/composting-food-and-yard-waste
- Ulster County Resource Recovery Agency, "Compost For Sale," 2026 (compost $40/ton; five-ton per-sale maximum since May 28, 2026; figures as indexed by search, page behind a browser check on Oct 20, 2026) — https://ucrra.org/compost-for-sale/
- Whitney, B., "What is the True Cost of Compost (or manure) in 2026?," Texas A&M AgriLife Extension Organic Program, Jan 14, 2026 — https://agrilifeorganic.org/2026/01/14/what-is-the-true-cost-of-compost-or-manure/
- BioCycle, "Manure-Based Compost Market Assessment," Jun 8, 2021, reporting Gould, M.C. and Ghimire, R., "An Assessment of Manure-based Compost Markets in Michigan," Michigan State University Extension, 2021 — https://www.biocycle.net/manure-based-compost-market-assessment
- Schweihofer, R., "Developing a Strategy for Utilizing Yard Waste Compost in a Corn and Soybean Rotation to Increase Soil Quality," SARE Farmer Rancher Grant FNC14-976, final report, Jan 2016 — https://projects.sare.org/media/pdf/F/R/G/FRG_Final_Report_FNC14-976.pdf
- Yang, X.M.; Reynolds, W.D.; Drury, C.F.; and others, "Organic carbon and nitrogen stocks in a clay loam soil 10 years after a single compost application," Canadian Journal of Soil Science 94(3):357–363, 2014 (abstract as indexed; publisher pages returned HTTP 403 on Oct 20, 2026) — https://doi.org/10.1139/CJSS2013-076
- Reynolds, W.D.; Drury, C.F.; Tan, C.S.; Yang, X.M., "Temporal effects of food waste compost on soil physical quality and productivity," Canadian Journal of Soil Science 95(3):251–268, 2015 (abstract) — https://doi.org/10.4141/cjss-2014-114
- Zhao, S.; Schmidt, S.; Gao, H.; and others, "A precision compost strategy aligning composts and application methods with target crops and growth environments can increase global food production," Nature Food 3:741–752, Sep 5, 2022 (abstract) — https://doi.org/10.1038/s43016-022-00584-x
- Iticha, B.; Mosley, L.M.; Marschner, P., "Combining lime and organic amendments based on titratable alkalinity for efficient amelioration of acidic soils," SOIL 10:33–47, 2024 (compost lime-equivalent value 178.7 g CaCO3/kg) — https://soil.copernicus.org/articles/10/33/2024/
- Van den Berghe, C.; Hue, N., "Liming potential of composts applied to an acid Oxisol in Burundi," Compost Science & Utilization 7(2):40–46, 1999 (abstract) — https://vtechworks.lib.vt.edu/handle/10919/65496
- USDA World Agricultural Outlook Board, World Agricultural Supply and Demand Estimates, WASDE-676, Oct 9, 2026 (2026/27 corn season-average farm price $4.70/bu) — https://www.usda.gov/oce/commodity/wasde/wasde1026.pdf
- Crop Root Zone, TRZ-0257, "Ag Lime Costs 2.7 Cents a Pound of Effective Neutralizing Material, Delivered and Spread. Pelletized Lime Costs 11 to 21. In Six Iowa Trials, 200 Pounds an Acre Moved pH by a Tenth," Oct 5, 2026 (ag lime $30.58 a ton delivered and spread; 1,124 lb effective CaCO3 per ton).
- Crop Root Zone, TRZ-0265, "A Ton of Average Wood Ash Carries 645 Pounds of Lime Value and 47 Pounds of Potash. It Is Worth $37 Delivered and Spread Where the Soil Needs Both, and $18 Where It Needs Only Lime," Oct 8, 2026.
- Crop Root Zone, TRZ-0269, "A Thousand Gallons of Dairy Slurry Carries $28.86 of Nutrients at October Prices. A Crop Can Use $18.79 of It the First Year. Wisconsin's Average Dragline Charge Is $17.50," Oct 9, 2026.
- Crop Root Zone, TRZ-0273, "A Pound of Nitrogen Costs $1.90 in Truckload Feather Meal, $5.88 in Bagged Feather Meal and 60 Cents in Anhydrous. Organic Corn at $11.23 Pays for the First and Not the Second," Oct 12, 2026.
Disclosures
Crop Root Zone is an independent publication. Nothing here is investment advice. Market calls, where included, reflect the editors' own read and are not a recommendation to buy or sell any security.
A Pound of Magnesium Costs Nothing in Dolomitic Lime That Was Going On Anyway, 12 to 71 Cents When the Lime Is Bought for It, and $5 to $8 in a Bag. Langbeinite's Magnesium Is Free Below $454 a Ton.
At North Carolina's October 2 prices, the potash and sulfur in a ton of 0-0-22-11Mg-22S are worth $454, against a producer netback of $389. State critical levels run from 15 ppm to 100 ppm, five land-grant sources reject calcium:magnesium ratios, and no replicated corn trial we could open shows a bushel response to price against.
Magnesium is the one secondary nutrient most row-crop acres get without a line on the invoice. It arrives in dolomitic limestone, which North Carolina's agronomic division says is "most lime sold" in that state and which state law there defines as carrying 6% magnesium or more (NCDA&CS, Feb 2013) [7]. A grower who needs magnesium and does not need lime has to buy it as a sulfate, and the bagged prices we found run 7 to 65 times higher per pound than lime bought for the purpose. This piece prices each source on a stated basis, nets langbeinite against October potash and sulfur values, and then sets the cost against what state soil-test guidance and replicated trials say about when an acre responds. It is the first magnesium piece this publication has run, and it fills a cell two earlier pieces left blank: both the langbeinite and polyhalite features declined to put a dollar value on magnesium (TRZ-0066, TRZ-0177) [24][25].
1. What a pound of magnesium costs by source
What's new: USDA's North Carolina Production Cost Report for the week ending October 2 quotes lime at $68 to $99 a ton delivered and applied, average $85.33, alongside ammonium sulfate at $624, red potash at $554.33 and urea at $767.50, all distributor asks, the fertilizers FOB (USDA AMS, Oct 2, 2026) [1]. That one report supplies a dated lime price in a dolomitic market and the potash and sulfur values needed to net out langbeinite. No public US series we found prices bulk langbeinite at retail, kieserite, magnesium oxide or polyhalite. Those gaps are stated in the table. They are not filled with estimates.
Evidence: Missouri's custom-rate survey put lime delivered and spread at $30.58 a ton in March; the survey does not say whether respondents' lime was calcitic or dolomitic (University of Missouri Extension, Mar 2026) [2]. Magnesium content sets the cost per pound. North Carolina's 6% legal floor is 120 pounds of magnesium in a ton [7]. Pure dolomite is 13.2% magnesium by formula weight, or 264 pounds a ton, which is our calculation and a ceiling. Wisconsin's source table lists dolomitic lime at 8% to 20%, a top end above what the mineral can hold, so the tag analysis governs (Schulte, University of Wisconsin, 2004) [10].
Bagged prices come from two organic-supply retailers. One lists granular langbeinite (0-0-22, 11% Mg, 22% S) at $43.00 per 50 pounds and technical-grade Epsom salt (9.8% Mg, 12.9% S) at $29.60 per 50 pounds. It prices pelletized dolomitic lime and high-calcium lime identically, at $11.75 a bag (Seven Springs Farm Supply, accessed Oct 13, 2026) [3]. A second retailer also lists pelletized dolomite and high-calcium lime at the same $10.75, the latter marked as a sale price (Ohio Earth Food, accessed Oct 13, 2026) [4].
| Source | Mg analysis | Price | Basis | Date |
|---|---|---|---|---|
| Dolomitic ag lime, North Carolina | 6% floor; 13.2% ceiling* | $85.33/ton | Delivered and applied, distributor ask; range $68–$99 | Oct 2, 2026 |
| Ag lime, Missouri (type not stated) | 6%–13.2%* | $30.58/ton | Delivered and spread, lime included; survey average | Mar 2026 |
| Pelletized dolomitic lime, bagged | not listed | $11.75/50 lb ($470/ton) | Retail list, before freight | Oct 13, 2026 |
| High-calcium lime, bagged, same store | very low | $11.75/50 lb ($470/ton) | Retail list, before freight | Oct 13, 2026 |
| Langbeinite, producer netback | 11% | $389/ton | Average net realized price, Q2 2026; Q3 guidance $400–$410 | Aug 4, 2026 |
| Langbeinite, bagged | 11% | $43.00/50 lb ($1,720/ton) | Retail list, before freight | Oct 13, 2026 |
| Epsom salt, technical grade, bagged | 9.8% | $29.60/50 lb ($1,184/ton) | Retail list, before freight | Oct 13, 2026 |
| Langbeinite, bulk at farm retail | 11% | no public quote | — | — |
| Kieserite | 18% (Wisconsin table) | no dated US price | — | — |
| Magnesium oxide | varies by grade | no dated US price | — | — |
| Polyhalite | 3.6% (6% MgO) | no public US price | — | — |
Sources: USDA AMS, North Carolina Production Cost Report, Oct 2, 2026 [1]; University of Missouri Extension, G302, Mar 2026, as carried in TRZ-0257 [2][23]; Seven Springs Farm Supply and Ohio Earth Food listings, accessed Oct 13, 2026 [3][4]; Intrepid Potash second-quarter results, Aug 4, 2026 [5]; Schulte, 2004 [10]; TRZ-0177 for the polyhalite analysis [25]. Per-ton figures for bagged goods are Crop Root Zone conversions. *The 6% figure is North Carolina's legal definition of dolomitic lime [7]; 13.2% is our formula-weight calculation for pure dolomite.
Dividing price by pounds of magnesium gives the comparison.
| Source and basis | $ per lb Mg | |
|---|---|---|
| Dolomitic in place of calcitic, on a field already due for lime | 0.00† | ░░░░░░░░░░ |
| Ag lime at Missouri's $30.58, whole ton charged to Mg | 0.12–0.25 | ░░░░░░░░░░ |
| Dolomitic lime at North Carolina's $85.33, whole ton charged to Mg | 0.32–0.71 | █░░░░░░░░░ |
| Langbeinite at $650 a ton bulk, net of potash and sulfur | 0.89* | █░░░░░░░░░ |
| Epsom salt, bagged, net of sulfur | 5.29 | ███████░░░ |
| Langbeinite, bagged, net of potash and sulfur | 5.75 | ███████░░░ |
| Epsom salt, bagged, gross | 6.04 | ████████░░ |
| Langbeinite, bagged, gross | 7.82 | ██████████ |
Source: Crop Root Zone calculation from the prices above [1][2][3]. Lime ranges run from 13.2% Mg (low cost) to 6% Mg (high cost). Sulfur and potash credits are derived in Section 2. †Assumes dolomitic and calcitic lime cost the same; the only public evidence is two retailers' bag prices [3][4], and no state survey separates the two. *Scenario price, not a quote; no public bulk retail price for langbeinite was found. Bars scale to $7.82 = 10 blocks, ranges drawn at the midpoint.
One veterinary extension source says dolomitic lime "is more expensive" than ordinary lime without giving a figure (Van Saun, Penn State Extension, Apr 23, 2024) [20]. Where a quarry charges a premium, the incremental cost is that premium divided by the magnesium in the ton. A $5 premium on 8% dolomitic lime is 3 cents a pound.
2. Langbeinite net of its potash and sulfur
What's new: At the North Carolina report's prices, the potassium and sulfur in a ton of langbeinite are worth $454. The producer's second-quarter netback was $389 [5]. At the mine, the magnesium is not being charged for. What a grower pays for it is set by the distribution margin between netback and the farm.
Evidence: The credits use one report so the basis is consistent. Urea at $767.50 is 83.4 cents per pound of nitrogen. Ammonium sulfate at $624 carries 420 pounds of nitrogen worth $350 at that value, which leaves $274 for its 480 pounds of sulfur: 57 cents a pound. Red potash at $554.33 is 46.2 cents per pound of K₂O [1]. These are FOB distributor asks in one state. DTN's national retail potash average for the same week was $499 a ton, or 41.6 cents per pound of K₂O, so the North Carolina potash credit runs about 11% above the national figure (DTN/Progressive Farmer, Oct 7, 2026) [6].
| Component of one ton, 0-0-22-11Mg-22S | lb per ton | $ per lb | Credit |
|---|---|---|---|
| K₂O | 440 | 0.462 | $203.25 |
| Sulfur, as sulfate | 440 | 0.570* | $250.80 |
| Potash and sulfur credit | $454.05 | ||
| Magnesium | 220 | (price − $454) ÷ 220 | residual |
Source: Crop Root Zone calculation from USDA AMS, North Carolina Production Cost Report, Oct 2, 2026 [1], at the label analysis [3]. *Derived value, not a quote: ammonium sulfate price less its nitrogen valued at urea, divided by sulfur content.
$454 a ton
The langbeinite price at which its magnesium costs nothing after potash and sulfur credits. Each $100 above it adds 45 cents per pound of magnesium. (Crop Root Zone calculation from USDA AMS, Oct 2, 2026)
At $389 the residual is negative: minus 30 cents a pound. At the producer's third-quarter guidance of $400 to $410 it is still minus 20 to 25 cents [5]. At a bulk farm price of $550 it would be 44 cents, at $650 it would be 89 cents and at $750 it would be $1.35. Those three are scenarios. The bagged price of $1,720 a ton leaves $5.75.
Polyhalite does the same arithmetic badly as a magnesium source. Its 14% K₂O and 19% sulfur are worth $346 a ton at these values, and the ton holds only 72 pounds of magnesium [25]. Every $72 paid above $346 adds a dollar per pound of magnesium, and the 200-pound rate that its published guidance recommends delivers 7 pounds.
Two prior figures need squaring with this one. TRZ-0177 valued sulfate sulfur at 81 cents a pound and put polyhalite's break-even at $423 a ton [25]. The dated North Carolina ask implies 57 cents and $346. The earlier number was an estimate built from feedstock costs; this one is derived from a public distributor price in one state. We treat the 57 cents as the better-sourced figure and the earlier break-even as high by about $77 on that basis.
Ground Truth: TRZ-0066 left the magnesium in a ton of langbeinite unvalued for want of a public reference [24]. There is one, and it has two answers. On an acid soil the replacement is dolomitic lime at 12 to 71 cents a pound, which makes the 220 pounds in a ton at the label analysis worth $26 to $156. On a low-magnesium soil already at target pH, lime is off the table, the replacement is a bagged sulfate at $5 or more, and langbeinite has no real competitor. The value of the magnesium in the product is decided by the buyer's soil pH. A buyer should ask for a bulk delivered quote, subtract $454 at these prices, divide by 220, and compare the answer with 71 cents if the field needs lime and with nothing at all if the soil test does not call for magnesium.
3. When a row-crop acre needs magnesium
What's new: The states that publish a magnesium soil-test level set it low, and several publish none. Their thresholds run from 15 ppm on Georgia's Coastal Plain to 100 ppm on Wisconsin's medium and fine soils. Extractants differ by laboratory, so the numbers are not interchangeable.
Evidence:
| State | Soil test level that triggers Mg | Recommendation | Source date |
|---|---|---|---|
| Georgia, Coastal Plain | Low: 0–30 lb/acre (15 ppm). Piedmont low: 0–60 lb/acre | Dolomitic limestone if lime is recommended; otherwise 25 lb Mg/acre | 2018 |
| North Carolina | Flagged on the soil report; threshold not stated in the note | 20–30 lb water-soluble Mg/acre; dolomitic lime if lime is needed; else 175–250 lb/acre of 0-0-22 | Feb 2013 |
| Kentucky | 60 lb/acre or less (30 ppm), Mehlich III | 25–50 lb Mg/acre on a sliding scale; zero above 60. Dolomitic lime preferred when lime is needed | Jul 2025 |
| Michigan | Under 35 ppm, or under 3% of base saturation, or Mg saturation below K saturation | Dolomitic lime where lime is recommended | Nov 2016 |
| Wisconsin | Optimum 51–250 ppm on sands, 101–500 ppm on other soils | 50–100 lb Mg/acre broadcast or 10–20 banded, as sulfate, where lime does not fit | 2004 |
| Minnesota | Sandy soils only: 0–100 lb/acre low (50 ppm); 101–300 medium, "trial"; 300+ adequate | Low: 10–20 lb Mg/acre in the row or 50–100 broadcast | 1985 |
| Iowa | None published; Ca and Mg not routinely tested | None | Apr 2003 |
| Ohio, Indiana, Michigan (Tri-State, 2020) | A Mehlich-3 critical-level table exists; we could not read its value | "Liming supplies sufficient Ca & Mg" | 2020 |
Sources: University of Georgia, crop code C02 [8]; NCDA&CS Note 3 [7]; University of Kentucky, AGR-1, 2025–2026 [9]; Isleib, Michigan State University Extension [14]; Schulte, University of Wisconsin, A2524 [10]; Rehm and Rosen, University of Minnesota, AG-FO-0725 [12]; Sawyer, Iowa State University [13]; Tri-State Bulletin 974 summary table [15]. Pounds per acre are converted to ppm at 2 to 1, the factor the Minnesota folder gives [12]. The current University of Minnesota web page returned an access error on Oct 13, 2026; a search summary of it shows the same 50 ppm and 150 ppm class breaks. The Tri-State sample file we opened stops before the page that carries Table 28.
The geography is consistent across the sources. Wisconsin lists three deficient settings: soils limed with low-magnesium materials such as marl, paper-mill waste or calcitic limestone; acid sands in the central and north-central counties; and organic soils with free carbonate [10]. Minnesota has observed deficiency "only" on very acid sandy soils, unlikely above pH 5.5, with concern where corn follows potatoes [12]. North Carolina notes that magnesium "leaches from sandy coastal plain soils" [7]. Kentucky's range runs from very high on loess to low on some sandstone-derived soils [9]. Wisconsin's lab records show how rare the low end is: of the samples tested from 1977 through 1981, 0.2% held less than 25 pounds of exchangeable magnesium per acre (Schulte and Kelling, University of Wisconsin, 1993) [11].
Potash matters on the same soils. On sands, high rates of potassium or ammonium fertilizer heighten the deficiency, and Wisconsin's rule of thumb is that the antagonism usually does not occur while exchangeable magnesium exceeds exchangeable potassium [10].
The yield record is thin and mostly negative. Kentucky states that even on low-testing soils, crop yield responses to magnesium "have been very limited" [9]. A four-year Nebraska trial on an irrigated Valentine loamy fine sand that tested marginal in both potassium and magnesium found no grain-yield effect from either nutrient at magnesium rates up to 44.8 kg/ha; ear-leaf magnesium stayed well above critical levels throughout (Rehm and Sorensen, 1985, from the indexed abstract) [16]. In Iowa, eight years of annual langbeinite on a Webster soil supplied about 784 pounds of magnesium an acre in total. Corn averaged 132 bushels unfertilized, 145 with potash and 145 with langbeinite (Sawyer, Iowa State University, Apr 2003, citing Webb, 1978) [13]. An article on a fertilizer producer's agronomy site states that magnesium raised corn yield at three low-magnesium Coastal Plain locations, without naming them or giving yields [21]. We could not open a replicated corn or soybean trial that reports a bushel response on a deficient soil. The state rates above rest on calibration work we did not reach.
Forage is the other place magnesium is sold, against grass tetany. The land-grant position is that fertilizer is the wrong tool. Kentucky says applying magnesium fertilizer to offset tetany "is NOT effective," because uptake is not assured when soil magnesium is adequate, and recommends a 15% magnesium mineral starting 30 days before calving [9]. Minnesota reports that magnesium on high-potash grass pastures did not raise forage yield and that supplementing the animal costs less [12]. Wisconsin credits its long use of dolomitic lime for the rarity of tetany there [10]. Penn State's risk screen is a forage K ÷ (Ca + Mg) ratio above 2.2 on an equivalent basis [20].
4. The calcium:magnesium ratio evidence
What's new: The ratio idea usually reaches a grower as a recommendation to buy calcium to bring magnesium down. Five land-grant sources reject it in plain terms, and the newest replicated work, a six-year Ohio study published in 2021, found nothing.
Evidence:
| Study | Design | Ratio range | Result |
|---|---|---|---|
| Wisconsin, Simson, Corey and Sumner, 1979 | Gypsum and Epsom salt on a silt loam and a loamy sand, both pH 6.8; alfalfa and corn | 2.3 to 8.4 | No significant alfalfa yield difference (3.22–3.50 and 4.12–4.35 tons/acre); corn "essentially the same" |
| Ohio, McLean and others, 1983 | Calcitic lime, magnesium oxide and magnesium sulfate; corn, soybean, wheat, alfalfa, 1975–80 | Overlapping in best and worst plots | Ratio did not explain yield |
| Iowa, Webb, 1978 | Potash versus langbeinite, 8 years, Webster soil | — | Corn 145 bu/acre with either |
| Ohio, Chaganti and others, 2021 | Two organic sites, six years; gypsum or Epsom salt at 11.8–13.4 Mg/ha cumulative | Gypsum plots 1.6 and 2.5 times the Epsom plots | No effect on corn or soybean yield or on soil health measures |
| Ohio, Leiva Soto and others, reported 2023 | Six years, silt loam at pH 5.9; gypsum, high-calcium lime, dolomitic lime | Balanced to "highly out of balance" | Corn responded to pH only; the two limes yielded the same |
Sources: Schulte and Kelling, 1993 [11]; Sawyer, 2003 [13]; Chaganti et al., Agronomy Journal 113:4190–4200, 2021 [17]; Sever, Crops & Soils, Jul 3, 2023 [18]. The McLean and Webb rows are as summarized by Sawyer; the Leiva Soto row is from the magazine report, and the underlying paper was not opened.
The statements are direct. Iowa State calls the ratio concept "unproven" and says it "should not be used as a basis for fertilization or liming practices"; ratios in twelve Iowa soils ran from 2.9 to 7.3 [13]. Wisconsin does "not recommend applying calcium materials to soils simply to increase the Ca:Mg ratios," and its labs' average ratio across 34,755 samples was 3.8 to 1 [11]. Minnesota's folder says a ratio of 2 to 8 had no measurable effect on alfalfa or corn [12]. Michigan State's position is that concern starts only when magnesium saturation nears or exceeds calcium saturation [14]. The Ohio authors concluded that their results "do not provide any evidence" that base cation saturation ratios improve organic field-crop productivity [17]. A 2007 review in the Soil Science Society of America Journal reached the same conclusion across the older literature; we relied on secondary summaries of it and did not open the paper [19].
The Ohio test was not timid. By our conversion at 9.8% magnesium, 13.4 Mg/ha of Epsom salt is about 1,170 pounds of magnesium an acre over six years. Wisconsin's used up to 15,400 pounds of Epsom salt an acre [11].
The sufficiency approach keeps the two parts of the ratio idea that hold up. A sand with more exchangeable potassium than magnesium is at risk [10]. And calcitic lime or heavy gypsum on an acid, low-magnesium soil can induce a deficiency that Wisconsin warns is "very expensive" to reverse [11].
Ground Truth: The ratio program and the magnesium deficiency are often the same purchase, a few years apart. Balancing to a calcium target on a low-exchange-capacity soil means calcitic lime or gypsum, which is the first cause on Wisconsin's list of how deficient soils get that way. The calcium goes on at lime prices. The magnesium to repair it, once pH is at target and dolomitic lime no longer fits, costs $5 a pound in a bag. TRZ-0134 made the same point about over-liming and manganese: the cheap pass creates the recurring bill [26]. On a sand, the soil-test line to read is the magnesium level in ppm against the potassium level. The ratio to calcium tells a buyer nothing those two numbers do not.
5. Break-even bushels, and who buys which source
What's new: December 2027 corn was quoted at $5.12 and November 2027 soybeans at $12.62 on October 12 (delayed quotes as reported in TRZ-0271) [22]. At those prices a 25-pound rate of magnesium needs between zero and 38 bushels of corn to pay, depending entirely on source and package.
Evidence: Twenty-five pounds is Georgia's rate, the middle of North Carolina's, and the bottom of Kentucky's scale [7][8][9]. It is also about what a 150-bushel corn crop takes up; Wisconsin puts that at 15 to 30 pounds [11]. In langbeinite it is 227 pounds of product, inside North Carolina's 175 to 250, and it carries 50 pounds each of K₂O and sulfur.
| Source for 25 lb Mg/acre | Product, lb/acre | $/acre | Corn bu at $5.12 | Soybean bu at $12.62 |
|---|---|---|---|---|
| Dolomitic in place of calcitic, lime already due | — | 0† | 0 | 0 |
| Half a ton of ag lime at Missouri's price, all charged to Mg | 1,000 | 15.29 | 3.0 | 1.2 |
| Half a ton of dolomitic lime at North Carolina's price, all charged to Mg | 1,000 | 42.67 | 8.3 | 3.4 |
| Langbeinite at $650 bulk, K and S both needed | 227 | 22.24* | 4.3 | 1.8 |
| Langbeinite at $650 bulk, K and S not needed | 227 | 73.78* | 14.4 | 5.8 |
| Langbeinite, bagged, K and S both needed | 227 | 143.68 | 28.1 | 11.4 |
| Langbeinite, bagged, K and S not needed | 227 | 195.22 | 38.1 | 15.5 |
| Epsom salt, bagged, S needed | 255 | 132.26 | 25.8 | 10.5 |
| Epsom salt, bagged, S not needed | 255 | 151.02 | 29.5 | 12.0 |
Source: Crop Root Zone calculation from Sections 1 and 2 [1][2][3] and the futures quotes in TRZ-0271 [22]. Futures are unadjusted for basis. Half a ton of lime supplies 60 to 132 lb of magnesium, more than the rate; it is the smallest practical pass. Application is excluded: a separate dry-bulk pass averaged $8.15 an acre in Iowa's 2026 survey, 1.6 bushels of corn, and is zero where the product rides in a potash blend [27]. †Assumes no dolomitic premium. *Scenario price, not a quote.
Against every row but the first, the trial record offers nothing: the corn studies we could open measured no response, including on a marginal sand [13][16]. The break-evens are the bushels needed to pay. No public trial tells a grower how many bushels to expect, and that should hold the purchase to fields with a low test and a tissue test to match. Wisconsin's ear-leaf line at silking is 0.10% deficient and 0.21% to 0.40% sufficient [10].
Who should buy what follows from pH, the soil test and what else the field needs.
Soil test adequate, any pH. Buy nothing. This is most of the Corn Belt. Iowa does not test for it [13], and the Tri-State bulletin's summary is that liming supplies enough [15].
Low magnesium, lime due. Specify dolomitic lime and get the magnesium percentage on the ticket. This is the only case in which the nutrient is free or close to it, and Georgia, North Carolina, Kentucky and Wisconsin all say to do it [7][8][9][10].
Low magnesium, pH at target, potash and sulfur both needed. Langbeinite in bulk, in the potash blend. The test is the delivered quote less $454, divided by 220. Under 71 cents it beats North Carolina dolomitic lime bought for the purpose, and it does so without moving pH.
Low magnesium, pH at target, potassium already high. A straight magnesium sulfate, banded at Wisconsin's and Minnesota's 10 to 20 pounds [10][12]. Wisconsin names Epsom salt as the best source where excess potash caused the problem [10]. Ten pounds of magnesium is $60 an acre at the bagged price, about 12 bushels of corn. Get a bulk price for kieserite or magnesium oxide before paying that; we could not find a public one.
Soybeans on Coastal Plain sands at pH above 6.2. Do not use dolomitic lime to add magnesium. North Carolina reports manganese deficiency as common above that pH on those soils [7], which is the recurring cost TRZ-0134 priced [26].
Grass pasture with a tetany history. Feed the mineral. Use dolomitic lime when lime is due anyway.
Ground Truth: The cost of magnesium is set by timing. On the day lime is ordered it is zero to a few cents a pound, and the person deciding is often choosing a quarry by haul distance without looking at the magnesium line. Once pH is at target the same pound costs $5 to $8 in a bag, or whatever a retailer's bulk langbeinite margin over $454 works out to. So the soil-test magnesium number earns its keep in the fall a field is limed, and at almost no other time. We expect the fields that turn up short over the next few seasons to be sands and Coastal Plain soils limed with the nearest calcitic source or run on a calcium-balancing program, carrying heavy potash. Their operators will be offered langbeinite as the fix at a price nobody has posted publicly.
References
- USDA Agricultural Marketing Service and NCDA&CS Market News, "North Carolina Production Cost Report (Weekly)," report for week ending Oct 2, 2026 (distributor asks per ton: ammonium sulfate $585–$702, average $624, FOB; lime $68–$99, average $85.33, delivered and applied; red potash $500–$595, average $554.33, FOB; urea $710–$825, average $767.50, FOB) — https://mymarketnews.ams.usda.gov/viewReport/3159
- Kientzy, D.; Brown, B., "Custom Rates for Farm Services in Missouri," University of Missouri Extension, G302, revised Mar 2026 (deliver and spread lime, including lime, average $30.58 per ton, range $20–$40, 6 responses; figure carried from TRZ-0257 and not reopened on Oct 13, 2026) — https://extension.missouri.edu/publications/g302
- Seven Springs Farm Supply, site search listing for magnesium products (K-Mag Granular 0-0-22, 11% Mg, 22% S, 50 lb, $43.00; Epsom salt, technical grade, 9.8% Mg, 12.9% S, 50 lb, $29.60; pelletized dolomitic lime, 50 lb, $11.75; Hi-Cal lime, 50 lb, $11.75), accessed Oct 13, 2026 — https://www.7springsfarm.com/search?q=magnesium
- Ohio Earth Food, site search listing (pelletized dolomite lime, 50 lb, $10.75; Hi-Calcium lime, $10.75, marked on sale), accessed Oct 13, 2026 — https://ohioearthfood.com/search?q=magnesium
- Intrepid Potash, Inc., "Intrepid Announces Second Quarter 2026 Results," Aug 4, 2026 (Trio average net realized sales price $389 per ton, against $368 a year earlier; third-quarter Trio guidance $400–$410) — https://www.sec.gov/Archives/edgar/data/0001421461/000142146126000020/ex991q22026pressrelease.htm
- Quinn, R., "UAN32 Leads Fertilizer Prices Higher," DTN Retail Fertilizer Trends, DTN/Progressive Farmer, Oct 7, 2026 (survey week Sep 28–Oct 2, 2026; potash $499 per ton) — https://www.dtnpf.com/agriculture/web/ag/crops/article/2026/10/07/uan32-leads-fertilizer-prices-higher
- North Carolina Department of Agriculture and Consumer Services, Agronomic Division, "Note 3: Fertilization of Field Crops," updated Feb 2013 (dolomitic lime defined as 6% or more magnesium; most lime sold in the state is dolomitic; 20–30 lb water-soluble Mg per acre; 175–250 lb per acre of 0-0-22; manganese deficiency on sandy coastal plain soils above pH 6.2) — https://ncagr.gov/note-3-field-crops/download
- University of Georgia, Agricultural and Environmental Services Laboratories, "Corn (for Grain) Irrigated 250 bu/a (Code C02)," file dated Jan 30, 2018 — https://aesl.ces.uga.edu/publications/soil/cropsheets/C02.pdf
- University of Kentucky Cooperative Extension Service, "Lime and Nutrient Recommendations, 2025–2026," AGR-1, revised Jul 25, 2025 (Table 4, magnesium; grass tetany paragraph) — https://publications.mgcafe.uky.edu/agr-1
- Schulte, E.E., "Soil and Applied Magnesium," University of Wisconsin-Extension, A2524, 2004 — https://corn.aae.wisc.edu/Management/pdfs/a2524.pdf
- Schulte, E.E.; Kelling, K.A., "Soil Calcium to Magnesium Ratios: Should You Be Concerned?," University of Wisconsin-Extension, A2986, 1993 (data from Simson, Corey and Sumner, Communications in Soil Science and Plant Analysis 10:153–162, 1979) — https://corn.aae.wisc.edu/Management/pdfs/a2986.pdf
- Rehm, G.W.; Rosen, C.J., "Magnesium for Minnesota Soils," University of Minnesota Agricultural Extension Service, AG-FO-0725, 1985 (scanned copy). The current page, "Magnesium for crop production," returned an access error on Oct 13, 2026 and is cited from a search summary only — https://conservancy.umn.edu/server/api/core/bitstreams/ffe8d7e9-b2a6-42fa-9f57-202b239afec2/content and https://extension.umn.edu/micro-and-secondary-macronutrients/magnesium-crop-production
- Sawyer, J., "Soil Calcium:Magnesium Ratios," Iowa State University Extension, Integrated Crop Management IC-490(5), Apr 21, 2003 (summarizes McLean et al., Agronomy Journal 75:635–639, 1983, and Webb, 1978) — https://crops.extension.iastate.edu/encyclopedia/soil-calciummagnesium-ratios
- Isleib, J., Michigan State University Extension, "Soil Calcium-to-Magnesium Ratios Should Not Concern Most Farmers," as republished by No-Till Farmer, Nov 16, 2016. The Michigan State bulletin E2904 could not be opened on Oct 13, 2026 — https://no-tillfarmer.com/articles/6238-soil-calcium-to-magnesium-ratios-should-not-concern-most-farmers
- Culman, S.; Fulford, A.; Camberato, J.; Steinke, K., "Tri-State Fertilizer Recommendations for Corn, Soybeans, Wheat, and Alfalfa," Bulletin 974, Ohio State University Extension, 2020 (publisher's sample file: table of contents and summary of changes only; Table 28 not read; author list as commonly cited) — https://extensionpubs.osu.edu/content/sample/e974.pdf
- Rehm, G.W.; Sorensen, R.C., "Effects of Potassium and Magnesium Applied for Corn Grown on an Irrigated Sandy Soil," Soil Science Society of America Journal 49(6):1446–1450, 1985 (abstract as indexed by AGRIS; full paper not opened) — https://agris.fao.org/search/en/records/65de73c54c5aef494fdc41ff
- Chaganti, V.N.; Culman, S.W.; Herms, C.; Sprunger, C.D.; Brock, C.; Leiva Soto, A.; Doohan, D., "Base Cation Saturation Ratios, Soil Health, and Yield in Organic Field Crops," Agronomy Journal 113:4190–4200, 2021 — https://soilfertility.osu.edu/sites/soilf/files/imce/Publications/Chaganti%20et%20al.%20-%202021%20-%20Base%20cation%20saturation%20ratios%2C%20soil%20health%2C%20and%20yi.pdf
- Sever, M., "Managing Soil Acidity, Not Soil Balancing, Affects Yield," Crops & Soils 56(4), Jul 3, 2023 (report on Leiva Soto, Culman and others, Crop, Forage & Turfgrass Management, doi 10.1002/cft2.20210) — https://www.sciencesocieties.org/publications/crops-soils/2023/july-august/managing-soil-acidity-not-soil-balancing-affects-yield
- Kopittke, P.M.; Menzies, N.W., "A Review of the Use of the Basic Cation Saturation Ratio and the 'Ideal' Soil," Soil Science Society of America Journal 71:259–265, 2007 (not opened; cited from secondary summaries returned by search on Oct 13, 2026) — https://doi.org/10.2136/sssaj2006.0186
- Van Saun, R.J., "Grass Tetany: A Disease of Many Challenges," Penn State Extension, updated Apr 23, 2024 — https://extension.psu.edu/grass-tetany-a-disease-of-many-challenges
- Underwood, N., "Magnesium: Often Forgotten but Most Essential," Mosaic Crop Nutrition, undated (producer-published; states a corn response at three low-magnesium Coastal Plain locations without data), accessed Oct 13, 2026 — https://www.cropnutrition.com/magnesium-often-forgotten-but-most-essential
- Crop Root Zone, TRZ-0271, October WASDE corn and soybean balance-sheet feature, Oct 2026 (December 2027 corn $5.12 and November 2027 soybeans $12.62, FXEmpire delayed quotes of Oct 12, 2026; the quote pages were not reopened for this piece) — https://www.fxempire.com/commodities/zc/contracts and https://www.fxempire.com/commodities/zs/contracts
- Crop Root Zone, TRZ-0257, "Ag Lime Costs 2.7 Cents a Pound of Effective Neutralizing Material, Delivered and Spread. Pelletized Lime Costs 11 to 21.," Oct 5, 2026.
- Crop Root Zone, TRZ-0066, "A 22% Potash Product Now Sells at a $93 Premium to a 60% One," Aug 3, 2026.
- Crop Root Zone, TRZ-0177, "Polyhalite Carries Four Nutrients and Is Rated on One. That Tells You What It Actually Is.," Sep 9, 2026.
- Crop Root Zone, TRZ-0134, "Lime Costs $30 a Ton and Is Nearly Impossible to Take Back. On Lakebed Soils It Buys You an Annual Manganese Bill.," Aug 27, 2026.
- Johanns, A.; Hart, C., "2026 Iowa Farm Custom Rate Survey," Iowa State University Extension and Outreach, Ag Decision Maker File A3-10, FM 1698, revised Mar 2026 (dry bulk fertilizer applied $8.15 per acre; figure carried from TRZ-0257) — https://www.extension.iastate.edu/agdm/crops/pdf/a3-10.pdf
Disclosures
Crop Root Zone is an independent publication. Nothing here is investment advice. Market calls, where included, reflect the editors' own read and are not a recommendation to buy or sell any security.
Seaweed Extract Has a 16% Yield Record Worldwide. Almost None of It Was Measured in a Corn Belt Field.
Ascophyllum nodosum extracts cost about $6.50 to $27 an acre in product at label rates. At the September 28 Central Illinois bids of $4.88 corn and $12.54 soybeans, that is 1.3 to 5.6 bushels of corn or 0.5 to 2.2 bushels of soybeans. Two meta-analyses put the average yield gain near 16%. The same data show smaller gains in field trials and with commercial products, and no significant effect in cooler climates or as a seed treatment. North America supplied 1.4% of the maize biostimulant studies in one global review. In the only Canadian soybean field data found, a commercial extract added 1% to 5%, and neither result was significant. California allows seaweed labels to claim only that the extract feeds soil microbes.
A 2.5-gallon jug of Ascophyllum nodosum extract costs about $130 at retail, and the common field-crop label rate is 2 pints an acre. That is roughly $13 an acre in product for a single pass. Central Illinois elevators bid $4.88 for corn and $12.54 for soybeans on September 28 (USDA AMS Illinois Grain Bids, Sep 28, 2026). One pass therefore has to return about 2.7 bushels of corn or 1.0 bushel of soybeans. The published record looks strong at first. A 2026 meta-analysis of 198 studies puts the average yield gain from seaweed extracts at 16.3% (Pérez-Oñate et al., Frontiers in Plant Science, Apr 21, 2026). However, most of that record comes from tropical, arid and greenhouse work, and very little of it comes from the Corn Belt. This piece looks at what the numbers measured, where they were measured, and what a corn or soybean grower in Illinois or Iowa can reasonably expect.
1. What a seaweed program costs, and what it has to return
What's new: Most seaweed extract sold for row crops is made from Ascophyllum nodosum, a brown seaweed harvested in the North Atlantic. Dealer prices are not published, so retail list prices are the only public benchmark. Ohio Earth Food lists Stimplex, an Ascophyllum extract, at $129.00 per 2.5-gallon jug. Its stated rate is 2 pints an acre for field crops, applied every two weeks during the season (Ohio Earth Food, accessed Sep 29, 2026). GrowersHouse lists Acadian Organic Liquid, also a cold-water Ascophyllum extract, at $135.71 per 2.5 gallons (GrowersHouse, accessed Sep 29, 2026). That works out to $6.45 and $6.79 a pint. The BRANDT Seaweed Max product sheet lists 1 to 4 pints an acre for field and row crops (BRANDT, product sheet, Jun 2025).
Evidence: The table below applies those prices to the label range. If the product cannot be tank-mixed with a planned herbicide or fungicide pass, add the sprayer trip. Iowa State's 2026 survey puts a custom self-propelled broadcast application at an average of $9.35 an acre (Iowa State University Extension, Mar 2026).
| Program | Basis | $/acre | Bu corn to pay at $4.88 | Bu soybeans to pay at $12.54 |
|---|---|---|---|---|
| 1 pt/ac, one pass, tank-mixed | Retail, $6.45–$6.79/pt* | 6.45–6.79 | 1.3–1.4 | 0.5 |
| Typical biostimulant | Univ. of Illinois average | 8.00–12.00 | 1.6–2.5 | 0.6–1.0 |
| 2 pt/ac, one pass, tank-mixed | Retail; Stimplex field-crop rate* | 12.90–13.57 | 2.6–2.8 | 1.0–1.1 |
| 2 pt/ac, own sprayer pass | Above + $9.35 custom application | 22.25–22.92 | 4.6–4.7 | 1.8 |
| 4 pt/ac, or 2 pt/ac twice | Retail; top of BRANDT label range* | 25.80–27.14 | 5.3–5.6 | 2.1–2.2 |
Sources: Ohio Earth Food, Stimplex listing, and GrowersHouse, Acadian Organic Liquid listing (both accessed Sep 29, 2026); BRANDT Seaweed Max product sheet (Jun 2025); Below and Sible, University of Illinois ACES (Jul 15, 2021); Iowa State University Extension, 2026 Iowa Farm Custom Rate Survey (Mar 2026); USDA AMS Illinois Grain Bids, Central Illinois country elevator average (Sep 28, 2026). *Single-jug retail list prices, used as a ceiling. Dealer and volume prices are usually lower but are not published, so treat these rows as estimates.
For scale, assume an illustrative 200-bushel corn crop and 60-bushel soybean crop. A tank-mixed 2-pint pass then needs about a 1.4% gain on corn or a 1.7% gain on soybeans to break even. The bar is low. The real question is whether any trial on Corn Belt ground can show that a gain of that size is real.
Ground Truth: Seaweed extract only pays when it goes on in a pass you were already making. The product is cheap enough that a tank-mixed pint or two needs a 1% to 2% response. As a standalone trip, the sprayer cost is often larger than the product cost, and the break-even on soybeans nearly doubles. If a seaweed program is the only reason a sprayer is going through the field, the purchase is hard to justify.
2. What the 16% actually measures
What's new: Two meta-analyses are behind most of the percentages quoted for this category. The first, by Li, Van Gerrewey and Geelen at Ghent University, pooled 1,087 paired field observations from 180 studies of non-microbial biostimulants. It found an average yield gain of 17.9% across categories, with seaweed extracts at 16.5% to 18.0%. Seaweed extract was the category with "the most consistent yield increase" (Li et al., Frontiers in Plant Science, Apr 14, 2022). The second, published this April by Pérez-Oñate and 19 co-authors, covered seaweed extracts only. It pooled 2,021 treatment-control comparisons from 198 studies and found an average gain of 16.3% (95% CI 13.5% to 19.1%). Ascophyllum nodosum alone gained 16.3%, or 15.3% when only commercial extracts were counted (Pérez-Oñate et al., Apr 21, 2026).
Evidence: The 2026 paper breaks its average down by subgroup, and several subgroups matter for a Corn Belt buyer.
| Subgroup (2026 meta-analysis) | Yield effect | 0–35% scale |
|---|---|---|
| Tropical monsoon and savanna climates | ~30–33% | █████████░ |
| Controlled-environment experiments | 21.8% | ██████░░░░ |
| All seaweed extracts, all studies | 16.3% | █████░░░░░ |
| Foliar application | 15.5% | ████░░░░░░ |
| Ascophyllum, commercial extracts only | 15.3% | ████░░░░░░ |
| Field trials only | 14.0% | ████░░░░░░ |
| Commercial extracts only | 13.7% | ████░░░░░░ |
| Seed treatment | 11.3%, n.s. | ███░░░░░░░ |
| Cooler climate zones | n.s., not reported | ░░░░░░░░░░ |
Source: Pérez-Oñate et al., "Crop yield responses to seaweed extract-based biostimulants depend on application strategy, formulation, and extraction methods: a meta-analysis," Frontiers in Plant Science 17:1803269 (Apr 21, 2026). Field trials 95% CI 11.5–16.5%; commercial extracts 95% CI 11.0–16.5%; controlled environment 95% CI 14.9–29.0%. Bars scaled to 35% = 10 blocks. n.s. = not statistically significant.
The effect gets smaller as the conditions get closer to a working Corn Belt farm. Field trials show 14.0%, against 21.8% in controlled environments. Commercial products show 13.7%, against 21.6% for extracts made in the lab. The largest effects came from tropical monsoon and savanna climates, at about 30% to 33%. The authors state that "effects in cooler zones with limited representation were not statistically significant." Most of the Corn Belt is in a humid continental climate, so it falls into that cooler, under-sampled group. Heterogeneity was high throughout the dataset, with I² values of about 85% to 96%. That means most of the variation between studies reflects real differences in conditions, not sampling noise. The Ghent analysis found the same pattern from the other direction: yield gains "showed a clear negative trend with increased precipitation," and responses were largest in arid climates and low-organic-matter soils.
Funding matters for how these averages are read. The 2026 paper was partly funded by Acadian Seaplants Limited, the Nova Scotia-based Ascophyllum processor, and six of its authors were employed by Acadian (Pérez-Oñate et al., funding and conflict-of-interest statements). The Ghent analysis reports no such tie, and it found no significant publication bias. The two analyses reach nearly the same average. That suggests the 16% figure is not an artifact of who paid for the work. It does not show that 16% applies to a rain-fed Illinois cornfield.
Ground Truth: For Corn Belt corn and soybeans, the 16% average is the wrong starting point. The same dataset says to start from the field-trial and commercial-product estimates of about 14%. It then shows no significant effect at all in the cooler climates that match the Midwest. The meta-analyses do not predict a Corn Belt response, because they contain almost no Corn Belt data. What they do identify is where seaweed extract has worked: hot, dry and saline conditions. Midwest growers should put it on the acres that most resemble those conditions.
3. The North American record is nearly empty
What's new: A 2024 systematic review of biostimulants on maize grain yield, covering studies published from 2011 to 2023, found that 46.4% of the articles came from Asia, 23.2% from South America, 17.4% from Europe, 11.6% from Africa and 1.4% from North America (Ocwa et al., Journal of Soil Science and Plant Nutrition, 2024). The seaweed studies in that review came from India and Iran and used tropical red seaweeds such as Kappaphycus and Gracilaria, not the Ascophyllum sold in the Corn Belt.
1.4%
Share of the maize biostimulant studies in a 2011–2023 global review that came from North America. (Ocwa et al., Journal of Soil Science and Plant Nutrition, 2024)
Evidence: Crop Root Zone's search found only one open-access, peer-reviewed set of Ascophyllum yield data on a North American row crop with results broken out by site. Łangowski and colleagues tested Sealicit, a commercial Ascophyllum extract, on soybeans. They ran one foliar spray in Ontario and Manitoba in 2017 and in São Paulo state, Brazil, in 2019–20. The lead author worked at Brandon Bioscience, the Irish company that makes Sealicit. The work was funded under the EU Horizon 2020 SUSBEAN project (Łangowski et al., Frontiers in Plant Science, Feb 24, 2021).
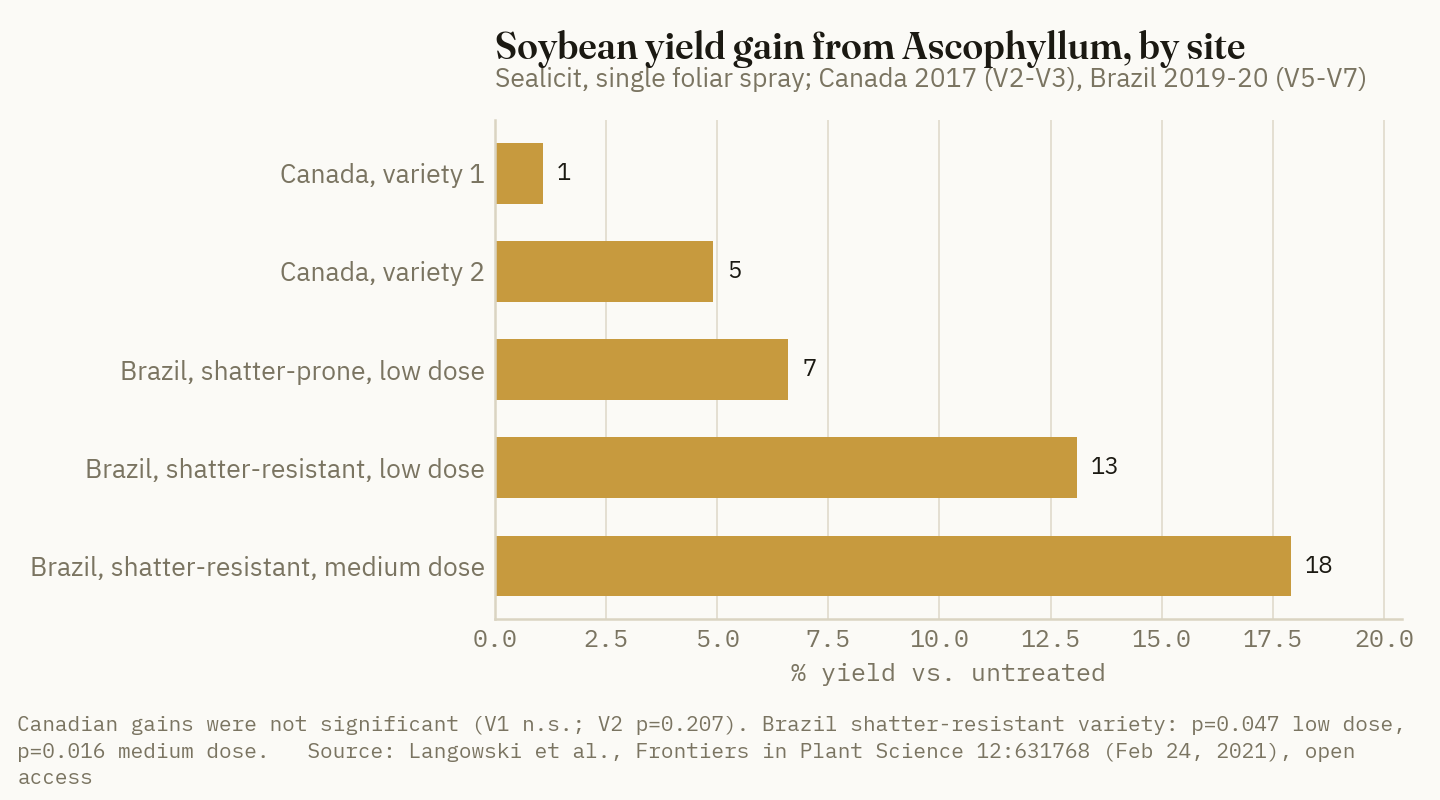
The Canadian results were a 1.08% gain for one variety, not significant, and a 4.91% gain for the other, with a P value of 0.207. In Brazil, the shatter-resistant variety gained 13.1% at the low dose (P = 0.047) and 17.9% at the medium dose (P = 0.016). The paper attributes much of the Brazilian gain to reduced pod shattering, a larger source of loss in that environment. Timing also differed: the Canadian spray went on at V2–V3 and the Brazilian spray at V5–V7. Even in a paper written by the manufacturer, the northern sites produced the smaller and non-significant results.
On corn, the same search found no open-access, independent, replicated North American field trial of an Ascophyllum extract with grain yield reported. The University of Illinois work most often cited on "kelp for corn" is a categorical review. It prices the average biostimulant at $8 to $12 an acre but reports no seaweed yield data (Below and Sible, University of Illinois ACES, Jul 15, 2021). The Dalhousie University and Acadian studies of Ascophyllum on soybean drought stress measured leaf temperature, stomatal conductance and stress-gene expression over short drought-and-recovery trials, not grain yield (Martynenko et al., SpringerPlus, 2016; Shukla et al., AoB Plants, 2017).
The most visible Midwest numbers come from sellers. The BRANDT Seaweed Max product sheet charts a 2024 Illinois in-season trial at +3.8 bu/ac for 1 pint and +3.4 bu/ac for 2 pints. It also charts 2024 "third party" trials in Indiana, Minnesota, Iowa and Wisconsin, with gains ranging from +0.2 to +5.8 bu/ac (BRANDT, Jun 2025). These are manufacturer claims. The sheet shows no replication, variance or significance. In the Illinois trial, doubling the rate did not increase the yield gain.
For context, the largest recent public test of biostimulants on soybeans found nothing. Land-grant agronomists in the Science for Success program ran seed-applied biostimulant products across 103 site-years in 22 states in 2022 and 2023. They found no significant yield difference from untreated seed within or across clusters (Field Crops Research, Dec 2025, via University of Minnesota Extension, Jan 7, 2026). The public coverage does not list the products, so this review cannot confirm that any was seaweed-based. The 2026 meta-analysis, however, found seaweed extract as a seed treatment was not significant either.
Ground Truth: Weigh the Canadian soybean numbers above the global average. They come from a commercial Ascophyllum product, at the latitude where Corn Belt soybeans grow, published by the maker. They show a 1% to 5% gain that could not be distinguished from zero. That is close to the break-even for a tank-mixed 2-pint pass on soybeans. It is well short of the 13% to 18% the same product produced in Brazil. A grower buying on a Brazilian or Indian number is paying for a response that the product's own northern data do not show.
4. The break-even is smaller than a field trial can measure
What's new: The break-even for a tank-mixed seaweed program is 1% to 2% of yield. Most on-farm and small-plot trials cannot detect a difference that small. In the Michigan State soybean trials reviewed in this publication's humic acid piece (TRZ-0237), the least significant difference was 2.8 bushels, about 5% of the 60-bushel check (MSU Extension via No-Till Farmer, Dec 27, 2017). A Practical Farmers of Iowa corn biostimulant strip trial recorded a 10-bushel difference that was not significant, because the LSD was 14 bushels (Practical Farmers of Iowa, biostimulant effects on corn).
Evidence: A single strip or plot trial on a Corn Belt farm can confirm a gain of roughly 5% or more. It cannot confirm the 1.4% a 2-pint corn program needs. Any single-site result showing +3 or +4 bushels, including the manufacturer figures above, falls inside the range where noise and a real effect look the same. Many site-years are needed to resolve a 1% to 2% effect. The public record for seaweed on Corn Belt corn and soybeans does not yet contain them.
| What you need to know | Size | Can one strip trial show it? |
|---|---|---|
| Break-even, 2 pt/ac tank-mixed, 200-bu corn | ~1.4% (2.7 bu) | No |
| Break-even, 2 pt/ac tank-mixed, 60-bu soybeans | ~1.7% (1.0 bu) | No |
| Sealicit, Canadian soybean sites (Łangowski 2021) | 1.1% and 4.9%, n.s. | Tested; no |
| MSU soybean trial LSD (2016) | 2.8 bu, ~4.7%* | Detection floor |
| PFI corn strip trial LSD | 14 bu | Detection floor |
| 2026 meta-analysis, field trials, all climates | 14.0% | Yes, if it occurred |
Sources: Section 1 break-evens; Łangowski et al. (Feb 24, 2021); MSU Extension via No-Till Farmer (Dec 27, 2017); Practical Farmers of Iowa, "Biostimulant Effects on Corn"; Pérez-Oñate et al. (Apr 21, 2026). 200-bu corn and 60-bu soybean yields are illustrative assumptions. *Percentage calculated against the 60.0-bu Mason, Mich., check.
This is why a 14% field average does not settle the question. If Corn Belt fields responded at anything like 14%, which is 28 bushels on 200-bushel corn, strip trials would show it every year. They do not. Public and farmer-led trial networks that have tested biostimulants in the region have not found a reliable response. Manitoba's on-farm network recorded no significant yield gain from biostimulants across 38 site-years from 2019 to 2025, on products costing $5 to $28 an acre (Manitoba Pulse & Soybean Growers, Dec 2025). The Midwest effect, if there is one, is small, probably in the low single digits, and too small for individual farm trials to confirm.
Ground Truth: If you use seaweed extract, set up the test so it can give a usable answer. Do not run one split field. Run at least six to eight replicated strips across two or three fields over two seasons, and put them on the ground most likely to respond: sandy, droughty or saline acres. Leave out the high-organic-matter, well-watered acres where both meta-analyses predict the least. Keep the product in a planned tank mix so the cost stays near the 1.4% bar. A single +4-bushel strip is not evidence in either direction.
5. What the label actually guarantees
What's new: California has published a list of permitted plant biostimulant label claims, in effect since January 1, 2025. Seaweed and kelp extract are among just three ingredients (with humic acid) allowed to use the term "plant biostimulant." The permitted claims are narrow. A label may say the ingredient "acts to support a plant's natural nutrition process." It may also say that seaweed or kelp extract "is a food source for microorganisms," and, only alongside that statement, that it "subsequently enhances microbial growth" (CDFA, Notice to Fertilizing Material Licensees, Dec 11, 2024). The list includes no yield claim and no stress-tolerance claim. The regulatory path behind this was covered in TRZ-0091.
Evidence: The guaranteed analysis on the bag shows how little a buyer can check. The BRANDT sheet guarantees one nutrient, 2.0% soluble potash, "derived from kelp extract (Ascophyllum nodosum and potassium hydroxide)." The potassium hydroxide is the extraction agent. The active compounds the sheet promotes are listed in parts per million: 15,000–20,000 ppm mannitol, 10,000–20,000 ppm betaines, 35,000–45,000 ppm organic and amino acids, and 10,000–20,000 ppm polysaccharides and glucosides. None of these is part of the legal guarantee (BRANDT, Jun 2025). If the liquid weighs about 9 lb/gal, a density this publication assumed and the sheet does not state, a pint weighs about 1.1 lb. It would carry roughly 0.02 lb of K₂O and a similar 0.02 lb of mannitol. As with humic acid, the product works as a signal to the plant, if it works at all. It is not a meaningful source of nutrients.
| What the buyer gets | Guaranteed on the label? | Where it comes from |
|---|---|---|
| Soluble potash (2.0% K₂O in one product) | Yes | Partly from the KOH extraction agent |
| Mannitol, betaines, amino acids, polysaccharides | No, marketing sheet only (ppm) | Manufacturer claim |
| "Plant biostimulant" wording | California only, since Jan 1, 2025 | CDFA claim list |
| "Food source for microorganisms" | Yes, permitted claim (CA) | CDFA claim list |
| Yield or stress-tolerance claim | Not on the permitted list (CA) | Not allowed |
| Extraction method (alkaline, water, enzyme) | Sometimes named, not standardized | Manufacturer |
Sources: CDFA, "Notice to Fertilizing Material Licensees: Beneficial Substance Labeling Format & Plant Biostimulant Label Claims" (Dec 11, 2024); BRANDT Seaweed Max product sheet (Jun 2025); Pérez-Oñate et al. (Apr 21, 2026).
The extraction method may matter more than the brand name. The 2026 meta-analysis found alkaline hydrolysis extracts averaged 21.2% and water-based extracts 16.6%. Acid-hydrolysis extracts averaged 10.6% and enzyme-assisted extracts 0.9%, and neither was significant. Powders averaged 22.6% and liquids 15.3%, although that difference was not significant. The analysis found no significant linear relationship between dose and response, which is consistent with the flat 1-pint versus 2-pint result on the BRANDT sheet. It also means paying for a 4-pint rate buys nothing the data can show.
Ground Truth: Choose a seaweed extract on three things the label and the dealer can answer: how it was extracted, what it costs per acre at the lowest labeled rate, and whether it can ride in a planned pass. Alkaline-extracted Ascophyllum at 1 to 2 pints in a fungicide or herbicide tank mix is the version the global data support best, at about $6.50 to $13.50 an acre. Pay nothing extra for higher rates, and give no weight to yield charts without replication. Even California does not let the label claim more than that the product feeds soil microbes.
References
- USDA AMS Livestock, Poultry and Grain Market News / Illinois Dept. of Agriculture, Illinois Grain Bids (report 3192), Sep 28, 2026 (Central Illinois country elevator average: corn $4.88, soybeans $12.54; CBOT Dec 2026 corn 523.00¢, Nov 2026 soybeans 1288.25¢) — https://www.ams.usda.gov/mnreports/ams_3192.pdf
- Pérez-Oñate, C.J.; Nicolau, M.C.M.; et al., "Crop yield responses to seaweed extract-based biostimulants depend on application strategy, formulation, and extraction methods: a meta-analysis," Frontiers in Plant Science 17:1803269, Apr 21, 2026 (open access; partially funded by Acadian Seaplants Limited) — https://doi.org/10.3389/fpls.2026.1803269
- Li, J.; Van Gerrewey, T.; Geelen, D., "A Meta-Analysis of Biostimulant Yield Effectiveness in Field Trials," Frontiers in Plant Science 13:836702, Apr 14, 2022 (open access) — https://pmc.ncbi.nlm.nih.gov/articles/PMC9047501/
- Ocwa, A.; Mohammed, S.; Mousavi, S.M.N.; et al., "Maize Grain Yield and Quality Improvement Through Biostimulant Application: a Systematic Review," Journal of Soil Science and Plant Nutrition, 2024 (open access) — https://doi.org/10.1007/s42729-024-01687-z
- Łangowski, Ł.; Goñi, O.; Marques, F.S.; et al., "Ascophyllum nodosum Extract (Sealicit™) Boosts Soybean Yield Through Reduction of Pod Shattering-Related Seed Loss and Enhanced Seed Production," Frontiers in Plant Science 12:631768, Feb 24, 2021 (open access) — https://pmc.ncbi.nlm.nih.gov/articles/PMC7943832/
- Ohio Earth Food, "Stimplex Crop Biostimulant" product listing ($129.00 per 2.5-gal jug; 2 pt/ac field crops), accessed Sep 29, 2026 — https://ohioearthfood.com/products/stimplex-crop-biostimulant
- GrowersHouse, "Acadian Organic Liquid, 2.5 gallon" product listing ($135.71), accessed Sep 29, 2026 — https://growershouse.com/products/acadian-organic-liquid-2-5-gallon
- BRANDT Consolidated, Inc., "BRANDT® Seaweed Max — High Performance Biostimulant" product sheet (guaranteed analysis, use rates, trial charts), Jun 2025 — https://brandt.co/media/24957/brandt-seaweedmax-2025-06-web.pdf
- Iowa State University Extension and Outreach, Ag Decision Maker File A3-10, 2026 Iowa Farm Custom Rate Survey, revised Mar 2026 — https://www.extension.iastate.edu/agdm/crops/pdf/a3-10.pdf
- University of Illinois College of ACES, "Kelp for corn? Illinois scientists demystify natural products for crops" (Below, F. and Sible, C.), Jul 15, 2021 — https://aces.illinois.edu/news/kelp-corn-illinois-scientists-demystify-natural-products-crops
- University of Minnesota Extension, "Do biostimulant seed treatments boost soybean yields? New study across 103 locations in 22 states says no," Jan 7, 2026 (reporting Field Crops Research, Dec 2025) — https://blog-crop-news.extension.umn.edu/2026/01/do-biostimulant-seed-treatments-boost.html
- "Commercial biostimulant seed treatments showed minimal impact on soybean seed yield across the United States," Field Crops Research, Dec 2025 (abstract via University of Kentucky scholars portal) — https://scholars.uky.edu/en/publications/commercial-biostimulant-seed-treatments-showed-minimal-impact-on-/
- Michigan State University Extension, "Soybean Yield Response to Foliar Applied Humic Acid and Fungicide," republished by No-Till Farmer, Dec 27, 2017 — https://www.no-tillfarmer.com/articles/7387-soybean-yield-response-to-foliar-applied-humic-acid-and-fungicide
- Practical Farmers of Iowa, "Biostimulant Effects on Corn," farmer-led research report — https://practicalfarmers.org/research/biostimulant-effects-on-corn/
- California Department of Food and Agriculture, "Notice to Fertilizing Material Licensees: Beneficial Substance Labeling Format & Plant Biostimulant Label Claims," Dec 11, 2024 — https://www.cdfa.ca.gov/is/ffldrs/docs/fertilizer/notice_to_industry-beneficial_substances_plant_biostimulants-final-12-11-24.pdf
- Martynenko, A.; Shotton, K.; Astatkie, T.; Petrash, G.; Fowler, C.; Neily, W.; Critchley, A.T., "Thermal imaging of soybean response to drought stress: the effect of Ascophyllum nodosum seaweed extract," SpringerPlus 5:1393, 2016 (open access) — https://doi.org/10.1186/s40064-016-3019-2
- Shukla, P.S.; Shotton, K.; Norman, E.; Neily, W.; Critchley, A.T.; Prithiviraj, B., "Seaweed extract improve drought tolerance of soybean by regulating stress-response genes," AoB Plants 10(1):plx051, 2017 (open access) — https://doi.org/10.1093/aobpla/plx051
- Manitoba Pulse & Soybean Growers (C. Forsythe), "Long-Term Plant Biostimulant On-Farm Network Trial Results," Dec 2025 — https://manitobapulse.ca/2025/12/long-term-plant-biostimulant-on-farm-network-trial-results/
Disclosures
Crop Root Zone is an independent publication. Nothing here is investment advice. Market calls, where included, reflect the editors' own read and are not a recommendation to buy or sell any security.
Discussion
Retail anhydrous crossed $1,000 a ton this week while urea slipped, and DTN reports nearly the whole Corn Belt is still above the 50°F soil threshold for fall application. So: if your soils have not cooled by the end of November, do you still put anhydrous on this fall, with or without an inhibitor, or switch those acres to spring urea or UAN, and what per-ton price, delivered, is your dealer quoting for each?
Corrections are as welcome as answers. If you check our arithmetic against a primary source and find we have it wrong, reply to the email and tell us. The sharpest replies get answered in next week's Letters & Responses.