Issue 16 · 2026-11-02
Most of this issue asks one question: what is the headline number worth once you charge the decision with everything it costs? Fall anhydrous looks 20 cents a pound of nitrogen cheaper than spring UAN28. After the knife, the inhibitor and the interest, that discount buys 17 pounds an acre, and trials put fall's cost at 10 to 23. Retail anhydrous is up $145 in a year while the Henry Hub gas in that ton fell about $21, so gas does not explain the price either.
The same arithmetic runs through the other departments. Pinto beans are bid $42.75, but that is a 2026 price, and no buyer has published a 2027 contract. Long-grain rice needs $15.88 to match soybeans on Arkansas's lowest-cost budget, with cash near $15. A round-bale barn needs $610 hay to beat a tarp on dry matter alone. A urease inhibitor has to conserve 7 to 11 points of applied nitrogen. A gallon of liquid lime holds 26 cents of neutralizing value and retails near $29.
Why now: the fall nitrogen window is opening late, and 2027 budgets are being written against prices that moved again last week. November Tampa rose $95 a tonne while December corn lost 8¼ cents. We show each break-even and its assumptions so you can replace them with your own quotes.
— Crop Root Zone, Editorial Desk.
Letters & Responses
No reader correspondence reached us this week. We searched the publication inbox on November 2, from October 25 onward, and found no questions, corrections or pushback about RZ-015; the same search returned older threads and nothing from a reader, so this is a real zero, and we will not invent a letter to fill the space.
On the RZ-004 letter about hedging nitrogen. The one letter we keep returning to asked why a grower can hedge corn, beans and wheat but has no instrument to lock in ammonia, urea, UAN or AMS. Our answer then was that nitrogen is several products with wide regional spreads, so there was no single deliverable to write a contract on.
Our update: two weeks after MIAX began trading physically settled NOLA urea, DAP, MAP and potassium chloride futures on October 19, we still find no published volume or open interest for them. The older cash-settled market gives a sense of how thin this is. A quote page for CBOT's November U.S. Gulf urea contract showed volume of 15 and open interest of 307 on October 30, with a status line reading no recent trades (Farmbucks, accessed Nov 2, 2026). Either way, the instrument covers the Gulf price, not the farm price.
Open questions (ours, not readers'). Three questions from recent issues are still unanswered, and this issue adds evidence to each and a fourth question of its own.
- RZ-015's potash question. What is your dealer quoting for spring 2027 potash, on what basis, and does your contract say who pays if a duty lands on tons already in the warehouse? DTN's retail average is now $506 a ton, up $8 on the month.
- RZ-014's sulfur question. What sulfur source and rate are you booking for 2027 corn, and on what basis? One distributor summary now reports a $615-a-long-ton fourth-quarter Tampa contract. That is the only public report of the number we have found, and we cannot confirm it from a second source.
- RZ-012's booking question. What were you quoted for spring nitrogen, and on what terms? November Tampa has since risen $95 a tonne to $640, and the Illinois average anhydrous ask is up $33.61 in two weeks.
- This issue's fall nitrogen question. Discussion, at the end of the issue, asks for your two quotes.
Corrections, disagreements and figures from your own operation are welcome by email. We answer the sharpest ones here the following week.
In This Issue
This week's features, by department.
- Fall Anhydrous Is 20 Cents a Pound of N Under Spring UAN28. After the Knife, the Inhibitor and the Interest, It Can Give Up 17 Pounds an Acre. Trials Put the Fall Cost at 10 to 23.At DTN's $987 anhydrous and $447 UAN28, a stabilized fall pass keeps $11.93 of a $34.50 nitrogen spread on 176 pounds. That buys 17 extra pounds, or 8.8% of the fall nitrogen. Against UAN32 it buys 7, and against urea it buys none. At a 20-pound agronomic gap the walk-away price against flat UAN28 is $970, under today's retail average. Iowa soils were still 51 to 63°F on October 27 with 47% of the corn out, so the window opens later and shorter than the discount needs.
- Winter Gas Fell 47 Cents in Three Weeks, Taking $15 Out of a Ton of Ammonia. Tampa Rose About $86. Henry Hub Is $95 of a $987 Retail Ton.At the Oct. 30 November-to-March strip of $2.91, US gas is 9.6% of retail anhydrous, about 10% of retail urea and 7% to 10% of retail UAN. Retail anhydrous is $145 a ton above a year ago while the gas in that ton fell about $21; matching that rise with gas would take Henry Hub near $7.89. Over 16 months, Tampa and Henry Hub had a correlation of −0.04. The gas in the nitrogen price now is Europe's, at about $31 against $2.90.
- China Reopened Phosphate Exports on Sept. 1 and Shipped No DAP or MAP in September. NOLA DAP Is $802.50 a Ton, Level With India's Delivered Price.China's customs data for the first month of the licensed window show zero DAP and zero MAP exports, and only about 180,000 tonnes of both for January to September, against roughly 3.6 million a year earlier. Chinese DAP prices fell $45 to $52 a tonne in the meantime instead of rising toward export parity, so the gate is administrative, not commercial. NOLA DAP barges at $800–805/st convert to about $885 a metric ton, within $10 of India's $890–900 CFR, and NOLA MAP sits about $50 a tonne over Brazil. India still has no rabi subsidy rates. The one input getting cheaper is sulfur: a reported $615 fourth-quarter Tampa contract takes about $32 out of a short ton of DAP, but that relief arrives in spring 2027, not in this winter's price.
- Russia's Black Sea Ammonia Route Has Been Shut Since 2022, and Drones Cut Its Ammonia Output 7.5% This Year. The US Imports None of That Ammonia, but Took 36% of Its Urea and 58% of Its UAN From Russia in 2025.The 2.5-million-tonne Togliatti–Odesa pipeline is still closed, the Baltic terminal built to replace it moved 560,000 tonnes in 2025, and the Taman terminal on the Black Sea is still not open. Since February, drone strikes on Russian nitrogen plants, the latest at Novomoskovsk on Oct 28, have helped cut Russian ammonia output 7.5% in January to May. The US bought no Russian ammonia in 2024 or 2025, so fall anhydrous is not exposed directly. The exposure is in spring products: Russia supplied 36% of US urea imports and 58% of US UAN imports in 2025. Europe now pays about $170 a tonne more for ammonia than the October Tampa contract, and Ukraine has become a net buyer of nitrogen. As of the morning of Oct 28, no public source had reported a November Tampa settlement.
- Retail Anhydrous Sits $435 a Ton Over the Tampa Ammonia Contract. Last Fall the Gap Held Near $275.The $171 year-on-year rise in retail anhydrous that USDA's deputy secretary cited at an Iowa antitrust hearing came while the September Tampa contract rose only $15 a tonne. The retail-over-Tampa spread held between $273 and $278 a ton from September to December 2025 and has run $373 to $439 in every month checked since March. Allowing for tanks filled on earlier, higher contracts cuts the year-on-year widening to about $37 with a one-month lag and reverses it with a two-month lag, so October and November retail prints will show which reading is right.
- A Long-Grain Rice Acre Needs $15.88 to Match 2027 Soybeans on Arkansas's Lowest-Cost Budget. Cash Is Near $15. PLC Pays $145 a Base Acre Whichever Crop You Plant.Rough rice rallied to $17.89 on a 33-year-low crop. We repriced the University of Arkansas budgets for this year's fuel and urea. An owner-operator covers full cost at $15.26 to $16.42 per cwt and matches soybeans at $15.88 to $17.04. A 25% share tenant needs $18.14 to $19.69. PLC does not belong in that comparison, because it pays on base acres, and every $1 of price rally takes about $50 per base acre out of it. Roughly 276,000 added acres would equal the entire projected long-grain carryout.
- Pinto Beans Are Bid $42.75, 97% Over Last Year. On NDSU's Budgets They Need $30 to $32 to Match 2027 Soybeans. After the Last Run Above $40, Acres Rose 31% and the Price Fell to $30.20.USDA cut the 2026 dry bean crop 20% to 21.6 million cwt, with North Dakota down 33%, and bids doubled. We repriced NDSU's seven bean budgets against 2027 grain prices. A bean acre matches soybeans at $29.71 to $32.21 a hundredweight, corn at $25 to $28 and spring wheat at $23 to $27. Today's bid beats soybeans by $177 to $236 an acre, but it is a 2026 price. No buyer has published a 2027 contract. On East Central numbers, a $36 contract beats soybeans in both a normal year and a 2026-style drought year.
- Malt Barley Paid $2.00 a Bushel Over Feed in August. On NDSU's North Central Budget, Full Malt Acceptance Is Worth $117 an Acre and Still Trails Canola by $34.U.S. barley output fell 19% to 116 million bushels on record-low plantings, and Canada expects less than 2 million tonnes of selectable malting barley. No maltster has published 2027 terms. We repriced NDSU's 2026 North Central budget at late-October prices. A malt barley acre beats durum once 16% of the crop makes malt and covers full cost at 38%, but it never catches canola. In Idaho the malt premium is larger than crop insurance will cover.
- Oil Sunflowers Are Bid $25.90 at Enderlin, 23% Over Last Year. On NDSU's East Central Budget That Returns $159 an Acre, Ahead of Soybeans at $109, Canola at $61 and Spring Wheat at a $48 Loss.Crusher bids for high-oleic seed are $4.90 a hundredweight over a year ago and the 2027 contract is open at $25.50. We repriced NDSU's 2026 budgets at October 27 cash bids. At budget yields, oil sunflower returns the most per acre in East Central North Dakota. At this year's state-average yields the lead shrinks to $8 over canola. To beat soybeans in 2027 a sunflower field needs about 1,855 pounds. Fertilizer is 14% of sunflower revenue, against 34% for spring wheat.
- August Moved Corn Acres Up 1.4 Million and Yield Down 2.3 Bushels. The Crop Changed by 0.08%.Two revisions worth roughly 200 million bushels each cancelled to 13 million — but one of them is close to settled and the other has six weeks of weather left, which is the whole difference for anyone pricing grain into Friday's report.
- A Round-Bale Barn Costs About $30 a Ton a Year and a Tarp on Rock About $11. The Tarp Pays at $60 to $140 Hay. Against the Tarp, the Barn Needs $610 Hay or an $18 Sale Premium.USDA's September prices put other hay at $143 and alfalfa at $208. Across six sets of trial evidence, a tarp on a rock pad covers its cost at $59 to $139 a ton in four and at $203 and $372 in the two low-loss sets. A barn's three-point dry matter edge over that tarp is worth $4 to $6 a ton at today's prices against an $18 extra cost at 400 bales, so a new barn only pays on hay sold into a grade premium, or against bare ground at the right bale count.
- A Five-Year-Old Combine Asks About $299,000 and a Ten-Year-Old About $137,000. Against Iowa's Custom Rate, the Older One Pays at About 1,460 Acres and the Younger at 2,800. Buying at Auction Moves Those Lines to 910 and 1,710.Used combine auction values are up 2.7% on the year and down about 3.5% since March, with inventory 9.5% lower, so the market has not moved enough to change the decision. What changes it is the machine's age and the gap between asking and auction, which is 38% on Sandhills' index. In our model, age moves the break-even by about 1,300 acres, the purchase route by 550 to 1,090, and a $50,000 rebuild on the older machine by 500 to 550.
- Iowa Had 53% of Its Corn Still Standing on October 25, on the Wettest Topsoil in the Corn Belt. Tracks on a Grain Cart Cost About $49,000 More Than Tires and Fix Only the Shallow Half of the Damage.The research on a single wet pass at 10 to 12 tons per axle has held for 30 years: about 15% off the next crop, of which about 10 points sit in the topsoil and upper subsoil and fade within 5 to 10 years, and 3 to 5% sit below 16 inches and stay. Tire pressure, IF/VF casings, CTIS and tracks work on the shallow part. Only axle load works on the deep part, and a loaded 1,100-bushel cart carries three to four times the research threshold. On our model, VF combine fronts pay on about 60 farm acres, CTIS on 200 to 350 and cart tracks on about 700, if each avoids half the shallow loss and one harvest in three is wet.
- Monitoring a 30,000-Bushel Bin Costs $71 to $1,162 a Year. It Pays If It Saves Corn 0.7 Point of Over-Drying, or Soybeans 0.3.A single-point alarm lists at $499 with no subscription. GSI's automated cable-and-fan package starts at $6,000 for a 50,000-bushel bin before installation and fees. Annualized over ten years, a wired cable system runs 2 to 4 cents a bushel a year on bins of 20,000 bushels and up, and automated control 2.6 to 5.8 cents. One musty discount is 10 cents on the whole bin, and one point of soybean over-drying is 13.6 cents. The break-even turns on crop and storage horizon more than bin size: soybeans and corn held past May clear it easily, corn sold by February barely needs it. Purdue documented 21 grain entrapments in 2025, the lowest in ten years.
- A Urease Inhibitor Adds About 6.5 Cents to a 73-Cent Pound of Urea Nitrogen. In Montana's Wheat Trials It Saved Enough Nitrogen to Pay in 9 of 17. Yield Moved in 1 of 9.We estimate NBPT treatment at 5 to 8 cents a pound of N, which is $3 to $5 an acre on 60 pounds of wheat topdress and $7.50 to $12 on 150 pounds of surface-applied corn nitrogen. On nitrogen alone it has to conserve 7 to 11 points of applied N, roughly an 11% to 17% untreated loss. Corn needs 1.7 to 2.7 bushels. Trial results split on rain within days of application, more than on crop or soil.
- A Gallon of Real Liquid Lime Holds 9.5 Pounds of Neutralizing Value, Worth 26 Cents at Delivered Ag Lime Prices. It Retails Near $29. In 16 Kentucky Fields, the Calcium Chloride Kind Moved pH No More Than Doing Nothing.Liquid lime costs about $3 per pound of effective calcium carbonate at the retail price we could find, against 2.7 cents for ag lime delivered and spread and 11 to 21 cents for pellets. Calcium chloride carries no neutralizing value at any price. A 5-gallon rate of the true suspension holds what 84 pounds of ag lime holds, about $1.29 worth, and offsets the acidity from 13 pounds of nitrogen. At these prices a low-rate program has to return 10 to 34 bushels of corn an acre, and we found no independent trial showing it moves pH.
- A Corn Tissue Test Costs $31.65 and Needs a Quarter-Bushel an Acre to Pay. A Five-Set Sap Program Needs Three. The Lab Fee Is Not the Hard Part.At 2026 public lab fees, a tissue program runs 79 cents to $2.37 an acre on a 40-acre zone and a season of sap analysis $11 to $14. The fee is small next to two problems: most of the published leaf-test calibration says the result arrives too late, or points the wrong way, to fix the crop it came from, and no North American land-grant trial we found has calibrated commercial leaf-sap numbers against yield in corn or soybeans. When a rescue responds in one field in 18, a sap program on soybeans has to find almost 20 bushels where it is right.
- A Granular Pea Inoculant Needs About 3 Bushels to Pay. On First-Time Pulse Ground, Trials Found 3 to 17. The Nitrogen It Leaves Is Worth $6 to $33 an Acre, Depending on Whose Rule You Use.On fields new to peas and lentils, inoculant is the cheapest yield protection on the Northern Plains and Prairies, and granular earns its premium. On pea or lentil stubble, seed-applied peat or liquid is enough, and chickpeas need their own strain every time. The credit for the next crop runs from 10 lb of N in Montana to 40 lb in North Dakota. At mid-October retail N prices, the gap between those two rules is worth $18 to $22 an acre.
State of the Industry
Last week's column found grain, not fertilizer, moving the input math. This week both moved against the grower: the November ammonia contract jumped, and every major grain fell again.
The Tampa number is now public. Quantum Commodity Intelligence's public headline and lead put the November contract at $640 a tonne CFR, up $95 on the month [1]. Fertilizer Daily, relaying that report, says Yara and Mosaic settled on October 28 [2]. We read only QCI's lead, because the body requires registration. It confirms the $640, and the rise of about $86 a short ton, that this issue's features had to imply, so no published figure changes. One search summary elsewhere gave $645; we could not trace that to any page and do not use it. October's $545 remains implied: $640 less $95.
Nitrogen moved at wholesale first. The Illinois average anhydrous ask rose $33.61 in two weeks to $981.11 [3]. DTN's latest retail survey, October 19–23, held anhydrous at $987 and predates the settlement; UAN28 led it, up $24 on the month [4]. Urea did not follow. CBOT's November Gulf contract showed $440.50 and March was unchanged at $460 [5], and a distributor summary had NOLA barges at $430–440 on October 23 [6]. The pressure is in Europe. TTF traded above €100/MWh on October 28, about $32.50/MMBtu against the $2.93 that LSB Industries reported as its third-quarter gas cost [7].
Phosphate slipped on the screen. The DAP benchmark fell $9 to $793.50 on October 30 after weeks at $802.50 [8][16]. Retail, surveyed before that drop, has DAP at $939 and MAP at $983, each up $13 on the month [4]. Saudi cargoes keep clearing Hormuz for India, where $900–902 CFR offers met indications in the $880s and no sale surfaced in the last week of October [9].
Potash steady, sulfur split. Retail potash is $506, up $8 on the month [4], and the Illinois ask is $517.73 [3]. The China-denominated sulfur benchmark fell another 6.9% from October 26 and is 32% below a month ago [10]. The same distributor summary reports fourth-quarter Tampa sulfur at $615 a long ton CFR, down $90, with Gulf prilled at $830–900 a tonne FOB [6]. We have not found a second public source for the $615.
Grain did the rest. December corn settled at $4.47¾, down 8¼ cents on the week. November soybeans lost 34¼ cents to $12.22¼, and December wheat lost 21½ cents to $6.03½ [11][16]. North-central Illinois elevators bid averages of $4.14 and $11.89 [11]. A ton of anhydrous at DTN's $987 costs about 238 bushels of that corn, against about 235 a week ago (our arithmetic). Crop insurance harvest prices closed at $4.75 for corn and $12.63 for soybeans, above spring's $4.62 and $11.09 [12]. Futures now sit 27¼ and 40¾ cents under those marks (our arithmetic). By October 25, 60% of corn was out against a 66% average, with Iowa at 47% against 67%; soybeans were 79% against 77% [13].
Freight eased, fuel did not. The Illinois River barge rate fell to 731% of tariff, $33.92 a ton, still 21% above a year ago. U.S. diesel rose 7.6 cents to $6.352 [14]. Illinois farm diesel asks eased 5 cents to $5.71 [3].
What to watch. DTN's next survey should be the first to cover the settlement week. Mosaic reports November 3 and CF Industries November 4 [2][15]. Today's Crop Progress was not out as we closed.
| Benchmark | Level | Basis | Move |
|---|---|---|---|
| Anhydrous | $987/ton | Delivered retail, Oct 19–23 | +$10 MoM; +17.2% YoY |
| Urea | $674/ton | Delivered retail, Oct 19–23 | −$1 MoM; +12.7% YoY |
| UAN32 | $486/ton | Delivered retail, Oct 19–23 | +$7 MoM; +4.3% YoY |
| UAN28 | $447/ton | Delivered retail, Oct 19–23 | +$24 MoM; +8.2% YoY |
| 10-34-0 | $705/ton | Delivered retail, Oct 19–23 | +$4 MoM; +5.7% YoY |
| Anhydrous | $981.11/ton | Illinois distributor ask, FOB, wk Oct 30 | +$33.61 vs prior report |
| Ammonia | $640/t | Tampa CFR, November contract settlement | +$95 vs October's implied $545; −$10 vs Nov 2025's $650 |
| Urea | $440.50/st | CBOT U.S. Gulf futures, Nov 2026, last price shown, no recent trades | +$4.00 vs $436.50 prior settle; Mar 2027 at $460.00, unchanged w/w |
| Urea | $449.50/t | Benchmark, Oct 30 | −0.8% w/w; +3.9% m/m |
| Urea | $430–440/st | NOLA barge, FOB, distributor summary, Oct 23 (not a settlement) | −$5 midpoint vs prior week |
| DAP | $939/ton | Delivered retail, Oct 19–23 | +$13 MoM; +1.4% YoY |
| MAP | $983/ton | Delivered retail, Oct 19–23 | +$13 MoM; +5.5% YoY |
| DAP | $793.50/t | Benchmark, Oct 30 | −$9.00 vs Oct 23; −1.1% m/m |
| Potash | $506/ton | Delivered retail, Oct 19–23 | +$8 MoM; +3.9% YoY |
| Potash | $517.73/ton | Illinois distributor ask, FOB, wk Oct 30 | +$2.73 vs prior report |
| Potash | $340–350/st | NOLA barge, FOB, distributor summary, Oct 23 (not a settlement) | −$2.50 midpoint vs prior week |
| Sulfur | 5,224 CNY/t | China-denominated benchmark, Nov 2 | −6.9% vs Oct 26; −32.2% m/m; +60.2% YoY |
| Sulfur | $615/lt | Tampa CFR, Q4 contract, one distributor report, unconfirmed | −$90 vs Q3's $705 |
| Dec corn | $4.47¾/bu | CBOT settlement, Oct 30 | −8¼¢ w/w |
| Nov soybeans | $12.22¼/bu | CBOT settlement, Oct 30 | −34¼¢ w/w |
| Dec Chicago wheat | $6.03½/bu | CBOT settlement, Oct 30 | −21½¢ w/w |
| Corn, cash | $4.14/bu | N-central Illinois elevator avg, Oct 30 | −6¢ w/w; +3.7% YoY |
| Soybeans, cash | $11.89/bu | N-central Illinois elevator avg, Oct 30 | −34¢ w/w; +11.3% YoY |
| U.S. diesel | $6.352/gal | On-highway retail, wk Oct 26 | +7.6¢ w/w; +$2.63 YoY |
| Illinois farm diesel | $5.71/gal | Distributor ask, FOB, wk Oct 30 | −5¢ vs prior report |
| Illinois River barge | 731% of tariff | $33.92/ton, wk Oct 27 | 773% a week earlier; +21% YoY |
| Corn harvested | 60% | 18 states, Oct 25 | 44% a week earlier; 66% five-year avg |
| Soybeans harvested | 79% | 18 states, Oct 25 | 64% a week earlier; 77% five-year avg |
Sources: DTN/Progressive Farmer, Oct 28, 2026 (retail, Oct 19–23; month and year moves computed from the survey's month-ago and year-ago rows); USDA AMS Illinois Production Cost Report, Oct 30, 2026; Quantum Commodity Intelligence, Oct 28, 2026 (public lead only), with the $650 November 2025 level from the same publisher's report of that settlement; Farmbucks quote page for CBOT U.S. Gulf urea futures, accessed Nov 2, 2026 (the page does not label its chain prices as settlements and reads "no recent trades"; the only labelled settlement is November's prior $436.50); Trading Economics, accessed Nov 2, 2026 (urea and DAP, Oct 30; sulfur, Nov 2; moves against last issue's Oct 23 and Oct 26 prints computed by us, month moves as the page states them); Advanced Turf Solutions market summary, Oct 26, 2026 (prices as of Oct 23; asks and reported trades, not settlements; midpoint moves computed by us; we found no newer edition as we closed); USDA AMS Illinois Grain Bids, Oct 30, 2026 (CBOT settlements and cash bids; week moves computed against the Oct 23 figures in our last issue, year moves from the report's year-ago averages); U.S. diesel and barge rates as reported in USDA AMS Grain Transportation Report, Oct 29, 2026; USDA NASS Crop Progress, Oct 26, 2026. Trading Economics' urea print matched the January 2027 CBOT Gulf contract to the cent on Oct 30, so we do not count the two as independent, and the page does not say whether its "T" is a short or a metric ton. We leave out its year moves on urea and DAP because the implied year-ago base shifted sharply between our last two readings.
The week's verdict: the ammonia contract rose $95 a tonne and corn fell 8 cents, so a ton of retail anhydrous costs about 1.4% more corn than a week ago, and no retail survey has yet covered the settlement.
References
- Quantum Commodity Intelligence, "Tampa ammonia increases by $95/mt for November," Oct 28, 2026 (headline and public lead only; body requires registration). https://www.qcintel.com/ammonia/article/tampa-ammonia-increases-by-95-mt-for-november-76238.html
- Fertilizer Daily, "Tampa ammonia jumps $95/t for November in key Yara-Mosaic settlement," Nov 2, 2026, relaying Quantum Commodity Intelligence. https://www.fertilizerdaily.com/20261102-tampa-ammonia-november-2026/ For Mosaic's Nov 3 date: Fertilizer Daily, "Sulfur Above $1,000/t Keeps Mosaic Phosphate Plants Curtailed Ahead of Q3 Results," Oct 29, 2026. https://www.fertilizerdaily.com/20261029-sulfur-above-1000t-keeps-mosaic-phosphate-plants-curtailed-ahead-of-q3-results/
- USDA Agricultural Marketing Service, Illinois Production Cost Report (Bi-weekly), Oct 30, 2026. https://www.ams.usda.gov/mnreports/ams_3195.pdf
- DTN/Progressive Farmer, "Fertilizer Prices Continue to Climb: UAN28 Posts 6% Increase in Latest DTN Survey," Oct 28, 2026. https://www.dtnpf.com/agriculture/web/ag/crops/article/2026/10/28/fertilizer-prices-continue-climb-6
- Farmbucks, "Urea (US Gulf) Futures (CBOT UFV)," accessed Nov 2, 2026. https://farmbucks.com/futures/fertilizer/urea-us-gulf
- Advanced Turf Solutions, "U.S. Fertilizer Market Summary 10/26/2026" (prices as of Oct 23, 2026). https://www.advancedturf.com/wp-content/uploads/2026/10/ATS-Fertilizer-Market-Update-10_26_2026.pdf
- Fertilizer Daily, "TTF gas price tops critical €100/MWh, squeezing Europe's ammonia producers," Nov 2, 2026, citing ICE data via S&P Global, ING and LSB Industries. https://www.fertilizerdaily.com/20261102-ttf-gas-price-100-europe-ammonia/
- Trading Economics, Di-ammonium Phosphate, accessed Nov 2, 2026. https://tradingeconomics.com/commodity/di-ammonium Urea: https://tradingeconomics.com/commodity/urea
- World Fertilizer, "Saudi Arabian phosphates transit Strait of Hormuz," Oct 30, 2026, publishing Argus Media. https://www.worldfertilizer.com/phosphates/30102026/saudi-arabian-phosphates-transit-strait-of-hormuz/
- Trading Economics, Sulfur, accessed Nov 2, 2026. https://tradingeconomics.com/commodity/sulfur
- USDA Agricultural Marketing Service, Illinois Grain Bids, Oct 30, 2026. https://www.ams.usda.gov/mnreports/ams_3192.pdf
- DTN/Progressive Farmer, "Harvest Prices for 2026 Crop Insurance," Oct 30, 2026. https://www.dtnpf.com/agriculture/web/ag/crops/article/2026/10/30/crop-insurance-protection-sticks-4
- USDA National Agricultural Statistics Service, Crop Progress, Oct 26, 2026 (week ending Oct 25). https://release.nass.usda.gov/reports/prog4326.txt
- USDA Agricultural Marketing Service, Grain Transportation Report, Oct 29, 2026. https://ams-prod.azureedge.us/sites/default/files/media/GTR10292026.pdf
- CF Industries, notice confirming third-quarter results dates, Oct 7, 2026, via Finviz. https://finviz.com/news/400084/cf-industries-holdings-inc-declares-quarterly-dividend-and-confirms-dates-for-third-quarter-2026-results-and-conference-call
- Crop Root Zone, RZ-015, "State of the Industry" (Oct 23 CBOT settlements, cash bids and benchmark prints, and the prior week's anhydrous-to-corn ratio, with their original sources).
Weekly Briefing
Fertilizer
November Tampa ammonia settles $95 higher at $640 — The contract rose to $640 a tonne CFR, and Fertilizer Daily reports Yara and Mosaic settled it on October 28. September was $555, and October's level is implied at $545. We read only the public lead of the original report; the body requires registration. (Quantum Commodity Intelligence, Oct 28, 2026; Fertilizer Daily, Nov 2, 2026)
USDA picks eight fertilizer projects for $573 million — The FIELDS grants back more than $1.34 billion of investment and about 1.08 million tons of annual capacity, including Intrepid Potash's sulfate of potash plant near Carlsbad, PCI Nitrogen, AdvanSix and Peace Valley. USDA's own analysis says nitrogen prices could fall 4.4% and potash 5.3% once the projects operate. That is the agency's estimate, and the report gives no in-service dates. (DTN, Oct 22, 2026)
Saudi phosphate keeps clearing Hormuz for India — The Panamax Breeze left with about 55,000 tonnes loaded at Ras Al-Khair on October 23–24, after three DAP cargoes earlier in the month. Saudi DAP offers stood at $900–902 CFR against Indian indications in the $880s, and no sale surfaced in the final week of October. A separate tracker relayed by Fertilizer Daily still showed fertilizer shipments through the strait near zero, so the count depends on the source. (World Fertilizer, publishing Argus Media, Oct 30, 2026; Fertilizer Daily, Oct 29, 2026)
Corn groups press the White House on fertilizer antitrust — Iowa, Ohio and Texas growers' associations wrote that fertilizer costs are eroding the value of the $8 billion fuel aid, and asked the administration to back an FTC enforcement action. The letter says Iowa farmers were quoted anhydrous $150 a ton above mid-September; DTN's national average rose $42 from mid-September to mid-October. (DTN, Oct 27, 2026)
Crops
Harvest prices beat spring for corn and soybeans — The October averages came in at $4.75 for corn and $12.63 for soybeans, against spring prices of $4.62 and $11.09. Revenue Protection guarantees on about 88.7 million corn acres and 80.4 million soybean acres use the higher price, for corn the first time since 2022 and for soybeans since 2021. (DTN, Oct 30, 2026)
45Z premiums start with a nutrient budget before application — To claim a lower carbon score on the 2027 crop, a field needs a nutrient budget completed before fall fertilizer goes on, with soil tests from the past 24 months and manure tested this fall. Some ethanol plants are detailing premiums from a few cents to 75 cents a bushel, but the credit goes to the biofuel producer, and farmers see it only if that producer chooses to share it. (DTN, Oct 28, 2026)
Corn harvest reaches 60%, Iowa 20 points behind — By October 25, 60% of corn and 79% of soybeans were out across 18 states, against averages of 66% and 77%. Iowa was at 47% against 67%, and Illinois at 74% against 73%. Winter wheat was 76% planted against 77%. The November 2 report was not out as we closed. (USDA NASS, Oct 26, 2026)
Brazil's soybean cost edge is land, not inputs — Typical-farm data for 2020–2024 put total cost at $616 an acre in the U.S. and $416 in Brazil, with overhead, mainly land, at $251 against $97. Brazil spent more on fertilizer, $85 against $57, and on pesticides, $81 against $56. The sample is five U.S. and four Brazilian farms. (farmdoc daily, Nov 2, 2026)
Home & Garden
Pincushion proteas that bloom near sea level — University of Hawaiʻi breeders have registered 18 hybrids that flower in warm coastal conditions, where commercial protea was once limited to 2,500 to 4,000 feet. More than 11,000 plants have gone to 33 Big Island farms, and the team is working with container growers to reach home gardens. Mainland gardeners should not expect them soon: this is a Hawaiʻi program so far. (University of Hawaiʻi at Mānoa, via Phys.org, Oct 29, 2026)
That orchid label may not tell you much — A Florida International University study finds wild-collected orchids are sometimes relabeled as nursery-propagated, and that a CITES permit does not show which one a plant is. Online sales are especially hard to trace. The paper offers no buying checklist, and it counts 26 endangered Southeast Asian species with no conservation measures in place. (Biodiversity and Conservation, via Phys.org, Oct 29, 2026)
The last jobs before the ground freezes — Utah State's fall list, written for its climate, has garlic cloves going in from mid-October through early November, spring bulbs through early November, and winter squash stored at 50–55°F. Dahlias and gladiolas come up after the foliage dies back and keep at 45–50°F. Check your local frost dates before copying the calendar. (Utah State University, Oct 5, 2026)
Micronutrients
Manganese-loaded biochar cuts paddy N2O 89%, in the lab — Chinese Academy of Sciences researchers loaded wheat-straw biochar with manganese and incubated it in one paddy soil. Cumulative N2O fell from 17.6 to 1.9 mg N per kg of soil, and more nitrate went to ammonium instead of being lost. Laboratory only: no field trial, application rate or production cost has been reported. (Biochar, via Fertilizer Daily, Oct 28, 2026)
An Illinois sulfur fertilizer line wins federal backing — SUL4R-PLUS Illinois was selected for $34.9 million of a $69.7 million project at Marissa, supporting about 100,000 tons a year of sulfur fertilizer. It is a grant selection, not a running plant. (DTN, Oct 22, 2026)
Sulfur prints still point in different directions — The China-denominated benchmark fell to 5,224 yuan a tonne on November 2, 32% below a month earlier. One distributor summary reports the fourth-quarter Tampa contract at $615 a long ton, which we cannot confirm from a second source, and Gulf prilled at $830–900 a tonne FOB. A Mosaic executive, relayed by Fertilizer Daily, put sulfur well above $1,000 a ton, without stating a basis. (Trading Economics, Nov 2, 2026; Advanced Turf Solutions, Oct 26, 2026; Fertilizer Daily, Oct 29, 2026)
Organics
Federal grants reach by-product and manure fertilizer — True Organic Products was selected for $15.3 million of a $30.6 million project making about 142,805 tons a year from agricultural by-products in California, Oregon and Arizona. Agriculture Project Holdco was selected for $116.9 million of a $360 million project turning dairy manure into about 4,100 tons of liquid ammonium nitrate, or about $87,800 of project cost per annual ton (our arithmetic; the report lists no other outputs). Selections, not operating plants. (DTN, Oct 22, 2026)
Seaweed biostimulant maker Afrikelp changes hands — Spain's SAS Group bought a majority stake in the South African producer, which makes extracts from Ecklonia maxima kelp and sells into more than 55 markets. Terms were not disclosed. It is SAS's sixth acquisition since 2023, and the deal includes an exclusive harvesting concession. (Fertilizer Daily, Oct 28, 2026, citing New AG International)
USDA's conservation round includes 300,000 Iowa cover-crop acres — The $325 million round funds 42 Regional Conservation Partnership Program projects. The Iowa project targets more than 300,000 acres of cover crops, with estimated cuts of about 3.3 million pounds of nitrogen losses and 336,000 pounds of phosphorus losses. It is not an organic program, and the loss numbers are project estimates, not measurements. (Fertilizer Daily, Oct 27, 2026, citing USDA)
Up and Coming
TalusAg gets federal money for modular ammonia — USDA selected the company for $99.8 million toward a $270.2 million plan for 20 modular units at 11 sites in seven Midwest and Southern states, producing about 130,000 tons of anhydrous a year. That works out to about $2,080 of project cost per annual ton (our arithmetic). Early-stage: this is a grant selection, and the report gives no operating dates or delivered cost. (DTN, Oct 22, 2026)
Alfalfa drew potassium that soil tests did not count — A 13-month Israeli greenhouse study found plants took up two to nearly four times the potassium that standard available-K measures and natural inputs could explain, with 50% to 74% of unfertilized uptake coming from non-exchangeable reserves. Greenhouse only: three soils, one crop. The authors say field trials must come before any change to recommendations, and those reserves are finite. (Plant and Soil, via Hebrew University release on EurekAlert, Nov 2, 2026)
Nitrogen-enriched biochar nanoparticles lift soybean grain numbers — Hebei University of Technology researchers applied corn-stalk biochar particles made with labeled urea at 5 mg per kg of soil and report 35% to 45% more grains than untreated plants. Very early: greenhouse work, with no evaluation of long-term safety, application method or field performance. (Sustainable Carbon Materials, via EurekAlert, Oct 30, 2026)
Interesting
Banks wrote more farm loans for far less money — Non-real-estate farm loan volume fell 25% year on year in the third quarter to $56.47 billion, even as the number of loans rose 11.1%. Average size fell 32.5% to about $81,300. Machinery loan maturities fell from 53.9 months to 29.3. (farmdoc daily, Oct 29, 2026, using Federal Reserve survey data)
Port fees on China-linked ships may stay suspended — USTR has proposed extending the suspension of its Section 301 fees through January 9, 2027, with comments due October 30. If reinstated, Chinese-operated vessels would pay $50 per net ton. Chinese-built bulkers under 80,000 deadweight tons or arriving empty would not incur a fee. (USDA AMS Grain Transportation Report, Oct 29, 2026)
Your oatmeal now costs more per railcar — The U.S. relies almost entirely on Canada for oats, and the railroads have updated their tariffs. BNSF adds $200 a car from November 1, Canadian Pacific Kansas City raised rates $210 to $215 in October, and Canadian National raised them $225 in September. (USDA AMS Grain Transportation Report, Oct 29, 2026)
Off the Wall Discovery
Sugarbag bee honey stopped every bacterium tested — University of Sydney researchers tested honey and propolis from an Australian stingless bee against 16 pathogens. The honey inhibited all the bacteria, including hard-to-treat hospital species, at a potency comparable to medical-grade Manuka, and known compounds did not explain it. Lab dishes only: no human trials, and the active compounds have not been identified. (PLOS ONE, via Phys.org, Oct 27, 2026)
Wild tomatoes defend themselves with a mirror-image molecule — A team working in Shanghai and São Paulo compared two near-identical leaf compounds, one common in wild tomatoes and one in cultivated ones. The wild form protected better against tomato leafminer in artificial-diet tests, though not against tobacco cutworm. Unproven in the field: the lead author calls the evidence correlational, only two pests were tested, and no commercial tomato has been modified. (Nature Communications, via FAPESP release on EurekAlert, Oct 28, 2026)
Fall Anhydrous Is 20 Cents a Pound of N Under Spring UAN28. After the Knife, the Inhibitor and the Interest, It Can Give Up 17 Pounds an Acre. Trials Put the Fall Cost at 10 to 23.
At DTN's $987 anhydrous and $447 UAN28, a stabilized fall pass keeps $11.93 of a $34.50 nitrogen spread on 176 pounds. That buys 17 extra pounds, or 8.8% of the fall nitrogen. Against UAN32 it buys 7, and against urea it buys none. At a 20-pound agronomic gap the walk-away price against flat UAN28 is $970, under today's retail average. Iowa soils were still 51 to 63°F on October 27 with 47% of the corn out, so the window opens later and shorter than the discount needs.
Retail anhydrous averaged $987 a ton in the week of October 19–23, or $0.60 a pound of nitrogen. UAN28 was $0.80, UAN32 $0.76 and urea $0.73 (DTN/Progressive Farmer, Oct 28, 2026) [1]. On the pound, fall ammonia looks 18% to 25% cheaper than the spring products a grower would otherwise buy. That is not the number that decides the 2027 nitrogen plan. Charge the fall acre its knife pass, its inhibitor and its interest, and the edge against UAN28 is $11.93 an acre at today's prices. That pays for 17 extra pounds of fall nitrogen, and trials put the extra need at 10 to 23. Meanwhile the November Tampa contract has gone up, Iowa's soils have not cooled, and Iowa's combines are running behind. This piece works out how much loss the discount can absorb, and what has to be true for fall to beat spring.
1. What the discount is before the pass, and after
What's new: Anhydrous held at $987 for a second survey (DTN/Progressive Farmer, Oct 21, 2026) [2], while UAN28 rose 6% in a month to $447 [1]. The spread over UAN28 is now 19.6 cents a pound of nitrogen. Applied to a 176-pound spring program, that is $34.50 an acre.
Evidence: The simplest break-even divides one pound price by the other. It says how much fall nitrogen can disappear before the survivor costs as much as the spring pound.
| Product, Oct 19–23 | $/ton | $/lb N | Over anhydrous, ¢/lb N | Pound-only loss allowance | |
|---|---|---|---|---|---|
| Anhydrous | 987 | 0.60 | — | — | |
| UAN28 | 447 | 0.80 | 19.6* | 24.6%* | ██████████ |
| UAN32 | 486 | 0.76 | 15.8* | 20.7%* | ████████░░ |
| Urea | 674 | 0.73 | 13.1* | 17.9%* | ███████░░░ |
Source: DTN/Progressive Farmer, Oct 28, 2026 [1]. Basis: delivered national retail. *Crop Root Zone calculation at 1,640, 560, 640 and 920 lb N per ton. Bars scale to 24.6% at ten blocks.
That allowance overstates the case, because the two programs do not cost the same to put on. The table below loads each one for a corn-after-soybeans rate of 176 pounds, the spring optimum in the Illinois trials used in Section 2.
| $/acre at 176 lb N | Fall anhydrous, stabilized | Spring UAN28 | Spring UAN32 | Spring urea |
|---|---|---|---|---|
| Nitrogen at today's retail | 105.92* | 140.49* | 133.65* | 128.94* |
| Nitrification inhibitor, about 8¢/lb N | 14.08* | — | — | — |
| Interest, 7%, November to April | 3.50* | — | — | — |
| Custom application | 15.55 | 10.50 | 10.50 | 7.30 |
| Total | 139.05* | 150.99* | 144.15* | 136.24* |
| Fall's edge | +11.93* | +5.10* | −2.81* |
Source: DTN, Oct 28, 2026 [1]; Iowa State custom survey rates of $15.55 for anhydrous with toolbar (2026, via TRZ-0232 [6]), $10.50 for a self-propelled sprayer (2026, Strip-Till Farmer, Jun 5, 2026 [7]) and $7.30 for dry bulk spreading (2025, No-Till Farmer, Apr 21, 2025 [8]); inhibitor cost from TRZ-0075 [9]; 7% operating money from TRZ-0254 [10]. *Crop Root Zone calculation. The survey rates predate this year's diesel, and TRZ-0232 puts the anhydrous pass near $17 at September diesel. No urease inhibitor is charged to urea, which flatters urea. UAN applied with a herbicide pass would owe less than a full spray charge, which also flatters spring.
The 8 cents is the softest line in the table, because we carry it from our own earlier work and could not source a current public retail price for an inhibitor. It also matters. More than two-thirds of Iowa farmers already use an inhibitor with fall ammonia, and Iowa State advises it this year (Iowa State University, Sep 10, 2026) [22]. Roth and Wuestenberg advise the same (Iowa State via Strip-Till Farmer, Oct 31, 2026) [5].
$11.93 an acre
What is left of a $34.50 fall anhydrous spread over spring UAN28 once the pass, the inhibitor and the interest are paid. It is the amount available to cover every pound fall loses. (Crop Root Zone calculation from DTN, Oct 28, 2026, and the costs above)
2. How much loss that money buys, and how much fall costs
What's new: Divide the edge by what a pound of stabilized fall nitrogen costs, about 70 cents after interest, and the edge becomes pounds of extra nitrogen. The comparison below uses extra pounds as the common measure of loss. That is a conversion and not a field measurement.
Evidence: On national retail, the allowance is 17 pounds against UAN28 and 7 against UAN32, and it is gone against urea. USDA's distributor asks show a wider spread. Those asks were $981.11 for anhydrous in Illinois and $902.33 in Iowa, F.O.B., on small samples (USDA AMS, Oct 30, 2026) [11][12]. They are not retail and leave out delivery, but they indicate that the national average may understate the edge in the heart of the Corn Belt.
| Fall's allowance over a flat spring price | Stabilized, lb N/acre | Share of fall N | No inhibitor, lb N/acre | Share of fall N | |
|---|---|---|---|---|---|
| Iowa asks, vs. UAN32 at $510 | 32* | 15.6%* | 63* | 26.3%* | ██████████ |
| Illinois asks, vs. UAN28 at $467.86 | 27* | 13.5%* | 55* | 23.7%* | ████████░░ |
| Illinois asks, vs. urea at $770 | 23* | 11.7%* | 50* | 22.1%* | ███████░░░ |
| DTN retail, vs. UAN28 | 17* | 8.8%* | 43* | 19.5%* | █████░░░░░ |
| DTN retail, vs. UAN32 | 7* | 4.0%* | 32* | 15.2%* | ██░░░░░░░░ |
| DTN retail, vs. urea | none* | none* | 19* | 9.7%* | ░░░░░░░░░░ |
Source: DTN, Oct 28, 2026 [1]; USDA AMS, Oct 30, 2026 [11][12]; costs as in Section 1. *Crop Root Zone estimates at 176 lb N spring. Bars show the stabilized allowance, scaled to 32 lb at ten blocks. The no-inhibitor columns assume the rate gap does not change when the inhibitor is removed, and in a warm fall that is unlikely.
The trials give the other side of the ledger. All of them compare fall anhydrous with spring anhydrous, so they measure timing without form.
| Trial set | Fall optimum, lb N/acre | Spring optimum, lb N/acre | Gap | Gap as share of fall N | |
|---|---|---|---|---|---|
| Illinois on-farm, 16 trials, 2014–18 | 186 | 176 | 10 | 5.4%* | █░░░░░░░░░ |
| Illinois Extension summary, 2026 | not stated | not stated | 16–20 | 8–10%* | ███░░░░░░░ |
| 19 central Illinois sites, 2013–20 | 190* | 167* | 23* | 12.2%* | ███░░░░░░░ |
| One 2017 river-bottom trial, dropped as an outlier | 193 | 125 | 68 | 35.2%* | ██████████ |
Source: Nafziger, farmdoc, Sep 30, 2020 [13]; Curry, Haverback and Zwilling, Illinois Extension, Sep 28, 2026 [14]; Link, M.S. thesis, University of Illinois, 2025 [15]. *Crop Root Zone conversion from 213 and 187 kg N/ha, or calculation, with the Extension range put on a 176-lb spring base. We read the thesis abstract as indexed and not its full text. Bars scale to 68 lb at ten blocks.
The trials put fall's cost at about 5% to 12% of the nitrogen in ordinary years, with yields nearly equal. The 2014–18 set made 235 bushels on fall against 236 on spring [13], and the 19-site set was level [15]. A one-bushel penalty is worth $4.48 at Friday's $4.47¾ December corn (Barchart, Oct 30, 2026) [19], or about 6 pounds of the 17. We found no public December 2027 quote to use in its place.
Neither Illinois paper is a loss study, and the 2014–18 article does not say whether its fall treatments carried an inhibitor [13]. Older Minnesota work is plainer. On a tile-drained clay loam at 134 kg N/ha, or about 120 pounds, six-year yields were 161 bushels for fall without nitrapyrin, 171 for fall with it and 172 for spring without it, and apparent N recovery ran from 47% to 61% (Randall and Vetsch, 2005) [17]. In a later Minnesota study, fall needed a higher rate than spring even with nitrapyrin (Vetsch, Randall and Fernández, 2019) [18]. Illinois's Dan Schaefer said this fall that Douglas County trials found fall application leakier even with inhibitors (Oklahoma Farm Report, Oct 27, 2026) [16].
There is one point in fall's favor that these tables miss. Spring UAN and urea are not loss-free, and Nafziger notes UAN's nitrate can be lost and surface urea can volatilize [13]. The 10-to-23 range is measured against knifed spring ammonia, so a fall pass may give up somewhat less against a surface-applied spring product. We found no trial that isolates this.
Ground Truth: The 17-pound allowance sits inside the 10-to-23-pound range, so against UAN28 at today's prices fall ammonia is close to a wash and not a discount. The two other comparisons are not close: on national retail, a grower whose spring alternative is UAN32 falls short of even the bottom of the range, and one whose alternative is urea starts behind. Much of the published spread is the difference between ammonia and other forms. A grower who can run a knife in April keeps that difference without taking the timing risk at all.
3. The window: warm ground and a late Iowa combine
What's new: In September we wrote that the combine would finish early (TRZ-0183, Sep 10, 2026) [21]. That was based on August crop stages, and it has not held. Corn was 60% harvested on October 25 against a 66% average (USDA NASS, Oct 26, 2026) [4][20]. The next report is due this afternoon and is not reflected here.
Evidence: The lag is largest in the western Corn Belt. Michigan and Ohio are also behind, at 28% against 43% and 35% against 46% [4]. Illinois and Indiana are on pace, and their topsoil is short.
| State, Oct 25 | Corn harvested | 5-yr avg | Gap, pts | Topsoil short or very short | Topsoil surplus | |
|---|---|---|---|---|---|---|
| Iowa | 47% | 67% | −20* | 6% | 13% | ██████████ |
| South Dakota | 44% | 62% | −18* | 47% | 2% | █████████░ |
| Nebraska | 55% | 64% | −9* | 25% | 10% | ████░░░░░░ |
| Minnesota | 65% | 71% | −6* | 27% | 4% | ███░░░░░░░ |
| Illinois | 74% | 73% | +1* | 44% | 4% | ░░░░░░░░░░ |
| Indiana | 61% | 59% | +2* | 42% | 2% | ░░░░░░░░░░ |
Source: USDA NASS, Crop Progress, Oct 26, 2026 [4]. *Crop Root Zone calculation. Bars show points behind average, scaled to 20 at ten blocks. The five-year average includes imputed 2025 values because of canceled reports.
Iowa took 21 points in the last reported week, with 6.4 days suitable for fieldwork [4]. At that pace, which is our estimate and not a forecast, its corn would be out around November 12. That is close to the typical cooling dates below, so the usual wait between combine and cold field shrinks unless the later El Niño dates arrive. Iowa's 4-inch soils were mostly 51 to 63°F on October 27 (Roth and Wuestenberg, Oct 31, 2026) [5].
| Iowa, 4-inch soil | Typical last day above 50°F | If 10 to 15 days later |
|---|---|---|
| North | Nov 6 | Nov 16–21* |
| Central | Nov 8–10 | Nov 18–25* |
| South | Nov 12–14 | Nov 22–29* |
Source: Roth and Wuestenberg, Iowa State via Strip-Till Farmer, Oct 31, 2026 [5]; shift from Castellano et al., Iowa State, Sep 10, 2026 [22], who tie it to a very strong El Niño. *Crop Root Zone arithmetic. The shift is an outlook, not a measurement.
Three findings in that Iowa State work affect the money directly.
- The first cold day means little. After the first day below 50°F, soils warmed back above 50°F in 94% of station-years, a median of 19 days later. After five straight days below 50°F, they rebounded in two of three station-years [5].
- 50°F does not stop the clock. Iowa State now says ammonium still converts at about a third of its maximum rate at 50°F [5]. TRZ-0183 used about 10%, and we take the current language as the better guide.
- The record can run late. Statewide median last days above 50°F ranged from October 21 in 2019 to November 20 in 2020 and 2024 [5]. A Rochester, Minnesota forecast of October 29 cited a Climate Prediction Center November outlook for warm and slightly dry (KTTC, Oct 29, 2026) [23].
The nitrate that forms before freeze-up is exposed in spring rather than winter. In the Minnesota tile work, about 71% of drainage came from April through June and under 1% from November through March [18]. Schaefer's marker is March 1, by which October-applied nitrogen could be almost entirely nitrate [16].
Illinois has its own version. Extension puts the northern two-thirds at the 50°F mark in late October into early November in many years [14], and the Illinois Agronomy Handbook rules out fall nitrogen for corn south of about Route 16 [24]. We found no public November 2026 Illinois readings, so we do not state a current date for that state. With 44% of Illinois topsoil short or very short [4], sealing the slot is a question of its own there.
Ground Truth: Warm soil is usually discussed as an agronomy risk. At these prices it is mainly a budget risk. A grower with 17 pounds to spend cannot afford to spend them in the first warm week. Nafziger's view that fall losses stay modest is conditioned on following the 50°F guideline [13], so the 10-to-23 range should not be assumed for an early pass. In a late Iowa fall the retailer's rigs, the end of harvest and the 50°F mark may all arrive in the same two weeks. Expect pressure to go early. A grower who cannot get a truly cold slot is better served by moving that field to spring than by adding product to it.
4. What the spring price has to do
What's new: Everything above holds spring flat, and spring has not been flat. Each 10% on UAN28 moves the allowance by about 20 pounds. The November Tampa contract moves it from the other side: a reported settlement of $645 a tonne CFR, up $95 (Australian Fertilizer Corporation via HortiDaily, Nov 2, 2026) [3], is about $86 a short ton. Passed through 1:1, the rate that rests on two recent falls (TRZ-0238, Sep 29, 2026) [36], retail would be about $1,073 and the allowance against flat UAN28 about 3 pounds.
Evidence: Four seasons, charged at this year's pass, inhibitor and interest costs so that only the prices differ:
| Season | Autumn anhydrous, $/ton | $/lb N | Next-April UAN28, $/ton | $/lb N | Spread, ¢ | Allowance, lb N | Anhydrous, autumn to April |
|---|---|---|---|---|---|---|---|
| 2022/23 | 1,434 | 0.87 | 423 | 0.76 | −12* | −46* | −31%* |
| 2023/24 | 825 | 0.50 | 364 | 0.65 | +15* | +6* | −4%* |
| 2024/25 | 718 | 0.44 | 380 | 0.68 | +24* | +39* | +9%* |
| 2025/26 | 858 | 0.52 | 520 | 0.93 | +41* | +79* | +30%* |
| 2026/27, spring flat | 987 | 0.60 | 447 | 0.80 | +20* | +17* | — |
Source: DTN retail surveys of Nov 7–11, 2022 [26]; Oct 23–27, 2023 [27]; Nov 18–22, 2024 [28]; Nov 3–7, 2025 [29]; Apr 17–21, 2023 [30]; Apr 15–19, 2024 [31]; April 2025 [32]; Apr 13–17, 2026 [33]; Oct 19–23, 2026 [1]. Autumn weeks are each season's high as selected in TRZ-0222 [25], close to what a grower pricing at application paid. *Crop Root Zone calculation. A grower who booked earlier paid less: see TRZ-0222.
Against the 10-to-23-pound range, the fall pass cleared in two seasons of four. The two it cleared were the ones in which spring UAN28 rose 18% and 26% from autumn. It fell short when spring was flat and when it fell.
Public evidence on next spring is thin. The Gulf urea curve shows April at $456 a short ton against November at $440.50, a slope of $15.50, on a page reporting no recent trades in the prompt contract (Farmbucks, Oct 30, 2026) [34]. Added to retail urea, that gives about $690, and the stabilized allowance against urea moves from none to about zero. The same curve under-called the last two springs by $74 and $105 (TRZ-0226) [35]. We found no public UAN curve.
The harder comparison is spring anhydrous. Here the form discount drops out and only timing remains.
| Agronomic gap, lb N/acre | Fall price at which flat UAN28 ($447) matches | Flat UAN32 ($486) | Flat urea ($674) | Spring anhydrous needed to match $987 fall, stabilized | Same, no inhibitor |
|---|---|---|---|---|---|
| 0 | 1,095* | 1,033* | 962* | 1,151* (+17%) | 1,016* (+3%) |
| 10 | 1,029* | 971* | 903* | 1,216* (+23%) | 1,074* (+9%) |
| 20 | 970* | 914* | 850* | 1,282* (+30%) | 1,131* (+15%) |
| 23 | 953* | 899* | 835* | 1,301* (+32%) | 1,149* (+16%) |
Source: Crop Root Zone estimates, $/ton, from DTN, Oct 28, 2026 [1], and the costs in Section 1. Anhydrous is assumed applied by the same pass in both seasons, with no inhibitor charged in spring and no interest on spring purchases.
On the same method as our September piece, which leaves out inhibitor and interest and charges one bushel, the hurdle moves from $1,041 to about $1,085, or +9.9% on a higher fall price [25]. Anhydrous moved −31%, −4%, +9% and +30% between these autumn and April surveys. A stabilized fall pass priced at application needs the last of those.
What the fall price can do for a buyer is larger than most of this. Illinois's asks ran from $850 to $1,060 this fortnight [11]. That $210 is worth about $23 an acre, or about 33 pounds of allowance, on the same calculation. That is more than the entire trial range.
Ground Truth: Fall ammonia in 2026 is no longer a bet on the discount. It is a bet that spring liquid nitrogen rises, placed at a time when retail anhydrous is already up $145 on the year [1] and the Tampa increase has not yet reached the national survey. It can still be a good bet, since the two seasons it paid were recent and urea's curve has been low. But it should be sized as a bet. The other reason to run fall ammonia is capacity, and that may be worth paying for. It has a real value on a farm that cannot cover its acres in April, but it is a logistics decision and should be priced as one.
5. What to do with it, and what to watch
What's new: A grower can reduce all of this to a walk-away price, which is more usable than a view on spring. At a 20-pound gap, the top of Illinois Extension's current range, $970 delivered is where stabilized fall anhydrous matches UAN28 at today's $447 [1]. DTN's average is $17 over that line. Iowa's average ask of $902 is under it, though that is an F.O.B. figure [12].
Evidence: The decision sorts by what the spring alternative actually is.
| If the spring alternative is | Fall anhydrous at $987 | Read |
|---|---|---|
| Knifed spring anhydrous | Needs spring near +23% to +32% | Fall only for capacity, or for a price well under the local market |
| Surface or weed-and-feed UAN28 | Roughly a wash | Fall on the best-drained, coldest fields, at or under about $970 |
| UAN32 | Falls 3 to 16 lb short on the trial range | Fall only under about $914 at a 20-lb gap |
| Urea | Behind before any loss | Fall only under about $850 at a 20-lb gap, or for capacity |
Source: Crop Root Zone estimates, as in Sections 2 and 4. Rates, soils and local prices will change these lines. Fields prone to wetness or leaching are outside the trial ranges above.
Splitting the program also cuts exposure to both risks, and Iowa State lists it among the options for this fall [5]. We did not price a split here, because it adds a second pass and we have no trial set that isolates it at these rates.
What to watch next:
- The DTN survey due this week. It is the first that could reflect the November Tampa price. Each $25 a ton on retail anhydrous takes about 4 pounds off the allowance.
- UAN28 against anhydrous. The 6% monthly rise in UAN28 did more for fall's edge than anything in the anhydrous price [1]. A pullback would remove it quickly.
- This afternoon's Crop Progress. Iowa, South Dakota and Nebraska are where the combine and the 50°F mark may converge.
- Iowa Environmental Mesonet and Illinois WARM 4-inch maps with the 6-to-10-day forecast. The trigger is 50°F and falling with a forecast that holds it there, not a calendar date [5][22].
- Quote spread. With a $210 range in one state's asks [11], a second and third quote is worth more than a better estimate of the trial gap.
References
- DTN/Progressive Farmer, T. Neeley, "Fertilizer Prices Continue to Climb: UAN28 Posts 6% Increase in Latest DTN Survey," Oct 28, 2026 (survey Oct 19–23, 2026). https://www.dtnpf.com/agriculture/web/ag/crops/article/2026/10/28/fertilizer-prices-continue-climb-6
- DTN/Progressive Farmer, DTN Retail Fertilizer Trends, Oct 21, 2026 (survey Oct 12–16, 2026). https://www.dtnpf.com/agriculture/web/ag/crops/article/2026/10/21/uan32-uan28-anhydrous-lead-prices
- HortiDaily, "Energy costs drive ammonia higher as weak demand pressures other fertilizer markets," Nov 2, 2026 (Australian Fertilizer Corporation commentary: November Tampa at $645/t CFR, up $95). https://www.hortidaily.com/article/9888212/energy-costs-drive-ammonia-higher-as-weak-demand-pressures-other-fertilizer-markets/
- USDA NASS, Crop Progress, released Oct 26, 2026 (corn harvested, days suitable, topsoil moisture, week ending Oct 25). https://www.nass.usda.gov/Publications/Todays_Reports/reports/prog4326.pdf
- R. Roth and M. Wuestenberg, Iowa State University Integrated Crop Management News, via Strip-Till Farmer, "Facing Down a Very Strong El Niño: It's Not Time for Fall Nitrogen Yet," Oct 31, 2026. https://www.striptillfarmer.com/articles/6962-facing-down-a-very-strong-el-nino-its-not-time-for-fall-nitrogen-yet
- Crop Root Zone, TRZ-0232, "Hiring an Iowa Anhydrous Pass Costs About $17 an Acre at Today's Diesel," Sep 25, 2026 (Iowa State AgDM A3-10, 2026 survey).
- Strip-Till Farmer, "Higher Diesel Prices, Higher Custom Rates," Jun 5, 2026 (2026 Iowa survey, self-propelled sprayer). https://www.striptillfarmer.com/articles/6701-higher-diesel-prices-higher-custom-rates
- No-Till Farmer, "Iowa's Average Custom No-Till Rate Increases by 65 Cents in 2025," Apr 21, 2025 (dry bulk application). https://www.no-tillfarmer.com/articles/14239-iowas-average-custom-no-till-rate-increases-by-65-cents-in-2025
- Crop Root Zone, TRZ-0075, "A Nitrogen Stabilizer Costs 8 Cents a Pound. Anhydrous Nitrogen Costs 59. Do That Division.," Aug 7, 2026.
- Crop Root Zone, TRZ-0254, "A $675 Urea Prepay Costs $25.50 a Ton in Interest by April," Oct 5, 2026 (7% operating money).
- USDA AMS, Illinois Production Cost Report (Bi-weekly), Oct 30, 2026. https://www.ams.usda.gov/mnreports/ams_3195.pdf
- USDA AMS, Iowa Production Cost Report (Bi-Weekly), Oct 30, 2026. https://www.ams.usda.gov/mnreports/ams_2863.pdf
- E. Nafziger, "Is Fall a Good Time to Apply Nitrogen?", University of Illinois, farmdoc, Sep 30, 2020. https://farmdoc.illinois.edu/field-crop-production/is-fall-a-good-time-to-apply-nitrogen.html
- R. Curry, N. Haverback and L. Zwilling, "Making Every Nutrient Count," University of Illinois Extension, Sep 28, 2026. https://extension.illinois.edu/blogs/nutrient-loss-reduction/2026-09-28-making-every-nutrient-count-fall-fertilizer-decisions-productivity-profitability-and-water-quality
- B. Link, "Effects of Anhydrous Ammonia Application Timing on Corn Yield and Profitability," M.S. thesis, University of Illinois Urbana-Champaign, 2025 (abstract as indexed). https://www.ideals.illinois.edu/items/137007
- Oklahoma Farm Report, "Managing Fall Nitrogen: Why Soil Temperature, Application Timing, and Economic Rates Matter for Profitability," Oct 27, 2026. https://www.oklahomafarmreport.com/2026/10/27/managing-fall-nitrogen-why-soil-temperature-application-timing-and-economic-rates-matter-for-profitability/
- G. Randall and J. Vetsch, "Corn Production on a Subsurface-Drained Mollisol as Affected by Time of Nitrogen Application and Nitrapyrin," Agronomy Journal 97:472–478, 2005 (abstract as indexed). https://agris.fao.org/search/en/records/65e00a957c7033e84befe94e
- J. Vetsch, G. Randall and F. Fernández, "Nitrate Loss in Subsurface Drainage from a Corn–Soybean Rotation as Affected by Nitrogen Rate and Nitrapyrin," Journal of Environmental Quality 48(4):988–994, 2019. https://experts.umn.edu/en/publications/nitrate-loss-in-subsurface-drainage-from-a-corn-soybean-rotation-/
- Barchart via TradingView, "Corn Fades Lower on Friday," Oct 30, 2026. https://www.tradingview.com/news/barchart:29e49f9e2094b:0-corn-fades-lower-on-friday/
- DTN/Progressive Farmer, "USDA Weekly Crop Progress Report," Oct 26, 2026. https://www.dtnpf.com/agriculture/web/ag/news/article/2026/10/26/usda-crop-progress-corn-60-harvested
- Crop Root Zone, TRZ-0183, "The Combine Will Be Done Early This Year. The Soil Will Not Be Cold Early.," Sep 10, 2026.
- M. Castellano, D. Andersen, S. Archontoulis and M. Baum, "Fifty and Falling: What the Super El Niño Means for Anhydrous Ammonia and Manure Timing this Fall," Iowa State University Integrated Crop Management, Sep 10, 2026. https://crops.extension.iastate.edu/post/fifty-and-falling-what-super-el-nino-means-anhydrous-ammonia-and-manure-timing-fall
- KTTC, "A mild, unsettled pattern is ahead next week," Oct 29, 2026. https://www.kttc.com/2026/10/29/mild-unsettled-pattern-is-ahead-next-week/
- Illinois Agronomy Handbook, fall nitrogen timing excerpt, via Illinois Fertilizer & Chemical Association. https://www.ifca.com/files/Fall%20N%20Timing%20Illinois%20Agronomy%20Handbook.pdf
- Crop Root Zone, TRZ-0222, "September Anhydrous Beat the Following April in Three of the Last Four Seasons. At $938 a Ton, Fall Wins Only if Spring Tops About $1,041.," Sep 23, 2026.
- DTN/Progressive Farmer, "Fertilizer Prices Evenly Mixed," Nov 16, 2022. https://www.dtnpf.com/agriculture/web/ag/crops/article/2022/11/16/fertilizer-prices-evenly-mixed
- DTN/Progressive Farmer, "Anhydrous Again Leads Most Retail Fertilizer Prices Higher," Nov 1, 2023. https://www.dtnpf.com/agriculture/web/ag/crops/article/2023/11/01/anhydrous-leads-retail-fertilizer
- DTN/Progressive Farmer, "Once Again, Most Retail Fertilizer Prices Higher," Nov 27, 2024. https://www.dtnpf.com/agriculture/web/ag/crops/article/2024/11/27/retail-fertilizer-prices-higher
- DTN/Progressive Farmer, "Anhydrous Again Leads Half of Retail Fertilizer Prices Higher," Nov 12, 2025. https://www.dtnpf.com/agriculture/web/ag/crops/article/2025/11/12/anhydrous-leads-half-retail-prices
- DTN/Progressive Farmer, retail fertilizer price tables, Jun 21, 2023 (row for Apr 17–21, 2023). https://www.dtnpf.com/agriculture/web/ag/crops/article/2023/06/21/anhydrous-uan32-lead-fertilizer
- DTN/Progressive Farmer, "All Major Fertilizer Prices Continue Higher for Fourth Consecutive Week," Apr 24, 2024. https://www.dtnpf.com/agriculture/web/ag/crops/article/2024/04/24/major-fertilizer-prices-continue
- DTN/Progressive Farmer, "UAN32 Retail Price Up 9%, UAN28 Price Up 7% From Last Month," Apr 23, 2025. https://www.dtnpf.com/agriculture/web/ag/crops/article/2025/04/23/uan32-retail-price-9-uan28-price-7
- DTN/Progressive Farmer, "6 Fertilizer Prices See Sizeable Moves Higher," Apr 22, 2026. https://www.dtnpf.com/agriculture/web/ag/news/article/2026/04/22/6-fertilizer-prices-see-sizeable
- Farmbucks, Urea (US Gulf) futures contract chain, Oct 30, 2026. https://farmbucks.com/futures/fertilizer/urea-us-gulf
- Crop Root Zone, TRZ-0226, "The Urea Curve Charges $17 a Ton to Carry Nitrogen From September to March. In the Last Two Springs It Missed by $74 and $105.," Sep 24, 2026.
- Crop Root Zone, TRZ-0238, "The Tampa Ammonia Contract Fell $10 for October. In the Last Two Falls It Rose $30 and $50, and Retail Anhydrous Followed It Up.," Sep 29, 2026.
Disclosures
Crop Root Zone is an independent publication. Nothing here is investment advice. Market calls, where included, reflect the editors' own read and are not a recommendation to buy or sell any security.
Winter Gas Fell 47 Cents in Three Weeks, Taking $15 Out of a Ton of Ammonia. Tampa Rose About $86. Henry Hub Is $95 of a $987 Retail Ton.
At the Oct. 30 November-to-March strip of $2.91, US gas is 9.6% of retail anhydrous, about 10% of retail urea and 7% to 10% of retail UAN. Retail anhydrous is $145 a ton above a year ago while the gas in that ton fell about $21; matching that rise with gas would take Henry Hub near $7.89. Over 16 months, Tampa and Henry Hub had a correlation of −0.04. The gas in the nitrogen price now is Europe's, at about $31 against $2.90.
Henry Hub futures for November through March averaged $3.37 per MMBtu on October 8, when we last worked the gas in a ton of nitrogen (Crop Root Zone, TRZ-0266, Oct 9, 2026) [5]. By October 30 the same five months averaged about $2.91. November expired at $2.82 (American Gas Association, Oct 29, 2026) [4], and the remaining contracts last traded at $2.898, $3.371, $3.031 and $2.405 (Farmbucks, Oct 30, 2026) [3]. Spot gas at the Henry Hub was $2.68 on October 29 (EIA, Oct 30, 2026) [2]. That is 47 cents off the winter, or about $15 a short ton of ammonia. Over the same stretch a higher November Tampa settlement arrived, reported in a Quantum headline as up $95 a tonne [6][7], and retail anhydrous reached $987 a ton, $145 above a year earlier (DTN/Progressive Farmer, Oct 28, 2026) [1]. Gas and nitrogen went in opposite directions. This piece measures how much of today's nitrogen price is US gas, and what the rest is.
1. Three weeks of gas going one way and nitrogen the other
What's new: The winter strip lost 14% in three weeks. Every nitrogen price we can read publicly either held or rose.
Evidence: At Yara's factor of 32.66 MMBtu per short ton of ammonia, used in TRZ-0266 [5], the strip's fall cuts the gas in a ton from $110 to $95. Each row below compares the last reading before that piece with the latest available.
| Measure | About Oct 8 | Latest | Change | Basis |
|---|---|---|---|---|
| Henry Hub winter strip, $/MMBtu | 3.371 | 2.905* | −0.466 | Nov–Mar average; Nov at expiry |
| Gas in a short ton of ammonia, $ | 110 | 95* | −15 | Before basis and transport |
| TTF front month, €/MWh | 78.85 | 103.58 | +31% | Oct 8 and Oct 30 |
| Tampa ammonia, $/t | 545* | 640* | +95 | CFR, Oct and Nov contracts |
| Tampa ammonia, $/st | 494* | 581* | +86 | CFR, converted at 1.10231 |
| Illinois distributor anhydrous, $/ton | 945 | 981 | +36 | Ask, F.O.B., w/e Oct 2 and Oct 30 |
| DTN retail anhydrous, $/ton | 979 | 987 | +8 | Delivered, Sep 28–Oct 2 and Oct 19–23 |
Source: TRZ-0266, Oct 9, 2026 [5], for the first-column gas, TTF, Tampa and Illinois values and the $979 retail figure; AGA, Oct 29, 2026 [4]; Farmbucks, Oct 30, 2026 [3]; Trading Economics, Oct 30, 2026 [10]; USDA AMS, Oct 30, 2026 [12]; DTN, Oct 28, 2026 [1]. *Crop Root Zone calculation. Both Tampa levels are implied: October from a reported $10 cut from $555 [16], November from a reported $95 rise. We read the November rise as a headline only, and the settled level is not public to us.
The drop is about weather and storage, not a change in the industry's cost position. Forecasts were mostly milder than normal through November 11, and spot fell to its lowest since November 2024 (Pipeline & Gas Journal, Oct 27, 2026) [11]. Working gas stood at 3,724 Bcf for the week ending October 23, about 1% above the five-year average [4]. A cold January could reverse it quickly. Section 2 shows why that would not change much.
$95 a ton
The Henry Hub gas in a short ton of ammonia at the October 30 winter strip of about $2.91. It is 9.6% of DTN's $987 retail average. (Crop Root Zone calculation from AGA, Oct 29, 2026; Farmbucks, Oct 30, 2026; DTN, Oct 28, 2026)
2. A $987 ton, taken apart
What's new: TRZ-0266 stacked gas against Tampa and the Gulf urea board to find the margin. Carried through to the price a grower pays, the stack shows gas is under a tenth of it, and that the two biggest pieces have little to do with a US plant's cost.
Evidence: The other plant costs carry over from TRZ-0266: a non-gas cash cost of $62 a short ton, derived from Argus's roughly $175-a-tonne US Gulf production cost at September gas (Argus Media, Sep 29, 2026) [15], and depreciation of $61 a ton from CF Industries' first-half results [5]. Tampa is the November contract at an implied $640.
| Layer in a $987 retail ton of anhydrous | $/ton | Share | |
|---|---|---|---|
| Tampa to farm: freight, terminals, dealer margin, inland premium | 406* | 41.1% | ██████████ |
| Tampa price above a US plant's full cost | 363* | 36.8% | █████████░ |
| Henry Hub gas, at the $2.905 strip | 95* | 9.6% | ██░░░░░░░░ |
| Non-gas plant cash cost | 62* | 6.3% | ██░░░░░░░░ |
| Depreciation | 61* | 6.2% | ██░░░░░░░░ |
Source: DTN, Oct 28, 2026 [1]; AGA [4]; Farmbucks [3]; Argus Media, Sep 29, 2026 [15]; TRZ-0266 [5]. *Crop Root Zone estimates. Basis: delivered national retail, Oct 19–23. Tampa is a delivered import price and not a producer's netback, and an inland plant nets more, so the split between the top two rows is approximate. Retail in that week was not yet priced off the November contract. Against October's $494, the top row would be $493. Bars scale to $406 at ten blocks.
The same arithmetic across the other nitrogen forms gives a similar answer.
| Product, Oct 19–23 | Retail $/ton | Retail $/lb N | Gas, $/ton | Gas, ¢/lb N | Gas share | Retail vs year ago, $/ton |
|---|---|---|---|---|---|---|
| Anhydrous | 987 | 0.60 | 95* | 5.8* | 9.6%* | +145 |
| Urea | 674 | 0.73 | 69* | 7.5* | 10.2%* | +76 |
| UAN32 | 486 | 0.76 | 37–48* | 5.8–7.5* | 7.6–9.8%* | +20 |
| UAN28 | 447 | 0.80 | 32–42* | 5.8–7.5* | 7.3–9.4%* | +34 |
Source: DTN, Oct 28, 2026 [1]. Basis: delivered national retail. *Crop Root Zone estimates at the $2.905 strip, using 32.66 MMBtu per ton of ammonia and 23.66 per ton of urea (Yara, via TRZ-0266 [5]). We have no published gas factor for UAN, so we bracket it between the ammonia and urea figures per pound of nitrogen.
The wholesale shares are also close to each other. Urea's $69 of gas is about 16% of the NOLA barge at $430–440 a short ton FOB (Advanced Turf Solutions, Oct 26, 2026) [14], and ammonia's $95 is about 16% of implied Tampa. We could not find a public NOLA UAN or ammonia barge price. Platts launched a daily FOB NOLA ammonia barge assessment on September 24, but it is subscription-only (S&P Global, Sep 24, 2026) [26].
A benchmark is not a plant's bill. CF Industries paid $3.37 per MMBtu in the second quarter against a $2.93 Henry Hub average (CF Industries, Aug 5, 2026) [22], and at that spread gas in a ton would be about $14 higher. That would lift gas from under a tenth of the retail price to about 11%. It does not change the finding.
A year earlier the numbers ran the other way. The November 2025 contract traded at $3.45 on October 22, 2025 (EIA, Oct 23, 2025) [20]. The November 2026 contract expired at $2.82 [4].
| Anhydrous, $/ton | Oct 2025 | Oct 2026 | Change |
|---|---|---|---|
| DTN retail, delivered | 842 | 987 | +145 |
| November Tampa contract, CFR, per short ton | 590 | 581* | −9 |
| Retail over November Tampa | 252* | 406* | +154 |
| Gas at the November Henry Hub contract | 113* | 92* | −21 |
| Gas share of retail | 13.4%* | 9.3%* | −4.1 pts |
Source: DTN, Oct 28, 2026 [1]; TRZ-0238 for the $650 November 2025 settlement [16]; EIA, Oct 23, 2025 [20]; AGA, Oct 29, 2026 [4]. *Crop Root Zone calculation. The 2026 Tampa value is implied as described in Section 1. The 2025 gas reading is six days before that contract's expiry and the 2026 reading is at expiry.
For gas alone to explain the $145 rise, Henry Hub would have had to gain $4.44, reaching about $7.89 from October 2025's $3.45. January 2026's monthly spot average, the highest in this piece's series, was $7.72 (EIA, Oct 2026) [19].
Ground Truth: Gas is the cost most often reached for when nitrogen prices rise. At $2.91 it cannot carry that argument. The 47-cent fall since October 8 is worth 0.9 cents a pound of nitrogen in anhydrous, and the entire US gas bill is 5.8 cents of a 60-cent pound. Anyone quoting higher winter gas as a reason for a higher fall price is quoting a cost that has gone down.
3. Sixteen months in which Tampa ignored Henry Hub
What's new: We ran Henry Hub's monthly spot average, in dollars per ton of ammonia, against the Tampa contract for every month from June 2025 to September 2026. The correlation is −0.04. Gas explains less than 1% of the variation in Tampa's level.
Evidence: The series use the settlements compiled in TRZ-0238 [16] and EIA's monthly spot prices [19]. Monthly changes moved in the same direction 8 times out of 15, about what a coin toss would give. Dropping January 2026 only moves the correlation to +0.02, and using the prior month's gas gives −0.03. The share of gas in the Tampa ton ran from 12.8% in May 2026 to 47.5% in January 2026, and that range came almost entirely from Tampa and one cold month.
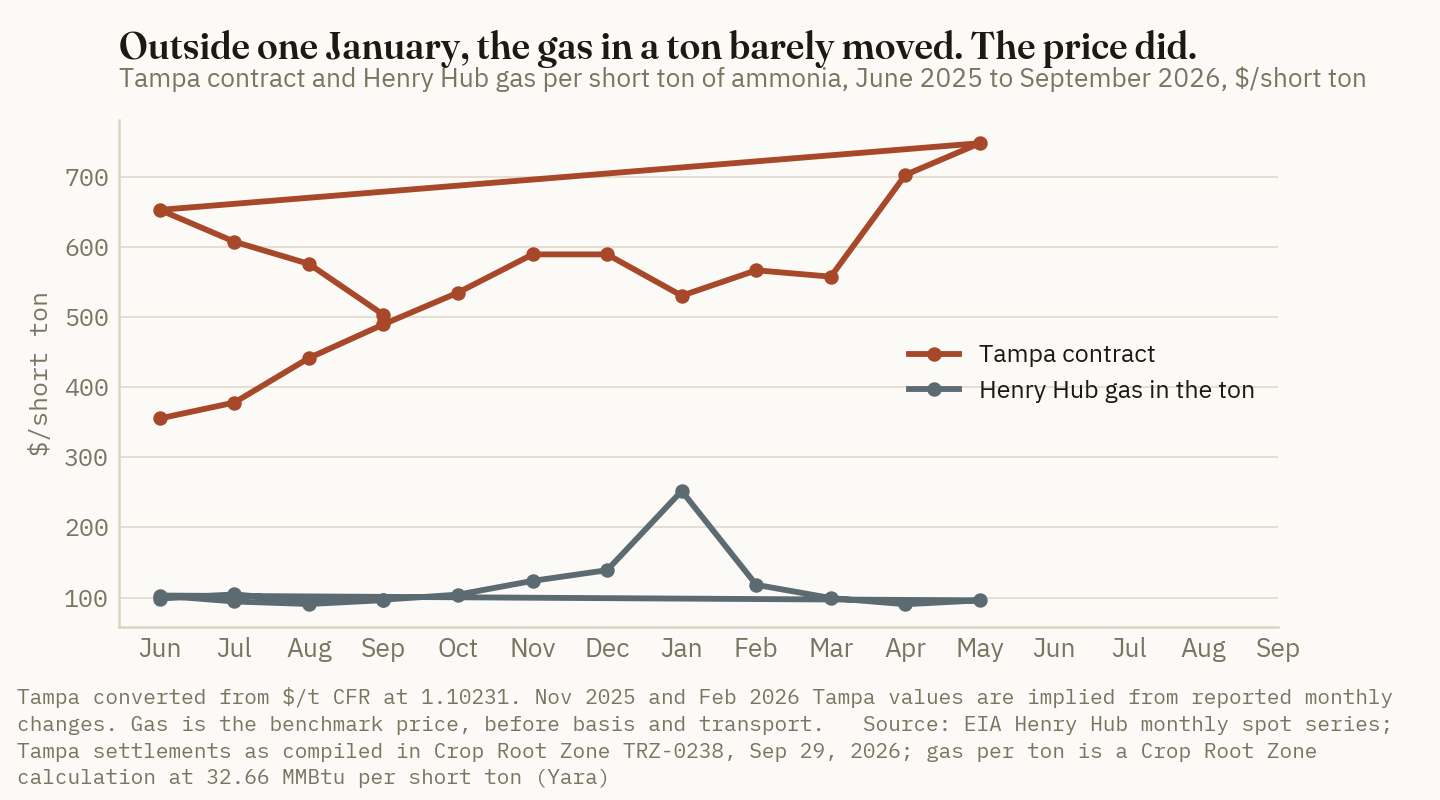
Two months make the point. In January 2026, gas in a ton rose about $113 from December while the Tampa contract fell $65 a tonne. In April 2026, gas in a ton fell about $9 and Tampa rose $160 a tonne as Middle East supply was disrupted [16]. Sixteen months is a short sample and it contains a war, so this is a description of the period and not a law. It does show that gas was not what moved the benchmark over this period.
A US producer's own filing shows the same split. LSB Industries, which makes ammonia from purchased gas, reported third-quarter results on October 28.
| LSB Industries, third quarter | 2025 | 2026 | Change |
|---|---|---|---|
| Natural gas cost, $/MMBtu | 3.10 | 2.93 | −5% |
| Gas in a short ton of ammonia, $ | 101* | 96* | −$6* |
| Tampa benchmark, $/t | 491 | 622 | +27% |
| Ammonia netback, $/st | 400 | 528 | +32% |
| Gas as a share of netback | 25%* | 18%* | −7 pts* |
Source: LSB Industries, Form 8-K exhibit 99.1, Oct 28, 2026 [21]. *Crop Root Zone calculation at 32.66 MMBtu per short ton. LSB's actual gas use per ton is not given in the release and may differ. The netback is the company's average selling price, not retail.
Netback rose $128 a ton while the gas in it fell about $6.
4. There is gas in the price, but it is not American
What's new: European gas has gone from expensive to extraordinary. TTF settled above €100 per MWh on October 28 for the first time since December 16, 2022 (Quantum Commodity Intelligence, Oct 28, 2026) [9], and stood at €103.58 on October 30, up about 233% on the year (Trading Economics, Oct 30, 2026) [10].
Evidence: In July, we put the ratio of TTF to Henry Hub at 5.75 to 1 (Crop Root Zone, TRZ-0047, Jul 29, 2026) [17]. With TTF near $31 per MMBtu on October 27 [11] and December Henry Hub at $2.90 [3], it is about 10.7 to 1.
| Ammonia, late October | US | Europe | Basis |
|---|---|---|---|
| Gas price, $/MMBtu | 2.90 | ~31 | Dec Henry Hub Oct 30; TTF Oct 27 |
| Gas in the tonne, at 36 MMBtu, $/t | 104* | ~1,116* | Gas only |
| Production cost, public estimate, $/t | ~175 | above 1,000 | Argus, Sep 29 (US); Quantum, late Oct (Europe) |
| Market price, $/t | 640* | 710–720 | Implied Tampa CFR; Europe CFR duty-paid, w/e Oct 23 |
Source: Farmbucks, Oct 30, 2026 [3]; Pipeline & Gas Journal, Oct 27, 2026 [11]; Argus Media, Sep 29, 2026 [15]; Quantum Commodity Intelligence, late Oct 2026 [8]; Australian Fertilizer Corporation, w/e Oct 23, 2026 [23]. *Crop Root Zone calculation. The Argus US cost was struck at September gas, when Henry Hub averaged $2.95, close to today's level.
Quantum put ammonia about $411 a tonne cheaper to import than to make in Western Europe on October 23 and said more curtailments looked likely [8]. Advanced Turf Solutions relays a theoretical European cost of $1,045 a tonne [14]. Yara said it actively managed its European footprint in the third quarter in response to gas prices (Yara release via Global Agriculture, Oct 24, 2026) [25]. A plant that stops running becomes a buyer. That is the route by which European gas reaches a Tampa contract: through bids for imported tons, not through anyone's cost of production. Quantum reported a 6,000-tonne Algerian sale at $655 a tonne FOB on October 19 [8].
We cannot split out how much of Tampa is European gas, because no public series isolates it, and Quantum also credits tighter supply East of Suez [7]. A rough marker is the gap between basins. East Asia was $490–530 CFR and the Middle East $450–490 FOB in the week of October 23 [23], against an implied $640 at Tampa and $710–720 in Europe. Tampa's premium over the East Asia midpoint is about $130 a tonne, or about $118 a short ton. That is our estimate. The dates differ by a few days, freight is not netted, and it also reflects Trinidad's lost output and Hormuz logistics. Still, it is larger than the whole US gas bill, and the November rise narrowed Tampa's discount to Europe from about $170 to about $75.
Ground Truth: The accurate version of "nitrogen is a gas price" is that it is the price of a gas most American buyers do not watch. That has a practical edge this winter. If Henry Hub rallies on a cold snap, the cost barely registers. If TTF breaks because the Middle East calms or LNG returns, Europe's plants restart, import bids fade, and the piece of the Tampa price sitting above the East Asian market is what is exposed. The risk to a fill price is in that European number, in both directions. Yara's pending purchase of a Texas plant, which it says will reduce its European gas exposure [25], points to where the producers themselves see the advantage.
5. What this means for a fall or winter nitrogen decision
What's new: Three state corn grower presidents wrote to the president this week that "fertilizer prices and the lack of meaningful competition remain urgent concerns," and said Iowa farmers were being quoted anhydrous $150 a ton above mid-September (DTN/Progressive Farmer, Oct 27, 2026) [24]. DTN's national average rose $42 from mid-September to mid-October, with the year-on-year gap at about $149 the week before the current survey [24]. Their case does not rest on gas, and our numbers do not rescue the industry with it.
Evidence: Our numbers also do not establish the letter's explanation. The $406 between Tampa and the farm includes freight, terminals, summer-fill inventory and dealer margin, and we cannot divide it with public data. TRZ-0282 found that only summer-fill cost still explains the retail gap (Crop Root Zone, TRZ-0282, Oct 15, 2026) [18]. The Tampa contract is also one bilateral price and not a measure of inland supply [16]. What the public numbers do show is how wide the range is within the same market. USDA's distributor asks on October 30 averaged $981.11 a ton F.O.B. in Illinois, in a range of $850 to $1,060, up $33.61 in the fortnight [12], and $902.33 in Iowa, in a range of $892 to $915, down $3.17 [13]. Those are small samples of asking prices. The $79 between the two state averages is most of the entire Henry Hub bill for a ton of ammonia, and the Illinois range alone is more than twice that bill.
Per acre, on a 150-pound anhydrous program costing about $90 at the DTN average:
| What moves the anhydrous bill | $/acre, 150 lb N | |
|---|---|---|
| Retail's rise over the past year | 13.26* | ██████████ |
| All Henry Hub gas in the program | 8.68* | ███████░░░ |
| November Tampa rise, if passed through 1:1 | 7.88* | ██████░░░░ |
| Illinois vs Iowa average distributor ask | 7.21* | █████░░░░░ |
| The 47-cent fall in the winter strip | 1.39* | █░░░░░░░░░ |
Source: Crop Root Zone estimates from the prices above, at 1,640 lb N per ton. 150 lb N/acre is illustrative. The 1:1 pass-through is the rounded rate from the 2024 and 2025 falls in TRZ-0238 [16], and rests on two observations. Bars scale to $13.26 at ten blocks.
What to watch next:
- The next DTN surveys. Retail has not yet been surveyed against the November contract. The layer over Tampa is already $154 wider than a year ago, so a full $86 rise at retail would be a choice as much as a cost.
- The November Tampa level itself. We read a $95 rise as a headline only. A published settlement would replace our implied $640.
- CF Industries' third-quarter results. We found none published as of October 31. Its realized gas cost and ammonia realization would be the largest test of the LSB pattern.
- TTF against the import line. At 36 MMBtu a tonne, European gas alone equals the implied Tampa price at about $17.80 per MMBtu. That is our calculation, and TTF is near $31.
- Henry Hub in January. The strip's high month is $3.37 [3]. It matters for producers' margins and very little for a buyer's bill.
Ground Truth: Treat gas as a settled line and spend the negotiating effort elsewhere. A grower pricing fall or spring anhydrous can assume about 6 cents a pound of nitrogen is Henry Hub, and that no plausible move in it changes the decision. The useful questions are what ton the quote is priced against, summer fill or November replacement, and what a dealer in the next county is asking, because the spread between those answers can match the entire gas bill. Where the quote has risen by more than Tampa since mid-September, the increase is not a cost story from gas or from the contract, and it is reasonable to ask the seller which cost it is.
References
- DTN/Progressive Farmer, T. Neeley, "Fertilizer Prices Continue to Climb: UAN28 Posts 6% Increase in Latest DTN Survey," Oct 28, 2026 (survey week Oct 19–23, 2026; month-ago Sep 21–25; year-ago Oct 20–24, 2025). https://www.dtnpf.com/agriculture/web/ag/crops/article/2026/10/28/fertilizer-prices-continue-climb-6
- U.S. Energy Information Administration, Today in Energy, daily prices, data for Oct 29, 2026 (Henry Hub spot $2.68). https://www.eia.gov/todayinenergy/prices.php
- Farmbucks, "Natural Gas (Henry Hub) Futures" contract chain, last prices stamped Oct 30, 2026, 3:59 p.m. Central. https://farmbucks.com/futures/energy/natural-gas
- American Gas Association, Natural Gas Market Indicators, Oct 29, 2026 (November contract expiry, storage). https://www.aga.org/research-policy/resource-library/natural-gas-market-indicators-october-29-2026/
- Crop Root Zone, TRZ-0266, "Henry Hub's Winter Strip Is $3.37. That Puts $110 of Gas in a $494 Ton of Tampa Ammonia and $80 in a $425 Ton of Gulf Urea. Europe's Gas Costs $25.85.," Oct 9, 2026 (October 8 futures and TTF; Yara conversion factors; non-gas cost derivation; CF Industries depreciation; Illinois and DTN early-October prices).
- Quantum Commodity Intelligence, "Tampa ammonia increases by $95/mt for November," late Oct 2026 (headline only, as returned by web search; article text and settled level not read). https://www.qcintel.com/ammonia/
- Quantum Commodity Intelligence, "Ammonia prices rise on Tampa contract, tighter market East of Suez," Oct 29, 2026 (public summary; full text behind registration). https://www.qcintel.com/ammonia/article/ammonia-prices-rise-on-tampa-contract-tighter-market-east-of-suez-76314.html
- Quantum Commodity Intelligence, ammonia market commentaries listing, accessed Oct 31, 2026 (public summaries of the Oct 19 Algerian sale report, the Oct 23 Europe curtailment and import-parity item, and the European production cost item). https://www.qcintel.com/ammonia/ammonia-market-commentaries-news/
- Quantum Commodity Intelligence, "European ammonia production costs hit fresh highs, market awaits Tampa settlement," Oct 28, 2026 (public summary). https://www.qcintel.com/ammonia/article/european-ammonia-production-costs-hit-fresh-highs-market-awaits-tampa-settlement-76202.html
- Trading Economics, EU Natural Gas (TTF), Oct 30, 2026. https://tradingeconomics.com/commodity/eu-natural-gas
- Pipeline & Gas Journal, "U.S. natural gas rises 2% as Henry Hub spot hits lowest since 2024," Oct 27, 2026. https://pgjonline.com/news/2026/october/us-natural-gas-futures-rise-2-before-expiry-as-henry-hub-spot-falls-to-lowest-since-november-2024
- USDA AMS, Illinois Production Cost Report (Bi-weekly), Oct 30, 2026. https://www.ams.usda.gov/mnreports/ams_3195.pdf
- USDA AMS, Iowa Production Cost Report (Bi-Weekly), Oct 30, 2026. https://www.ams.usda.gov/mnreports/ams_2863.pdf
- Advanced Turf Solutions, "U.S. Fertilizer Market Summary 10/26/2026" (prices as of Oct 23, 2026). https://www.advancedturf.com/wp-content/uploads/2026/10/ATS-Fertilizer-Market-Update-10_26_2026.pdf
- Argus Media, "Europe's ammonia market hit by rising gas prices," Sep 29, 2026. https://www.argusmedia.com/en/news-and-insights/market-opinion-and-analysis-blog/europe-ammonia-market-rising-gas-prices
- Crop Root Zone, TRZ-0238, "The Tampa Ammonia Contract Fell $10 for October. In the Last Two Falls It Rose $30 and $50, and Retail Anhydrous Followed It Up.," Sep 29, 2026 (monthly Tampa settlements with their sources; fall pass-through ratios; methodology of the contract).
- Crop Root Zone, TRZ-0047, "Nitrogen's Floor Is a Gas Price — and the Two Gas Prices That Set It Are 5.8x Apart," Jul 29, 2026.
- Crop Root Zone, TRZ-0282, "Retail Anhydrous Rose $39 in the Month the Tampa Contract Fell. At $977 It Sits $483 Over Wholesale, and Only Summer-Fill Cost Still Explains the Gap.," Oct 15, 2026.
- U.S. Energy Information Administration, Henry Hub Natural Gas Spot Price, monthly, accessed Oct 31, 2026 (2025 and January–September 2026). https://www.eia.gov/dnav/ng/hist/rngwhhdm.htm
- U.S. Energy Information Administration, Natural Gas Weekly Update, for week ending Oct 22, 2025, released Oct 23, 2025. https://www.eia.gov/naturalgas/weekly/archivenew_ngwu/2025/10_23/
- LSB Industries, third quarter 2026 results, Form 8-K exhibit 99.1, Oct 28, 2026. https://www.sec.gov/Archives/edgar/data/0000060714/000119312526436180/lxu-ex99_1.htm
- CF Industries Holdings, second quarter and first half 2026 results, Form 8-K exhibit 99.1, Aug 5, 2026. https://www.sec.gov/Archives/edgar/data/0001324404/000132440426000017/cf-08052026_ex991xearnings.htm
- Australian Fertilizer Corporation, Weekly Update — Global Fertiliser Markets, w/e Oct 23, 2026 (published Oct 26, 2026). https://ausfertcorp.com/weekly-update-global-fertiliser-markets-w-e-23-10-2026/
- DTN/Progressive Farmer, "Corn Growers Press Fertilizer Probe," Oct 27, 2026. https://www.dtnpf.com/agriculture/web/ag/crops/article/2026/10/27/rising-fertilizer-costs-undercut-aid
- Global Agriculture, "Yara reports solid 3Q amid market volatility," Oct 24, 2026 (company release). https://www.global-agriculture.com/crop-nutrition/yara-reports-solid-3q-amid-market-volatility/
- S&P Global Energy, "Platts launches daily FOB NOLA ammonia barge assessment and updates weekly assessment, Sept. 24," Sep 24, 2026. https://www.spglobal.com/energy/en/pricing-benchmarks/our-methodology/subscriber-notes/092426-platts-launches-daily-fob-nola-ammonia-barge-assessment-and-updates-weekly-assessment-sept-24
Disclosures
Crop Root Zone is an independent publication. Nothing here is investment advice. Market calls, where included, reflect the editors' own read and are not a recommendation to buy or sell any security.
China Reopened Phosphate Exports on Sept. 1 and Shipped No DAP or MAP in September. NOLA DAP Is $802.50 a Ton, Level With India's Delivered Price.
China's customs data for the first month of the licensed window show zero DAP and zero MAP exports, and only about 180,000 tonnes of both for January to September, against roughly 3.6 million a year earlier. Chinese DAP prices fell $45 to $52 a tonne in the meantime instead of rising toward export parity, so the gate is administrative, not commercial. NOLA DAP barges at $800–805/st convert to about $885 a metric ton, within $10 of India's $890–900 CFR, and NOLA MAP sits about $50 a tonne over Brazil. India still has no rabi subsidy rates. The one input getting cheaper is sulfur: a reported $615 fourth-quarter Tampa contract takes about $32 out of a short ton of DAP, but that relief arrives in spring 2027, not in this winter's price.
China's agricultural phosphate export suspension ended on August 31, and producers could again file export declarations for DAP and MAP from September 1 (Nongzi yu Shichang, Sep 1, 2026) [4]. China's customs figures for September, relayed by SunSirs on October 19, show what came of it: "there were no exports" of either product that month. Cumulative 2026 exports stand at about 70,000 tonnes of DAP, down 97.1% from a year earlier, and 110,000 tonnes of MAP, down 90.9% (SunSirs via ChemNet, Oct 19, 2026) [1]. In the same weeks, US Gulf phosphate barely moved. NOLA DAP barges traded at $800–805 per short ton FOB in the week to October 23, the same as a week earlier, and MAP firmed $5 to $815–820 (Advanced Turf Solutions, Oct 26, 2026) [8]. DTN's retail survey for October 19–23 had DAP at $939 a ton and MAP at $983 (DTN/Progressive Farmer, Oct 28, 2026) [13]. Our September 21 piece described how the licensed window was designed (Crop Root Zone, TRZ-0214, Sep 21, 2026) [23]. This piece covers what has actually passed through it, where every major phosphate benchmark now stands, and what that means for US prices this winter.
1. The window opened. Nothing went through it in September.
What's new: The first full month of China's reopened export regime produced no recorded DAP or MAP exports. The trade and the broker reports both describe it as a halt, not a slowdown.
Evidence: The SunSirs relay of China Customs data is internally inconsistent. Its summary paragraph reports zero September exports and a 70,000-tonne year-to-date DAP total. A product table further down shows 320,000 tonnes of DAP in September and 1.66 million tonnes year to date [1]. We rely on the summary paragraph, for three reasons. Guosen Securities, citing customs data on October 26, put January–August DAP exports at 73,900 tonnes (−96.53%) and MAP at 113,000 tonnes (−89.15%), with both "close to zero" in August (Guosen Securities, Oct 26, 2026) [2]. A January–September total no higher than the January–August total means September added nothing. Second, Argus's China consultant told the trade on October 15 that Chinese phosphate output is "focused solely on meeting domestic demand" and that 2026 exports have been "almost nothing" (Fertilizer Daily, relaying Argus, Oct 15, 2026) [7]. Third, the Australian Fertilizer Corporation's October 19 weekly cited the "continued absence of Chinese exports" as a reason world phosphate stays tight (Australian Fertilizer Corporation, w/e Oct 16, 2026) [11]. The product-table figures do not match any of these, and they look like data from another period.
| China phosphate exports | DAP, tonnes | MAP, tonnes | Basis |
|---|---|---|---|
| Full year 2025 | 3,480,000 | 1,880,000 | China Customs via SunSirs [3] |
| January–August 2026 | 73,900 | 113,000 | China Customs via Guosen [2] |
| September 2026 | 0 | 0 | China Customs via SunSirs [1] |
| January–September 2026 | ~70,000 | ~110,000 | Rounded, China Customs via SunSirs [1] |
| January–September 2025, implied | ~2,410,000* | ~1,210,000* | Back-calculated from reported YoY change |
Source: SunSirs, Jan 23 and Oct 19, 2026; Guosen Securities, Oct 26, 2026. *Our calculation from the 2026 totals and the reported −97.1% and −90.9% declines. Because the 2026 totals are rounded, the implied 2025 figures could be off by roughly 100,000 tonnes each.
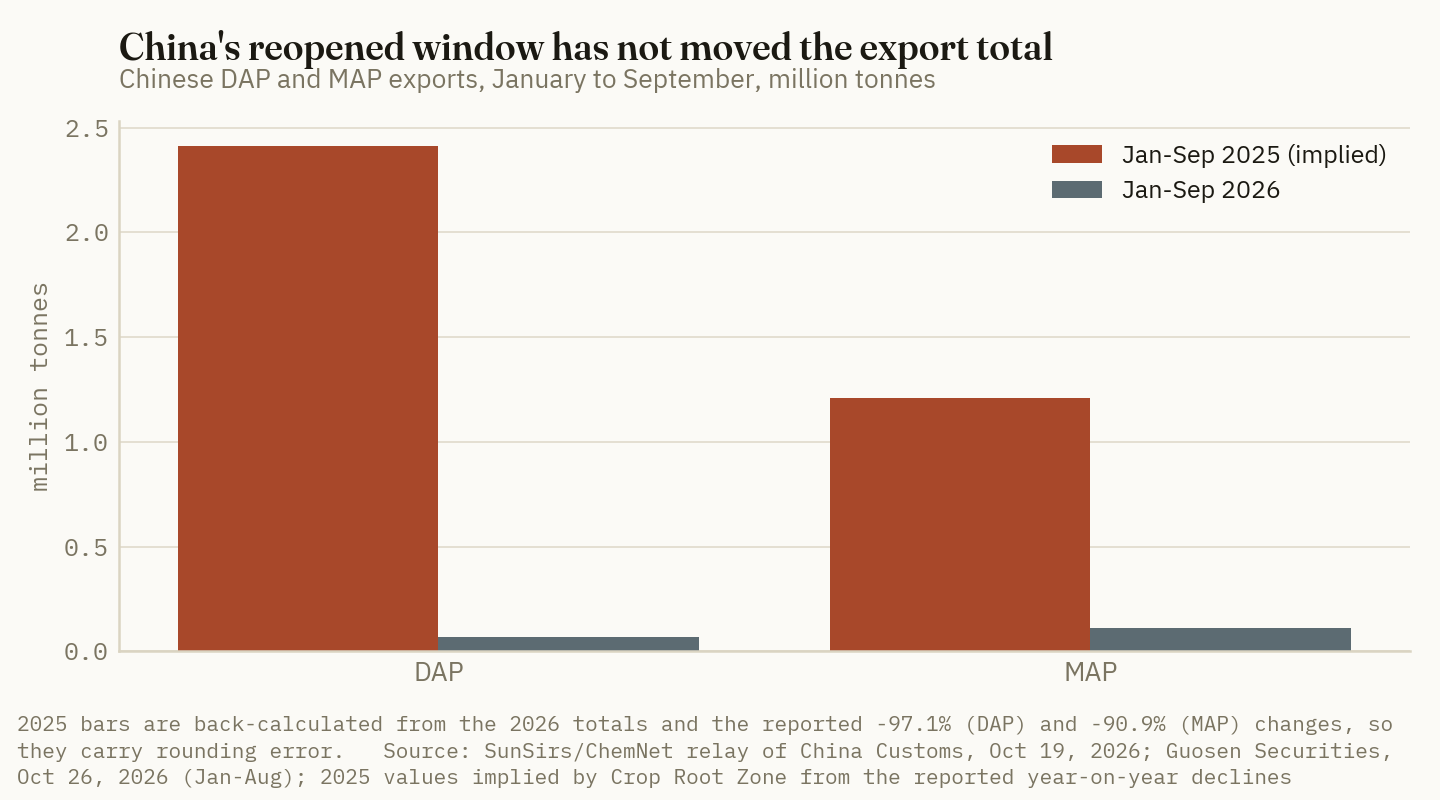
The rules explain part of the result. The September reopening was not a free market. It required "registration + quota + legal inspection," with the total set by the Ministry of Commerce and priority given to domestic autumn planting (Nongzi yu Shichang, Sep 1, 2026) [4]. A trade report on October 22 said DAP export quota is "concentrated among leading firms," and that some Hubei producers were shipping "earlier export and winter-storage orders" (Nongzi yu Shichang, Oct 22, 2026) [5]. October may therefore show some tonnes when customs reports it in about three weeks. No volume has been published, and we do not estimate one.
Prices show the gate is administrative, not commercial. If Chinese producers could export freely, a $200-plus gap to world prices would pull domestic prices up. The opposite has happened. On September 1, Hubei 64% DAP was listed at ¥4,800–4,850 a tonne [4]. On October 27, a large Hubei plant cut its ex-works price in one step to ¥4,500, and the report said the DAP and MAP price structure "has broken down" (Nongzi yu Shichang, Oct 27, 2026) [6]. That is a fall of ¥300–350, or 6% to 7%, during an export window. Plant utilization was about 43% for DAP and 41% for MAP on October 22 [5]. Guosen calculated that a producer buying all raw materials at market prices lost about ¥1,777 on a tonne of DAP at the end of September, with sulfur at ¥7,527 a tonne, up 201% year on year [2]. Plants running at 43% while losing money on every tonne have little reason to compete for quota on export orders.
Ground Truth: The licensed window should not be read as a supply source for this winter. China's own buying season for winter storage is expected to start in mid-to-late November [5], and quota is going first to the large firms that domestic policy leans on. In October–December 2025, on our arithmetic from the customs totals, China shipped roughly 1.6 to 2.0 million tonnes of DAP and MAP. That volume is the gap facing the world market this quarter, and nothing in the September data suggests China will fill much of it before spring. Argus's forecast of about 2 million tonnes of Chinese phosphate exports in all of 2027 [7] is less than half of what China shipped in 2025.
2. Where phosphate sits at the end of October
What's new: With China out, the world's phosphate benchmarks have converged in a narrow band of about $850–900 a tonne. The US Gulf sits inside it, not below it.
Evidence: India's DAP price eased to $890–905 CFR in the week to October 2, the lowest since April (Australian Fertilizer Corporation, w/e Oct 2, 2026) [12], and was $890–900 in the week to October 23 [10]. Brazil MAP held at $830–850 CFR for the five weeks to October 2 [12]. By October 23 it was quoted "up to $850" [10], with a US distributor survey putting it at $840–860 [8]. Moroccan DAP held at $850–930 FOB [8]. On September 30, China's nominal 64% DAP FOB assessment was $892.50, while Shandong's domestic price of ¥4,850 left a ¥1,161 gap to it (Guosen, citing Longzhong, Sep 30, 2026) [2]. With no customs exports behind it, that FOB figure is an offer level, not a traded price.
| Benchmark, late Oct 2026 | Quoted | $/mt equivalent | YoY | Basis |
|---|---|---|---|---|
| DAP, NOLA barge | $800–805/st | ~885 | +6% | FOB barge, Oct 23 [8] |
| MAP, NOLA barge | $815–820/st | ~901 | +17% | FOB barge, Oct 23 [8] |
| DAP, India | $890–900/mt | 895 | n/a | CFR, w/e Oct 23 [10] |
| MAP, Brazil | $840–860/mt | 850 | n/a | CFR, Oct 23 [8] |
| DAP, Morocco | $850–930/mt | 890 | n/a | FOB, Oct 23 [8] |
| DAP, China (nominal) | $892.50/mt | 893 | n/a | FOB, Sep 30 [2] |
| DAP 64%, Hubei | ¥4,500/mt | ~669 | n/a | Domestic ex-works, Oct 27 [6] |
Source: as listed. $/st converted to $/mt at 1.10231; yuan converted at the PBOC central parity of 6.7220 on Oct 16, 2026 [22]. Year-on-year change for NOLA uses the year-ago ranges in the same survey, $750–760 for DAP and $700 for MAP [8]. We found no public Tampa MAP FOB assessment; the Argus and Platts series that carry it are subscription-only.
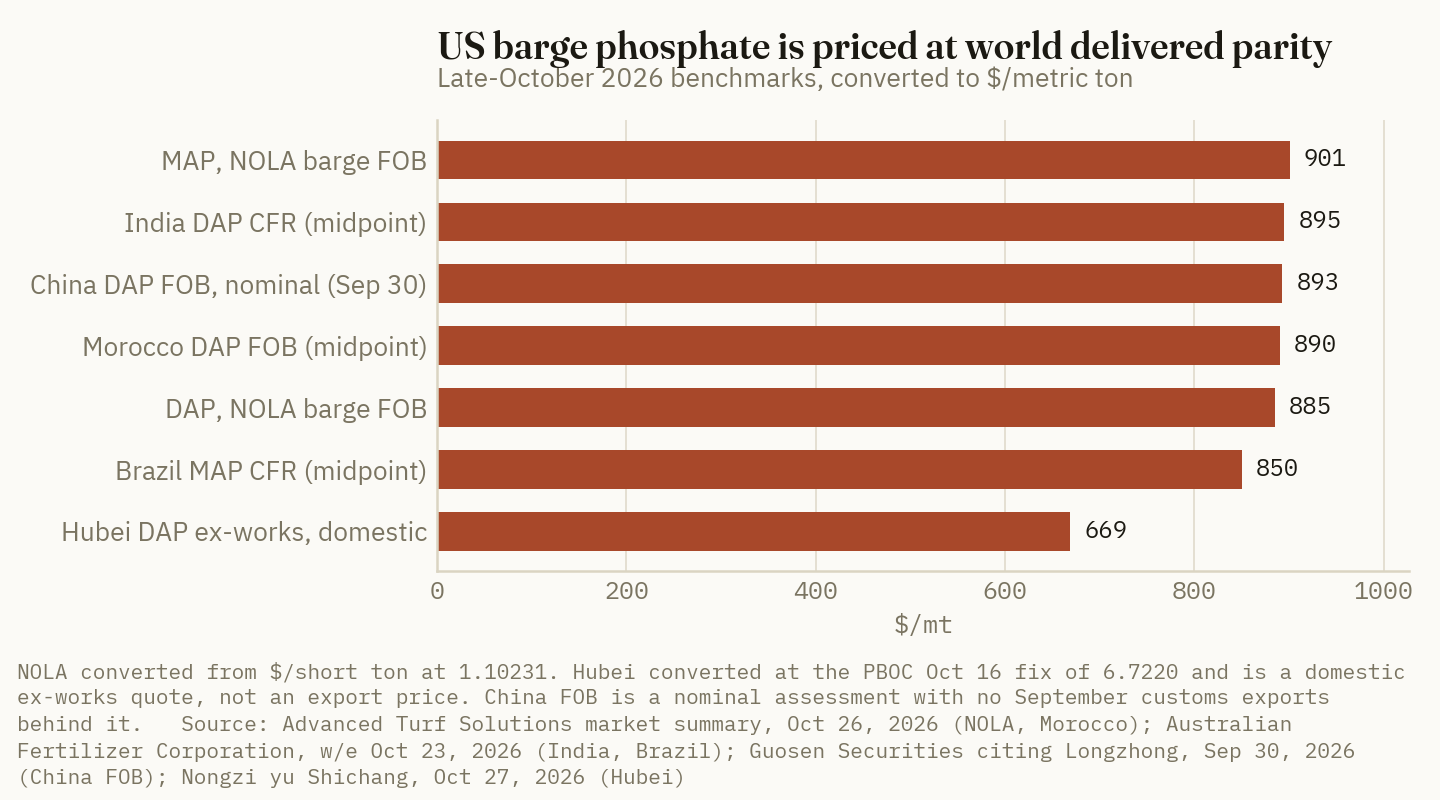
Two spreads in that table matter most to a US buyer. First, NOLA DAP at about $885/mt FOB is within $10 of what India pays for a cargo delivered to its ports. In most years, the US Gulf trades at a discount to Indian CFR. In 2026 it is priced like a destination market that has to win import tonnes. Second, NOLA MAP at about $901/mt is roughly $50 above Brazil MAP CFR. Brazil is the world's largest MAP importer and normally sets the price for the Atlantic. A US barge priced over Brazil delivered says the domestic market is short. The same survey says Mosaic's Louisiana phosphate operations and its South Fort Meade, Florida, mine remain idled by sulfur constraints [8]. This also explains the reversal of the usual US spread: MAP now carries a $15/st premium over DAP at the barge, after the two traded at parity on October 2 (Advanced Turf Solutions, Oct 5, 2026) [9].
The longer view shows how much of the 2026 run-up is still in the price. The World Bank's DAP series, FOB US Gulf, averaged $634.7/mt in January–March, $759.5 in April–June and $791.8 in July–September. September alone averaged $800.6 (World Bank, Oct 2, 2026) [17]. The futures screen is not adding information. CME's DAP FOB NOLA front month settled at $802.50 in every session from October 9 to October 28, after moving between $800 and $802.50 earlier in the month (Investing.com, retrieved Oct 29, 2026) [15], and Trading Economics shows it up 4.66% on the year (Trading Economics, accessed Oct 29, 2026) [16]. A settlement that does not change for three weeks is reflecting an assessment, not active trading.
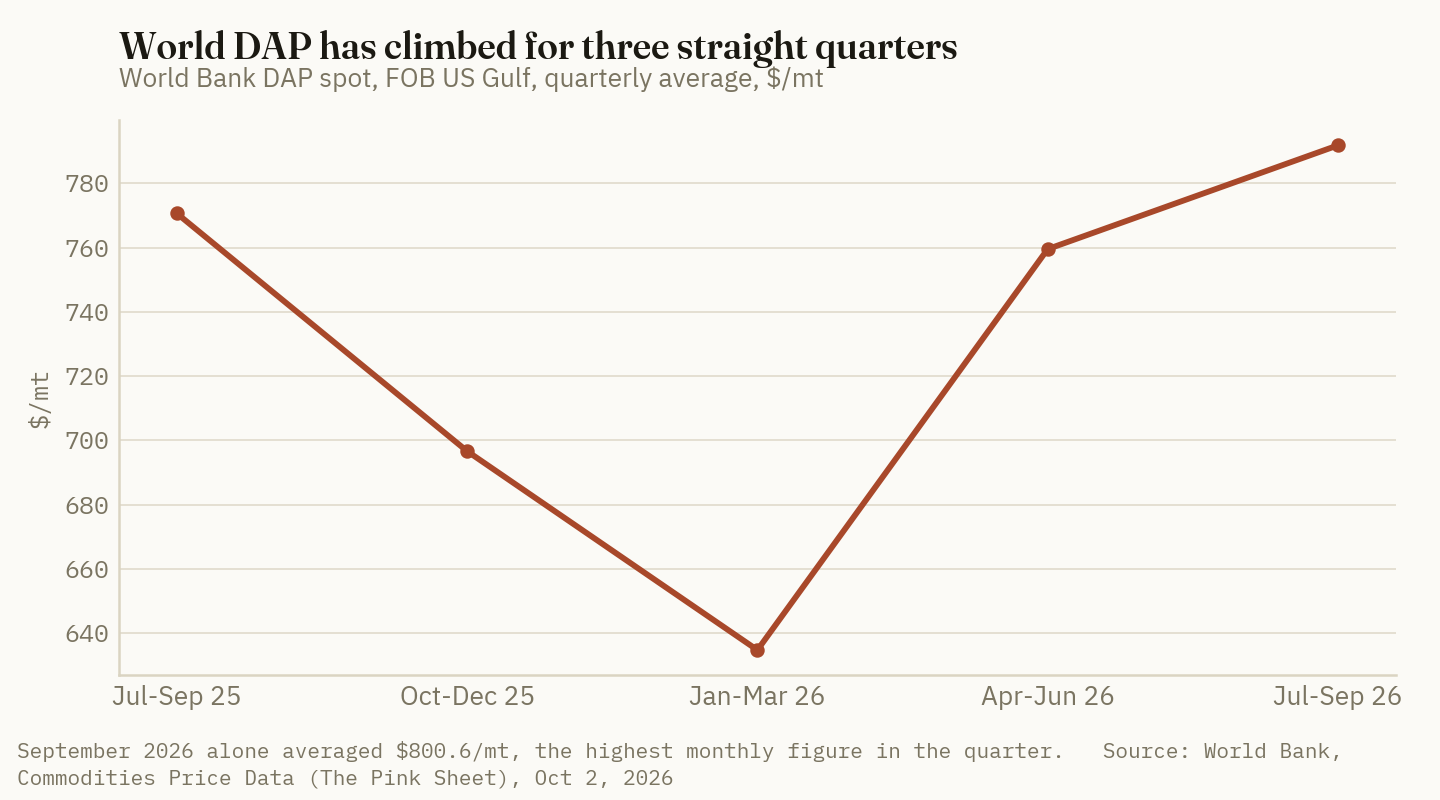
3. India still has no rabi rates, and it has stopped pushing prices up
What's new: As of October 25, India had still not announced its nutrient-based subsidy rates for the rabi season that began October 1 (Rural Voice, Oct 25, 2026) [18]. We flagged the lapse on September 30 (Crop Root Zone, TRZ-0242, Sep 30, 2026) [27].
Evidence: Without rates, private importers have stayed out. Most rabi imports so far have come from public-sector firms and cooperatives [18]. The retail price of DAP is still ₹1,350 per 50 kg bag, unchanged for four years. Fertilizer use is down about 15% this year after a weak monsoon [18]. Stocks are no longer the constraint they were in July. India held 23.06 lakh tonnes of DAP on October 16, which is 1.21 times the October requirement of 19.01 lakh tonnes, against a season requirement of 55.07 lakh tonnes (AgroSpectrum, Oct 27, 2026) [19]. On July 27 the figure was 16.52 lakh tonnes [23].
| India DAP, rabi 2026–27 | Lakh tonnes | Million tonnes | |
|---|---|---|---|
| Season requirement, Oct–Mar | 55.07 | 5.51 | ██████████ |
| Available to Oct 16 | 30.02 | 3.00 | █████░░░░░ |
| Closing stock, Oct 16 | 23.06 | 2.31 | ████░░░░░░ |
| October requirement | 19.01 | 1.90 | ███░░░░░░░ |
| Sold, Oct 1–16 | 6.97 | 0.70 | █░░░░░░░░░ |
Source: AgroSpectrum, Oct 27, 2026, citing government data as of Oct 16, 2026 [19]. Basis: product tonnes. Bars scaled to the season requirement = 10.
India's subsidy shortfall has not gone away. It has stopped mattering for price, because India is buying less. Our September arithmetic showed that the kharif package fully reimbursed an imported cargo only up to about $660/t CFR [23]. Unless the rabi rates rise sharply, an Indian importer still loses more than $200 on each tonne bought at $890–900. So India buys what its stock position forces and no more, and the CFR price has drifted only $25–35 lower since the $915–935 of late August [23]. Indian demand is no longer setting a higher floor under world DAP, but it is not pulling the floor down either.
4. What reaches a US farm this winter
What's new: US retail phosphate is edging up into winter while the barge holds flat. The one input whose cost has fallen sharply, sulfur, works on a lag that skips this season.
Evidence: DTN's October 19–23 survey put DAP at $939 a ton, up $13 on the month and 1.4% on the year, and MAP at $983, up $13 on the month and 5.5% on the year [13]. A week earlier the figures were $937 and $981 (DTN/Progressive Farmer, Oct 21, 2026) [14]. Corn Belt terminal values held at $850–875/st FOB for DAP and $860–885 for MAP. North Dakota spot warehouses quoted MAP at $920 [8].
| US phosphate, Oct 19–23, 2026 | DAP $/st | MAP $/st | Basis |
|---|---|---|---|
| Retail, national average | 939 | 983 | Delivered, DTN [13] |
| Retail, a year earlier | 926 | 932 | Delivered, DTN, Oct 20–24, 2025 [13] |
| Corn Belt terminal | 850–875 | 860–885 | FOB terminal [8] |
| NOLA barge | 800–805 | 815–820 | FOB barge [8] |
| NOLA barge, a year earlier | 750–760 | 700 | FOB barge [8] |
| Retail over barge midpoint | 136.50 | 165.50 | Our calculation |
Source: DTN/Progressive Farmer, Oct 28, 2026; Advanced Turf Solutions, Oct 26, 2026.
Compared with a year ago, the barge has risen more than retail: about $48/st on DAP against $13 at retail, and about $118/st on MAP against $51. The retail layer over the barge was $131.50 on DAP in the October 5–9 survey (Crop Root Zone, TRZ-0286, Oct 16, 2026) [29] and has widened only $5 since. That keeps the conclusion of that piece intact. Retail has little room to fall unless the barge falls first.
Sulfur is the input moving toward relief. Green Markets reported on October 23 that most Tampa participants were settling the fourth-quarter molten sulfur contract. The amount is behind its paywall (Green Markets, Oct 23, 2026) [20]. A US distributor survey reports the settlement at $615 per long ton CFR, $90 below the third quarter's record $705 [8]. We have not seen a second public source for the $615 figure. In China, the sulfur benchmark fell 26.95% in October to ¥5,614.25 a tonne on October 27 [6]. Indian trade press has delivered sulfur below $900 a tonne [18].
$32.40/st
Our estimate of the sulfur cost a $90-per-long-ton cut in the Tampa contract takes out of a short ton of DAP. It uses the 36-cents-per-dollar factor from our October sulfur pieces [28][30], and it reaches finished product made from fourth-quarter sulfur, not product already in the fall pipeline.
At the 139 lb of DAP per acre that delivers corn's survey-average 64 lb of P2O5 (Crop Root Zone, TRZ-0209, Sep 18, 2026) [26], $32.40/st is about $2.25 an acre. That is our estimate, and it assumes the full saving passes through to retail. It is a real number, and it is small next to the $48/st the barge has gained in a year. It also depends on idled US capacity restarting, which the market does not expect before winter. The distributor survey that reports the $615 settlement still forecasts $800–825/st NOLA DAP for November and December, citing idled plants and tight dealer inventories [8].
Ground Truth: For a winter fill decision, the useful reading is that nothing on the board is pushing US phosphate down before spring. China is not exporting. India is buying less, but its CFR is still above the NOLA barge in dollar terms. Sulfur relief has to pass through acidulation, which takes a quarter. The retail layer over the barge is already the thinnest in four Octobers. A buyer waiting for lower DAP or MAP this winter is waiting on an event, either a Chinese quota that actually ships or an Indian subsidy decision that cuts imports further. Neither has a date. The base case is retail within $10–20 of today's $939 and $983 through the winter fill window. If phosphate is the input you can carry, the timing choice is between buying now at known prices and waiting for one of those events. Waiting for the price trend is not a third choice, because the trend is flat.
5. What to watch
- China's October customs data, due around November 18–20. Any DAP or MAP volume would be the first evidence that quota is being used. A figure above 200,000 tonnes would mean the window is real. A figure near zero would mean the window will not matter before spring.
- The start of China's winter storage buying in mid-to-late November [5]. Once domestic stocking begins, export priority falls further. A Hubei DAP price below ¥4,500 before then would show domestic weakness is outrunning policy.
- India's rabi NBS rates. An announcement with a phosphorus rate high enough to bring private importers back is, in our view, the most likely trigger for a $25–50 rise in India's CFR, and NOLA would likely follow. A further delay keeps the CFR drifting at $890-plus.
- Price discovery on the new MIAX contracts. MIAX began trading physically settled 25-short-ton DAP and MAP contracts for delivery at New Orleans on October 19 (Fertilizer Daily, Oct 4, 2026) [21]. The CME screen has not moved in three weeks, so the first sizeable trades on a physically settled contract would be the first new US Gulf price signal since September.
- Mosaic's third-quarter results. We found no published release as of October 29. They will show whether the lower sulfur contract brings any idled phosphate capacity back before the spring pull.
This piece builds on our earlier phosphate coverage: the suspension's expiry (Crop Root Zone, TRZ-0136, Aug 28, 2026) [24], the split between nitrogen and phosphate prices (Crop Root Zone, TRZ-0179, Sep 10, 2026) [25], and the Moroccan duty suspension (TRZ-0209) [26]. The Moroccan duty-free window that piece described runs to about the end of February 2027.
References
- SunSirs, "Statistics on China's Fertilizer Imports and Exports for September," republished by ChemNet, Oct 19, 2026 (China Customs data; summary paragraph reports zero September DAP and MAP exports and January–September DAP 70,000 t, −97.1%, and MAP 110,000 t, −90.9%; the product table in the same article reports different figures, discussed in section 1). https://news.chemnet.com/news-10852.html ; https://www.sunsirs.com/uk/detail_news-36904.html
- Guosen Securities Economic Research Institute, 农化行业:2026年9、10月月度观察 (Agrochemicals: September–October 2026 monthly observations), Oct 26, 2026 (China Customs January–August DAP and MAP exports; Baiinfo domestic prices and margins at Sep 30; Longzhong China DAP FOB, Morocco DAP FOB and Shandong DAP at Sep 30). https://pdf.dfcfw.com/pdf/H3_AP202610261830933346_1.pdf
- SunSirs, "Major Fertilizer Varieties and Detailed Data for China's Imports and Exports from January to December 2025," Jan 23, 2026 (2025 DAP exports 3.48 Mt, MAP 1.88 Mt). https://www.sunsirs.com/uk/detail_news-29982.html
- Nongzi yu Shichang (enongzi.com), "肥料晨间行情:出口解禁首日,等待打破僵局" (Fertilizer morning report: first day of export reopening), Sep 1, 2026. https://www.enongzi.com/news/details/6f8407b4-347c-46a9-874b-612b267ebdb9
- Nongzi yu Shichang (enongzi.com), "肥料晨间行情:硫磺固液分化,肥价止跌企稳" (Fertilizer morning report), Oct 22, 2026. https://www.enongzi.com/news/details/90b51702-52ef-499c-9a0c-a99d71228d27
- Nongzi yu Shichang (enongzi.com), "肥料晨间行情:二铵补跌至4500,一铵四套价,钾肥近成本" (Fertilizer morning report: DAP falls to 4,500), Oct 27, 2026. https://www.enongzi.com/news/details/48b7f4ad-29be-483a-9739-56d2d32b8d05
- Fertilizer Daily, K. Clarksen, "China phosphate exports collapse to near zero in 2026 as sulfur squeeze bites, Argus sees 2mt rebound," Oct 15, 2026 (relaying Argus Media via the Western Producer). https://www.fertilizerdaily.com/20261015-china-phosphate-exports-2026-sulfur-argus/
- Advanced Turf Solutions, "U.S. Fertilizer Market Summary 10/26/2026" (prices as of Oct 23, 2026, with prior-week and year-ago columns). https://www.advancedturf.com/wp-content/uploads/2026/10/ATS-Fertilizer-Market-Update-10_26_2026.pdf
- Advanced Turf Solutions, "U.S. Fertilizer Market Summary 10/5/2026" (prices as of Oct 2, 2026). https://www.advancedturf.com/wp-content/uploads/2026/10/ATS-Fertilizer-Market-Update-10_5_2026.pdf
- Australian Fertilizer Corporation, Weekly Update — Global Fertiliser Markets, w/e Oct 23, 2026 (published Oct 26, 2026). https://ausfertcorp.com/weekly-update-global-fertiliser-markets-w-e-23-10-2026/
- Australian Fertilizer Corporation, Weekly Update — Global Fertiliser Markets, w/e Oct 16, 2026 (published Oct 19, 2026). https://ausfertcorp.com/weekly-update-global-fertiliser-markets-w-e-16-10-2026/
- Australian Fertilizer Corporation, Weekly Update — Global Fertiliser Markets, w/e Oct 2, 2026 (published Oct 6, 2026). https://ausfertcorp.com/weekly-update-global-fertiliser-markets-w-e-02-10-2026/
- DTN/Progressive Farmer, T. Neeley, "Fertilizer Prices Continue to Climb: UAN28 Posts 6% Increase in Latest DTN Survey," Oct 28, 2026 (survey week Oct 19–23, 2026; month-ago Sep 21–25; year-ago Oct 20–24, 2025). https://www.dtnpf.com/agriculture/web/ag/crops/article/2026/10/28/fertilizer-prices-continue-climb-6
- DTN/Progressive Farmer, R. Quinn, "UAN32, UAN28 and Anhydrous Lead Fertilizer Prices Higher," Oct 21, 2026 (survey week Oct 12–16, 2026). https://www.dtnpf.com/agriculture/web/ag/crops/article/2026/10/21/uan32-uan28-anhydrous-lead-prices
- Investing.com, DAP FOB NOLA Futures Historical Data (CME front month, delayed), settlements Oct 1–28, 2026, retrieved Oct 29, 2026. https://www.investing.com/indices/dap-fob-nola-futures-historical-data
- Trading Economics, "Di-ammonium Phosphate," accessed Oct 29, 2026 ($802.50 as of Oct 28; +4.66% year on year). https://tradingeconomics.com/commodity/di-ammonium
- World Bank, Commodities Price Data (The Pink Sheet), Oct 2, 2026 (DAP spot, FOB US Gulf, quarterly and monthly averages). https://thedocs.worldbank.org/en/doc/74e8be41ceb20fa0da750cda2f6b9e4e-0050012026/related/CMO-Pink-Sheet-October-2026.pdf
- Rural Voice, H. Singh, "Delayed Fertiliser Subsidy Decisions Keep Global DAP Prices High, Sulphur Shortage Persists," Oct 25, 2026. https://eng.ruralvoice.in/national/delayed-fertiliser-subsidy-decisions-keep-global-dap-prices-high-sulphur-shortage-persists.html
- AgroSpectrum India, "India has 199.48 Lakh Tonnes of fertiliser available for Rabi 2026–27; closing stock at 175.32 Lakh Tonnes," Oct 27, 2026 (data as of Oct 16, 2026). https://agrospectrumindia.com/news/24/35051/india-has-199-48-lakh-tonnes-of-fertiliser-available-for-rabi-202627-closing-stock-at-175-32-lakh-tonnes.html
- Green Markets (Bloomberg), "Sulfur," public excerpt: "Most Tampa sulfur market participants were reported settling fourth-quarter…," Oct 23, 2026 (headline only; the settlement value is in the members-only body). https://fertilizerpricing.com/sulfur-posts/
- Fertilizer Daily, "MIAX Certifies Four Physically Settled NOLA Fertilizer Futures Ahead of October 19 Launch," Oct 4, 2026. https://www.fertilizerdaily.com/20261004-miax-certifies-four-physically-settled-nola-fertilizer-futures-ahead-of-october-19-launch/
- China Economic Net via Sina Finance, CFETS USD/CNY central parity of 6.7220, Oct 16, 2026. https://cj.sina.com.cn/articles/view/1663612603/6328b6bb0200248kg
- Crop Root Zone, TRZ-0214, "China Reopened Phosphate Exports on September 1 Under License. India Is Paying $920 a Tonne for DAP, and Its Subsidy Covers $660.," Sep 21, 2026.
- Crop Root Zone, TRZ-0136, "China's Phosphate Export Suspension Runs Out This Month. US Retail DAP Is Already Up 11% Without It Lapsing.," Aug 28, 2026.
- Crop Root Zone, TRZ-0179, "Nitrogen Fell 20% Since May. Phosphate Rose 0.4%. That Is Not a Lag — It Is Two Different Export Policies.," Sep 10, 2026.
- Crop Root Zone, TRZ-0209, "Washington Suspended the 16.60% Moroccan Phosphate Duty on July 8. Ten Weeks Later Retail DAP Is $923/st — $13 Higher Than the Week It Was Signed.," Sep 18, 2026.
- Crop Root Zone, TRZ-0242, "India's Phosphate Subsidy Rates Expire Today With No Rabi Rates Published. Kharif Alone Used 77% of the Year's ₹54,000 Crore Budget Line.," Sep 30, 2026.
- Crop Root Zone, TRZ-0270, "Twelve Days Into the Quarter, Tampa Sulfur Is Still Unsettled at $705. Gulf Producers Cut October Prices $45 to $70, and a $50 Cut Is Worth $18 on a Ton of DAP.," Oct 12, 2026.
- Crop Root Zone, TRZ-0286, "Retail DAP Sits $131.50 Over the NOLA Barge, the Narrowest October Gap in Four Years. Measured Against Summer Fill, the Dealer's Markup Has Shrunk Three Falls Running.," Oct 16, 2026.
- Crop Root Zone, TRZ-0246, "The Fourth-Quarter Sulfur Price Is Not Public Yet. Every $100 a Long Ton It Settles Adds $36 to a Ton of DAP — and Lands on Spring 2027, Not This Fall.," Oct 1, 2026.
Disclosures
Crop Root Zone is an independent publication. Nothing here is investment advice. Market calls, where included, reflect the editors' own read and are not a recommendation to buy or sell any security.
Russia's Black Sea Ammonia Route Has Been Shut Since 2022, and Drones Cut Its Ammonia Output 7.5% This Year. The US Imports None of That Ammonia, but Took 36% of Its Urea and 58% of Its UAN From Russia in 2025.
The 2.5-million-tonne Togliatti–Odesa pipeline is still closed, the Baltic terminal built to replace it moved 560,000 tonnes in 2025, and the Taman terminal on the Black Sea is still not open. Since February, drone strikes on Russian nitrogen plants, the latest at Novomoskovsk on Oct 28, have helped cut Russian ammonia output 7.5% in January to May. The US bought no Russian ammonia in 2024 or 2025, so fall anhydrous is not exposed directly. The exposure is in spring products: Russia supplied 36% of US urea imports and 58% of US UAN imports in 2025. Europe now pays about $170 a tonne more for ammonia than the October Tampa contract, and Ukraine has become a net buyer of nitrogen. As of the morning of Oct 28, no public source had reported a November Tampa settlement.
Ukraine hit EuroChem's Novomoskovsk Azot nitrogen plant in Russia's Tula region on Wednesday morning, Oct 28. Footage showed thick black smoke over the site (Quantum Commodity Intelligence, Oct 28, 2026) [1]. It was at least the third reported strike on the plant this year. It also adds to a 2026 trend: Russian nitrogen supply is being lost at the plants as well as at the ports. Before 2022, Russian ammonia reached world markets mainly by a pipeline to the Black Sea at Odesa. That line has been shut since the invasion [2]. The Baltic terminal built to replace it ran at about half its rated capacity last year [4], and the Black Sea terminal at Taman is still unfinished [6]. This piece was assigned to cover the November Tampa ammonia settlement. As of this morning, no public source had reported it. Last year's November number was reported on Oct 27 (Quantum Commodity Intelligence, Oct 27, 2025) [22]. We have not estimated it. This piece covers the Black Sea and Ukraine nitrogen flows that will help decide it, and shows which US products are actually exposed. Our Sep 29 piece covered October's $10 cut to an implied $545 a tonne (Crop Root Zone, TRZ-0238, Sep 29, 2026) [23], and we do not repeat it here.
1. The Black Sea ammonia route is still shut, and its replacements have not filled the gap
What's new: Four and a half years after the pipeline stopped, Russia still has no working Black Sea outlet for ammonia. Its only dedicated seaborne ammonia terminal, at Ust-Luga on the Baltic, shipped less than a quarter of what the pipeline could carry.
Evidence: The Togliatti–Odesa line runs about 2,470 km from Togliatti on the Volga to Ukraine's Pivdennyi port. It could move up to 2.5 million tonnes of ammonia a year and has been shut since February 2022 (Reuters explainer via Pipeline & Gas Journal, Jun 6, 2023) [2]. Togliattiazot, the Uralchem company at its Russian end, lists capacity of 3.6 million tonnes of ammonia a year and had to cut utilization when the pipeline stopped (Interfax, Apr 27, 2026) [6]. An S&P Global analyst put Russia's pre-war ammonia supply to the world market at about 4 million tonnes a year (S&P Global via Hellenic Shipping News, Dec 24, 2024) [3].
Two terminals were meant to replace the pipeline. The Port Favor terminal at Ust-Luga opened in December 2024 with a stated capacity of 1 million tonnes a year and a target of almost 1.5 million tonnes for 2026 [3]. It shipped 0.56 million tonnes in 2025, then 61,000 tonnes in January 2026 and 53,300 tonnes in February. Ammonia still reaches the terminal by tank truck: 2,417 trucks in February alone (Interfax, Mar 4, 2026) [4]. At that two-month pace of about 57,000 tonnes a month, 2026 would end near 0.7 million tonnes. That is our extrapolation, not a reported figure. The Taman terminal on the Black Sea is planned at 2 million tonnes a year in its first phase. In April the Transport Ministry drafted an order to open a border checkpoint there, but the launch has slipped repeatedly since 2024 [6]. Ukraine struck port facilities on the Taman peninsula again in January (Quantum Commodity Intelligence, Jan 22, 2026) [5].
| Russian ammonia export outlet | Mt/year | Status, Oct 2026 | |
|---|---|---|---|
| Togliatti–Odesa pipeline, rated capacity | 2.50 | Shut since Feb 24, 2022 | ██████████ |
| Taman terminal, phase 1 capacity | 2.00 | Not open; checkpoint order drafted Apr 2026 | ████████░░ |
| Ust-Luga (Port Favor), stated capacity | 1.00 | Operating; 2026 target about 1.5 | ████░░░░░░ |
| Ust-Luga, actual 2025 shipments | 0.56 | Supplied by tank truck; rail line still pending | ██░░░░░░░░ |
| Ust-Luga, Jan–Feb 2026 shipments | 0.11 | Two months only | ░░░░░░░░░░ |
Source: Pipeline & Gas Journal (Reuters), Jun 6, 2023 [2]; S&P Global via Hellenic Shipping News, Dec 24, 2024 [3]; Interfax, Mar 4 and Apr 27, 2026 [4][6]. Basis: metric tonnes of anhydrous ammonia. Capacity is not output; the first three rows are ratings, the last two are tonnes shipped. Bars scaled to the pipeline = 10.
The constraint is also commercial. Even after Ust-Luga opened, a European supplier told S&P Global that Russian ammonia had only two regular import destinations: LAT Nitrogen at Rouen in France and a few Turkish buyers [3]. Without the pipeline, Russia can still make ammonia but has fewer ways to export it. Most of it is upgraded at home into urea, UAN and ammonium nitrate, which travel by ship in bulk.
Ground Truth: For a US buyer, the lost Russian ammonia matters for where it went, not for how much there is. Exported as ammonia, those tonnes competed with Trinidad, Algeria and the US Gulf for European and Mediterranean buyers. Converted into urea and UAN, they compete for the US spring market. The closure of the Black Sea route has therefore tightened the merchant ammonia market that Tampa is priced against, while adding Russian urea and UAN to the products a Corn Belt grower buys in spring. A Taman start-up would partly reverse both effects. Since it has been "this year" every year since 2023, we would not plan around it.
2. In 2026 the losses moved from the ports to the plants
What's new: Rosstat data show Russian ammonia output falling year on year in 2026, after rising through most of 2025. Plant owners and analysts attribute the decline mainly to repairs after drone strikes.
Evidence: A drone strike on Feb 25 hit Acron's Dorogobuzh plant, killed seven people and temporarily took out about 5% of Russia's fertilizer production capacity. The plant accounts for 11% of Russia's ammonium nitrate output and 9% of its NPK, and was expected back in May. EuroChem founder Andrei Melnichenko said in April that the strikes had an impact "significant enough" to matter (Reuters via Yahoo Finance, Apr 17, 2026) [10]. Drones were also launched at EuroChem's Nevinnomyssk Azot overnight on Mar 19 (Quantum Commodity Intelligence, Mar 19, 2026) [11]. The Tula governor reported strikes on Novomoskovsk on Jun 14 and Jun 26 (Liga.net, Jun 2026) [12], and the plant was hit again this morning [1].
| Date, 2026 | Plant | Owner | What is reported |
|---|---|---|---|
| Jan 22 | Taman port facilities | Port | Repeat strike on the Black Sea export site [5] |
| Feb 25 | Dorogobuzh | Acron | Seven killed; about 5% of Russian fertilizer capacity offline; restart expected May [10] |
| Mar 19 | Nevinnomyssk Azot | EuroChem | Drones launched overnight; damage not reported in public text [11] |
| Jun 14, Jun 26 | Novomoskovsk Azot | EuroChem | Industrial site and power line damaged, per regional governor [12] |
| Oct 28 | Novomoskovsk Azot | EuroChem | Plant ablaze after a "massive" drone attack; damage not yet reported [1] |
Source: as listed. Basis: event log from public reporting. Damage claims come from regional officials, company figures relayed by Reuters, or social-media footage, and none of them gives plant-level lost tonnes.
The national figures show the effect. Russian ammonia output fell 7% to 6.1 million tonnes in January to April, and April alone was down 11.2% at 1.4 million tonnes (Fertilizer Daily, citing Agroexport and Rosstat, Jun 3, 2026) [8]. Through May the decline was 7.5%, to 7.6 million tonnes, and ammonium nitrate was down 9%. Analysts quoted by Vedomosti put the main cause on unscheduled repairs after the strikes (The Moscow Times, Jun 30, 2026) [7]. Rosstat data relayed by TASS showed ammonia and mineral fertilizer output still lower year on year in January to July (Quantum Commodity Intelligence, Aug 27, 2026) [9]. The figures behind that report are paywalled, and we did not find a public nine-month number.
| Russian output, Rosstat | Period | Million tonnes | Change, year on year |
|---|---|---|---|
| Ammonia | April 2026 | 1.4 | −11.2% |
| Ammonia | Jan–Apr 2026 | 6.1 | −7.0% |
| Ammonia | Jan–May 2026 | 7.6 | −7.5% |
| Ammonium nitrate | Jan–May 2026 | 4.7 | −9.0% |
| Ammonium nitrate | May 2026 | 0.786 | −14.0% |
| Mineral fertilizer, 100% nutrient | Jan–Apr 2026 | 10.3 | −0.4% |
Source: Fertilizer Daily (Agroexport/Rosstat), Jun 3, 2026 [8]; The Moscow Times (Rosstat via Vedomosti), Jun 30, 2026 [7]. Basis: production, metric tonnes.
−7.5%
Russian ammonia output, January to May 2026, against the same months of 2025, at 7.6 million tonnes. Analysts attribute the drop mainly to repairs after drone strikes. (The Moscow Times, citing Rosstat via Vedomosti, Jun 30, 2026)
Moscow's export policy has not tightened in response. The quota for June 1 to Nov 30 allows 20.07 million tonnes of exports outside the Eurasian Economic Union, about 1.4 million more than the December-to-May quota. That includes 8.75 million tonnes for urea and other nitrogen grades and 4.26 million for ammonium nitrate (Fertilizer Daily, Apr 24, 2026) [13]. The one exception was a one-month halt on ammonium nitrate exports from Mar 21 to Apr 21 [7][10]. The current quota runs out in two days. The December-to-May quota that follows it covers the US spring import season.
Ground Truth: The quota is not what limits Russian nitrogen exports in 2026; the plants are. A quota raised by 1.4 million tonnes while ammonia output falls 7.5% is a ceiling that exports do not reach. That changes what to watch. A smaller December-to-May quota would be a policy signal. The supply number that matters is output, and output now depends on how quickly plants like Dorogobuzh and Novomoskovsk are repaired after each strike. That is a military question. Nobody can forecast it from fertilizer data, which is why the risk premium on spring urea and UAN is unlikely to disappear even if Gulf prices ease.
3. Where the US is exposed: urea and UAN, not the anhydrous tank
What's new: US customs data show that Russian nitrogen reaches the Corn Belt almost entirely as upgraded products. In 2024 and 2025 the US imported no Russian anhydrous ammonia. In 2025 Russia supplied 36% of US urea imports and 58% of US UAN imports.
Evidence: US-reported imports of anhydrous ammonia (HS 2814.10) were 2.03 million tonnes in 2025. Canada supplied 1.11 million and Trinidad and Tobago 0.77 million, and Russia does not appear as a supplier (UN Comtrade, accessed Oct 28, 2026) [14]. Urea (HS 3102.10) is a different picture. Russia shipped 1.89 million tonnes of the 5.23 million imported in 2025, up 47% from 1.29 million in 2024, and was the largest single origin. In UAN (HS 3102.80), Russia supplied 1.26 million of 2.17 million tonnes. Trinidad was a distant second at 0.51 million [14].
| US imports, 2025 | Total, Mt | From Russia, Mt | Russia's share | |
|---|---|---|---|---|
| Anhydrous ammonia | 2.03 | 0.00 | 0.0% | ░░░░░░░░░░ |
| Urea | 5.23 | 1.89 | 36.0% | ██████░░░░ |
| UAN | 2.17 | 1.26 | 58.1% | ██████████ |
Source: UN Comtrade, US-reported imports of HS 281410, 310210 and 310280 by partner, calendar 2025, accessed Oct 28, 2026 [14]. Shares are Crop Root Zone calculations. Basis: metric tonnes of product. Bars scaled to UAN = 10.
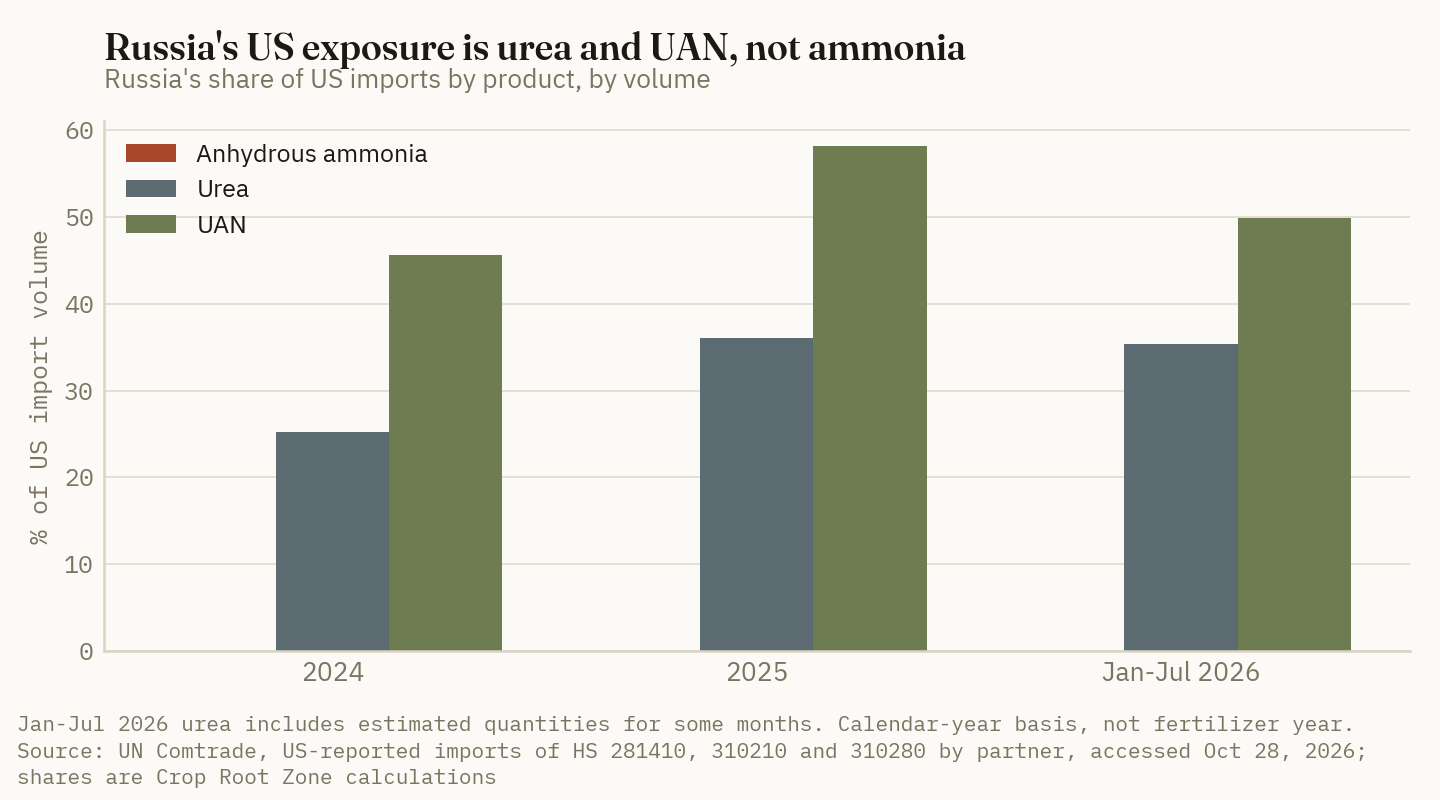
The 2026 record runs to July and shows the shares holding up despite lower Russian output. From January to July, Russia supplied 1.49 million of 4.20 million tonnes of US urea imports, or 35.4%, against 34.9% in the same months of 2025. Russian UAN fell to 0.70 million of 1.40 million tonnes, 49.9%, from 54.8% a year earlier [14]. Our Oct 14 piece covered the July detail: Russian UAN fell 70% in July, Algerian urea filled the gap left by Qatar, and Argus put Russia's fertilizer-year urea share at 42% (Crop Root Zone, TRZ-0278, Oct 14, 2026) [25]. That piece did not cover Russia's annual shares by product, which are set out here. August data were not yet published in Comtrade when we checked.
| US imports, Jan–Jul | 2025, Mt | 2026, Mt | Russia's share, 2025 | Russia's share, 2026 |
|---|---|---|---|---|
| Urea, total | 3.98 | 4.20 | — | — |
| Urea, from Russia | 1.39 | 1.49* | 34.9% | 35.4%* |
| UAN, total | 1.47 | 1.40 | — | — |
| UAN, from Russia | 0.80 | 0.70 | 54.8% | 49.9% |
Source: UN Comtrade, monthly US-reported imports by partner, accessed Oct 28, 2026 [14]. Shares are Crop Root Zone calculations. *Comtrade derived some 2026 urea quantities from reported value at a single unit price, so these are estimates. Basis: metric tonnes of product.
Ground Truth: Black Sea and Russian risk reaches a Corn Belt farm through the UAN tank and the urea pile, not the anhydrous nurse tank. A grower who switched from fall anhydrous to spring UAN to avoid this fall's $987 ammonia has moved from a supply chain with almost no direct Russian exposure into one where Russia supplies about half the imported product. That is not a reason to switch back. It is a reason to price spring UAN with the same care as fall anhydrous, and to read December-to-May Russian quota and plant news as UAN news. Anhydrous buyers face Russian risk only indirectly, through the Atlantic ammonia price discussed in the next section.
4. Europe and Ukraine are absorbing the shortfall, at a price Tampa does not yet show
What's new: The markets most exposed to lost Russian and Ukrainian nitrogen are paying well above Tampa. Europe pays about $170 a tonne over the October contract, Yara is curtailing European ammonia output, and Ukraine has become a large importer of nitrogen.
Evidence: Europe's tariff on Russian fertilizer stepped up on Jul 1. Nitrogen fertilizers from Russia and Belarus now pay €60 a tonne on top of the 6.5% ad valorem duty, rising to €80 in July 2027 and €315 from July 2028. If cumulative imports exceed 1.8 million tonnes in 2026–27, the top rate applies at once (Argus Media, Jun 12, 2025) [15]. Argus lists urea, ammonium sulfate, ammonium nitrate, CAN and UAN as covered and does not list anhydrous ammonia, so Russian ammonia sold into Rouen and Turkey falls outside the schedule.
| EU duty on Russian and Belarusian nitrogen fertilizer | €/tonne, plus 6.5% | Volume trigger for top rate |
|---|---|---|
| Jul 2025 – Jun 2026 | 40 | 2.7 Mt |
| Jul 2026 – Jun 2027 (now) | 60 | 1.8 Mt |
| Jul 2027 – Jun 2028 | 80 | 0.9 Mt |
| From Jul 2028 | 315 | — |
Source: Argus Media, Jun 12, 2025 [15]. Basis: specific duty per metric tonne of product, on top of the 6.5% ad valorem rate. Covers urea, ammonium sulfate, ammonium nitrate, CAN and UAN. Phosphate and compound grades follow a separate, higher schedule.
European ammonia prices are now well above the Atlantic contract. For the week to Oct 23, Europe was assessed at $710 to $720 a tonne CFR duty-paid, the Middle East at $450 to $490 FOB and East Asia at $490 to $530 CFR, with high European gas costs driving curtailments and import demand. The same report says Strait of Hormuz disruption is still affecting established ammonia routes (Australian Fertilizer Corporation, Oct 26, 2026) [16]. On Oct 27, North African FOB and Northwest European prices firmed again on reports of an Algerian deal (Quantum Commodity Intelligence, Oct 27, 2026) [17]. Yara, the seller in the Tampa contract, reported third-quarter EBITDA of $675 million, down from $804 million, citing accelerating European gas costs (Yara International, Oct 22, 2026) [18]. On its results call it indicated that curtailments might be in place at four of its European ammonia plants, where production was running at negative margins (Quantum Commodity Intelligence, Oct 22, 2026) [19]. A trade press headline the next day expected more European curtailments with November–December TTF gas above $30 per MMBtu (Quantum Commodity Intelligence, Oct 23, 2026) [20]. The EIA forecasts Henry Hub at $3.48 for 2026 (EIA, Oct 6, 2026) [21].
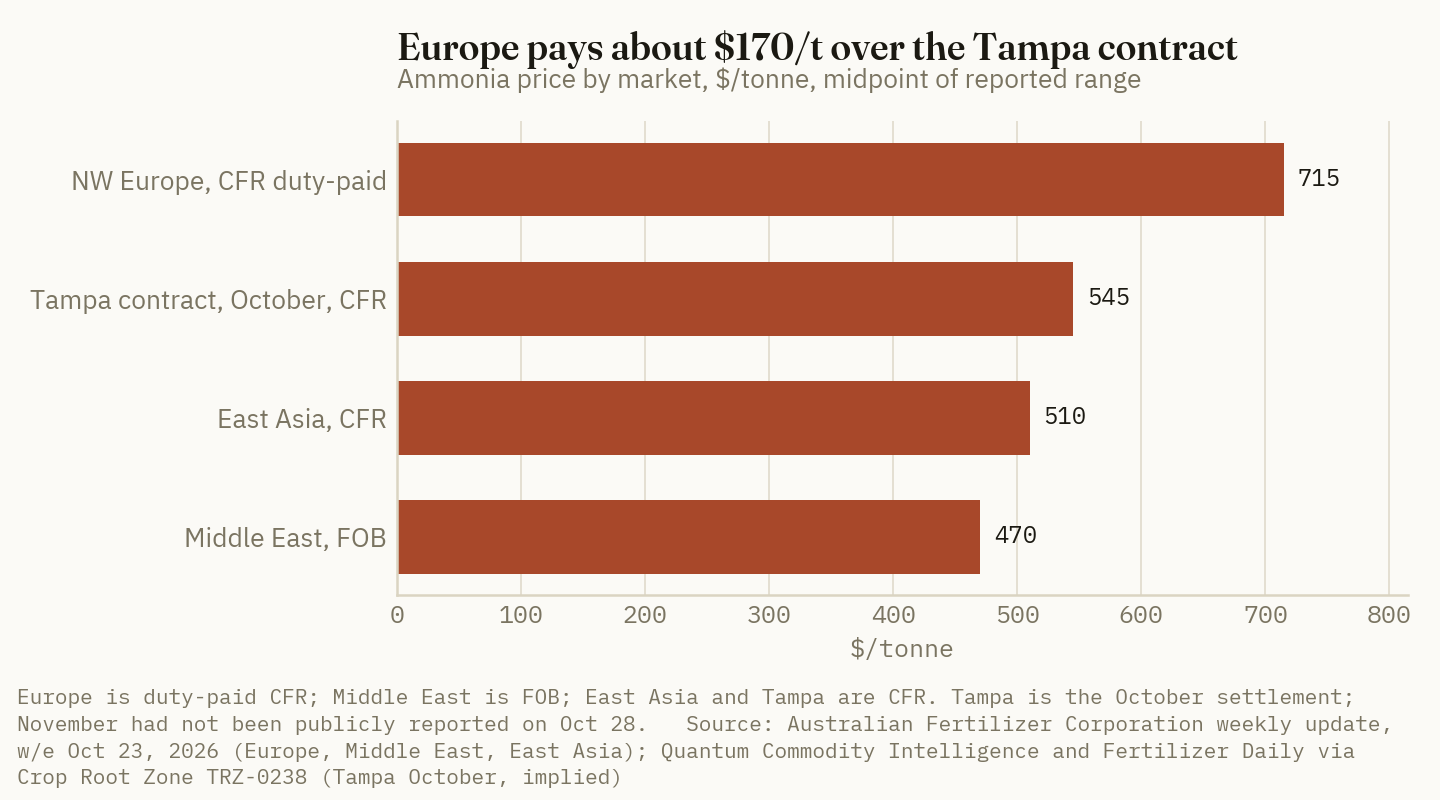
Ukraine, whose Pivdennyi port near Odesa was the pipeline's outlet [2], is now a large buyer of nitrogen. It imported about 1.2 million tonnes of fertilizer in the first quarter of 2026, up 13%, including 693,000 tonnes of nitrogen, the fastest-growing category. Urea came mainly from Nigeria. Prices nearly doubled between December and March, and the market was still short of compound fertilizers on Apr 1 (AgroReview, Apr 11, 2026) [24]. Those tonnes compete for the same Mediterranean and North African supply Europe is drawing on.
Ground Truth: A $170 premium for Europe over Tampa is the strongest public evidence on the November contract. Tampa is a bilateral price, but Yara supplies it from the same Atlantic pool it is short of in Europe. When Northwest Europe pays $710 to $720 duty-paid and Algerian sellers are firming, a Tampa ton below $550 is the cheapest outlet in the Atlantic for a seller with choices. The October cut was driven by Mosaic's reduced offtake and new Texas supply [23]. Neither has changed in the past month, but the European pull has grown. We read the balance of pressure for November as flat to higher, not lower. This is an editorial read, not an estimate of the settlement, and a further cut would mean Texas tonnes are covering more of Tampa than the public record shows.
5. What this means for fall anhydrous, and what to watch
What's new: Retail anhydrous went into late October at $987 a ton, $42 above mid-September, while the most recent published Tampa contract was $10 lower. The November settlement, normally reported in the last days of October, is the next wholesale reference point.
Evidence: DTN's Oct 12–16 survey put retail anhydrous at $987 a ton, or $0.60 a pound of N, up 4.4% on the month and $149 on the year. UAN28 was $441, UAN32 $486 and urea $674. Seven of the eight products rose on the month (DTN/Progressive Farmer, Oct 21, 2026) [26]. Our Oct 15 piece put the Oct 5–9 retail price $483 over the October contract and explained the gap by summer-fill cost (Crop Root Zone, TRZ-0282, Oct 15, 2026) [27]. One week later, measured the same way, the gap is $493. The implied October contract of $545 a tonne is $494 a short ton, against $987 at retail.
| Reference | Value | Basis | Date |
|---|---|---|---|
| Tampa contract, Nov 2024 | 560* | $/t CFR | Implied, per TRZ-0238 [23] |
| Tampa contract, Nov 2025 | 650 | $/t CFR | Reported Oct 27, 2025 [22] |
| Tampa contract, Oct 2026 (implied) | 545 | $/t CFR | Reported Sep 2026 [23] |
| Tampa contract, Nov 2026 | not reported | $/t CFR | None found as of Oct 28, 2026 |
| Retail anhydrous, Oct 12–16 | 987 | $/st delivered | DTN, Oct 21, 2026 [26] |
| Retail over Oct contract | 493 | $/st | Crop Root Zone calculation |
| NW Europe ammonia, w/e Oct 23 | 710–720 | $/t CFR duty-paid | AFC, Oct 26, 2026 [16] |
Source: as listed. *Implied from December 2024's reported $10 rise to $570. Tampa converted to short tons at 1.10231 st per tonne. The retail-over-contract figure compares a delivered retail price with an import contract price. It is not a retailer margin, and it includes freight, storage, application season and summer-fill inventory cost.
The exposure numbers in section 3 set the size of what is at stake. A direct Russian ammonia supply shock would not reach US anhydrous through customs, because none is imported. It would reach US anhydrous through Tampa, and only to the extent that Europe outbids Florida for the same Atlantic cargoes. US Gulf production cushions that. It runs on Henry Hub gas, which the EIA forecasts at $3.48 for 2026 [21], while European plants face TTF above $30 for November and December [20]. A shock to Russian urea or UAN would reach the US directly, in the products and the season where Russia's share is largest.
Five things to watch:
- The November Tampa settlement. Any report in the next few days settles the question this piece could not. A rollover at $545 or a rise would confirm that the European pull is outweighing Texas supply. A cut would mean the reverse.
- Novomoskovsk damage. No tonnage loss was public at publication [1]. A long outage would weigh mainly on Russian urea and ammonium nitrate, not on ammonia exports.
- The December-to-May Russian quota. The current quota expires Nov 30 [13]. Its nitrogen line is the closest public guide to how much Russian urea and UAN the US spring market can count on.
- Taman. Any confirmed first cargo would be the first new Black Sea ammonia route since 2022 [6]. It would reduce the Atlantic premium and, through Europe, the pressure on Tampa.
- DTN's late-October and November surveys. If retail anhydrous keeps rising while Tampa holds or falls, the increase is coming from the retail tier and not from Black Sea supply.
Ground Truth: For a grower who still needs fall anhydrous, the Black Sea is not a reason to rush. The direct exposure is zero, the indirect one runs through a Tampa contract that has not yet been reported, and retail already sits about $490 over the last contract a retailer could buy against. The larger decision is spring. A Corn Belt operation that plans to apply UAN or urea in 2027 is buying from a supply chain in which Russia holds a third to a half of imports, Russian plants are being struck, and the December-to-May quota is about to be set. Pricing part of the spring product before the quota and the post-strike output data are known is a reasonable hedge. Waiting to price all of it means taking that risk in full.
References
- Quantum Commodity Intelligence, "Eurochem's Novomoskovskiy plant ablaze after 'massive' drone attack: reports," Oct 28, 2026 (headline and summary; full text paywalled; page carried a relative timestamp only) — https://www.qcintel.com/ammonia/article/eurochem-s-novomoskovskiy-plant-ablaze-after-massive-drone-attack-reports-76150.html
- Pipeline & Gas Journal (Reuters), "Explainer: Black Sea Grain Deal Could Hinge on Ammonia Pipeline," Jun 6, 2023 — https://pgjonline.com/news/2023/june/explainer-black-sea-grain-deal-could-hinge-on-ammonia-pipeline
- S&P Global Commodity Insights, "New Russian ammonia export terminal met with skepticism by European market," republished by Hellenic Shipping News, Dec 24, 2024 (S&P Global original returned HTTP 403) — https://www.hellenicshippingnews.com/?p=1069441
- Interfax, Ust-Luga Port Favor ammonia transshipment, February 2026, Mar 4, 2026 — https://interfax.com/newsroom/top-stories/116439/
- Quantum Commodity Intelligence, "Taman attack highlights Russia's ammonia export hurdles," Jan 22, 2026 (summary; full text paywalled) — https://www.qcintel.com/ammonia/article/taman-attack-highlights-russia-s-ammonia-export-hurdles-57172.html
- Interfax, Transport Ministry draft order on a Taman checkpoint for Togliattiazot's ammonia terminal, Apr 27, 2026 — https://interfax.com/newsroom/top-stories/117337/
- The Moscow Times, "Russian Ammonium Nitrate Output Falls After Drone Attacks Disrupt Chemical Plants," Jun 30, 2026 — https://www.themoscowtimes.com/2026/06/30/russian-ammonium-nitrate-output-falls-after-drone-attacks-disrupt-chemical-plants-a93132
- Fertilizer Daily, "Russia fertilizer output declines in April 2026 amid weaker ammonia and sulfur production," Jun 3, 2026 — https://www.fertilizerdaily.com/20260603-russia-fertilizer-output-declines-in-april-2026-amid-weaker-ammonia-and-sulfur-production/
- Quantum Commodity Intelligence, "Russian ammonia, fertiliser production slows for Jan-July," Aug 27, 2026 (summary; full text paywalled) — https://www.qcintel.com/ammonia/article/russian-ammonia-fertiliser-production-slows-for-jan-july-71811.html
- Reuters (Olesya Astakhova), "Russian billionaire says Ukrainian drone attacks affect nitrogen fertiliser trade," via Yahoo Finance, Apr 17, 2026 — https://finance.yahoo.com/markets/commodities/articles/russian-billionaire-says-ukrainian-drone-131036808.html
- Quantum Commodity Intelligence, "Ukraine targets Russia's Nevinnomyssk Azot fertiliser plant overnight," Mar 19, 2026 (summary; full text paywalled) — https://www.qcintel.com/ammonia/article/ukraine-targets-russia-s-nevinnomyssk-azot-fertiliser-plant-overnight-61102.html
- Liga.net, "In Russia's Tula Region, drones attacked Novomoskovsk. The 'Azot' chemical plant is on fire," Jun 2026 (citing Tula governor Dmitry Milyaev) — https://news.liga.net/en/war/news/in-russias-tula-region-drones-attacked-novomoskovsk-the-azot-chemical-plant-is-on-fire-video
- Fertilizer Daily, "Russia limits fertilizer exports to 20 million tons through November 2026," Apr 24, 2026 (Government Resolution No. 431 of Apr 17, 2026) — https://www.fertilizerdaily.com/20260424-russia-limits-fertilizer-exports-to-20-million-tons-through-november-2026/
- UN Comtrade, US-reported imports of HS 281410 (anhydrous ammonia), 310210 (urea) and 310280 (UAN) by partner, annual 2024–2025 and monthly January–July 2025 and 2026, accessed Oct 28, 2026 — https://comtradeplus.un.org/
- Argus Media, "EU adopts new Russia, Belarus tariffs," Jun 12, 2025 — https://www.argusmedia.com/en/news-and-insights/latest-market-news/2698185-eu-adopts-new-russia-belarus-tariffs
- Australian Fertilizer Corporation, "Weekly Update, Global Fertiliser Markets, w/e 23.10.2026," Oct 26, 2026 — https://ausfertcorp.com/weekly-update-global-fertiliser-markets-w-e-23-10-2026/
- Quantum Commodity Intelligence, "Ammonia prices firm on Algerian deal reports," Oct 27, 2026 (summary; full text paywalled; date inferred from the page's relative timestamp and the "on Tuesday" reference) — https://www.qcintel.com/ammonia/article/ammonia-prices-firm-on-algerian-deal-reports-76107.html
- Yara International ASA, "Yara reports solid 3Q amid market volatility," Oct 22, 2026 — https://www.inderes.se/en/releases/yara-international-asa-yara-reports-solid-3q-amid-market-volatility
- Quantum Commodity Intelligence, "Yara makes the case for ammonia imports in Q3 results call," Oct 22, 2026 (summary; full text paywalled) — https://www.qcintel.com/ammonia/article/yara-makes-the-case-for-ammonia-imports-in-q3-results-call-75830.html
- Quantum Commodity Intelligence, "More Europe ammonia curtailments likely as Nov-Dec TTF surpasses $30/mmBTU," Oct 23, 2026 (headline only) — https://www.qcintel.com/ammonia/
- U.S. Energy Information Administration, Short-Term Energy Outlook, natural gas, Oct 6, 2026 — https://www.eia.gov/outlooks/steo/report/natgas.php
- Quantum Commodity Intelligence, "Tampa reaches multi-year high of $650/mt CFR for November," Oct 27, 2025 — https://www.qcintel.com/ammonia/article/tampa-reaches-multi-year-high-of-650-mt-cfr-for-november-51511.html
- Crop Root Zone, TRZ-0238, "The Tampa Ammonia Contract Fell $10 for October. In the Last Two Falls It Rose $30 and $50, and Retail Anhydrous Followed It Up.," Sep 29, 2026.
- AgroReview (Maria Lysenko), "Fertilizer Imports to Ukraine Increased, but Market Shortage Persists in 2026," Apr 11, 2026 — https://agroreview.com/en/newsen/crops/fertilizer-imports-ukraine-increased-but/
- Crop Root Zone, TRZ-0278, "US Urea Imports More Than Doubled in July. Ammonia Imports Hit Their Lowest July Since at Least 2019, and UAN Fell a Third.," Oct 14, 2026.
- DTN/Progressive Farmer, "UAN32, UAN28 and Anhydrous Lead Fertilizer Prices Higher," Oct 21, 2026 (survey week Oct 12–16, 2026) — https://www.dtnpf.com/agriculture/web/ag/crops/article/2026/10/21/uan32-uan28-anhydrous-lead-prices
- Crop Root Zone, TRZ-0282, "Retail Anhydrous Rose $39 in the Month the Tampa Contract Fell. At $977 It Sits $483 Over Wholesale, and Only Summer-Fill Cost Still Explains the Gap.," Oct 15, 2026.
Disclosures
Crop Root Zone is an independent publication. Nothing here is investment advice. Market calls, where included, reflect the editors' own read and are not a recommendation to buy or sell any security.
Retail Anhydrous Sits $435 a Ton Over the Tampa Ammonia Contract. Last Fall the Gap Held Near $275.
The $171 year-on-year rise in retail anhydrous that USDA's deputy secretary cited at an Iowa antitrust hearing came while the September Tampa contract rose only $15 a tonne. The retail-over-Tampa spread held between $273 and $278 a ton from September to December 2025 and has run $373 to $439 in every month checked since March. Allowing for tanks filled on earlier, higher contracts cuts the year-on-year widening to about $37 with a one-month lag and reverses it with a two-month lag, so October and November retail prints will show which reading is right.
Retail anhydrous ammonia averaged $938 a ton in the survey week of Aug 31–Sep 4, up from $767 in the same week of 2025 (DTN/Progressive Farmer, Sep 9, 2026). That $171 rise was the number USDA Deputy Secretary Stephen Vaden put in front of more than 170 farmers from 13 states on Friday at an Iowa Corn Growers Association hearing billed as "Fed Up: Fertilizer Cartels Profit off Farmers," where he urged growers to keep pressing the federal antitrust inquiries into the industry (DTN/Progressive Farmer, Sep 14, 2026). The wholesale benchmark the retail number is usually compared with barely moved over the same year. Yara and Mosaic settled the September Tampa ammonia contract at $555 a tonne CFR (Fertilizer Daily, Sep 10, 2026), against $540 for September 2025 (Profercy, Sep 30, 2025). The public prices can measure how far retail has drifted from wholesale, and when the gap opened. They cannot, on their own, tell you whose margin the gap is.
1. The first survey after an $80 cut showed retail anhydrous rising
What's new: The Aug 31–Sep 4 survey was DTN's first taken entirely after the September Tampa settlement, which cut the contract by $80 a tonne, had been reported. Retail anhydrous rose $15 a ton on the week before.
Evidence: The weekly retail series had fallen $41 in the two weeks to Aug 24–28. Then it turned up.
| Survey week, 2026 | Anhydrous, $/ton retail | Week-on-week | |
|---|---|---|---|
| Jul 27–31 | 960 | — | ██████░░░░ |
| Aug 3–7 | 963 | +3 | ██████░░░░ |
| Aug 10–14 | 964 | +1 | ██████░░░░ |
| Aug 17–21 | 943 | −21 | ████░░░░░░ |
| Aug 24–28 | 923 | −20 | ██░░░░░░░░ |
| Aug 31–Sep 4 | 938 | +15 | ████░░░░░░ |
Sources: DTN/Progressive Farmer, Aug 19, Aug 26, Sep 2 and Sep 9, 2026 (delivered retail, weekly survey averages). Bars scale $900–$1,000 across ten blocks, so small moves look large.
DTN still reports anhydrous as "slightly lower" than a month ago, because the comparison week (Aug 3–7) was $963. On a pound-of-nitrogen basis the new print is $0.57, against $0.71 for urea and UAN32 and $0.75 for UAN28 (DTN/Progressive Farmer, Sep 9, 2026). A week-to-week move of $15 is within the noise of a survey average and should not be read as a trend. What matters is the direction in the first week after wholesale was cut, because that week is when a retailer's replacement cost fell below what it had paid for the product already in its tanks.
Ground Truth: A retail price that does not follow a wholesale cut in the first week tells you the tank is being priced off what the retailer already owns, not what the next load will cost. That is normal inventory behaviour. It also means the fall anhydrous price is being set partly by summer contracts that no longer exist. A grower comparing quotes this month is really comparing retailers' inventory positions, and those vary more between neighbouring dealers than any national average shows. In a falling wholesale market, a second quote is worth more than usual.
2. The spread held for four months, then widened by about $100 into March
What's new: Converting each monthly Tampa settlement to short tons and setting it against DTN's retail survey for the same month gives a retail-over-wholesale spread. It sat in a $5 band from September through December 2025. It widened by about $50 in January and by roughly another $50 by March, a stretch that includes the start of the Middle East supply shock, and it has not narrowed since.
Evidence:
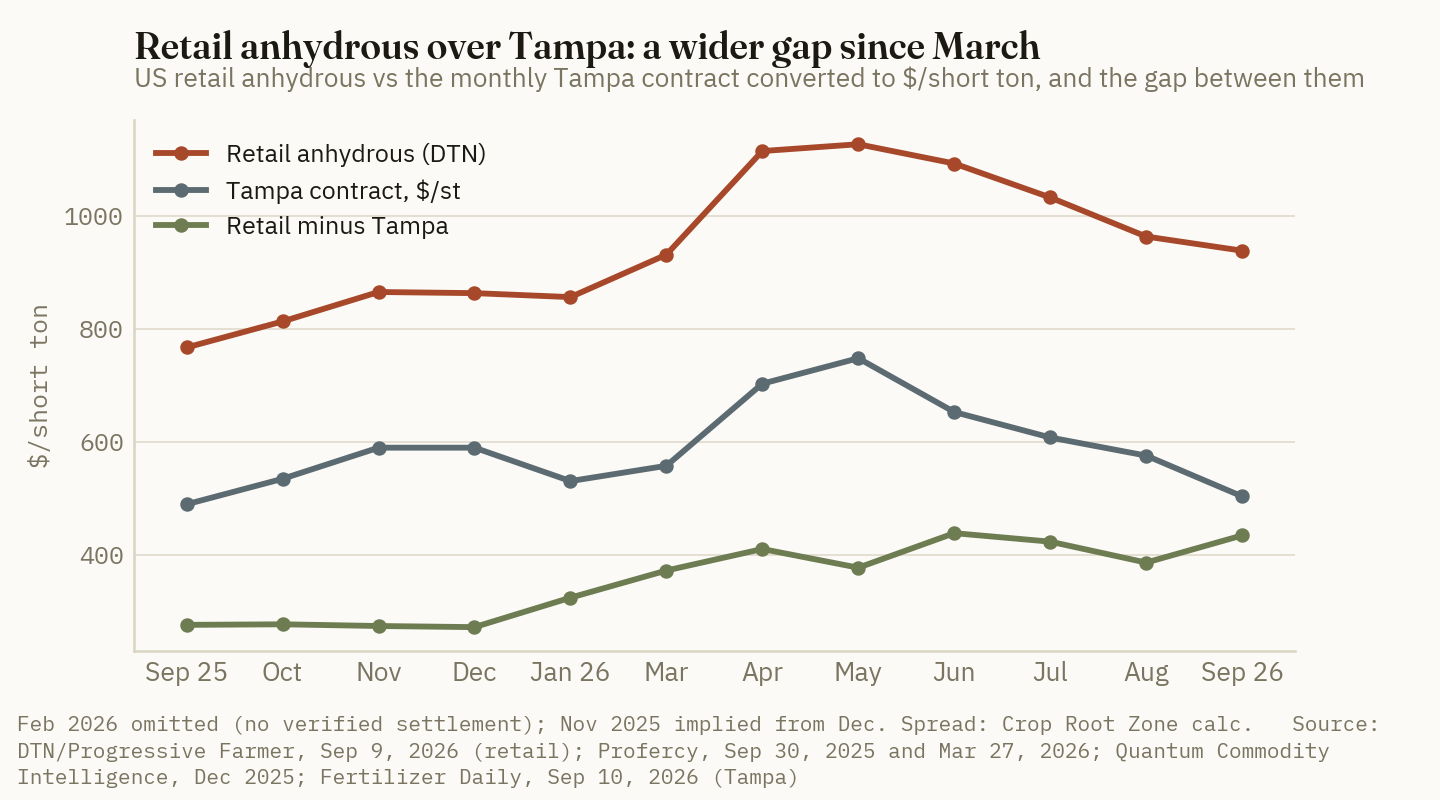
| Month | Retail anhydrous, $/ton | Tampa, $/t CFR | Tampa, $/short ton | Retail minus Tampa, $/short ton |
|---|---|---|---|---|
| Sep 2025 | 767 | 540 | 490 | 277 |
| Oct 2025 | 813 | 590 | 535 | 278 |
| Nov 2025 | 865 | 650* | 590 | 275 |
| Dec 2025 | 863 | 650 | 590 | 273 |
| Jan 2026 | 856 | 585 | 531 | 325 |
| Mar 2026 | 931 | 615* | 558 | 373 |
| Apr 2026 | 1,114 | 775 | 703 | 411 |
| May 2026 | 1,126 | 825 | 748 | 378 |
| Jun 2026 | 1,092 | 720 | 653 | 439 |
| Jul 2026 | 1,032 | 670 | 608 | 424 |
| Aug 2026 | 963 | 635 | 576 | 387 |
| Sep 2026 | 938 | 555 | 504 | 435 |
Sources: Retail — DTN/Progressive Farmer, Sep 9, 2026 (survey weeks Sep 1–5, Sep 29–Oct 3, Nov 24–28 and Dec 22–26, 2025; Jan 19–23, Mar 16–20, Apr 13–17, May 11–15, Jun 8–12, Jul 6–10, Aug 3–7 and Aug 31–Sep 4, 2026). Tampa — Profercy, Sep 30, 2025 (Sep, Oct); Quantum Commodity Intelligence, Dec 2025 (Dec, Jan); Profercy, Mar 27, 2026 (Apr); Fertilizer Daily, Sep 10, 2026 (May–Sep). *November 2025 is implied by the December contract being reported as unchanged at $650; March 2026 is implied by April's $775 being $160 above March. February 2026 is omitted because this desk has not verified that settlement. Short-ton conversion (÷ 1.1023) and spreads are Crop Root Zone calculations. The Oct 27–31, 2025 and Feb 16–20, 2026 retail rows are not used.
$435/short ton
Retail anhydrous over the September Tampa contract, against $277 a year earlier. (Crop Root Zone calculation from DTN/Progressive Farmer, Sep 9, 2026; Fertilizer Daily, Sep 10, 2026; Profercy, Sep 30, 2025)
The spread is not a margin. Tampa is a delivered-to-Florida contract between one supplier and one phosphate producer. Much of the anhydrous sold in the Corn Belt moves from domestic plants by pipeline, barge and rail, so the spread also covers inland freight, terminal storage, distributor and retail handling of a pressurised product, credit and application equipment. Some of those costs rose this year. Illinois farm diesel was $4.65 a gallon on Aug 7, up 54% on the year (farmdoc daily, Aug 11, 2026), and $5.45 by Sep 4 (USDA AMS Illinois Production Cost Report, Sep 4, 2026). A higher diesel bill will widen a delivered-price spread without anyone's margin changing.
Ground Truth: The timing is what stands out. Freight and handling costs did rise this year, but not by $100 a ton in three months, and the spread did. A risk premium added during a supply emergency should shrink as the emergency eases, and Tampa has fallen $270 a tonne since May. The spread has not shrunk. Six months after the shock, that is the most specific public evidence the hearing could have used, and the headline $171 figure leaves it out.
3. How much of the gap is the lag depends on the lag you assume
What's new: A retailer's September price reflects product bought earlier. Last year that product was bought in a rising wholesale market and this year in a falling one, which flatters the 2025 spread and penalises the 2026 one when both are measured against the same month's contract.
Evidence: Tampa rose from $392 a tonne in June 2025 (Fertilizer Week, Jun 2025) to $417 in July and $487 in August (Quantum Commodity Intelligence, Jul and Aug 2025), then $540 in September. This year it fell from $720 in June to $670, $635 and $555 (Fertilizer Daily, Sep 10, 2026). Testing the September retail price against different lags:
| Wholesale cost assumed in the tank | Spread, Sep 2025 | Spread, Sep 2026 | Change on the year |
|---|---|---|---|
| Same month's contract (no lag) | 277 | 435 | +157 |
| Prior month's contract (one-month lag) | 325 | 362 | +37 |
| Contract two months earlier (two-month lag) | 389 | 330 | −59 |
| June–August contract average | 375 | 326 | −50 |
All values $/short ton. Crop Root Zone calculations from DTN/Progressive Farmer retail (Sep 9, 2026) and the Tampa settlements cited above. The June and July 2025 levels come from reported settlements and changes ($392, then +$25). Which lag is right varies by retailer and is not published; the table shows the range, not an answer.
The same test can be run across the year. With a one-month lag, the spread was $266 to $330 from October 2025 through January 2026, an average of about $298, and $344 to $379 from June through September 2026, an average of about $360. Allowing one month of inventory, then, the gap is still roughly $60 wider than last fall. Only a lag of two months or more makes it narrower than a year ago.
Feedstock cost does not explain the retail rise either. The World Bank's US natural gas price averaged $2.77 per MMBtu in August 2026, against a $3.03 average for July–September 2025 (World Bank Pink Sheet, Sep 2, 2026). At an assumed 33 MMBtu per tonne of ammonia, a figure typical of efficient plants and used here as an estimate, that is roughly $9 a tonne less gas cost. What did rise was the cost of the marginal import. European gas averaged $21.11 per MMBtu in August against an $11.29 average for July–September 2025 (World Bank Pink Sheet, Sep 2, 2026), and one market update put an efficient European plant's ammonia break-even near $837 a tonne ex-works (Fertilizer Daily, Sep 10, 2026, relaying the Australian Fertilizer Corporation). In this desk's reading, North American ammonia is priced against import parity, not against domestic gas, which is why producer margins can widen while US gas gets cheaper. That is a separate question from the retail spread, and it is the one the antitrust inquiries are more likely to be examining.
Ground Truth: The lag argument has a shelf life, and that makes the claim testable. Tanks filled on $635–$670 summer contracts turn over during fall application. Once they are refilled at or near $555, the lag explanation for a $435 spread runs out. If DTN's late-October and November surveys still put retail anhydrous above $900 with Tampa at or below $555, the widening is not inventory timing. For a grower the practical point comes sooner: ask whether a fall quote is priced off tons already in the tank or tons still to be delivered, because in a falling wholesale market those are different prices.
4. Anhydrous is the only major nutrient running ahead of its wholesale reference
What's new: DTN now publishes exact year-ago prices for the same survey week, so the retail change for each nutrient can be set against a public wholesale reference. Anhydrous is the outlier. Urea and potash retail prices are running behind their wholesale references.
Evidence:
| Product | Retail, Sep 1–5 2025 | Retail, Aug 31–Sep 4 2026 | Retail YoY | Wholesale reference | Wholesale YoY |
|---|---|---|---|---|---|
| Anhydrous | 767 | 938 | +22.3% | Tampa contract, Sep vs Sep, $/t CFR | +2.8% |
| DAP | 860 | 919 | +6.9% | Trading Economics DAP, Sep 14 | +5.3% |
| Urea | 632 | 655 | +3.6% | Trading Economics urea, Sep 14 | +14.0% |
| Potash | 487 | 493 | +1.2% | World Bank potassium chloride, Aug 2026 vs Q3 2025 avg | +8.3%* |
| UAN32 | 481 | 455 | −5.4% | No free public benchmark | — |
Sources: DTN/Progressive Farmer, Sep 9, 2026 (delivered retail, $/ton); Profercy, Sep 30, 2025 and Fertilizer Daily, Sep 10, 2026 (Tampa); Trading Economics, accessed Sep 15, 2026 (urea $453/t and DAP $800/t on Sep 14, 2026); World Bank Pink Sheet, Sep 2, 2026 ($386.9/t in Aug 2026 against a $357.2/t Q3 2025 average). *Period mismatch: month against quarterly average. The wholesale series use different bases, units and dates. Year-on-year percentages are shown for direction, not level.
| Retail YoY minus wholesale YoY | Points | |
|---|---|---|
| Anhydrous | +19.5 | ██████████ ahead |
| DAP | +1.6 | █ ahead |
| Potash | −7.1 | ████ behind |
| Urea | −10.4 | █████ behind |
Crop Root Zone calculation from the table above. Bars scale absolute gap to ten blocks at 19.5 points.
Urea is the clearest counter-case. Trading Economics' urea price rose 18.1% in the month to Sep 14 while the retail average printed $655 in two consecutive weekly surveys (Trading Economics, accessed Sep 15, 2026; DTN/Progressive Farmer, Sep 2 and Sep 9, 2026). DAP retail has broadly tracked its wholesale reference. The CoBank analysis DTN relayed alongside the survey said the lasting effects of the Middle East conflict and tight supplies could keep prices elevated into 2027. It noted that 12% of US urea and 17% of US DAP/MAP use comes from the Persian Gulf region (DTN/Progressive Farmer, Sep 9, 2026).
Ground Truth: The two pressures point in opposite directions, and a fall-and-spring nitrogen plan is exposed to both. Anhydrous retail is ahead of wholesale, so if it converges, it converges down. Urea retail is behind wholesale, so if it converges, it converges up. The anhydrous discount to urea narrowed this year mostly because anhydrous rose. If both products close their gaps with wholesale over the winter, that discount could widen from both sides at once. That argues for pricing fall anhydrous late in the season and not treating August's urea level as the level a spring top-dress buyer will see.
5. What settles it, and when
What's new: Three public data points over the next ten weeks will show whether the $435 spread is inventory timing or something that lasts.
Evidence: The October Tampa settlement is normally agreed in the last days of the prior month; last year's was reported on Sep 30 (Profercy, Sep 30, 2025). DTN publishes a retail survey every week. USDA AMS publishes the Illinois Production Cost Report every two weeks. Its Sep 4 edition had the Illinois distributor anhydrous ask at $892.50 a ton FOB, up $2.50 (USDA AMS, Sep 4, 2026). That was $45.50 under the national retail average, although the geographies differ. The table below shows what retail anhydrous would be at the September contract if the spread returned to earlier levels. These are scenarios, not forecasts.
| If the retail spread over a $555/t Tampa contract returns to | Retail anhydrous, $/ton | $/lb N | Saving vs $938 at 150 lb N/acre |
|---|---|---|---|
| $435 (today) | 938 | 0.572 | $0.00 |
| $375 (Sep 2025 against its summer average) | 878 | 0.536 | $5.44 |
| $325 (Sep 2025 against the prior month's contract) | 828 | 0.505 | $10.02 |
| $277 (Sep 2025, same month) | 781 | 0.476 | $14.40 |
Crop Root Zone scenarios. $/lb N uses 1,640 lb of N per short ton of 82% anhydrous. 150 lb N/acre is an illustrative rate. Excludes application, inhibitor and freight differences between retailers.
At a typical fall rate the difference between today's spread and last September's is about $14 an acre. That is real money, but it is smaller than the roughly $21-an-acre discount anhydrous already holds over urea at 150 pounds, using DTN's $0.57 and $0.71 per-pound prices (DTN/Progressive Farmer, Sep 9, 2026). The spread question changes how much a grower pays for anhydrous. It does not, at these levels, change whether anhydrous is the cheapest nitrogen.
Ground Truth: Put the dates on the calendar in order. The October Tampa settlement arrives first and sets the replacement cost. DTN's surveys for the last two weeks of October are the first taken after a full turn of fall inventory. November's Illinois reports show whether distributor asks moved with them. If the spread is still near $435 in mid-November, the public record will have done what the hearing did not: separated a lag from a margin. A grower who has not booked all fall tons by then will have better information than the headline $171.
References
- DTN/Progressive Farmer, Russ Quinn, "6 of 8 Fertilizer Prices Lower, Led by UAN28," Sep 9, 2026 (retail survey Aug 31–Sep 4, 2026; includes monthly price table from Sep 1–5, 2025 and CoBank commentary) — https://www.dtnpf.com/agriculture/web/ag/news/crops/article/2026/09/09/6-8-fertilizer-prices-lower-led
- DTN/Progressive Farmer, Chris Clayton, "Deputy Ag Secretary Encourages Farmers to Keep Pressure on Fertilizer Industry," Sep 14, 2026 — https://www.dtnpf.com/agriculture/web/ag/news/crops/article/2026/09/14/deputy-ag-secretary-encourages-keep
- DTN/Progressive Farmer, "Fertilizer Prices Fall as UAN28, Urea Lead the Way Lower," Sep 2, 2026 (retail survey Aug 24–28, 2026) — https://www.dtnpf.com/agriculture/web/ag/crops/article/2026/09/02/fertilizer-prices-fall-uan28-urea
- DTN/Progressive Farmer, "UAN28 Leads Fertilizer Price Declines for Fifth Consecutive Week," Aug 26, 2026 (retail survey Aug 17–21, 2026) — https://www.dtnpf.com/agriculture/web/ag/crops/article/2026/08/26/uan28-leads-fertilizer-price-fifth
- DTN/Progressive Farmer, "5 Fertilizer Prices Slightly Lower Than Last Month; 3 Higher," Aug 19, 2026 (retail survey Aug 10–14, 2026) — https://www.dtnpf.com/agriculture/web/ag/crops/article/2026/08/19/5-fertilizer-prices-slightly-lower-3
- Fertilizer Daily, "Tampa ammonia price drops to $555/t in September — 4th straight monthly decline from $825 peak," Sep 10, 2026 (May–September 2026 settlements) — https://www.fertilizerdaily.com/20260910-tampa-ammonia-price-555-september-2026-fourth-monthly-decline/
- Profercy, "International ammonia prices maintain upward march on capacity constraints," Sep 30, 2025 (September 2025 $540/t and October 2025 $590/t CFR Tampa) — https://www.profercy.com/insights/international-ammonia-prices-maintain-upward-march-on-capacity-constraints
- Profercy, "Ammonia prices start to soar as curtailments at key production hubs begin to bite," Mar 27, 2026 (April 2026 $775/t CFR, up $160 from March) — https://www.profercy.com/insights/ammonia-prices-start-to-soar-as-curtailments-at-key-production-hubs-begin-to-bite
- Quantum Commodity Intelligence, "December Tampa ammonia contract remains at $650/mt CFR," Dec 2025 — https://www.qcintel.com/ammonia/article/december-tampa-ammonia-contract-remains-at-650-mt-cfr-54096.html
- Quantum Commodity Intelligence, "Tampa contract drops to $585/mt CFR for January," Dec 2025 — https://www.qcintel.com/ammonia/article/tampa-contract-drops-to-585-mt-cfr-for-january-55576.html
- Quantum Commodity Intelligence, "Yara and Mosaic's Tampa ammonia settlement jumps $25/mt for July," Jul 2025 — https://www.qcintel.com/ammonia/article/yara-and-mosaic-s-tampa-ammonia-settlement-jumps-25-mt-for-july-43550.html
- Quantum Commodity Intelligence, "Tampa ammonia contract spikes by $70/mt for August," Aug 2025 ($487/t CFR) — https://www.qcintel.com/ammonia/article/tampa-ammonia-contract-spikes-by-70-mt-for-august-45526.html
- Fertilizer Week (on X), June 2025 Tampa settlement at $392/t CFR, Jun 2025 — https://x.com/FertilizerWeek1/status/1932006554338783728
- World Bank, Commodities Price Data (The Pink Sheet), Sep 2, 2026 — https://thedocs.worldbank.org/en/doc/74e8be41ceb20fa0da750cda2f6b9e4e-0050012026/related/CMO-Pink-Sheet-September-2026.pdf
- Trading Economics, Urea, accessed Sep 15, 2026 ($453/t on Sep 14, 2026; +18.12% month, +13.96% year) — https://tradingeconomics.com/commodity/urea
- Trading Economics, Di-ammonium, accessed Sep 15, 2026 ($800/t on Sep 14, 2026; +5.26% year) — https://tradingeconomics.com/commodity/di-ammonium
- USDA AMS, Illinois Production Cost Report (Bi-weekly), Sep 4, 2026 — https://www.ams.usda.gov/mnreports/ams_3195.pdf
- farmdoc daily, Paulson, Schnitkey, Batts, Zwilling and Zulauf, "Fertilizer and Fuel Prices Higher Heading into Fall 2026," Aug 11, 2026 — https://farmdocdaily.illinois.edu/2026/08/fertilizer-and-fuel-prices-higher-heading-into-fall-2026.html
- Fertilizer Daily, "DAP holds at $915–935/t as phosphate stays tight while potash softens on weak Brazilian demand," Sep 10, 2026 (relaying Australian Fertilizer Corporation weekly update, w/e Aug 28, 2026; European ammonia break-even) — https://www.fertilizerdaily.com/20260910-dap-phosphate-price-potash-weekly-market-september-2026/
Disclosures
Crop Root Zone is an independent publication. Nothing here is investment advice. Market calls, where included, reflect the editors' own read and are not a recommendation to buy or sell any security.
A Long-Grain Rice Acre Needs $15.88 to Match 2027 Soybeans on Arkansas's Lowest-Cost Budget. Cash Is Near $15. PLC Pays $145 a Base Acre Whichever Crop You Plant.
Rough rice rallied to $17.89 on a 33-year-low crop. We repriced the University of Arkansas budgets for this year's fuel and urea. An owner-operator covers full cost at $15.26 to $16.42 per cwt and matches soybeans at $15.88 to $17.04. A 25% share tenant needs $18.14 to $19.69. PLC does not belong in that comparison, because it pays on base acres, and every $1 of price rally takes about $50 per base acre out of it. Roughly 276,000 added acres would equal the entire projected long-grain carryout.
January rough rice futures closed at $17.89 per cwt on October 30, near the top of a 52-week range that starts at $9.56 (Investing.com, Oct 30, 2026) [2]. The reason is a short crop. USDA forecasts 157.7 million cwt of U.S. rice, the smallest since 1993/94, with long-grain at 103.2 million cwt, the smallest since 1987/88 (USDA ERS, Oct 14, 2026) [3]. Our July 18 piece told growers to treat $14 as the recent ceiling [23]. The market went through it within three months. That makes the 2027 question a live one: what does a long-grain acre have to earn to cover full cost, and to beat soybeans on the same ground? The University of Arkansas has not posted its 2027 rice budget yet, so we repriced the 2026 set. On the lowest-cost budget, an owner-operator needs $15.88 to match soybeans. A tenant on a 25% share needs more than $18. Federal price support does not change either number.
1. The price: a real rally, with a wide basis
What's new: USDA raised its 2026/27 long-grain season-average farm price by 50 cents to $14.00, against $10.40 for 2025/26. It cut the all-rice yield and left use unchanged, which took long-grain ending stocks down to 21.1 million cwt (USDA ERS, Oct 14, 2026) [3]. Arkansas harvested 775,000 long-grain acres, its smallest figure since 1977/78 [3]. Mississippi's June long-grain number was 45,000 acres (Arkansas Rice Update, Jul 2, 2026) [6].
Evidence: Futures overstate what reaches the farm. The Arkansas Farm Bureau put Arkansas basis at $2.00 to $2.50 under the board in early October [4].
| Measure | $/cwt | $/bu | Date | Basis |
|---|---|---|---|---|
| Rough rice, Nov 2026 | 17.155 | 7.72 | Oct 26 | CME settlement |
| Rough rice, Jan 2027 | 17.65 | 7.94 | Oct 26 | CME settlement |
| Rough rice, Jan 2027 | 17.89 | 8.05 | Oct 30 | Close, as listed by Investing.com |
| Rough rice, Mar 2027 | 18.02 | 8.11 | Oct 26 | CME settlement |
| Mid-South long-grain cash | 14.75–15.00 | 6.64–6.75 | First week of Oct | USDA ERS |
| Arkansas cash, Nov board less basis | 14.66–15.16* | 6.59–6.82* | Oct 26 | Estimate |
| Arkansas cash, Jan board less basis | 15.39–15.89* | 6.93–7.15* | Oct 30 | Estimate |
| Arkansas mill bid, fall delivery | 12.89 | 5.80 | Aug 14 | Arkansas Rice Update, for scale |
| USDA season-average, 2026/27 | 14.00 | 6.30 | Oct 14 | Farm price forecast |
| USDA season-average, 2025/26 | 10.40 | 4.68 | Oct 14 | Farm price estimate |
Sources: USDA AMS report 1655, Oct 26, 2026 [1]; Investing.com [2]; USDA ERS, Oct 14, 2026 [3]; Arkansas Rice Update, Aug 14, 2026 [5]. *Crop Root Zone estimates: a basis quoted on October 2 [4] applied to later futures. Rice converts at 45 lb per bushel.
No Mid-South price in this table is a 2027 price. All of them are for the 2026 crop, and we could not find a September or November 2027 rough rice settlement or a published 2027 mill bid. Limits on demand are visible too. Arkansas long-grain white milled rice was $36.50 per cwt FOB mill in the week of October 26 [1], or about $805 per metric ton. India's 5% broken white was about $384 on October 9 [3]. Those bases differ and the comparison is rough, but the gap is large. USDA holds long-grain exports at 50 million cwt and long-grain imports at a record 43 million [3].
2. The acre: what full cost looks like after this year's fuel
What's new: The Arkansas 2026 budgets were built on fall 2025 inputs, with diesel at $2.46 and urea at $560 a ton. On October 6 the university estimated what that missed. Diesel averaged $4.22 from March through September, and urea was up about 39% as of May. That adds $118.69 an acre to rice and $34.22 to soybeans (UADA, Oct 6, 2026) [10]. Rice took the largest increase of any crop in the analysis. The authors say the fuel analysis will be built into the 2027 budgets [10], which had not been posted for rice when we checked [22].
Evidence: We added those amounts to the published budgets and held everything else fixed. The rice budgets assume 30 acre-inches of flood and no land charge. We used the furrow-irrigated soybean budget, at 12 acre-inches, as the alternative.
| Arkansas budget, per acre | Conventional | Clearfield | Hybrid | Soybeans, furrow |
|---|---|---|---|---|
| Budget yield (bu) | 170 | 170 | 190 | 60 |
| Operating, fall 2025 inputs | $826.40 | $914.99 | $976.81 | $471.99 |
| Machinery, irrigation, overhead | $222.41 | $222.41 | $222.41 | $142.39 |
| Total specified, as published | $1,048.81 | $1,137.40 | $1,199.22 | $614.38 |
| UADA fuel and urea estimate | $118.69 | $118.69 | $118.69 | $34.22 |
| Updated total* | $1,167.50 | $1,256.09 | $1,317.91 | $648.60 |
| Full-cost price, own land* | $15.26/cwt | $16.42/cwt | $15.41/cwt | $10.81/bu |
| Full-cost price, 25% share tenant* | $20.35/cwt | $21.89/cwt | $20.55/cwt | $14.41/bu |
Sources: UADA 2026 budgets [7][8][9]; UADA, Oct 6, 2026 [10]. *Crop Root Zone calculation at budget yields. All costs are carried by the operator, as in the UADA lease sheets. UADA's single rice figure is applied to all three seed systems. The hybrid column uses the budget's 190 bushels and no quality discount. UADA's own March sheet priced hybrid at $5.10 and 200 bushels against $5.80 for Clearfield, so a real discount would raise the hybrid lines.
The update is an estimate of 2026, not a forecast of 2027. Fuel and fertilizer have since moved in opposite directions. Diesel was $5.47 on October 5 [10], and a weekly survey had urea near $580 in mid-August [5]. At those prices the conventional budget adds $130.67 to rice and $58.43 to soybeans (Crop Root Zone calculation). The rice total rises, but the soybean match in Section 3 falls 16 cents to $15.72, because the urea relief offsets most of rice's extra fuel and soybeans have no urea to offset theirs. At $5.47, pumping 35.4 gallons of flood water costs $194 an acre.
Two outside checks support the math. At USDA's July price of $6.08 and a 20% share, Scott Stiles put the total-cost break-even near 245 bushels and the loss at 200 bushels close to $225 (UADA, Aug 12, 2026) [11]. Our conventional deck gives 251 bushels and $215. Mississippi State's November 2025 budget for straight-levee rice, at 27 acre-inches, comes to $1,124.06 on 160 bushels, or $15.61 per cwt, before any fuel update and excluding land, management and overhead [12].
Published figures still range widely, and the definitions differ.
| Source | Cost | Yield | Implied $/cwt | What it includes |
|---|---|---|---|---|
| LSU planning budgets, via Louisiana Farm Bureau | n/a | n/a | 11.00–12.00 | "Depending on" land rent; not read directly |
| MSU zero-grade, 19 ac-in | $1,060.27 | 160 bu | 14.73 | No land or overhead; $2.94 diesel |
| MSU straight levee, 27 ac-in | $1,124.06 | 160 bu | 15.61 | No land or overhead; $2.94 diesel |
| UADA conventional, updated | $1,167.50 | 170 bu | 15.26 | No land; fuel and urea update |
| UADA Clearfield, updated | $1,256.09 | 170 bu | 16.42 | No land; fuel and urea update |
| Mississippi Delta estimate, via RFD-TV | $1,411.00 | 80 cwt* | 17.64* | Assumptions not stated |
Sources: Louisiana Farm Bureau, Jul 30, 2026 [15]; MSU, Nov 2025 [12]; UADA [7][8][10]; RFD-TV, Jul 27, 2026 [14]. *Inferred: the reported $331 loss equals 80 cwt at the $13.50 price the article cites.
We could not reconcile LSU's range with the others. It was reported secondhand, and LSU's own files would not open for us. Treat it as a Louisiana figure until the 2027 budget appears.
$15.88 per cwt
The price at which a conventional-seed Arkansas rice acre matches soybeans at full cost on owned land, or $7.15 a bushel. Clearfield needs $17.04. (Crop Root Zone calculation from UADA 2026 budgets and UADA, Oct 6, 2026)
3. The comparison: three lines, depending on who owns what
What's new: Soybeans are the alternative, and they have a price too. September 2027 soybeans settled at $12.145 on October 30, and Stuttgart was bidding $12.07 on the current crop (USDA AMS, Oct 30, 2026) [16]. The report does not print November 2027. We take $0.55 off September 2027, the middle of the 50-to-60-cent harvest basis UADA described for river terminals [17], for a 2027 price of $11.60 (Crop Root Zone estimate). At 60 bushels that returns $47 an acre above updated full cost on owned land.
Evidence: The match price depends on which costs you count and who takes the crop share.
| Rice price to match soybeans, $/cwt | Conventional | Clearfield | Hybrid |
|---|---|---|---|
| Owner, operating costs only (one-year decision) | 14.84 | 15.99 | 15.03 |
| Owner, full cost | 15.88 | 17.04 | 15.97 |
| Tenant, 25% share, operating costs only | 16.75 | 18.29 | 17.33 |
| Tenant, 20% share, full cost | 17.58 | 19.02 | 17.93 |
| Tenant, 25% share, full cost | 18.14 | 19.69 | 18.58 |
Source: Crop Root Zone calculation from UADA budgets [7][8][9][10], soybeans at 60 bu and $11.60 [16][17]. Same share on both crops. Estimates, excluding PLC, ARC and insurance indemnities. MSU's fall budgets give $16.14 on straight-levee rice against furrow soybeans at the same price, before any fuel update [12][13].
Here is where those lines sit against the market.
| $/cwt | Price | |
|---|---|---|
| USDA 2025/26 long-grain | 10.40 | █████░░░░░ |
| USDA 2026/27 long-grain | 14.00 | ███████░░░ |
| Owner match, operating only (conventional) | 14.84 | ████████░░ |
| Mid-South cash, top of early-Oct range | 15.00 | ████████░░ |
| Owner covers full cost (conventional) | 15.26 | ████████░░ |
| Owner match, full cost (conventional) | 15.88 | ████████░░ |
| Arkansas cash on Jan board, top of range* | 15.89 | ████████░░ |
| PLC reference price | 16.90 | █████████░ |
| Owner match, full cost (Clearfield) | 17.04 | █████████░ |
| Jan 2027 rough rice futures | 17.89 | █████████░ |
| Tenant match, 25% share (conventional) | 18.14 | █████████░ |
| Tenant match, 25% share (Clearfield) | 19.69 | ██████████ |
Sources: USDA ERS [3]; Investing.com [2]; Arkansas Farm Bureau [4]; Crop Root Zone calculations above. *Estimate.
Yield moves the line as much as price does, so we also solved it the other way. Drying, hauling and check-off at about 66 cents a bushel move with yield.
| Rice price ($/cwt) | Conv: cover / match soy (bu) | Clearfield: cover / match soy (bu) | Hybrid: cover / match soy (bu) |
|---|---|---|---|
| 14.00 | 187 / 196 | 203 / 211 | 211 / 220 |
| 15.00 | 173 / 181 | 188 / 196 | 196 / 204 |
| 16.00 | 161 / 169 | 175 / 182 | 182 / 190 |
| 17.00 | 151 / 158 | 164 / 170 | 171 / 177 |
Source: Crop Root Zone calculation on owned land, from UADA budgets [7][8][9][10], soybeans at 60 bu and $11.60. For scale, USDA's August long-grain yield forecast was 169.8 bu [5].
Most of the decision is timing within a rotation. The question is usually how many years of soybeans to run before the next rice crop, and each number here is the difference for one year in that sequence.
The levers, against the conventional-seed match prices above:
| Change | Effect on match price ($/cwt) |
|---|---|
| Soybeans ±$1.00/bu | ±0.78 |
| Soybean yield ±5 bu | ±0.76 |
| Rice yield 180 bu instead of 170 | −0.80 |
| Diesel ±$1.00/gal | ±0.30 |
| Urea ±$100/st | ±0.22 |
| Electric well: remove the pumping fuel increase on both crops | −0.49 |
| Tenant only: share 20% instead of 25% | −0.56 |
| Tenant only: landlord pays 25% of drying and pumping | −0.95 |
Source: Crop Root Zone sensitivities on the conventional budget, not forecasts. The first six rows are measured from the owner's $15.88, and the tenant rows from the 25% share's $18.14. The electric row removes the fuel increase and does not reprice power. Neither budget carries a separate rotation credit, so use your own yields for rice after soybeans or continuous rice.
Ground Truth: At these prices the acres that come back will belong to owner-operators on electric or shallow wells who still have the levee and pumping equipment. For them, on an operating-cost decision, the soybean line is $14.84 on conventional seed and $15.03 on hybrid, which is about where cash sits. Tenants are a different case. A 25% share takes a quarter of a $1,150 revenue line while leaving the whole cost bill in place, so the tenant's match sits more than $2 above the owner's. Expect the fight over 2027 acres to take place in lease terms rather than on the board. A landlord who wants rice back should expect to be asked to carry part of the drying and water. That is worth nearly a dollar a hundredweight to the tenant, and more than a five-point cut in the share.
4. PLC: real money that does not belong in the rotation math
What's new: The statutory long-grain reference price rose 21% to $16.90 per cwt, or $7.61 a bushel, starting with the 2025 crop (MSU Extension, updated Aug 8, 2025) [20]. Arkansas's April estimate for 2025 was a $2.93-a-bushel rate on a $4.68 season price. At a 139-bushel PLC yield, that is $326.45 per base acre after 85% and 5.7% sequestration (UADA, Apr 2026) [18]. Farmdoc estimated $344 per long-grain base acre before sequestration and said payments should arrive by the end of October, with rice prices not yet final as of its October 13 article (farmdoc daily, Oct 13, 2026) [19]. We could not confirm the final 2025 season price, which was due October 30 [18].
Evidence: The 2026 crop payment depends on where this rally settles. At USDA's $14.00, it is about $145 per base acre. PLC cannot be earned or lost through the 2027 planting choice. It pays on base acres and payment yields, not on what is planted [21]. Even the one-time 30 million new base acres for 2026 were allocated on 2019 through 2023 history [21].
| Long-grain season price ($/cwt) | PLC rate ($/cwt) | PLC rate ($/bu) | Per base acre, after 85% and 5.7% |
|---|---|---|---|
| 10.40 (2025/26 estimate) | 6.50 | 2.93 | $326 |
| 14.00 (USDA 2026/27, Oct) | 2.90 | 1.31 | $145 |
| 15.00 | 1.90 | 0.86 | $95 |
| 16.00 | 0.90 | 0.41 | $45 |
| 16.90 | 0.00 | 0.00 | $0 |
Source: Crop Root Zone calculation from [3][18][20], using the 139-bu PLC yield in UADA's example [18]. Your farm's payment yield and your lease will change the figure. The 2026 season price is a forecast, and on the 2025 calendar [18] payment would follow its publication in late October 2027. Assumes 5.7% sequestration continues.
So PLC is a short rice position on rice base. Each $1 rise in the season price takes about $50 per base acre out of the payment. A 170-bushel rice acre gains $76.50 from the same dollar, so an owner with one base acre for each planted acre keeps about $26. If that base is planted to soybeans, the owner loses the $50 and has no rice to sell. Do not add the payment to the rice column. It is the same in both columns, and it cancels.
Ground Truth: PLC changes a farm's cash flow, not its crop choice. The 2025 check of roughly $326 per base acre arrives now, in time to fund 2027 inputs, and it arrives whether or not the farm grew rice in 2026. But 2027 budgets built with a PLC line in the rice column will overstate rice's edge by the whole payment. A farm with heavy rice base and no rice planted is also the operation most exposed to this rally, because its income falls as the price rises. Planting some rice, or pricing what is planted, hedges that exposure. That is a better argument for keeping rice in the rotation than any margin on this page.
5. The acres: how fast the rally can undo itself
What's new: Nobody has published a 2027 long-grain acreage estimate that we could find. The starting point is clear, though: 1.395 million U.S. long-grain acres in NASS's June report and 1,382,498 certified to FSA by August [5][6]. Arkansas alone planted more than 1.3 million in 2024 [5].
Evidence: Long-grain ending stocks of 21.1 million cwt against 167 million cwt of use (117 million domestic and residual, 50 million exports) come to about 12.6% (USDA ERS, Oct 14, 2026; Crop Root Zone arithmetic) [3]. Each 100,000 harvested acres at 7,643 pounds [5] adds 7.6 million cwt, which is 36% of that carryout. About 276,000 added acres would equal all of it, with demand held flat. That is a 20% increase on this year's planted base. If all of it went to Arkansas, the state would still be below its 2024 level. Exports and domestic use would respond long before stocks reached zero, so this is a measure of scale and not a forecast.
Ground Truth: Above about $16 the market pays for acres, and it does not need many. We expect 2027 long-grain plantings to recover by 150,000 to 300,000 acres, on our own read, not a published number. The upper half of that range would leave no room for a $17 cash price in 2027/28. We described the same risk for dry beans on October 31, where the last price above $40 bought the acres that ended it. Treat any 2027 bid that nets $16 or better at your own elevator or mill as a price to sell into for part of the crop. Do not plan on cash reaching the $17.89 screen, which is a 2026 crop quote before a $2-plus basis.
What to watch:
- The University of Arkansas 2027 rice budgets, which should settle the fuel assumption [10][22]. Rerun this table on them.
- The first 2027 mill and dryer bids. Those are the real test, and none are public yet.
- ERS's next Rice Outlook, due November 13 [3], and whether USDA moves the $14.00 price toward the cash market.
- Final 2025 PLC rates from FSA, and your farm's payment yield.
- Urea and diesel into winter. Rice has 42 gallons and 330 pounds of urea in its budget, against 19 gallons and none for soybeans [7][9].
References
- USDA AMS Livestock, Poultry and Grain Market News, "Weekly National Rice Summary," report 1655, Oct 26, 2026. https://www.ams.usda.gov/mnreports/ams_1655.pdf
- Investing.com, Rough Rice futures page, January 2027 contract, shown closed 30/10, read Nov 2, 2026. Third-party quote, not an exchange record. https://www.investing.com/commodities/rough-rice
- USDA ERS, "Rice Outlook: October 2026," RCS-26I, Oct 14, 2026. https://www.ers.usda.gov/media/29744/rcs-26i.pdf
- Arkansas Farm Bureau, "Market Briefs," Oct 2, 2026. https://www.arfb.com/news/2026/oct/02/market-briefs-october-2-2026/
- University of Arkansas System Division of Agriculture (UADA), "Arkansas Rice Update 8-14-26." https://arkansascrops.uada.edu/posts/crops/rice/arkansas-rice-update-8-14-26.aspx
- UADA, "Arkansas Rice Update 7-2-26," citing USDA NASS June Acreage. https://arkansascrops.uada.edu/posts/crops/rice/arkansas-rice-update-7-2-26.aspx
- UADA, "2026 Rice Enterprise Budget, Conventional Seed," workbook. https://uaex.uada.edu/farm-ranch/economics-marketing/farm-planning/rice_conventional_2026.xlsx
- UADA, "Rice, Clearfield and Hybrid, with March 2026 update," workbook. https://uaex.uada.edu/farm-ranch/economics-marketing/farm-planning/budgets/ricehybrid_spotprice_030126.xlsx
- UADA, "Soybean, EnlistE3, Furrow Irrigated, with March 2026 update," workbook. https://uaex.uada.edu/farm-ranch/economics-marketing/farm-planning/budgets/soybeanenliste3_spotprice_030126.xlsx
- Hightower, M., UADA, "War-restricted shipping in Mideast adds estimated $343M in costs to Arkansas farmers," analysis by R. Loy and S. Stiles, Oct 6, 2026. https://uaex.uada.edu/media-resources/news/2026/october/10-06-2026-ark-cost-of-war.aspx
- UADA, "Rice Research and Extension field day takes frank look at the road ahead," Aug 12, 2026. https://www.uaex.uada.edu/media-resources/news/2026/august/08-12-2026-ark-rrec-field-day-26.aspx
- Mississippi State University, Department of Agricultural Economics, "Rice 2026 Planning Budgets," Budget Report 2025-04, Nov 2025. https://www.agecon.msstate.edu/whatwedo/budgets/docs/26/MSURICE26.pdf
- Mississippi State University, Department of Agricultural Economics, "Soybeans 2026 Planning Budgets," Budget Report 2025-02, Nov 2025. https://www.agecon.msstate.edu/whatwedo/budgets/docs/26/MSUSOY26.pdf
- St. James, T., RFD-TV, "Rice Crop Nears Historic Low As Losses Persist," Jul 27, 2026. https://www.rfdtv.com/rice-crop-nears-historic-low-as-losses-persist
- Shipley, A., Louisiana Farm Bureau News, "The Price of Rice: Why a Good Crop Does Not Always Mean Strong Returns," Jul 30, 2026. https://lafarmbureaunews.com/news/2026/7/30/the-price-of-rice-why-a-good-crop-does-not-always-mean-strong-returns
- USDA AMS Livestock, Poultry and Grain Market News, "Arkansas Daily Grain Bids," report 2960, Oct 30, 2026. https://www.ams.usda.gov/mnreports/ams_2960.pdf
- UADA, "YEAREND: 2026 enterprise budgets 'a step in the right direction,'" Dec 22, 2025. https://uaex.uada.edu/media-resources/news/2025/december2025/12-22-2025-ark-yearend-enterprise-budgets.aspx
- UADA, "USDA April Outlook for 2025 PLC Payments," 2026. https://arkansascrops.uada.edu/posts/crop-insurance/2025-april-outlook-plc.aspx
- farmdoc daily, "2025 Final ARC/PLC Payments," Oct 13, 2026, revised Oct 14. https://farmdocdaily.illinois.edu/2026/10/2025-final-arc-plc-payments.html
- Mississippi State University Extension, "H.R. 1 updates farm policy programs," Jul 18, 2025, updated Aug 8, 2025. https://extension.msstate.edu/news/feature-story/2025/hr-1-updates-farm-policy-programs
- USDA FSA and CCC, "Changes to Agriculture Risk Coverage, Price Loss Coverage, and Dairy Margin Coverage Programs," 91 FR 1043, Jan 12, 2026. https://www.govinfo.gov/content/pkg/FR-2026-01-12/html/2026-00313.htm
- UADA, "Crop Enterprise Budget" index, read Nov 2, 2026; 2027 entries listed for canola and wheat only. https://www.uaex.uada.edu/farm-ranch/economics-marketing/farm-planning/budgets/crop-budgets.aspx
- Crop Root Zone, TRZ-0012, "Rice Acreage Hits a 50-Year Low in the Delta — Does a Summer Rally Change the 2027 Math?" Jul 18, 2026.
Not reached or not found: no September or November 2027 rough rice settlement, no 2027 rice mill or dryer bid, and no 2027 rice budget from UADA, MSU or LSU. No November 2027 soybean settlement was printed in the AMS report. The FSA 2025 PLC rate file and its base-acre release timed out, so the final 2025 long-grain price is unconfirmed. The CME daily bulletin timed out. LSU AgCenter's rice budget page and its January 2026 rental-arrangements report would not open, because of a certificate error. We saw a University of Arkansas rotation-yield figure only in a search snippet and did not use it. The October 2026 long-grain yield by class is in tables we did not open; the August figure is used.
Disclosures
Crop Root Zone is an independent publication. Nothing here is investment advice. Market calls, where included, reflect the editors' own read and are not a recommendation to buy or sell any security.
Pinto Beans Are Bid $42.75, 97% Over Last Year. On NDSU's Budgets They Need $30 to $32 to Match 2027 Soybeans. After the Last Run Above $40, Acres Rose 31% and the Price Fell to $30.20.
USDA cut the 2026 dry bean crop 20% to 21.6 million cwt, with North Dakota down 33%, and bids doubled. We repriced NDSU's seven bean budgets against 2027 grain prices. A bean acre matches soybeans at $29.71 to $32.21 a hundredweight, corn at $25 to $28 and spring wheat at $23 to $27. Today's bid beats soybeans by $177 to $236 an acre, but it is a 2026 price. No buyer has published a 2027 contract. On East Central numbers, a $36 contract beats soybeans in both a normal year and a 2026-style drought year.
North Dakota and Minnesota warehouses bid $42.75 per cwt for US #1 pinto beans on October 30, against $21.75 a year earlier. Black beans were $43.33 against $21.67, and navy beans $39.33 against $26.00 (USDA AMS, Oct 30, 2026) [1]. USDA's October forecast explains the move. The 2026 crop is 21.6 million cwt, down 20% from 26.9 million, and North Dakota is down 33% on a yield of 1,400 pounds an acre (USDA NASS, Oct 9, 2026, reissued Oct 23) [3]. NDSU's February budgets priced beans at 27 cents a pound and showed them behind soybeans in six of seven regions (NDSU Extension, Feb 2026) [8][9]. Those budgets are now badly out of date on price and still useful on cost. This piece reprices them to find what a dry bean acre has to earn in 2027 to beat soybeans, corn or spring wheat on the same ground, and what the last price spike did to the crop that followed it.
1. The price: a short crop doubled the bid
What's new: Grower bids stopped moving in late harvest at about twice last year's level. AMS described trade as light on October 26, with Minnesota 97%, North Dakota 95%, Nebraska 85% and Michigan 65% harvested as of October 18 (USDA AMS, Oct 26, 2026) [2].
Evidence:
| Class, region | Bid ($/cwt) | Average ($/cwt) | Year ago ($/cwt) | Change | Basis |
|---|---|---|---|---|---|
| Pinto, ND/MN | 42.00–43.00 | 42.75 | 21.75 | +97% | Grower, delivered warehouse, Oct 30 |
| Black, ND/MN | 40.00–45.00 | 43.33 | 21.67 | +100% | Grower, delivered warehouse, Oct 30 |
| Navy, ND/MN | 38.00–40.00 | 39.33 | 26.00 | +51% | Grower, delivered warehouse, Oct 30 |
| Pinto, NE CO/WY/W NE | 43.00 | 43.00 | 25.00 | +72% | Grower, delivered warehouse, Oct 30 |
| Great Northern, NE CO/WY/W NE | 40.00 | 40.00 | 28.00 | +43% | Grower, delivered warehouse, Oct 30 |
| Black, Michigan | 44.00–50.00 | 47.00 | n/q | n/a | Grower, delivered warehouse, Oct 26 |
| Navy, Michigan | 40.00–50.00 | 45.00 | 33.00 | +36% | Grower, delivered warehouse, Oct 26 |
Sources: USDA AMS report 2917, Oct 30, 2026 [1]; USDA AMS report 2914, Oct 26, 2026 [2]. US #1, food grade, conventional, current delivery. "n/q" = no year-ago quote published. Changes are Crop Root Zone calculations.
The move came late. A market note from an exporter, relaying AMS bids, shows ND/MN pinto at $28.50 on May 12, $32.33 on July 20 and $42 to $43 by September 25 (F. Garcia Wholesale & Export, Oct 3, 2026) [21]. The monthly price received has followed more slowly. North Dakota's all-bean price was $41.90 in August, up from $32.90 in July and $24.90 a year earlier, and its pinto price was $36.40. The U.S. average was $33.10, only 3% over August 2025 (USDA NASS, Sep 29, 2026) [4][5]. Class mix explains part of that spread. Our read is that the rest is timing: a monthly average takes in beans priced before the rally, and growers who sold them did not get this bid.
The supply side comes from fewer acres and, in North Dakota, a poor yield.
| State | Planted 2025 (1,000 ac) | Planted 2026 (1,000 ac) | Yield 2025 (lb/ac) | Yield 2026 (lb/ac) | Production 2026 (1,000 cwt) | vs. 2025 |
|---|---|---|---|---|---|---|
| North Dakota | 580 | 455 | 1,650 | 1,400 | 6,230 | −33% |
| Minnesota | 295 | 275 | 2,060 | 2,140 | 5,714 | −5% |
| Michigan | 250 | 225 | 2,350 | 2,300 | 5,106 | −13% |
| Nebraska | 106 | 68 | 2,520 | 2,400 | 1,512 | −40% |
| United States | 1,366 | 1,145 | 2,012 | 1,935 | 21,557 | −20% |
Source: USDA NASS, Crop Production, Oct 9, 2026, reissued Oct 23 [3]. 2026 figures are October 1 forecasts. Clean basis, excluding chickpeas and garden seed. Percentage changes are Crop Root Zone calculations.
USDA's August forecast was 23.3 million cwt on a 2,079-pound yield, as relayed by the same exporter's note [21]. October took out another 1.7 million cwt. That fits what Dylan Karley of North Central Commodities said in August, that many plants had aborted pods and that the crop was headed for "one of the lower average yields" in years (Red River Farm Network, Aug 21, 2026) [20].
2. The acre: what a bean has to earn on NDSU's budgets
What's new: NDSU's February 2026 budgets carry a dry bean enterprise in seven North Dakota regions at 27 cents a pound. We kept NDSU's yields and costs and changed only the prices.
Evidence: No futures market exists for dry beans, so the bean price is the variable we solve for. For the competing crops we built a 2027 deck from the October 30 settlements less current East Central North Dakota basis: soybeans at $11.30 (September 2027 at $12.145 less 85 cents; the report does not print November 2027), corn at $4.08 (December 2027 at $4.875 less 80 cents) and spring wheat at $6.17 (September 2027 Minneapolis at $6.74 less 57 cents) (USDA AMS, Oct 30, 2026) [10]. The deck is a Crop Root Zone estimate, applied to every region. It is close to the one forward bid we could find: central Michigan soybeans at $11.34 for October–November 2027 (Star of the West via Farmbucks, Oct 30, 2026) [13].
| East Central ND, per acre | Beans at $42.75 | Beans at $30.20 | Soybeans | Corn | HRS wheat |
|---|---|---|---|---|---|
| NDSU budget yield | 1,680 lb | 1,680 lb | 36 bu | 149 bu | 55 bu |
| NDSU Feb price | $27.00/cwt | $27.00/cwt | $9.75/bu | $3.75/bu | $5.81/bu |
| Price used | $42.75/cwt | $30.20/cwt | $11.30/bu* | $4.08/bu* | $6.17/bu* |
| Revenue | $718.20 | $507.36 | $406.80 | $607.92 | $339.35 |
| Fertilizer (NDSU) | $54.76 | $54.76 | $13.16 | $155.14 | $106.14 |
| Direct costs (NDSU) | $296.59 | $296.59 | $173.77 | $402.55 | $230.35 |
| Total listed costs (incl. $75 land) | $438.03 | $438.03 | $303.63 | $570.87 | $361.85 |
| Return to labor & mgmt, NDSU Feb | $15.57 | $15.57 | $47.37 | −$12.12 | −$42.30 |
| Return to labor & mgmt, repriced | $280.17 | $69.33 | $103.17 | $37.05 | −$22.50 |
Source: Crop Root Zone calculation from NDSU EC1658, Feb 2026 [8]; USDA AMS, Oct 30, 2026 [1][10]. *Estimate: 2027 futures less current basis. $42.75 is the October 30 ND/MN pinto average; $30.20 is the 2025 U.S. all-bean price (section 3). NDSU's costs are February 2026 costs, held fixed, including bean crop insurance at $10.20. PLC and ARC payments are excluded, as in NDSU's budgets. NDSU's region is Eddy, Foster, Griggs, Stutsman and Wells counties.
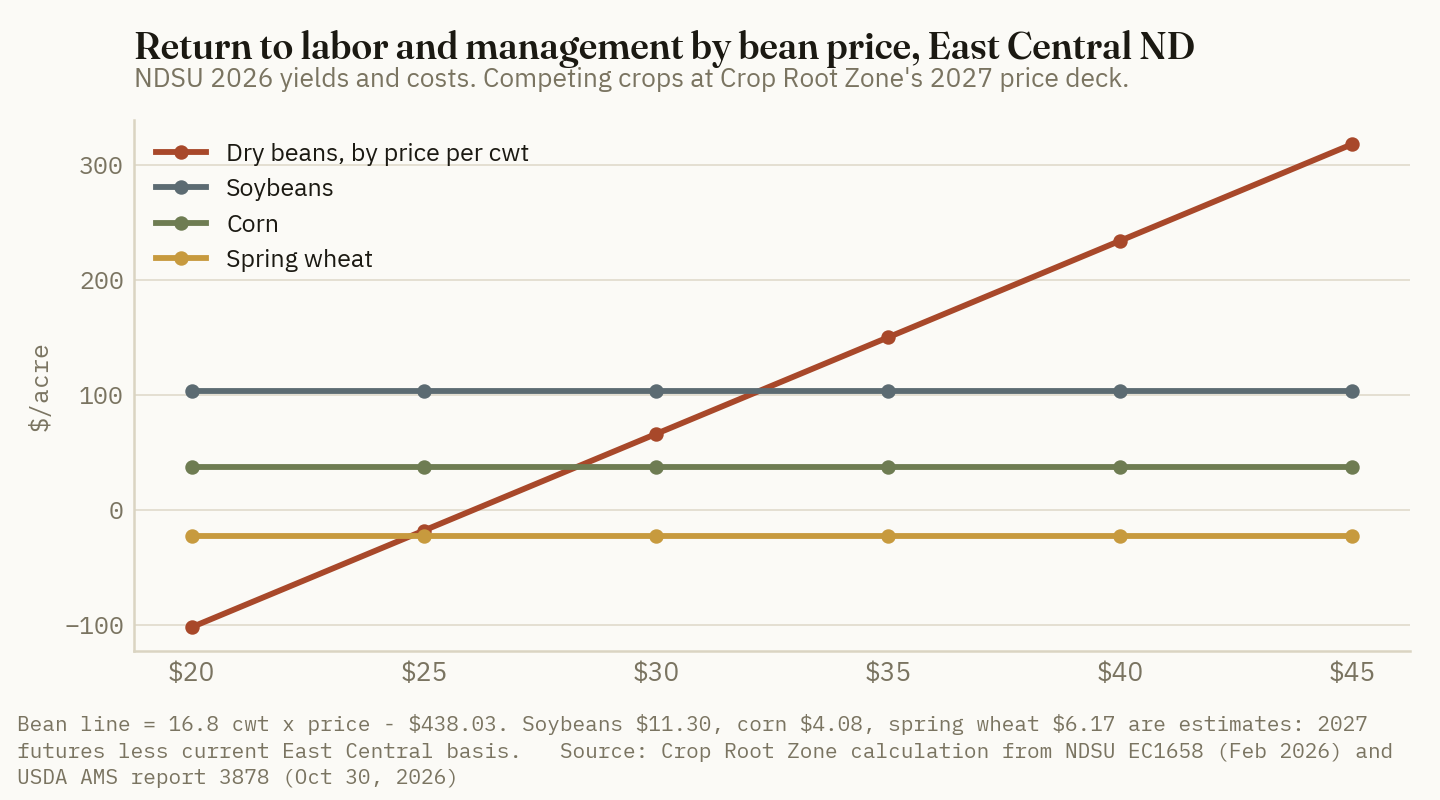
The ladder is the useful part. On East Central ground, beans cover every listed cost at $26.07.
| East Central ND, $/cwt | Price | |
|---|---|---|
| Year-ago ND/MN pinto bid | 21.75 | █████░░░░░ |
| Match spring wheat | 24.73 | ██████░░░░ |
| Cover total listed cost | 26.07 | ██████░░░░ |
| Match corn | 28.28 | ███████░░░ |
| 2025 U.S. all-bean price | 30.20 | ███████░░░ |
| Match soybeans | 32.21 | ███████░░░ |
| ND/MN navy bid, Oct 30 | 39.33 | █████████░ |
| ND/MN pinto bid, Oct 30 | 42.75 | ██████████ |
| ND/MN black bid, Oct 30 | 43.33 | ██████████ |
Source: Crop Root Zone calculation from NDSU EC1658 [8] at the 2027 deck [10]; USDA AMS, Oct 30, 2026 [1]; USDA ERS, Jul 30, 2026 [6].
The same calculation across all seven regions gives a narrow range, because higher bean yields and higher costs roughly offset.
| NDSU region | Bean yield (lb) | Match HRS ($/cwt) | Match corn ($/cwt) | Match soybeans ($/cwt) | Yield to match soybeans at $42.75 (lb) | Bean edge over soybeans at $42.75 ($/ac) | Bean edge at $30.20 ($/ac) |
|---|---|---|---|---|---|---|---|
| North Valley | 1,800 | 24.79 | 26.17 | 29.71 | 1,251 | +235 | +9 |
| North East | 1,550 | 27.42 | 25.82 | 30.91 | 1,121 | +184 | −11 |
| North Central | 1,580 | 25.29 | 24.58 | 31.34 | 1,158 | +180 | −18 |
| East Central | 1,680 | 24.73 | 28.28 | 32.21 | 1,266 | +177 | −34 |
| South Central | 1,700 | 23.27 | 25.28 | 30.76 | 1,223 | +204 | −10 |
| South East | 1,980 | 22.87 | 27.69 | 30.96 | 1,434 | +233 | −15 |
| South Valley | 1,980 | 22.89 | 27.26 | 30.85 | 1,429 | +236 | −13 |
Source: Crop Root Zone calculations from NDSU EC1658, EC1654, EC1655, EC1656, EC1653, EC1659 and EC1660, Feb 2026 [8][9], at the 2027 deck [10]. NDSU publishes no bean budget for its North West or South West regions. Yields and costs are NDSU's.
Fertilizer favors the bean against corn and wheat, and it counts against the bean next to soybeans. NDSU's bean fertilizer line runs from $43.52 to $66.91 an acre across the seven regions [8][9]. On East Central numbers it is 7.6% of revenue at $42.75, against 3.2% for soybeans, 25.5% for corn and 31.3% for spring wheat (Crop Root Zone calculations). Of the $134 total cost gap between beans and soybeans there, fertilizer is $42, and fungicide, herbicide and seed account for most of the rest [8]. Beans cost $64 to $154 an acre less than corn across the seven budgets [8][9]. A 25% rise in fertilizer costs would add about $14 to the bean acre and $39 to the corn acre, which moves the bean's match-corn price down about $1.50 per cwt (Crop Root Zone sensitivity, not a forecast). NDSU also notes that nitrogen on the following crop can be reduced after dry beans, without putting a figure on it [8].
Ground Truth: Against corn and spring wheat, the bean decision is easy unless prices return to last winter's lows. Beans beat wheat at $23 to $27 and corn at $25 to $28, levels the market reached only near the bottom of 2025-26. The real competition is soybeans, and the line there is about $30 to $32. That figure moves with soybeans: each 50 cents on soybeans moves it by about $1 per cwt on East Central yields. Run this table again when you have a real contract offer and your own soybean forward bid in hand. Do not run it with today's $42.75.
3. The trap: the last price above $40 bought the acres that ended it
What's new: USDA's own series shows what followed the last run of high prices, and the conditions are similar.
Evidence:
| Crop year | U.S. planted (1,000 ac) | Change | U.S. all-bean price ($/cwt) | Note |
|---|---|---|---|---|
| 2022 | 1,241 | −10% | 40.50 | NASS Crop Values |
| 2023 | 1,180 | −5% | 41.80 | Short crop; strong Mexican demand |
| 2024 | 1,540 | +31% | 36.90 | Black acres +51%, pinto acres +52% |
| 2025 | 1,366 | −11% | 30.20 | Preliminary |
| 2026 | 1,145 | −16% | 33.10* | *August 2026 monthly price, not a season average |
Sources: USDA ERS, VGS-379, Jul 30, 2026 [6]; USDA NASS, Crop Values 2024 Summary, Feb 2025 [7]; USDA NASS, Oct 9, 2026 [3]; USDA NASS, Sep 29, 2026 [4]; Cooperative Elevator Co., Aug 2024 [15]; Manitoba Co-operator, Oct 17, 2023 [17]. ERS planted area through 2025. NASS's preliminary 2024 price was $38.00 [7]; the table uses the later ERS figure. Percentage changes are Crop Root Zone calculations.
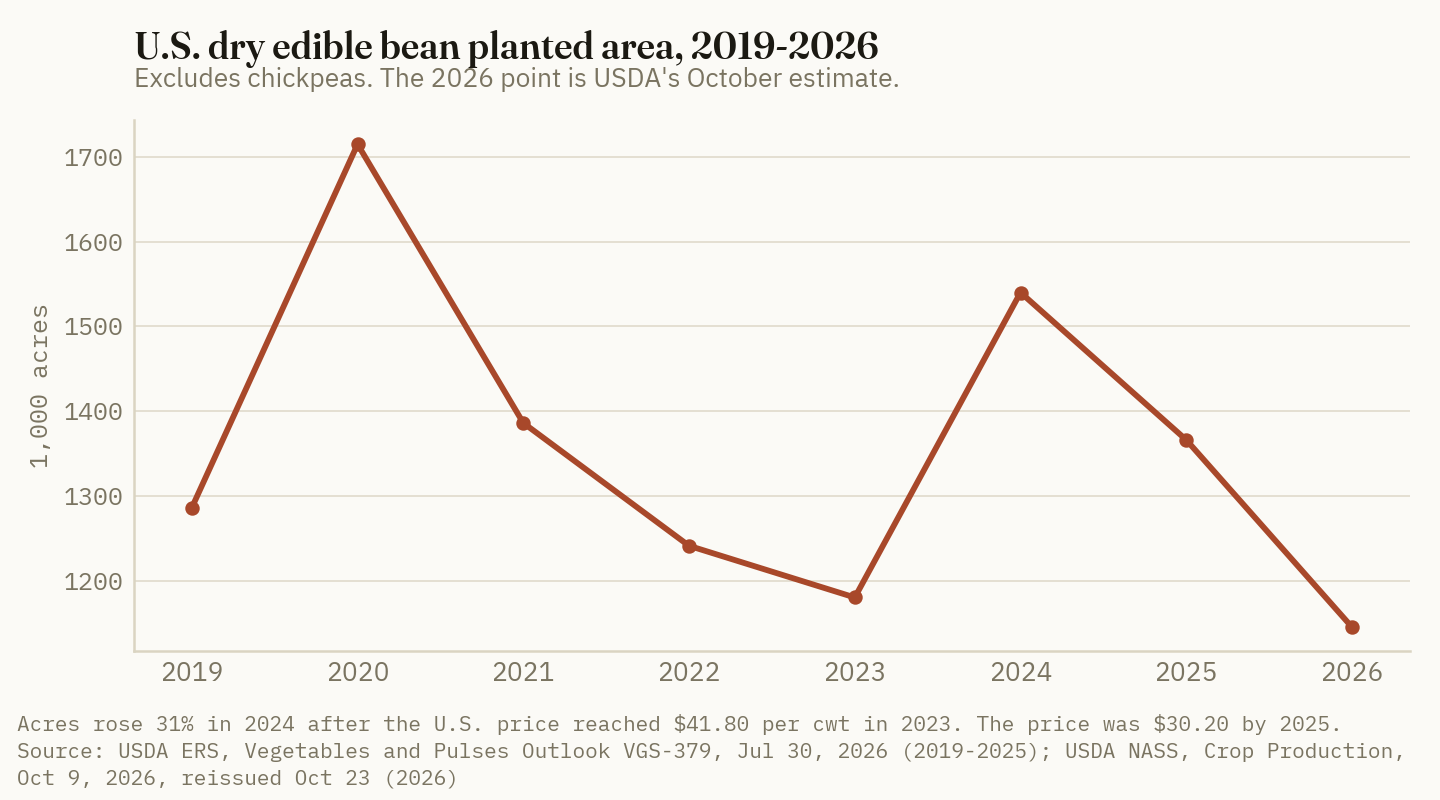
The record of that cycle is unusually clear. In October 2023 the head of the North Dakota and Minnesota growers' group expected strong prices and more acres for 2024, and some buyers were already contracting the next crop (Manitoba Co-operator, Oct 17, 2023) [17]. In August 2024 a Michigan elevator's marketing specialist reported black bean acres up 64% in North Dakota and 70% in Minnesota. He tied the expansion to high bean prices and "disappointing competing crop prices," and said some new growers came in on "high dollar contracts" offered over the winter (Cooperative Elevator Co., Aug 2024) [15]. Black bean production hit a record 9.2 million cwt, up 37%. The same elevator expected 2 million to 2.5 million cwt of black beans to carry into the next harvest, against about 500,000 a year earlier (Cooperative Elevator Co., Mar 2025) [16]. By February 2026 a Manitoba marketer was calling it "the bottom of the market" (The Western Producer, Feb 11, 2026) [18], and an NDSU study put September 2025 ND/MN losses at $50 an acre on average yields and $130 on long-term yields (Agweek, Mar 3, 2026) [19]. The repriced budgets agree. At $21.75, the seven regions lose $50 to $91 an acre (Crop Root Zone calculation) [8][9].
The drop from $41.80 to $30.20 was 28%. The same percentage off today's $42.75 lands at about $30.90, on the soybean line (Crop Root Zone arithmetic, an analogy and not a forecast; the U.S. figure is an all-bean average and $42.75 is one class in one region).
Two things differ this time. Soybeans at $11.30 are not the "disappointing" alternative of 2024, which may hold back the expansion. And demand looks weaker going in. U.S. exports fell 29% from September through May, with shipments to Mexico down 48%, and Mexico's share of export volume went from 34% to 25% (USDA ERS, Jul 30, 2026) [6]. Against that, the same exporter's note cites an unofficial trade estimate that Mexico's spring and summer plantings are about 30% below 2025, and reports the Mexican government selling stockpiled beans below market [21]. Neither figure is official, and the exporter sells beans. U.S. stocks of pinto, black, navy and small red beans were 863 million pounds in December 2025, down 12%, which ERS says "may limit some of the inventory cushion" [6].
Ground Truth: Expect 2027 contracts to be priced to buy acres back, not to reflect a $42.75 cash market. A Michigan elevator described the logic in 2023: when plenty of acres look likely, end users do not "see the need to increase the price" [14]. North Dakota has about 125,000 acres to recover just to get back to 2025. Watch soybean forward bids as closely as bean bids, because the 2024 expansion leaned on weak grains. If new-crop soybeans hold over $11, the rebound should be smaller than 31%. That is our read, not a number anyone has published.
4. The contract: what is public and what to hold out for
What's new: We found no published 2027 dry bean contract price from any buyer, elevator or growers' group in North Dakota, Minnesota, Michigan or Nebraska. The public record suggests new-crop offers go directly to growers, starting over the winter [14][15].
Evidence: The public record shows three pricing routes and how each has paid.
| Route | Public example | What it paid | What it means |
|---|---|---|---|
| Fixed-price new-crop contract | Michigan black, 2023 crop, several offers | $40/cwt | Sets the price before the crop is known |
| Total-production contract | Michigan small red, 2023 crop | $44/cwt | Grower's whole crop at one price |
| Pool, 2023 crop | Michigan black, final settlement | $47.39/cwt | $7.39 over that year's $40 contract |
| Pool, 2023 crop | Michigan navy, final settlement | $38.00/cwt | Lagging demand |
| Pool, 2024 crop | Michigan black, after second payment | $21/cwt so far | Not a final figure; pays out over months |
Sources: Cooperative Elevator Co., Mar 2023 [14], Aug 2024 [15], Mar 2025 [16]. One Michigan elevator's public newsletters, shown as examples. Other buyers' terms may differ. The newsletters for 2026 were not available to us.
A pool beat the contract in the short-crop year. In the big-crop year it had paid $21 by the second payment, against $34 at the same stage for the 2022 black crop [14][16]. For 2027, a pool is a bet that the acres do not come back.
Contract form matters as well. A Grand Forks bean company's form, filed as an exhibit in a 2015 North Dakota Public Service Commission case against the company, shows the clauses to read. It sets a maximum number of pounds per acre, separate prices for #1, #2 and #3 beans, market discounts for lower grades, a moisture limit, title passing at delivery, and an excuse from performance where growing, harvest or delivery "is prevented by fire, explosion, war or acts of God" (ND PSC filing, 2015) [24]. That form is old and belongs to one buyer. A drought year like 2026 is the case to ask about: what happens to pounds a contract covers but the field did not make?
Here is the East Central budget's bean edge over soybeans across the combinations that matter.
| Bean yield | $25.00 | $30.20 | $35.00 | $39.33 | $42.75 | $47.00 |
|---|---|---|---|---|---|---|
| 1,400 lb (ND 2026 state forecast) | −$191 | −$118 | −$51 | +$9 | +$57 | +$117 |
| 1,680 lb (NDSU budget) | −$121 | −$34 | +$47 | +$120 | +$177 | +$248 |
| 2,000 lb | −$41 | +$63 | +$159 | +$245 | +$314 | +$399 |
Source: Crop Root Zone calculation from NDSU EC1658 [8] and the 2027 deck [10], against soybeans at 36 bu and $103.17. Costs held at NDSU's $438.03, so low-yield rows slightly overstate costs that vary with harvest volume.
That table is too harsh on a drought year, because soybeans suffer too. North Dakota's soybean forecast fell to 32 bushels in 2026 [3]. At 32 bushels and 1,400 pounds, the East Central soybean return is $57.97, and beans at $42.75 still win by about $103 (Crop Root Zone calculation).
$36 per cwt
The contract price at which an East Central bean acre beats soybeans in both years: by $64 at NDSU's budget yields, and by $8 at a 1,400-pound bean and 32-bushel soybean year. (Crop Root Zone calculation from NDSU EC1658, Feb 2026; USDA AMS, Oct 30, 2026; USDA NASS, Oct 9, 2026)
Ground Truth: Treat $36 as the point where a fixed-price contract is worth signing on East Central ground. Above that you are paid for the drought risk you carry and for the extra $123 of direct cost. Between $32 and $36 you need a normal year to beat soybeans. Under $32 you are growing beans for agronomy or rotation, not for margin, and that is a legitimate reason as long as you say so. Adjust the line to your own ground: higher-yielding valley and southeast budgets sit at about the same soybean match, but they carry a bigger yield loss in dollars when it goes wrong. Price part of the crop by contract and leave the rest open only if you can store it and wait.
5. Minnesota, Michigan, Nebraska, and what to watch
What's new: The arithmetic carries across states, though the sourcing gets thinner. We found no current bean enterprise budget from Michigan State or the University of Minnesota. Michigan State publishes 2026 corn and soybean cost tools, and we did not find a bean version. Nebraska's budgets are the exception.
Evidence: The table below is an estimate. It uses each state's 2026 NASS yields and the average gap of $142 an acre between NDSU's bean and soybean budgets, which range from $118 to $151, and solves for the bean price that matches soybean revenue plus that cost gap.
| State | Bean yield 2026 (cwt) | Soybean yield 2026 (bu) | Soybean price ($/bu) | Est. bean price to match ($/cwt) | Range ($/cwt) | Recent bid ($/cwt) |
|---|---|---|---|---|---|---|
| North Dakota | 14.0 | 32 | 11.40 | 36.21* | 34.49–36.84 | 42.75 pinto |
| North Dakota at 2025 yields | 16.5 | 34.5 | 11.40 | 32.45* | 30.99–32.99 | 42.75 pinto |
| Minnesota | 21.4 | 49 | 11.70 | 33.43* | 32.30–33.85 | 43.33 black |
| Michigan | 23.0 | 51 | 11.34 | 31.32* | 30.28–31.71 | 47.00 black, 45.00 navy |
Source: Crop Root Zone estimates from USDA NASS, Oct 9, 2026 [3]; USDA NASS August prices received, Sep 29, 2026 [4]; Star of the West via Farmbucks for Michigan's October–November 2027 soybean bid, because NASS withheld Michigan's August price [13]; NDSU cost gaps [8][9]; USDA AMS [1][2]. *Applies North Dakota dryland cost gaps to other states. Treat these as planning estimates and replace them with your own costs.
Michigan carries the highest bid and the lowest estimated line. Crop insurance references show how far all of these bids have moved. USDA's 2025 harvest prices for the dry bean revenue endorsement were 25 cents for Michigan black and 32 cents for navy, and 22 cents for pinto and black and 26 cents for navy in Minnesota and North Dakota (USDA RMA, Jan 14, 2026) [22].
Nebraska's numbers are irrigated and much larger. The University of Nebraska's 2026 Panhandle budget for direct-harvested pivot-irrigated beans assumes 27 cwt and a total economic cost of $887.42, or $32.87 per cwt. Its Panhandle corn-after-beans budget assumes 185 bushels and $873.93, or $4.72 a bushel (University of Nebraska–Lincoln, 2026) [11][12]. At the $43 western pinto bid [1], beans return $274 an acre. Corn at Nebraska's $4.43 August price [4] loses $54. Beans match corn at $30.85 (Crop Root Zone calculations). Both budgets charge for land and machinery at full economic cost, so a grower looking only at cash costs will see better numbers on both crops. We did not make a soybean comparison, because the available pivot soybean budget assumes a different land value and diesel power. Nebraska planted 68,000 acres this year, down 36%, and has the largest percentage production loss of the four states [3].
Ground Truth: The price lines sit within about $5 of each other in all four states, at roughly $31 to $36, because better ground lifts bean and soybean revenue together. The gap that matters is between states with a bad yield year and those without one. North Dakota's bid is carrying a crop that lost about 15% of its yield, and Minnesota's and Michigan's growers got much of the same price rise without the same yield loss. If those states bring the acres back first, North Dakota growers may be the ones who sell into the softer 2027 market with the least to show for 2026.
What to watch:
- RMA's 2027 dry bean prices. The 2026 values were posted in a March 2 bulletin ahead of a March 15 sales closing date, and we expect a similar calendar [23].
- The first 2027 contract offers, expected over the winter, and whether they come in over $36 [14][15].
- USDA's January crop summary, which will settle the North Dakota yield [3].
- ERS's next Vegetables and Pulses Outlook, due December 17, and Mexican planting data, which is still unofficial [6][21].
- The Senate Agriculture Committee's farm bill provision that could make dry beans a Title I crop, which is not in any budget here (Northarvest Bean Growers Association, Sep 19, 2026) [25].
References
- USDA AMS Livestock, Poultry and Grain Market News (CO Dept. of Ag Market News), "Dry Edible Beans Daily Grower Bids (ND/MN and NE-CO/WY/W-NE)," report 2917, Oct 30, 2026. https://www.ams.usda.gov/mnreports/ams_2917.pdf
- USDA AMS Livestock, Poultry and Grain Market News, "Weekly Bean, Pea, and Lentil Market Review," report 2914, Oct 26, 2026. https://www.ams.usda.gov/mnreports/ams_2914.pdf
- USDA NASS, "Crop Production," released Oct 9, 2026, reissued Oct 23, 2026. https://esmis.nal.usda.gov/sites/default/release-files/796123/crop1026.txt
- USDA NASS, "Agricultural Prices," released Sep 29, 2026 (August 2026 prices received). https://esmis.nal.usda.gov/sites/default/release-files/796084/agpr0926.txt
- USDA NASS Northern Plains Region, "North Dakota Dry Bean and Rye Prices," Sep 29, 2026. https://www.nass.usda.gov/Statistics_by_State/North_Dakota/Publications/Economic_Releases/Dry_Edible_Beans/2026/ND-agpr0926.pdf
- USDA ERS, "Vegetables and Pulses Outlook: July 2026," VGS-379, Jul 30, 2026. https://www.ers.usda.gov/media/29403/vgs-379.pdf
- USDA NASS, "Crop Values 2024 Summary," Feb 2025. https://esmis.nal.usda.gov/sites/default/release-files/k35694332/4m90gs04k/wd377r96k/cpvl0225.txt
- Haugen, R., NDSU Extension, "Projected 2026 Crop Budgets: East Central North Dakota," EC1658, Feb 2026. https://www.ndsu.edu/agriculture/sites/default/files/2026-02/ec1658.pdf
- Haugen, R., NDSU Extension, "Projected 2026 Crop Budgets," Feb 2026: North Central, EC1654 (https://www.ndsu.edu/agriculture/sites/default/files/2026-02/ec1654.pdf); North East, EC1655 (https://www.ndsu.edu/agriculture/sites/default/files/2026-02/ec1655.pdf); North Valley, EC1656 (https://www.ndsu.edu/agriculture/sites/default/files/2026-02/ec1656.pdf); South Central, EC1653 (https://www.ndsu.edu/agriculture/sites/default/files/2026-02/ec1653.pdf); South East, EC1659 (https://www.ndsu.edu/agriculture/sites/default/files/2026-02/ec1659.pdf); South Valley, EC1660 (https://www.ndsu.edu/agriculture/sites/default/files/2026-02/ec1660.pdf).
- USDA AMS Livestock, Poultry and Grain Market News (ND Dept. of Ag Market News), "North Dakota Daily Grain Bids," report 3878, Oct 30, 2026 (includes CBOT, KCBT and MGE settlements). https://www.ams.usda.gov/mnreports/ams_3878.pdf
- University of Nebraska–Lincoln, Center for Agricultural Profitability, "2026 UNL #046 Dry Beans, Irrigated-Electric Pivot, Conv. Till, Panhandle, Direct Harvest." https://cap.unl.edu/sites/unl.edu.ianr.agecon.center-for-ag-profitability/files/media/file/%23046%20Dry%20Beans%2C%20Irrigated-Electric%20Pivot%2C%20Conv.%20Till%2C%20Panhandle%2C_2026.pdf
- University of Nebraska–Lincoln, Center for Agricultural Profitability, "2026 UNL #039 Corn, Irrigated-Electric Pivot, Panhandle, Conv Till after Beans." https://cap.unl.edu/sites/unl.edu.ianr.agecon.center-for-ag-profitability/files/media/file/%23039%20Corn%2C%20Irrigated-Electric%20Pivot%2C%20Panhandle%2C%20Conv%20Till%20after_2026.pdf
- Star of the West Michigan cash bids as listed by Farmbucks, last updated Oct 30, 2026. https://farmbucks.com/grain-prices/star-of-the-west/michigan
- Cooperative Elevator Co. (Michigan), "March 2023 Dry Bean Newsletter." https://grower.coopelev.com/wp-content/uploads/2023/03/March-2023-Dry-Bean-Newsletter-.pdf
- Cooperative Elevator Co. (Michigan), "Dry Bean Newsletter," Aug 2024. https://grower.coopelev.com/wp-content/uploads/2024/08/August-2024-Dry-Bean-Newsletter.pdf
- Cooperative Elevator Co. (Michigan), "Dry Bean Newsletter," Mar 2025. https://grower.coopelev.com/wp-content/uploads/2025/03/March-Dry-Bean-Newsletter.pdf
- Manitoba Co-operator, "Pulse weekly outlook: Smaller North American dry bean crops to underpin prices," Oct 17, 2023. https://www.manitobacooperator.ca/daily/pulse-weekly-outlook-smaller-north-american-dry-bean-crops-to-underpin-prices/
- The Western Producer, "Pulse Weekly: Low prices for edible beans worsen growth prospects," Feb 11, 2026. https://www.producer.com/daily/pulse-weekly-low-prices-for-edible-beans-worsen-growth-prospects/
- Bailey, A., Agweek, "NDSU study shows difficult situation for dry bean growers," Mar 3, 2026. https://www.agweek.com/crops/dry-edible-beans/ndsu-study-shows-difficult-situation-for-dry-bean-growers
- Red River Farm Network, "Edibles Look Better From the Road Than in the Field," Aug 21, 2026. https://www.rrfn.com/2026/08/21/edibles-look-better-from-the-road-than-in-the-field/
- Campuzano, V., F. Garcia Wholesale & Export Inc., "Dry Bean Market 2026: Harvest Update on US Supply, Prices, and Mexico," updated Oct 3, 2026. A seller's market note, relaying USDA AMS and NASS data and unofficial Mexican trade estimates. https://fgarciafoodexport.com/dry-bean-market-2026/
- USDA RMA, "PM-26-001.1: 2025 Crop Year Dry Bean and Dry Pea Revenue Endorsement Harvest Prices," Jan 14, 2026. https://www.rma.usda.gov/print/pdf/node/7746
- USDA RMA, "PM-26-013: 2026 Crop Year Dry Bean and Dry Pea Prices and Volatility Factors for States with a March 15, 2026, Sales Closing Date," Mar 2, 2026. https://www.rma.usda.gov/print/pdf/node/7798
- North Dakota Public Service Commission, Case 15-0036 filing, Exhibit A, "Dry Bean Contract," Grand Forks Bean Co., Inc., in Case No. 18-2015-CV-00240. https://www.psc.nd.gov/webdocs/case/15-0036/098-010.pdf
- Northarvest Bean Growers Association, "Dry Bean Scene 09/19/2026." https://northarvestbean.org/2026/09/19/dry-bean-scene-09-19-2026/
Not reached or not found: no 2027 dry bean contract price or NDSU 2027 budget has been published that we could find. RMA's 2026 projected prices by bean type are posted in its Actuarial Information Browser, not in the bulletin, and were not read. The October 2026 Agricultural Prices report did not appear in our searches. The USDA MyMarketNews viewer for report 2917 timed out on Oct 31, 2026; the PDF edition was used. The full PDF of the 2026 Nebraska crop budgets was too large to retrieve; the individual enterprise reports were used. Cooperative Elevator's 2026 newsletters were not found. No current Michigan State University or University of Minnesota dry bean enterprise budget was found.
Disclosures
Crop Root Zone is an independent publication. Nothing here is investment advice. Market calls, where included, reflect the editors' own read and are not a recommendation to buy or sell any security.
Malt Barley Paid $2.00 a Bushel Over Feed in August. On NDSU's North Central Budget, Full Malt Acceptance Is Worth $117 an Acre and Still Trails Canola by $34.
U.S. barley output fell 19% to 116 million bushels on record-low plantings, and Canada expects less than 2 million tonnes of selectable malting barley. No maltster has published 2027 terms. We repriced NDSU's 2026 North Central budget at late-October prices. A malt barley acre beats durum once 16% of the crop makes malt and covers full cost at 38%, but it never catches canola. In Idaho the malt premium is larger than crop insurance will cover.
U.S. farmers were paid $5.86 a bushel for malting barley in August 2026 and $3.86 for feed barley, a spread of $2.00 (USDA NASS, Sep 29, 2026) [1]. In Idaho, the gap was $2.50: $6.15 for malting against $3.65 for feed. In North Dakota it was $1.12: $5.18 against $4.06 [1]. The spread is the price of passing a maltster's quality tests, and it is worth more this year because the crop is smaller. USDA's Small Grains Summary puts 2026 U.S. barley production at 116 million bushels, down 19% from 2025. That comes from a record-low 2.21 million planted acres and a 72.1-bushel yield, down 7.8 bushels (USDA NASS, Sep 30, 2026) [2]. Contracts for the 2027 crop will be written this winter. No major brewer or maltster has published 2027 prices or terms, so this piece works from the numbers that are public. These are what malt and feed barley pay now, what a published crop budget says a malt acre earns against spring wheat, durum and canola, and how much of the crop has to make malt for the acre to pay.
1. The price: a $2.00 spread on a crop that shrank by a fifth
What's new: The malting premium held up through a year of weak beer demand, and supply has now fallen. Nationally, the August malting price was $5.86, against $5.83 a year earlier. Feed fell to $3.86 from $3.94 [1].
Evidence:
| Barley price, location | Price ($/bu) | Year ago ($/bu) | Basis |
|---|---|---|---|
| Malting, United States | 5.86 | 5.83 | NASS price received, Aug 2026 |
| Malting, Idaho | 6.15 | 5.91 | NASS price received, Aug 2026 |
| Malting, Montana | 5.43 | 5.73 | NASS price received, Aug 2026 |
| Malting, North Dakota | 5.18 | (D) | NASS price received, Aug 2026 |
| Feed, United States | 3.86 | 3.94 | NASS price received, Aug 2026 |
| Feed, Idaho | 3.65 | (D) | NASS price received, Aug 2026 |
| Feed, North Dakota | 4.06 | 4.23 | NASS price received, Aug 2026 |
| US #2 feed, Golden Triangle, MT | 3.64 | n/q | Country elevator bid, delivered truck, Oct 28, 2026 |
| Feed, Saskatchewan (C$/bu) | 4.75–5.25 | n/a | Market-comment range, FOB farm, Prairies, Oct 28, 2026 |
Sources: USDA NASS, Agricultural Prices, Sep 29, 2026 [1]; USDA AMS Montana Daily Elevator Grain Bids, Oct 28, 2026 [4]; Rayglen Commodities market comments, Oct 28, 2026 [10]. "(D)" = withheld by NASS to avoid disclosing individual operations. "n/q" = no year-ago quote published. Montana's August feed price was withheld, and its July figures were $5.20 malting and $3.71 feed [1]. The Saskatchewan range is in Canadian dollars and is a broker's comment, not an official quote.
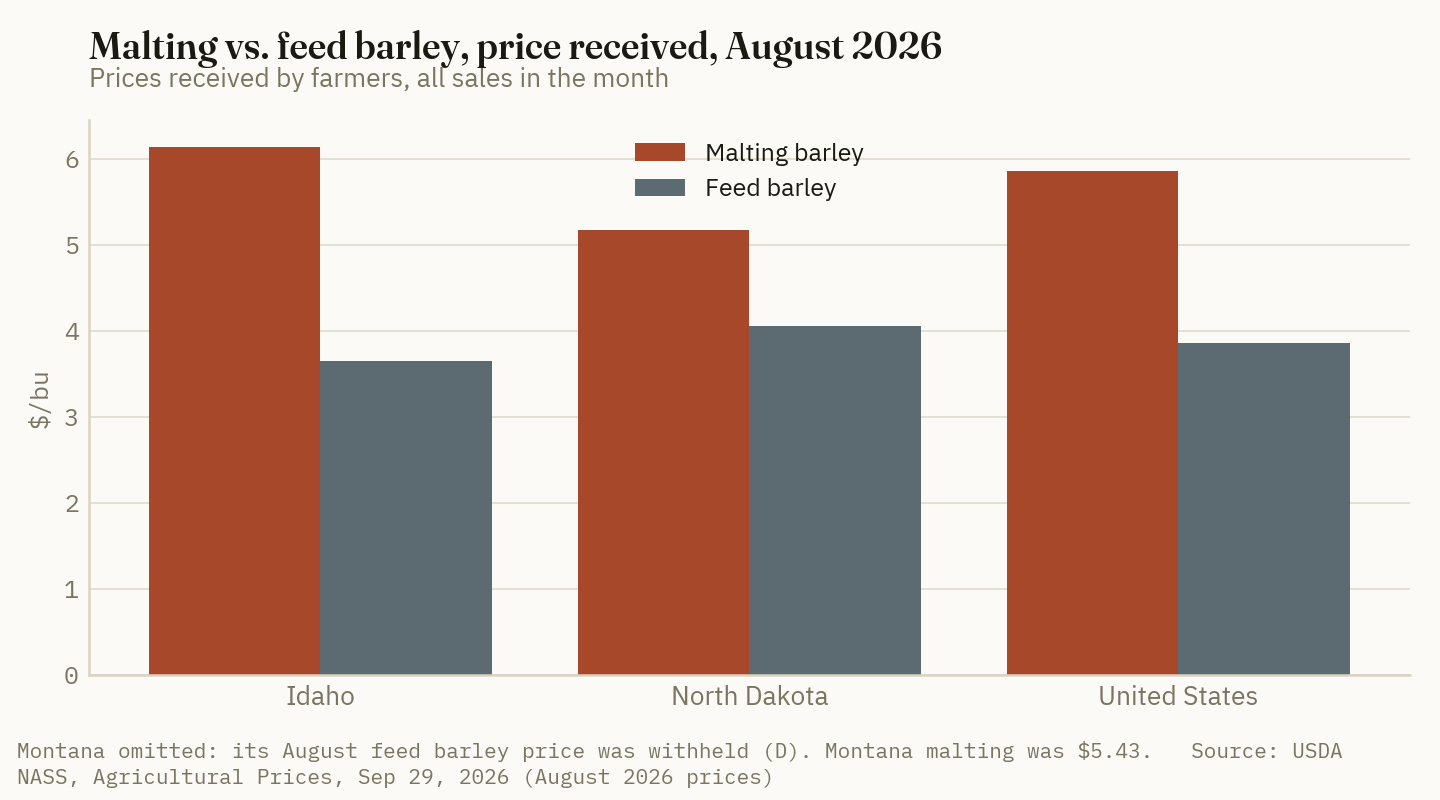
No public cash bid for malting barley exists in either the Montana or North Dakota daily reports [4][5]. Most malting barley moves under contract, not on a spot board. A Malteurop procurement manager told Agweek in 2024 that about 80% of malting barley is precontracted (Agweek, Dec 30, 2024) [12]. The NASS price received is the best public measure of what contracts actually paid. It is a monthly average of all sales and lags the market.
The supply side has changed more than the price. Here is how the three main U.S. barley states did in 2026 [2].
| State | Planted 2026 (1,000 ac) | Harvested 2026 (1,000 ac) | Yield 2026 (bu/ac) | Yield 2025 (bu/ac) | Production 2026 (1,000 bu) | vs. 2025 |
|---|---|---|---|---|---|---|
| Idaho | 445 | 380 | 100 | 112 | 38,000 | −31% |
| Montana | 860 | 650 | 56 | 54 | 36,400 | +12% |
| North Dakota | 415 | 290 | 67 | 78 | 19,430 | −31% |
| United States | 2,206 | 1,604 | 72.1 | 79.9 | 115,667 | −19% |
Source: USDA NASS, Small Grains 2026 Summary, Sep 30, 2026 [2]. Basis: all barley, malting and feed combined. Percentage changes are Crop Root Zone calculations from the NASS production figures.
Idaho and North Dakota each lost almost a third of their production. Montana planted more and yielded slightly better. In December 2025, the analyst Mark Black estimated that U.S. malting barley supply was 25% above demand in 2023 and 3% above it in both 2024 and 2025. He expected malting acres to fall in 2026 and called barley "a sick market" that was "getting better" (Agweek, Dec 19, 2025) [11]. Acres did fall, and yields fell with them.
Canada's crop has the same problem. Statistics Canada puts total barley production at 9.7 million tonnes, unchanged from last year. But the managing director of the Canadian Malting Barley Technical Centre forecasts less than 2 million tonnes of selectable malting barley for 2026-27. That compares with 3 million tonnes last year and a long-run average near 2.5 million. He blamed poorly timed rain in late August and early September, and said assessments of sprouting and germination are under way (Western Producer, Oct 19, 2026) [8]. That is a reversal from June, when analysts described Western Canadian malt premiums for 2025-26 as "unusually small" after a large crop (Western Producer, Jun 11, 2026) [9]. Prairie brokers now report firmer malt pricing but few posted spot bids. Their October 28 comment said maltsters had shown limited interest in setting spot bids, so the premium over feed is hard to measure [10].
2. The 2027 contract: what is public and what is not
What's new: No 2027 contract price or volume has been published by Anheuser-Busch, Molson Coors, Malteurop, Rahr or Canada Malting, and we found none relayed by the North Dakota, Montana or Idaho barley groups. The last public descriptions of U.S. contract terms come from the 2024 and 2025 crop years.
Evidence: Agweek's reporting gives the outline of how the largest U.S. buyer contracts. For the 2025 crop, Anheuser-Busch's contract price per bushel moved with Chicago Board of Trade December wheat futures. Earlier, the company cut its required on-farm storage period from 15 months after harvest to eight [12]. For the 2024 crop it paid 6 cents a bushel per month for storage (Agweek, Dec 13, 2023) [12]. Anheuser-Busch announced it would close its Moorhead, Minnesota malt house, sell its Sutton and West Fargo, North Dakota elevators, and shift processing to Rahr's plant at Shakopee, Minnesota [11]. Malteries Soufflet bought United Malt Group, then the owner of Great Western Malting, for $1.5 billion in November 2023 [11]. A wheat-linked contract offered this winter would reference the December 2027 CBOT wheat contract, which settled at $6.5175 on October 28, 2026 (USDA AMS, Oct 28, 2026) [4]. We do not know the basis or premium any maltster will apply to it, and we have not estimated one.
Ground Truth: The buyer side of the 2027 negotiation is weaker than in any of the last three winters. The U.S. oversupply that Black put at 3% in 2025 [11] did not survive a 19% production drop [2]. Canada's selectable supply is down by a third [8]. That points to firmer 2027 offers, but the evidence is indirect. No maltster has said so, and beer demand has not recovered. Growers should not judge a 2027 offer against the 2024-25 contracts, which were written in a glut. The better benchmark is the August price-received spread: $2.00 nationally, $2.50 in Idaho and $1.12 in North Dakota [1]. An offer whose premium over expected feed value is well below the local spread is not pricing this year's shortage. Read the delivery and storage terms as closely as the price, because they cost money too.
3. The acre: malt barley against spring wheat, durum and canola
What's new: NDSU's February 2026 budget for North Central North Dakota (Benson, Bottineau, McHenry, McLean, Pierce, Renville, Rolette and Ward counties) is the only current U.S. state budget we found that prices malting barley alongside the crops it competes with. It budgets malting barley at 76 bushels and $4.96, for a $55.81 return to labor and management. It adds a note: "There is risk of not making malting barley quality. Use $3.00 for feed barley" (NDSU Extension, Feb 2026) [3]. We looked for current Montana State University and University of Idaho barley budgets and did not find one for 2026 (see References).
Evidence: We repriced the NDSU budget at late-October prices and held NDSU's per-acre costs fixed. For malting barley we used North Dakota's August malting price received of $5.18 [1]. For barley that fails malting quality we used the October 28 Golden Triangle, Montana feed bid of $3.64. That is the nearest published U.S. #2 feed barley bid; the North Dakota report carries none [4][5]. For spring wheat and canola we used North Central North Dakota and Velva bids [5][6]. North Dakota had no published durum bid, so we used the Northeast Montana 13% durum average [4]. All repriced figures are Crop Root Zone calculations, not NDSU figures.
| North Central ND, per acre | Malt barley | Barley sold as feed | HRS wheat | Durum | Canola |
|---|---|---|---|---|---|
| NDSU budget yield | 76 bu | 76 bu | 53 bu | 54 bu | 1,960 lb |
| NDSU Feb price | $4.96/bu | $3.00/bu | $5.70/bu | $6.70/bu | $20.50/cwt |
| Late-Oct price used | $5.18/bu | $3.64/bu | $5.40/bu | $6.04/bu* | $24.32/cwt |
| Direct costs | $205.81 | $205.81 | $218.02 | $238.57 | $259.23 |
| Total listed costs (incl. $57 land) | $321.15 | $321.15 | $330.84 | $351.51 | $370.41 |
| Return to labor & mgmt, NDSU Feb | $55.81 | −$93.15 | −$28.74 | $10.29 | $31.39 |
| Return to labor & mgmt, late Oct | $72.53 | −$44.51 | −$44.77 | −$25.49* | $106.26 |
| Return over direct costs, late Oct | $187.87 | $70.83 | $68.05 | $87.45* | $217.44 |
| Fertilizer, $/acre (NDSU) | $86.64 | $86.64 | $99.28 | $101.55 | $110.94 |
| Fertilizer share of late-Oct revenue | 22.0% | 31.3% | 34.7% | 31.1%* | 23.3% |
Source: NDSU Extension EC1654, Projected 2026 Crop Budgets, North Central North Dakota, Feb 2026 [3]; USDA NASS, Sep 29, 2026 [1]; USDA AMS reports 2771, 3878 and 2887, Oct 28, 2026 [4][5][6]. HRS = 14% protein North Central ND elevator average, $5.3975, FOB truck. Canola = Velva, ND processor bid, delivered truck. Malt barley = NASS North Dakota August malting price received, an average of contract and spot sales and not a bid. *Durum uses the Northeast Montana 13% elevator average ($6.0375, delivered truck) because no North Dakota durum quote was published; it is an estimate for North Central ND. NDSU's durum price is for milling quality, and NDSU notes the same kind of quality risk for durum as for malt barley [3]. NDSU's budget excludes PLC and ARC payments.
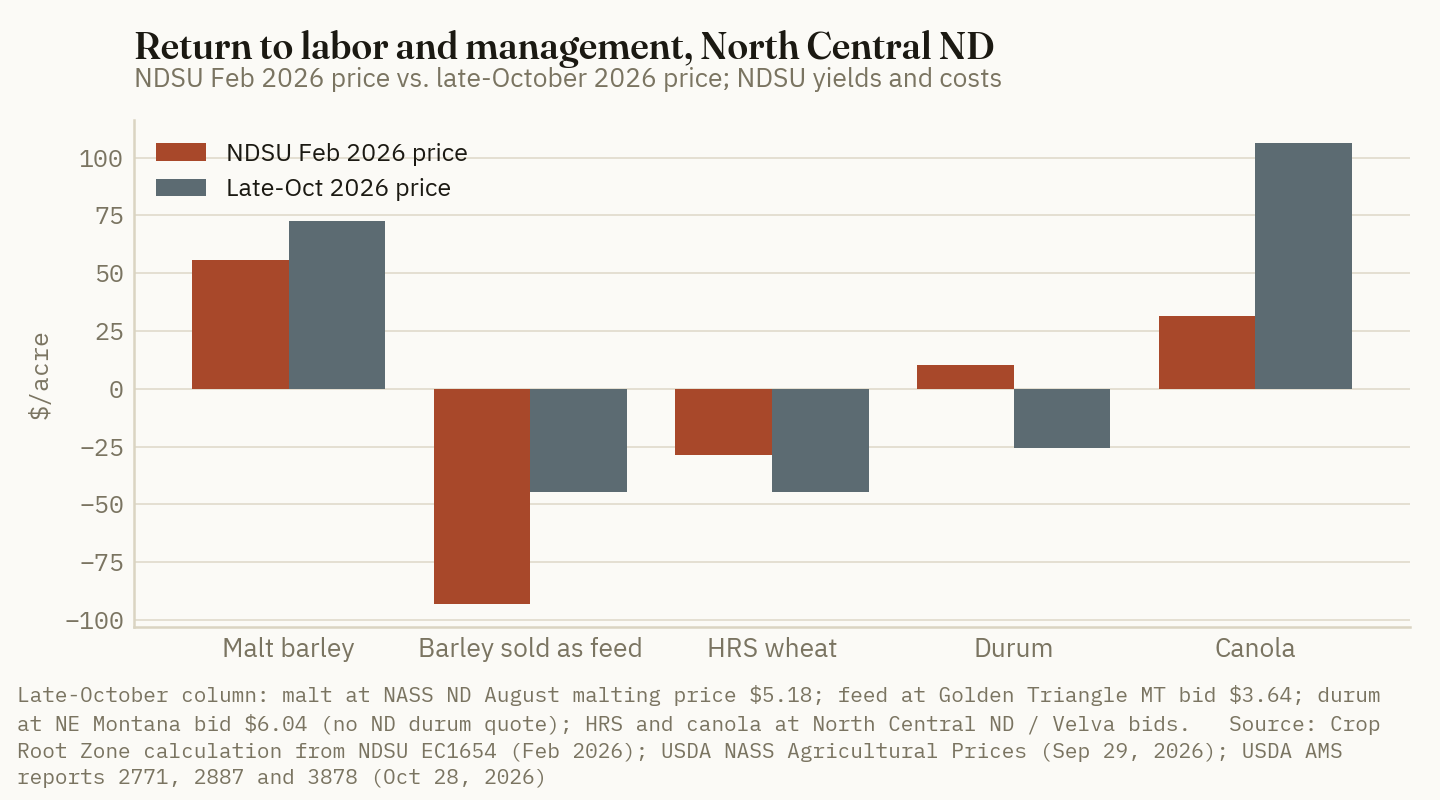
Three things stand out. First, at full acceptance malt barley is the second-best crop on the budget, after canola and ahead of durum by $98 an acre. Second, if the whole crop is rejected and sold as feed, the acre loses $44.51. That is almost exactly spring wheat's $44.77 loss. On this budget, a rejected barley acre at a $3.64 feed bid does no worse than a spring wheat acre at $5.40. Third, NDSU's $3.00 feed price is more conservative than any current feed price we found. The North Dakota feed price received in August was $4.06 [1]. At $4.06, an acre sold entirely as feed loses $12.59, a Crop Root Zone calculation.
$117 an acre
What getting the crop accepted for malting is worth on NDSU's North Central budget: 76 bushels times the $1.54 difference between the $5.18 North Dakota malting price and the $3.64 feed bid. (Crop Root Zone calculation from NDSU EC1654, Feb 2026; USDA NASS, Sep 29, 2026; USDA AMS, Oct 28, 2026)
Malt barley's break-even price at full acceptance is $4.23 a bushel, and its break-even yield at $5.18 is 62 bushels. Both are Crop Root Zone calculations from NDSU's total listed cost [3]. North Dakota's 2026 state average barley yield was 67 bushels [2]. At that yield, a fully accepted crop returns about $26 an acre and a fully rejected crop loses about $77. Both are Crop Root Zone estimates using the North Central costs.
4. The rejection risk: what turns malt into feed
What's new: The acre's return depends on the share of the crop a maltster accepts, and the published standards show how small the margin for error is.
Evidence:
| Quality factor | Crop insurance standard, 2-row | Crop insurance standard, 6-row | Typical commercial target |
|---|---|---|---|
| Protein, dry basis | ≤13.5% | ≤14.0% | 11–13.5% (6-row); 9.5–12.5% in one guide |
| Plump kernels | ≥75% | ≥65% | >70% (6-row); >90% on 6/64 screen in one guide |
| Thin kernels | ≤10% | ≤10% | <3% through 5/64 screen |
| Germination | ≥95% | ≥95% | ≥96%; ≥95% in one guide |
| Injured by sprout | ≤1.0% | ≤1.0% | No evidence of pre-harvest sprout |
| Mycotoxin (DON) | ≤2.0 ppm | ≤2.0 ppm | ≤1.0 ppm |
| Skinned and broken | n/a | n/a | ≤4% |
Sources: 7 CFR 457.118, Malting Barley Price and Quality Endorsement, as reproduced by FindLaw [13]; Sorenson and Schwarz, NDSU, via University of Minnesota Extension, reviewed 2018 [14]; Ohio State University Agronomic Crops Network, "Grain Quality Parameters," undated [15]. The insurance standards are the floor for counting production as malting quality. A contract's own specifications apply when they are stricter [13].
The commercial targets are tighter than the insurance floor on the two factors growers control least, DON and sprouting. The 2026 season shows how both can fail. Country Malt Group's late-season update reported "some potential pre-sprout activity" in southeastern Montana after late rain, and higher disease pressure in wet parts of North Dakota, held back by widespread fungicide use. Idaho's crop was expected to stay within malting specifications (Country Malt Group, 2026) [16]. In Canada, rain during harvest is the reason selectable supply fell by a third while total production held steady [8].
Protein is the factor a grower controls most, and it is where fertilizer enters the decision. The Saskatchewan guide notes that growers "may fertilize malting barley less trying to avoid protein being too high." Its dark brown zone budget uses 66 pounds of nitrogen for malt barley against 80 for feed barley (Saskatchewan Ministry of Agriculture, 2026) [7]. NDSU's malting barley fertilizer line is $86.64, the lowest of the four crops in the comparison [3]. Rejection also changes how heavy the fertilizer bill is. Fertilizer is 22.0% of a malt barley acre's revenue at the malting price and 31.3% if the crop goes to feed (Crop Root Zone calculation, section 3).
Here is how the acre's return changes with the share of the crop accepted for malting.
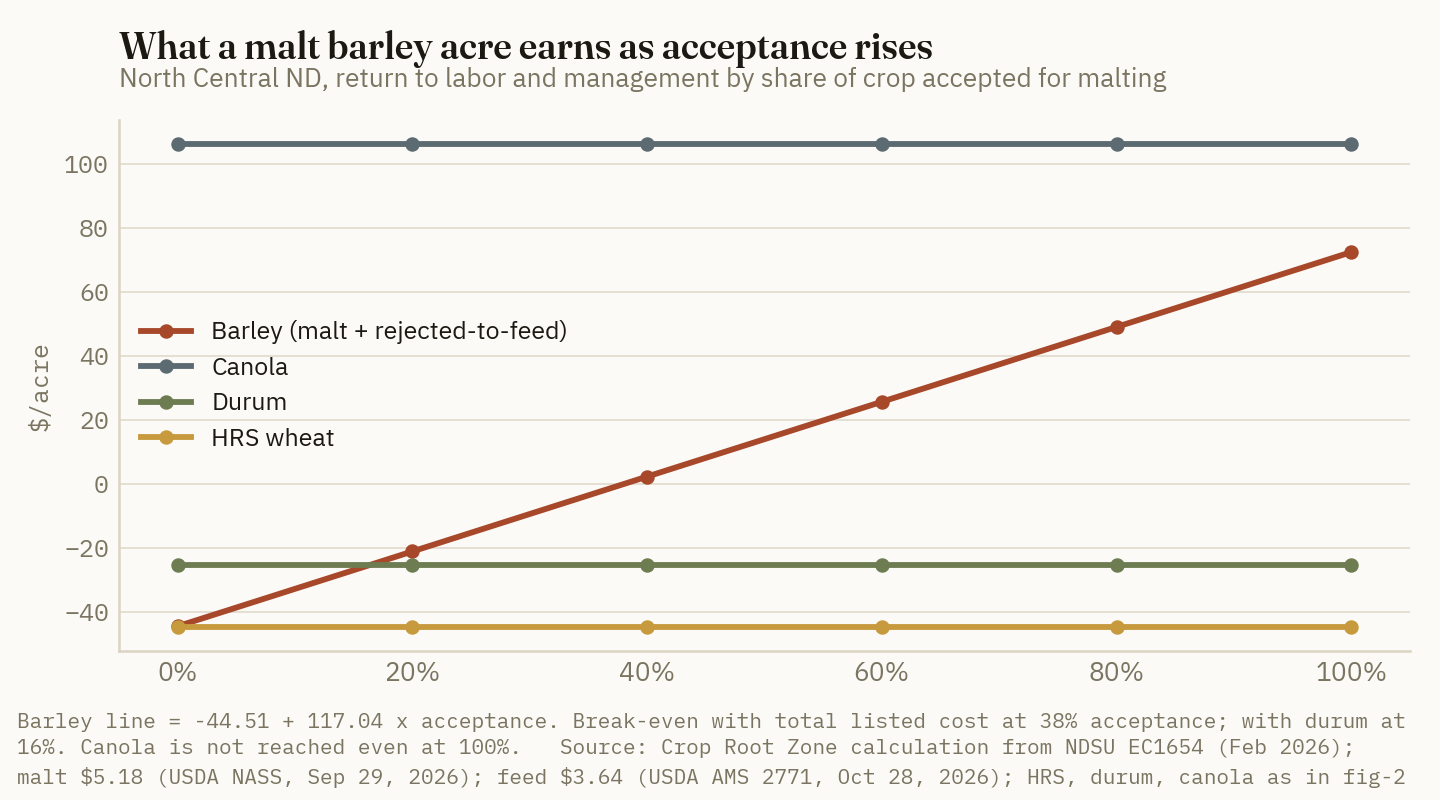
| North Central ND, Crop Root Zone calculation | Acceptance needed | |
|---|---|---|
| Match HRS wheat (−$44.77) | 0% | ░░░░░░░░░░ |
| Match durum (−$25.49, estimate) | 16% | ██░░░░░░░░ |
| Cover total listed cost ($0) | 38% | ████░░░░░░ |
| Match canola ($106.26) | not reached (129%) | ██████████ |
Source: Crop Root Zone calculation from NDSU EC1654 [3] at $5.18 malting and $3.64 feed [1][4]. Barley return = −$44.51 + $117.04 × acceptance share. Bars show acceptance on a 0–100% scale; the canola row is capped at 100% because no acceptance share reaches it.
At these prices, malt barley would need about $5.62 a bushel at full acceptance to match canola. At 80% acceptance it would need about $6.12. Both are Crop Root Zone calculations [3][6]. That is about what Idaho's malting price was in August [1], and well above North Dakota's $5.18.
Ground Truth: On this budget, malt barley competes with wheat, not with canola. Where canola fits the rotation, a malt contract at North Dakota's current price level does not earn its place on returns. Where the real alternative is spring wheat or durum, it wins at very low acceptance rates: 16% to beat durum and 38% to cover every listed cost. A grower who has made malt in most recent years is well clear of that. Two things matter more than the contract price in that decision. The first is the field's own record on sprout and DON. The second is the feed price the rejected bushels will actually get, which has ranged from NDSU's $3.00 to North Dakota's $4.06 this year [1][3]. If you cannot name the feed outlet before you sign, use NDSU's $3.00. At $3.00 the full-rejection loss is $93, not $45.
5. Saskatchewan, crop insurance, and what to watch
What's new: Saskatchewan's 2026 Crop Planning Guide comes to a less favorable answer for malt barley than NDSU. Its malt barley budget has the lowest return over variable expenses of the five crops compared here, in both the dark brown and black soil zones [7].
Evidence:
| Saskatchewan 2026 guide, C$/acre | Price (C$/bu) | Target yield, dark brown (bu) | Return over variable, dark brown | Return over total, dark brown | Return over variable, black |
|---|---|---|---|---|---|
| Malt barley | 5.79 | 61.7 | 35.12 | −148.30 | 72.90 |
| Feed barley | 5.03 | 75.3 | 108.47 | −74.94 | 136.74 |
| HRS wheat | 7.00 | 54.9 | 70.64 | −112.78 | 118.83 |
| Durum | 7.84 | 57.6 | 164.27 | −19.14 | n/a |
| Canola | 13.20 | 43.0 | 177.37 | −6.04 | 231.47 |
Source: Saskatchewan Ministry of Agriculture, Crop Planning Guide 2026 [7]. Target yields are the five-year average of the 80th percentile of producer yields in each soil zone. Prices are the guide's estimated average farm-gate prices. Durum is not budgeted for the black zone. Total expenses exclude owner labour and management.
The Saskatchewan guide puts malt barley's premium over feed at C$0.76 a bushel. It also gives malt barley a lower target yield than feed barley and a higher herbicide bill: C$78.98 an acre against C$28.37 in the dark brown zone, because it adds a soil-applied product for Group 1-resistant wild oats [7]. On those assumptions a malt acre grosses less than a feed acre. Prairie feed barley has stayed close to the guide's price. Brokers quoted C$4.75 to C$5.25 FOB farm on October 28 [10], against the guide's C$5.03. Malt pricing, by the brokers' own account, was too thin to quote [10].
Crop insurance does not fully cover the rejection risk. Under the federal Malting Barley Price and Quality Endorsement, the additional value price above feed is capped at $1.25 a bushel under Option A and $2.00 under Option B, the contract-only option [13]. Option B requires a contract and a record of delivering at least 75% of a prior contract [13]. North Dakota's $1.12 August spread fits under both caps. The national $2.00 spread only just fits under Option B, and Idaho's $2.50 exceeds both [1][13]. Losses established only by subjective tests are not paid [13].
Ground Truth: Where the malt premium is largest, insurance covers the smallest share of it. An Idaho grower with a $2.50 spread can insure at most $2.00 of it, so the last 50 cents of a rejection is uninsured even under the best option. Under Option A it is $1.25 of the $2.50. A North Dakota grower at a $1.12 spread is fully inside both caps. So Idaho and other high-premium irrigated ground should be contracted and insured under Option B, and Option A growers should treat the uninsured part of the premium as a cost when they compare malt barley with wheat. Check the current endorsement and your county's special provisions before sales closing; the caps above are the regulation's figures, and your contract or county terms may set others.
What to watch: the first 2027 offers from Anheuser-Busch, Malteurop and Rahr, expected over the winter, and in particular their premium over feed and storage terms [11][12]. Canadian sprouting and germination results from the technical centre and the grain commission [8]. NASS's September and October malting and feed prices received, due in the next two Agricultural Prices reports [1]. And December 2027 CBOT wheat, which any wheat-linked contract will reference [4][12].
References
- USDA NASS, "Agricultural Prices," released Sep 29, 2026 (August 2026 prices received; barley tables). https://esmis.nal.usda.gov/sites/default/release-files/796084/agpr0926.txt
- USDA NASS, "Small Grains 2026 Summary," released Sep 30, 2026. https://esmis.nal.usda.gov/sites/default/release-files/796086/smgr0926.txt
- Haugen, R., NDSU Extension, "Projected 2026 Crop Budgets: North Central North Dakota," EC1654, Feb 2026. https://www.ndsu.edu/agriculture/sites/default/files/2026-02/ec1654.pdf
- USDA AMS Livestock, Poultry and Grain Market News (MT Dept. of Ag Market News), "Montana Daily Elevator Grain Bids," Oct 28, 2026 (includes CBOT/MGE settlements). https://www.ams.usda.gov/mnreports/ams_2771.pdf
- USDA AMS Livestock, Poultry and Grain Market News (ND Dept. of Ag Market News), "North Dakota Daily Grain Bids," Oct 28, 2026. https://www.ams.usda.gov/mnreports/ams_3878.pdf (the MyMarketNews viewer, https://mymarketnews.ams.usda.gov/viewReport/3878, timed out on Oct 29, 2026; the PDF edition was used)
- USDA AMS Livestock, Poultry and Grain Market News (MN Dept. of Ag Market News), "National Daily Sunflower, Canola, Millet, and Flaxseed Report," Oct 28, 2026. https://www.ams.usda.gov/mnreports/ams_2887.pdf
- Saskatchewan Ministry of Agriculture, "Crop Planning Guide 2026." https://pubsaskdev.blob.core.windows.net/pubsask-prod/153137/Crop%252BPlanning%252BGuide%252B2026-Web.pdf
- Pratt, S., The Western Producer, "Canadian malting barley in short supply in 2026-27," Oct 19, 2026. https://www.producer.com/news/canadian-malting-barley-in-short-supply-in-2026-27/
- Pratt, S., The Western Producer, "Malting barley premium narrows in 2025-26," Jun 11, 2026. https://www.producer.com/news/malting-barley-premium-narrows-in-2025-26/
- Rayglen Commodities Inc., "Grain News" market comments, Oct 14, Oct 21 and Oct 28, 2026. https://www.rayglen.com/grain-news/
- Bailey, A., Agweek, "Expert says barley has been a 'sick market' but it's 'getting better,'" Dec 19, 2025. https://www.agweek.com/crops/cereal-grains/expert-says-barley-has-been-a-sick-market-but-its-getting-better
- Bailey, A., Agweek, "U.S. barley acreage hit lowest level since 1876 as beer demand sinks," Dec 30, 2024 (https://www.grandforksherald.com/business/u-s-barley-acreage-hit-lowest-level-since-1876-as-beer-demand-sinks); and Bailey, A., Agweek, "With fewer people choosing beer, abundant barley is left in the bins," Dec 13, 2023 (https://www.agweek.com/crops/other-crops/with-fewer-people-choosing-beer-abundant-barley-is-left-in-the-bins).
- 7 CFR 457.118, Malting Barley Price and Quality Endorsement, as reproduced by FindLaw, accessed Oct 29, 2026. https://codes.findlaw.com/cfr/title-7-agriculture/cfr-sect-7-457-118/ (the official eCFR page redirected to a bot check on Oct 29, 2026 and was not read)
- Sorenson, B. and P. Schwarz, North Dakota State University, "Understanding grain quality," University of Minnesota Extension, reviewed 2018. https://extension.umn.edu/small-grains-crop-and-variety-selection/understanding-grain-quality
- The Ohio State University, Agronomic Crops Network, "Grain Quality Parameters," undated. https://agcrops.osu.edu/node/5638
- Country Malt Group, "2026 Barley & Hop Harvest Update," undated (published during the 2026 harvest). https://resources.countrymalt.com/?p=308150
Not reached or not found: no 2026 Montana State University or University of Idaho barley enterprise budget was found (the University of Idaho says it updates its budgets in odd years). No 2027 contract terms were found from Anheuser-Busch, Molson Coors, Malteurop, Rahr or Canada Malting. Michigan State University's malting barley quality PDFs returned an HTML page in place of the document and were not read.
Disclosures
Crop Root Zone is an independent publication. Nothing here is investment advice. Market calls, where included, reflect the editors' own read and are not a recommendation to buy or sell any security.
Oil Sunflowers Are Bid $25.90 at Enderlin, 23% Over Last Year. On NDSU's East Central Budget That Returns $159 an Acre, Ahead of Soybeans at $109, Canola at $61 and Spring Wheat at a $48 Loss.
Crusher bids for high-oleic seed are $4.90 a hundredweight over a year ago and the 2027 contract is open at $25.50. We repriced NDSU's 2026 budgets at October 27 cash bids. At budget yields, oil sunflower returns the most per acre in East Central North Dakota. At this year's state-average yields the lead shrinks to $8 over canola. To beat soybeans in 2027 a sunflower field needs about 1,855 pounds. Fertilizer is 14% of sunflower revenue, against 34% for spring wheat.
High-oleic sunflower seed was bid $25.90 a hundredweight delivered at Enderlin, North Dakota on October 27, against $21.00 a year ago. West Fargo was $25.75, also against $21.00 (USDA AMS, Oct 27, 2026) [1]. The National Sunflower Association puts October-November crush bids at $23.00 to $26.15. That is $4.90 to $5.15 over last year. Both North Dakota plants are offering 2027 new-crop contracts at $25.50 cash or $25.00 with an Act of God clause (NSA, Oct 27, 2026) [3]. The crop going into the bin is smaller per acre than last year's. USDA's October forecast puts North Dakota at 1,740 pounds an acre, down from 1,957, and the U.S. at 1,761, down from 1,861 (USDA NASS, Oct 9, 2026) [5]. As of October 25, harvest was 47% complete nationally against a 40% five-year average (NSA, Oct 26, 2026) [4]. This piece works out what an acre of sunflowers earns at these bids, how that compares with the crops it competes with for the same ground, and what the numbers say about 2027.
1. The price: crusher bids are up a quarter, and the insurance price is higher still
What's new: All three oilseeds and both grains in the North Dakota price reports are above a year ago. Sunflower and canola have gained the most.
Evidence:
| Crop, location | Oct 27, 2026 | Year ago | YoY | Basis |
|---|---|---|---|---|
| High-oleic sunflower, Enderlin, ND ($/cwt) | 25.90 | 21.00 | +23% | Processor bid, delivered truck, current |
| High-oleic sunflower, West Fargo, ND ($/cwt) | 25.75 | 21.00 | +23% | Processor bid, delivered truck, current |
| High-oleic sunflower, Jamestown, KS ($/cwt) | 21.50 | n/q | n/a | Processor bid, delivered truck, current |
| Sunflower (NuSun section), Jamestown, KS ($/cwt) | 19.50 | 14.50 | +34% | Processor bid, delivered truck, current |
| Canola, Enderlin, ND ($/cwt) | 25.13 | 20.19 | +24% | Processor bid, delivered truck, current |
| Soybeans, East Central ND ($/bu) | 11.46 | 9.63 | +19% | Country elevator average, FOB truck |
| HRS wheat 14%, East Central ND ($/bu) | 5.71 | 5.04 | +13% | Country elevator average, FOB truck |
Source: USDA AMS National Daily Sunflower, Canola, Millet, and Flaxseed Report, Oct 27, 2026 [1]; USDA AMS North Dakota Daily Grain Bids, Oct 27, 2026 [2]. Year-ago values as published in each report. "n/q" = no year-ago quote. Percentages are Crop Root Zone calculations. The AMS report carried no Goodland, Kansas quote on October 27, and no confection bid at any location.
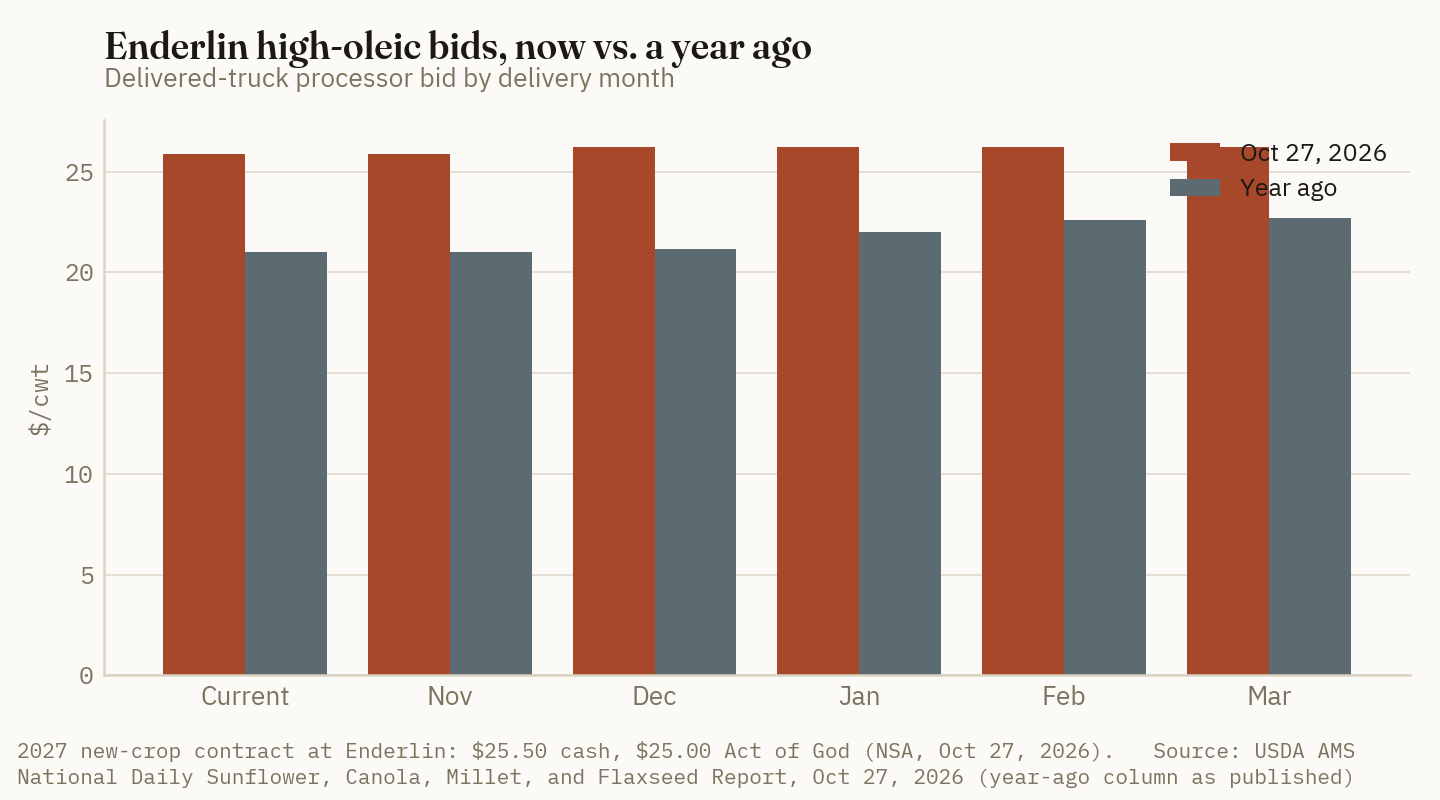
There is very little carry. The March bid at Enderlin is 35 cents above spot [1]. A year ago the spread was $1.70. With that little carry, storing the crop pays for interest and shrink and not much more. The bid for 2027 delivery is 40 cents under spot [3].
The bigger number is the crop insurance price. For North Dakota, South Dakota, Minnesota and Kansas, RMA sets the oil-type sunflower projected price from December CBOT soybean oil futures averaged over February. It divides each day's settlement by two and adds one cent a pound. The harvest price uses the same formula over October 1-31 (USDA RMA, CEPP Sunflowers) [13]. The 2026 projected price came out at $29.40 a hundredweight for oil-type and $37.60 for confection. Those are 22% and 17% above 2025 (NSA, Mar 2, 2026) [11]. The insurance price is $3.50 above the best crusher bid in the state. Sunflower revenue insurance is priced off soybean oil. The bid at Enderlin depends on the sunflower oil and meal markets. This year the two have moved apart.
Ground Truth: Sunflower's insurance guarantee is high compared with its cash market this year. NDSU budgets 75% Revenue Protection [6]. At East Central North Dakota's 2,030-pound budget yield, that guarantees about $448 an acre at the $29.40 projected price. NDSU's own February revenue projection for the same acre was $430 [6]. So an East Central grower insured for more than the budget expected to earn. The guarantee does not depend on what Enderlin pays. It depends on what soybean oil does, and that is a biofuel-policy market. If soybean oil is still firm in February 2027, sunflower will again carry an unusually high revenue floor. Sunflower growers should follow the soybean oil market as closely as they follow their local crusher bid.
The 2026 harvest price will be set from the October 1-31 average and published after the month closes. We could not get December 2026 soybean oil settlements from a public source, so we cannot estimate it. As a Crop Root Zone estimate: at North Dakota's forecast 1,740 pounds, an acre insured on a 2,030-pound history pays nothing unless the harvest price falls below about $25.73 a hundredweight. That works out to a December soybean oil average near 49.5 cents a pound [13]. For comparison, the 2025 harvest prices were $26.20 for oil-type and $35.10 for confection (NSA, Nov 3, 2025) [12].
2. The crop: more acres, fewer pounds per acre, and Kansas hit hardest
What's new: USDA's October 9 Crop Production put U.S. harvested sunflower area at 1.309 million acres, up 4% from 1.255 million. The yield forecast is 1,761 pounds an acre, down 100. Production is forecast at 2.305 billion pounds, about 1% below 2025 [5]. Split yields for oil-type and non-oil sunflowers will not be published until the January annual summary [5].
Evidence:
| State | Harvested 2026 (1,000 ac) | Harvested 2025 (1,000 ac) | Yield 2026 (lb/ac) | Yield 2025 (lb/ac) | Production 2026 (mil lb) | Harvested, Oct 25 | 5-yr avg |
|---|---|---|---|---|---|---|---|
| North Dakota | 612.0 | 561.0 | 1,740 | 1,957 | 1,064.7 | 46% | 40% |
| South Dakota | 457.5 | 439.5 | 1,959 | 1,975 | 896.4 | 45% | 38% |
| Minnesota | 102.5 | 83.1 | 1,889 | 2,183 | 193.6 | 45% | 60% |
| Kansas | 21.0 | 24.5 | 1,102 | 1,554 | 23.2 | 37% | 56% |
| Colorado | 38.5 | 38.0 | 1,004 | 1,100 | 38.7 | 52% | 52% |
| United States | 1,308.6 | 1,254.9 | 1,761 | 1,861 | 2,304.7 | 47% | 40% |
Source: USDA NASS Crop Production, Oct 9, 2026 (all sunflower types; 2026 is the October 1 forecast) [5]; harvest progress from USDA Crop Progress as relayed by NSA Sunflower Highlights, Oct 26, 2026 [4]. Basis: all types, harvested acres.
Non-oil (confection) harvested area is up 15%, to 107,100 acres from 93,400. North Dakota has 67,000 of those acres [5]. Minnesota more than doubled its non-oil area, to 7,500 acres. Kansas has the worst numbers in the table. Its harvested area is down 14% and its yield forecast is down 29%, which leaves it 23 million pounds of production. Its harvest is also 19 points behind average [4][5].
The supply side is not tight enough to explain the price on its own. USDA's July balance sheet had 2026/27 ending stocks up 11%, at 359 million pounds (NSA, Jul 20, 2026) [17]. Oil World estimates world sunflower production for 2026/27 at 65.3 million metric tons, up 7.4 million from last year. NSA says Russian and Ukrainian crushers have not been able to benefit from the larger crop because of attacks on shipping and logistics constraints [3][4]. That gives a crusher in the Dakotas a better market for sunflower oil than world supply would suggest. NSA says the situation "bears watching" if shipping is still disrupted after January [4]. That is the main downside risk to the 2027 contract.
3. Per-acre returns: sunflower first at budget yields, by a smaller margin at this year's yields
What's new: NDSU published its 2026 projected budgets in February. Its farm management specialist summarized them as "a revenue problem," with returns low or negative for most crops (NDSU Extension, Feb 6, 2026) [8]. The revenue side has changed since then. We repriced the East Central region budget (Eddy, Foster, Griggs, Stutsman and Wells counties) at October 27 cash bids and held NDSU's per-acre costs fixed [6]. These are Crop Root Zone calculations, not NDSU figures.
Evidence:
| East Central ND, per acre | Oil sunflower | Confection sunflower | Soybeans | Canola | HRS wheat |
|---|---|---|---|---|---|
| NDSU budget yield | 2,030 lb | 1,740 lb | 36 bu | 1,770 lb | 55 bu |
| NDSU Feb price | $21.20/cwt | $28.30/cwt | $9.75/bu | $20.10/cwt | $5.81/bu |
| Direct costs | $227.96 | $256.56 | $173.77 | $252.24 | $230.35 |
| Total listed costs (incl. $75 land) | $366.70 | $394.15 | $303.63 | $383.53 | $361.85 |
| Return to labor & mgmt, NDSU Feb | $63.66 | $98.27 | $47.37 | −$27.76 | −$42.30 |
| Oct 27 cash price | $25.90/cwt | no public bid | $11.46/bu | $25.13/cwt | $5.71/bu |
| Return to labor & mgmt, Oct 27 bid | $159.07 | n/a | $108.75 | $61.27 | −$47.60 |
| Return over direct costs, Oct 27 bid | $297.81 | n/a | $238.61 | $192.56 | $83.90 |
| Total-cost break-even price | $18.06/cwt | $22.65/cwt | $8.43/bu | $21.67/cwt | $6.58/bu |
Source: NDSU Extension EC1658, Projected 2026 Crop Budgets, East Central North Dakota, Feb 2026 [6]; bids from USDA AMS, Oct 27, 2026 [1][2] (Enderlin processor bids for sunflower and canola; East Central ND elevator averages for soybeans and HRS wheat). Repriced returns and break-evens are Crop Root Zone calculations. Costs are NDSU's dryland recrop figures and exclude PLC and ARC payments.
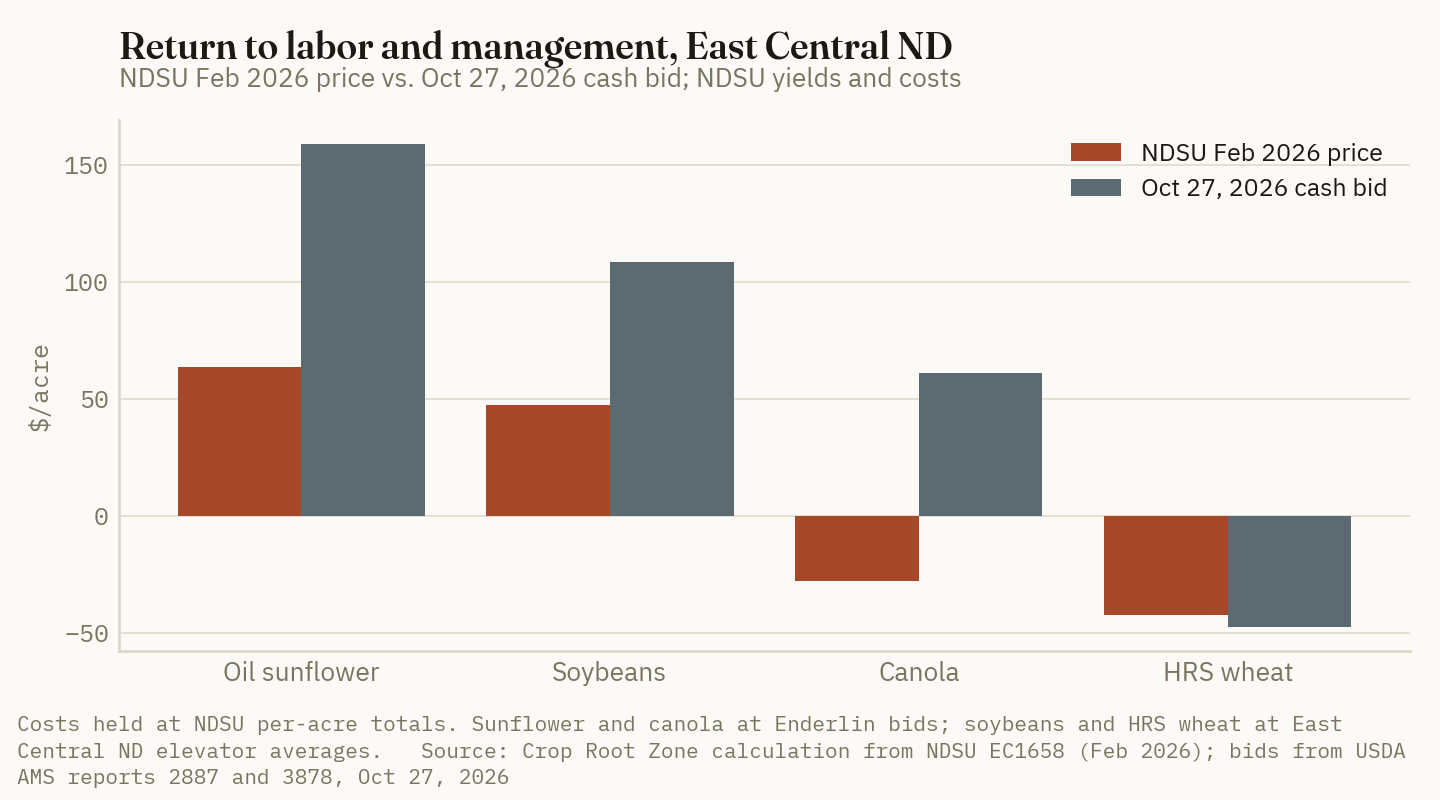
$159 an acre
Oil sunflower's return to labor and management in East Central North Dakota at the $25.90 Enderlin bid, using NDSU's budget yield and costs. It is the highest of the region's four main crops. (Crop Root Zone calculation from NDSU EC1658, Feb 2026, and USDA AMS, Oct 27, 2026)
The ranking is about the same in NDSU's North East region (Cavalier, Nelson, Ramsey and Towner counties). There, oil sunflower budgeted at 2,080 pounds returns about $172 an acre at $25.90. Canola budgeted at 1,980 pounds returns about $102, soybeans about $49 and HRS wheat about −$26. Those are Crop Root Zone calculations from that region's budget at Enderlin and Northeast elevator bids [7][1][2].
The budget yields are seven-year averages for 2018-2024 with the high and low years dropped [6]. This year's state averages are different. North Dakota's sunflower forecast is 1,740 pounds, below the 2,030-pound East Central budget, while canola is forecast at 1,830 pounds, above its 1,770 budget. North Dakota soybeans are forecast at 32 bushels against a 36-bushel budget [5]. Using those state yields with East Central costs, as a Crop Root Zone estimate, oil sunflower returns about $84, canola about $76 and soybeans about $63. Sunflower is still first, but its lead over canola falls from $98 to $8.
Confection is a contract crop, and its price is not public. Neither the AMS report nor NSA's daily page carries a confection bid [1][3]. As a Crop Root Zone estimate, at NDSU's 1,740-pound confection yield, a confection contract has to pay about $31.79 a hundredweight to match oil-type's return at $25.90. That is $5.89 over the crush bid. The RMA confection price of $37.60 is above that [11]. The best public check on actual payments is NASS's all-sunflower price received, which blends oil and confection. It was $30.20 in North Dakota in August, against $27.80 a year earlier (USDA NASS, Sep 29, 2026) [16].
4. Fertilizer: a smaller share of sunflower revenue than of wheat or canola
What's new: NDSU priced its 2026 budgets at $0.58 a pound of nitrogen, $0.68 a pound of phosphorus and $0.38 a pound of potassium [6]. It also said the warm, wet fall of 2025 left more nutrients in the soil, so fertilizer rates should be lower than in 2025, but higher prices still raise the cost per acre [8]. Retail prices have risen since then. In the second week of October, DTN's national survey had anhydrous at $987 a ton, up 18% from a year ago, and urea at $674, up 13%. MAP was $981, up 5%, and UAN28 was $441, up 7%. Per pound of nitrogen, anhydrous was $0.60, urea $0.73 and UAN28 $0.79 (DTN, Oct 21, 2026) [10].
Evidence: NDSU's budgets show one fertilizer line per crop and do not split it by nutrient [6]. The useful comparison is that line against what the crop earns at current prices.
| East Central ND, Oct 27 prices | Fertilizer $/acre | Share of revenue | |
|---|---|---|---|
| HRS wheat | 106.14 | 33.8% | ██████████ |
| Canola | 101.33 | 22.8% | ███████░░░ |
| Oil sunflower | 74.53 | 14.2% | ████░░░░░░ |
| Soybeans | 13.16 | 3.2% | █░░░░░░░░░ |
Source: Crop Root Zone calculation from NDSU EC1658, Feb 2026 [6], and USDA AMS bids, Oct 27, 2026 [1][2]. Basis: $/acre at NDSU's fertilizer prices and budget yields. Revenue = budget yield x Oct 27 cash bid. Bars scaled to wheat = 10.
The fertilizer line is 32.7% of oil sunflower's direct costs and 20.3% of total listed costs. For canola the shares are 40.2% and 26.4%, for HRS wheat 46.1% and 29.3%, and for soybeans 7.6% and 4.3% [6]. The High Plains budget looks similar. The University of Nebraska's 2026 dryland Panhandle sunflower budget applies 60 pounds of nitrogen as UAN28 at $0.78 a pound, or $46.80 an acre. That is 22% of its $213.58 operating cost and 14% of its $334.59 total economic cost, at a 16-hundredweight yield goal (UNL, 2026) [9].
We do not know the nitrogen and phosphate pounds behind NDSU's line, so we cannot reprice it exactly for 2027. As a rough Crop Root Zone estimate: MAP at $981 implies about $0.79 a pound of phosphate once its nitrogen is valued at urea's $0.73. That is about 16% above NDSU's $0.68. Nitrogen moves from NDSU's $0.58 to between $0.60 and $0.73, depending on the product [10]. So we tested fertilizer increases of 10% and 20%.
| 2027 sensitivity, East Central ND | Return at 2027 price, 2026 costs | +10% fertilizer | +20% fertilizer | 2027 price used |
|---|---|---|---|---|
| Oil sunflower | $150.95 | $143.50 | $136.04 | $25.50/cwt new-crop contract, Enderlin [3] |
| Soybeans | $106.32* | $105.00* | $103.69* | $11.39/bu* = Sep 2027 CBOT less current basis |
| Canola | $72.60* | $62.47* | $52.33* | $25.77/cwt* = Enderlin March 2027 bid |
| HRS wheat | −$21.40* | −$32.01* | −$42.63* | $6.19/bu* = Sep 2027 MGE less current basis |
Source: Crop Root Zone estimates. Costs from NDSU EC1658 [6] with the fertilizer line raised as shown; futures and basis from USDA AMS, Oct 27, 2026 [1][2]. *No public 2027 new-crop cash bid exists for these crops. Soybeans and HRS wheat use the furthest listed futures month with East Central ND's current basis midpoint. Canola uses the furthest listed old-crop processor bid. All starred values are estimates, not quotes.
Ground Truth: Higher fertilizer prices do not change the ranking. At a 20% fertilizer increase, sunflower loses $15 an acre, canola loses $20, wheat loses $21 and soybeans lose $3. What changes the ranking is yield. At the $25.50 contract and NDSU's costs, a sunflower field needs about 1,438 pounds to cover total listed cost. It needs about 1,855 pounds to match the estimated 2027 soybean return. That is close to the 2,030-pound budget average, and well above this year's 1,740-pound state forecast. In practice, growers should price 2027 sunflowers only on fields with a record of at least 1,850 pounds. On weaker ground the extra margin over soybeans is not there. Book only the acres that clear that bar, and leave the rest unpriced until February.
5. Program payments, and what to watch before the 2027 contract
What's new: Sunflower seed's effective reference price for the 2025 crop is $0.2375 a pound, or $23.75 a hundredweight. FSA's July table projected the 2025/26 marketing-year average at $23.50, a 25-cent PLC rate. It showed the 2025 wheat rate final at $1.29 a bushel on a $6.35 reference price, and soybeans at $0.31 (K-State, Jul 10, 2026) [14]. For the 2026 crop, FSA's July projection put the sunflower MYA at $24.00, for a projected PLC rate of zero (USDA FSA, Jul 2026) [15]. We could not open FSA's October edition to check that figure (see References).
Evidence: PLC pays on 85% of a farm's base acres at the farm's program yield, less 5.7% sequestration, whatever crop is planted [14]. NDSU leaves PLC and ARC out of its budgets for the same reason: the payments follow base acres, not the crop planted [6]. With Enderlin at $25.90, $2.15 above the reference price, sunflower base is unlikely to pay much for 2026. A farm's wheat base will pay whatever wheat's 2026 rate turns out to be, regardless of what goes on that ground in 2027. Program payments should be left out of the planting comparison.
Ground Truth: The biggest risk to the 2027 sunflower contract is that Black Sea shipping recovers. The yield risk is smaller and better known. NSA says Russian and Ukrainian crushers cannot currently benefit from a world crop that is 7.4 million tons larger than last year's [3][4], and that is part of why U.S. crushers can pay $25.90. If shipping routes reopen in January, as traders hope [4], sunflower oil could fall faster than soybean oil. In that case the RMA projected price would still be set off soybean oil in February, but the crusher bid could fall. We would take an Act of God contract on part of expected 2027 production now, at $25.00, while sunflower is still priced independently of the Black Sea. Leave the rest open until the February projected price is known. We covered the comparable canola numbers in September (Crop Root Zone, Sep 22, 2026) [18]. Canola's fertilizer bill is larger, and so is its exposure to fertilizer prices.
What to watch: RMA's 2026 sunflower harvest price after October 31 [13]. North Dakota's harvest, at 46% against a 40% average [4]. The January Crop Production annual summary, which will split oil-type and non-oil yields for the first time this season [5]. February's soybean oil average, which sets the 2027 projected price [13]. And whether Enderlin and West Fargo hold the $25.50 new-crop bid once Black Sea shipping news comes in early in the year [3][4].
References
- USDA AMS Livestock, Poultry and Grain Market News (MN Dept. of Ag Market News), National Daily Sunflower, Canola, Millet, and Flaxseed Report, Oct 27, 2026 (includes year-ago bids and CBOT/MGE settlements). https://mymarketnews.ams.usda.gov/viewReport/2887
- USDA AMS Livestock, Poultry and Grain Market News (ND Dept. of Ag Market News), North Dakota Daily Grain Bids, Oct 27, 2026. https://mymarketnews.ams.usda.gov/viewReport/3878
- National Sunflower Association, "Daily Market News," Oct 27, 2026. https://www.sunflowernsa.com/growers/marketing/daily-market-news
- National Sunflower Association, "Sunflower Highlights," Oct 26, 2026 (relays USDA Crop Progress and Oil World). https://sunflowernsa.com/smartmail/sunflower-highlights-october-26-2026/
- USDA NASS, "Crop Production," released Oct 9, 2026. https://esmis.nal.usda.gov/sites/default/release-files/796101/crop1026.txt
- Haugen, R., NDSU Extension, "Projected 2026 Crop Budgets: East Central North Dakota," EC1658, Feb 2026. https://www.ndsu.edu/agriculture/sites/default/files/2026-02/ec1658.pdf
- Haugen, R., NDSU Extension, "Projected 2026 Crop Budgets: North East North Dakota," EC1655, Feb 2026. https://www.ndsu.edu/agriculture/sites/default/files/2026-02/ec1655.pdf
- NDSU Agriculture Communication, "NDSU crop budget projections show low returns for 2026," Feb 6, 2026. https://www.ag.ndsu.edu/news/newsreleases/2026/february/ndsu-crop-budget-projections-show-low-returns-for-2026
- University of Nebraska-Lincoln, Center for Agricultural Profitability, "2026 UNL #072 Sunflower, Dryland, Panhandle after Wheat, Two Crops in Three Years," 2026. https://cap.unl.edu/sites/unl.edu.ianr.agecon.center-for-ag-profitability/files/media/file/%23072%20Sunflower%2C%20Dryland%2C%20Panhandle%20after%20Wheat%2C%20Two%20Crops%20in%20Three%20Years_2026.pdf
- Quinn, R., DTN Retail Fertilizer Trends, "UAN32, UAN28, Anhydrous Lead Prices," Oct 21, 2026. https://www.dtnpf.com/agriculture/web/ag/crops/article/2026/10/21/uan32-uan28-anhydrous-lead-prices
- National Sunflower Association, "Sunflower Highlights," Mar 2, 2026 (RMA 2026 projected prices). https://sunflowernsa.com/smartmail/sunflower-highlights-march-2-2026
- National Sunflower Association, "Sunflower Highlights," Nov 3, 2025 (2025 RMA harvest prices). https://sunflowernsa.com/smartmail/sunflower-highlights-november-3-2025/
- USDA RMA / Federal Crop Insurance Corporation, "Commodity Exchange Price Provisions, Section II – Sunflowers," 23-CEPP-0078, released Jun 2022, effective 2023 and succeeding crop years. https://www.rma.usda.gov/sites/default/files/crop-policies/Commodity-Exchange-Price-Provisions---Sunflowers-23-CEPP.pdf
- Reid, R. and J. Ifft, K-State Department of Agricultural Economics, "National Estimated 2025 Price Loss Coverage Payments to be paid October 2026," Jul 10, 2026 (reproduces USDA FSA table of Jul 10, 2026). https://www.agmanager.info/sites/default/files/pdf/National%20Estimated%20PLC%20Payments%207.10.2026.pdf
- USDA FSA, "Projected 2026 Price Loss Coverage Payment Rates," Jul 2026 edition. https://www.fsa.usda.gov/sites/default/files/2026-07/2026_PLC.pdf (the PDF timed out on Oct 28, 2026; the sunflower row was read from the search-index text of this file. FSA's October 2026 edition also timed out and was not checked.)
- USDA NASS, "Agricultural Prices," released Sep 29, 2026. https://esmis.nal.usda.gov/sites/default/release-files/796084/agpr0926.txt
- National Sunflower Association, "Sunflower Highlights," Jul 20, 2026 (USDA 2026/27 sunflower balance sheet). https://sunflowernsa.com/smartmail/sunflower-highlights-july-20-2026/
- Crop Root Zone, "North Dakota Canola Is Bid 31% Over Last Year. Its Fertilizer Program Costs 6% More, and the Bill Fell From 6.0 Hundredweight an Acre to 4.8," TRZ-0219, Sep 22, 2026.
Disclosures
Crop Root Zone is an independent publication. Nothing here is investment advice. Market calls, where included, reflect the editors' own read and are not a recommendation to buy or sell any security.
August Moved Corn Acres Up 1.4 Million and Yield Down 2.3 Bushels. The Crop Changed by 0.08%.
Two revisions worth roughly 200 million bushels each cancelled to 13 million — but one of them is close to settled and the other has six weeks of weather left, which is the whole difference for anyone pricing grain into Friday's report.
USDA's August report did two large things to the corn balance sheet and they nearly cancelled. Planted area went to 96.7 million acres, up 1.4 million from July. National yield went to 180.7 bu/acre, down 2.3 from 183.0. Production finished at 16.013 billion bushels against July's 16.0 billion — a move of about 13 million bushels, or 0.08% of the crop (USDA/DTN, Aug 12, 2026).
A wash, read as a headline. Not a wash at all, read as a position. The next Crop Production and WASDE are scheduled for Friday, 11 September under USDA's published 2026 release calendar, and the two revisions that offset in August will not behave the same way on Friday or in any month after it.
1. The decomposition, done explicitly
The two effects are separable and the arithmetic is worth doing rather than asserting.
| Component | Calculation | Bushel effect |
|---|---|---|
| Yield revision | −2.3 bu/ac × 88.6 mn harvested acres | −204 mn bu |
| Area revision (implied) | balance to reported production | +217 mn bu |
| Net change in production | 16.000 → 16.013 bn bu | +13 mn bu |
Source: USDA August 2026 Crop Production and WASDE, Aug 12, 2026, as reported by DTN/Progressive Farmer. The area effect is derived here as the residual and is a Crop Root Zone estimate, not a USDA line item.
0.08%
How much the August revisions moved the US corn crop, after two component changes each worth roughly 200 million bushels ran in opposite directions. (Derived from USDA August 2026 Crop Production, Aug 12, 2026)
The soybean side did the same thing in miniature: planted area up 1.4 million to 86.8 million, yield down 0.3 to 52.7, production 4.519 billion bushels and described by USDA as the largest US soybean crop on record.
| Line | July 2026 | August 2026 | Change |
|---|---|---|---|
| Corn planted (mn ac) | 95.3 | 96.7 | +1.4 |
| Corn harvested (mn ac) | — | 88.6 | — |
| Corn yield (bu/ac) | 183.0 | 180.7 | −2.3 |
| Corn production (bn bu) | 16.000 | 16.013 | +0.013 |
| Corn ending stocks (bn bu) | 1.790 | 1.653 | −0.137 |
| Corn season-avg price ($/bu) | 4.40 | 4.50 | +0.10 |
| Soybean planted (mn ac) | 85.4 | 86.8 | +1.4 |
| Soybean yield (bu/ac) | 53.0 | 52.7 | −0.3 |
| Soybean production (bn bu) | — | 4.519 | record |
| Soybean ending stocks (mn bu) | 310 | 320 | +10 |
Source: USDA WASDE and Crop Production, Aug 12, 2026, via DTN/Progressive Farmer. August values and the stated changes are as reported; the July column is back-calculated from those reported changes rather than quoted from the July release, and is arithmetic, not an independent estimate.
2. The bullish content of August was not in the production line
Corn production rose 13 million bushels and corn ending stocks fell 137 million bushels. Those cannot both be supply facts. The carryout move came from the demand side of the balance sheet, and the season-average farm price went up a dime to $4.50 with it.
This is the part that gets lost when a report is summarised by its production number. A crop that got marginally larger and a carryout that got materially smaller is a demand story wearing a supply headline. It is also the reading most consistent with what the cash market has been doing: soybeans have been carried by fresh Chinese purchasing — a 192,000 tonne sale for 2026/27 delivery was among the prints supporting the market into this week — while December corn closed at $5.33½, down 3¼ cents, against November soybeans at $13.16¼, up 6½ cents, on Monday 8 September (Brownfield Ag News closing futures, Sep 8, 2026).
Ground Truth: A 137 million bushel carryout cut against a 13 million bushel production increase is the single most informative pair of numbers in the August report, and it is almost never quoted together. It says the tightening this summer came from usage, not from weather — which matters because usage revisions do not reverse when it rains.
3. Why the two revisions are not equally durable
Here is the asymmetry, and it is the reason a "wash" is not a wash.
Planted and harvested area converges and then stops. Acreage estimates are refined as administrative data lands, and by the end of the marketing year the area line has effectively stopped moving. A bushel that entered the crop because acres were revised up is, in practical terms, a bushel that stays.
Yield is resurveyed every month until January. It has the rest of September, all of October, and the harvest-sample months still in front of it. A 2.3 bushel cut is not a settled fact; it is the current estimate of an unfinished quantity. It can be given back in a single report.
For anyone with grain to price, that turns the August wash into a directional statement: the crop carries more downside-resistant bushels than it did in July, and its remaining variance is concentrated almost entirely in one line. The acreage floor under production got firmer while the yield estimate got softer. Those are not the same risk and should not be hedged as if they were.
| Revision type | Still moving? | Resurveyed | Practical read |
|---|---|---|---|
| Planted / harvested area | Converging | Refined toward administrative records | Treat as close to settled |
| National yield | Yes | Monthly through January | Treat as the live variable |
Source: Crop Root Zone characterisation of USDA's estimating process; the schedule of monthly Crop Production releases is USDA's published 2026 calendar.
4. What this does to the fertilizer decision
This is where the report reaches the nutrient budget, and the link is second-order rather than direct — 2026's nitrogen is already in the ground.
Ninety-six point seven million corn acres is the number that eventually sets 2027 nitrogen demand, because it sets the carryout, which sets the price, which sets the acre. Run the sensitivity on the revision alone: 1.4 million additional corn acres at a 150 lb N/acre program is about 210 million pounds of N, or roughly 105,000 short tons of nitrogen — near 128,000 short tons of anhydrous-equivalent product. Against retail anhydrous at $923/st, that is on the order of $118 million of retail nitrogen attached to a single acreage revision (Crop Root Zone estimate; rate assumption stated, product price from DTN retail averages for the week of Aug 24–28, 2026).
That figure is an illustration of scale, not a forecast. It is worth carrying anyway, because acreage revisions are usually discussed purely as bushels and they are also tons.
Three practical reads into Friday:
Price the settled half, not the whole. The area-driven bushels are the ones least likely to be handed back. If a marketing plan needs coverage, the case for it does not depend on the yield line holding.
Do not treat a yield increase on Friday as a new crop. A restored 2.3 bushels would return roughly 200 million bushels to the balance sheet and would leave the demand-side tightening that cut carryout 137 million bushels entirely intact. Those are independent.
Watch the carryout line first. It moved five times harder than production in August. If it moves again on Friday while production is flat, the report is about usage again, and usage is the durable half.
Ground Truth: The right question going into Friday is not "how big is the crop." It is "which line moved." A production change driven by area is close to permanent; one driven by yield is a monthly opinion with three more months to change its mind; and a change in ending stocks with production flat is neither — it is demand, and it is the only one of the three that has been consistently pointing the same direction all summer.
5. The soybean side carries the opposite risk profile
Corn and soybeans got the same treatment in August — 1.4 million acres added to each, yield trimmed on both — and they arrive at Friday in genuinely different positions.
Corn's carryout fell 137 million bushels to 1.653 billion. Soybeans' carryout rose 10 million to 320 million, on a crop USDA described as the largest in US history at 4.519 billion bushels. One balance sheet tightened into a record production number; the other loosened slightly.
Yet November soybeans closed at $13.16¼ on 8 September, up on the day, while December corn closed at $5.33½ and down. A record crop with a rising carryout is trading better than a smaller crop with a falling one, and the reason is entirely on the demand side: fresh Chinese purchasing, including a 192,000 tonne sale for 2026/27 delivery among the prints supporting the market into this week.
| Corn | Soybeans | |
|---|---|---|
| Production direction, Aug | +13 mn bu | record, 4.519 bn bu |
| Ending stocks | −137 mn bu | +10 mn bu |
| Season-average price | $4.50 (+10¢) | $11.40 (unchanged) |
| Futures, 8 Sep | Dec $5.33½, −3¼ | Nov $13.16¼, +6½ |
| Where the variance sits | US yield line | export demand |
Sources: USDA Crop Production and WASDE, Aug 12, 2026; Brownfield Ag News closing futures, Sep 8, 2026.
That last row is the one to act on. Corn's remaining uncertainty is domestic and agronomic; soybeans' is foreign and political. A yield revision on Friday resolves some of corn's; it resolves none of soybeans', because the soybean question is whether a buying programme continues, and no US crop report answers that.
The practical consequence for a marketing plan is that the two crops should not be hedged on the same calendar. Corn's information arrives on a published schedule — Friday, then October, then the harvest survey months. Soybeans' information arrives when a sale is announced, on no schedule at all. A plan that treats Friday as the decision point for both is applying corn's logic to a market that does not run on it.
References
[1] USDA, World Agricultural Supply and Demand Estimates and Crop Production — Aug 12, 2026. https://www.usda.gov/about-usda/general-information/staff-offices/office-chief-economist/commodity-markets/wasde-report
[2] DTN/Progressive Farmer, "USDA Raises Corn, Soybean Production With More Planted Acres for Both Crops" — Aug 12, 2026. https://www.dtnpf.com/agriculture/web/ag/news/article/2026/08/12/usda-releases-august-crop-production-4
[3] USDA 2026 WASDE release calendar (September report scheduled 11 September 2026). https://agsist.com/usda-calendar
[4] Brownfield Ag News, "Closing Grain and Livestock Futures: September 8, 2026." https://www.brownfieldagnews.com/market-news/closing-grain-and-livestock-futures-september-8-2026/
[5] DTN/Progressive Farmer retail fertilizer trends — Sep 2, 2026, covering the week of Aug 24–28, 2026 (anhydrous $923/st retail, used for the nitrogen-tonnage illustration). https://www.dtnpf.com/agriculture/web/ag/crops/article/2026/09/02/fertilizer-prices-fall-uan28-urea
Disclosures
Crop Root Zone is an independent publication. Nothing here is investment advice. Market calls, where included, reflect the editors' own read and are not a recommendation to buy or sell any security.
A Round-Bale Barn Costs About $30 a Ton a Year and a Tarp on Rock About $11. The Tarp Pays at $60 to $140 Hay. Against the Tarp, the Barn Needs $610 Hay or an $18 Sale Premium.
USDA's September prices put other hay at $143 and alfalfa at $208. Across six sets of trial evidence, a tarp on a rock pad covers its cost at $59 to $139 a ton in four and at $203 and $372 in the two low-loss sets. A barn's three-point dry matter edge over that tarp is worth $4 to $6 a ton at today's prices against an $18 extra cost at 400 bales, so a new barn only pays on hay sold into a grade premium, or against bare ground at the right bale count.
Other hay averaged $143 a ton in September and alfalfa hay $208, USDA reported on October 30. Alfalfa is up 21% on the year and other hay 4%, though other hay fell $9 from August (USDA NASS, Oct 30, 2026) [1]. Most round bales in the country are now wherever they are going to spend the winter. Our October piece priced the nutrients a ton of hay removes [2]. This one prices what happens to the ton after baling. We rebuilt the extension storage budgets at 2026 costs, and the results rank the options clearly. A tarp on crushed rock pays at most hay prices in humid country. A new barn rarely beats that tarp on dry matter saved. The barn's case depends on whether the hay is sold on grade and on how many bales it holds.
1. What a ton is worth this fall
What's new: The October report shows a wide gap between national averages and what round bales bring at sale. A storage budget should use the price the operation could get for the hay it is protecting.
Evidence:
| Hay and basis | Price, $/ton | Date |
|---|---|---|
| Alfalfa hay, US average, price received | 208 | Sep 2026 (172 in Sep 2025) |
| All hay, US average, price received | 188 | Sep 2026 (162 in Sep 2025) |
| Other hay, US average, price received | 143 | Sep 2026 (137 in Sep 2025) |
| Premium and Supreme alfalfa, Pennsylvania, price received | 355 | Sep 2026 |
| Grass, Premium, large round, Rock Valley, IA auction | 248.15 | Oct 29, 2026 |
| Grass, Good/Premium, large round, same sale | 217.19 | Oct 29, 2026 |
| Grass, Fair/Good, large round, same sale | 193–197 | Oct 29, 2026 |
| Grass, Utility/Fair, large round, same sale | 159.13 | Oct 29, 2026 |
| Brome, Fair, large round, Nebraska direct, F.O.B. | 150 | Week of Oct 22, 2026 |
| Alfalfa/grass mix, Premium, large round, Iowa direct, F.O.B. | 150 | Oct 20, 2026 |
| Alfalfa, Grade 1 vs. Prime, large round, Upper Midwest | 123 vs. 181 | Sep 1, 2026 |
| Grass, Grade 2 vs. Grade 1, large round, Upper Midwest | 88 vs. 127 | Sep 1, 2026 |
Source: USDA NASS, Oct 30, 2026 [1]; USDA AMS, Oct 20, Oct 22 and Oct 30, 2026 [3][4][5]; UW–Madison Extension, Sep 1, 2026 [6]. Prices received cover all bale types and are not round-bale quotes. Upper Midwest prices are as-fed, from quality-tested sales; the $88 Grade 2 grass average sits above that line's reported $50 to $60 range, which the source attributes to averaging each column separately, so we treat it as approximate.
Two numbers matter for what follows. The first is the value of one point of dry matter, which is $1.43 a ton on other hay and $2.08 on alfalfa. The second is the width of a grade step. At Rock Valley each step on large round grass was worth about $20 to $38. In the Upper Midwest sheet it was $39 on grass and $58 on alfalfa. Lot differences include more than storage, so those spreads are an upper bound on what storage alone can claim.
State prices run from $68 for other hay in North Dakota to $220 in Washington [1]. The same bale is worth three times as much in one place as in another, and that spread drives most of the answer.
2. What the trials say each system loses
What's new: Nothing has changed in the agronomy. The evidence is old, wide and still the best available, and the honest way to use it is as a range.
Evidence:
| Storage system, % dry matter lost | Wisconsin, 6 mo | Wisconsin, 12 mo | 13-source mean, 6 mo | Kentucky | Oklahoma, up to 9 mo | Oklahoma, 12–18 mo |
|---|---|---|---|---|---|---|
| Bare ground, uncovered | 9.5 | 13 | 27 | 25–35 | 5–20 | 15–50 |
| Net wrap on ground | — | — | 13 | 15–25 | — | — |
| Rock or pallets, uncovered | 7.5–8 | 8.5–10 | 22 | 13–17 | 3–15 | 12–35 |
| Tarp on bare ground | — | — | 13 | — | 5–10 | 10–15 |
| Tarp on rock or pallets | 3–4 | 4–5 | 8 | 4–7 | 2–4 | 5–10 |
| Roof, no sides | — | — | 5 | — | 2–5 | 3–10 |
| Building | 2 | 2 | 5 | 4–7 | under 2 | 2–5 |
Source: Holmes, UW, 2004 (humid climate, tight bales, plastic twine; building is roofed, no walls) [7]; Edwards, Iowa State, Nov 2017, mean of 13 studies and extension estimates [8]; Collins et al., Kentucky AGR-171, 1997 (period not stated in the table) [9]; Huhnke, Oklahoma State BAE-1716, Jul 2003 [10].
Three findings hold across these sources. Ground contact is the largest single item: Kentucky attributes about half of round-bale storage loss to it [9]. A well-secured tarp on a drained base lands close to a building, and Kentucky's table gives them the same 4 to 7%. Time matters most of all. Oklahoma's bare-ground range jumps from 5–20% before spring warm-up to 15–50% at 12 to 18 months, and Huhnke says outdoor bales there should be used by about March 1 [10].
Net wrap is no substitute for a base. Kentucky has it at 15 to 25% on the ground [9]. Wisconsin work reported by Hay & Forage Grower put it at 7 to 12% over 10 months, against 2 to 3% for breathable film and 1 to 3% indoors [11]. An Oklahoma newsletter reports 6.8% at 149 days and 8.0% at 356 days, against 9.05% and 15.1% for plastic twine [12]. Michigan State found no significant wrap difference for bales on pallets, as summarized by Ohio State [13]. Bale tightness and climate explain much of the spread, and we would not treat any one figure as a forecast.
Dry matter also understates the damage, because the weathered layer stays in the bale at reduced value. Four inches of weathering on a 5-foot bale is about 25% of its volume [9][10]. In the Indiana data Kentucky cites, weathered grass digested at 42.5% against 58.8% for the interior [9]. In Kentucky's own fescue trial, 706-lb bales stored a year on sod lost 18.2% under twine, 10.6% under mesh, 3.6% in solid plastic and 5.7% indoors. Counting weathered hay as lost widened that range to 5.7–34.1% (Collins et al., 1995) [14]. In one trial reported by Progressive Forage, cattle ate 28% of the outdoor net-wrapped hay offered, against 78% of breathable-wrapped [15].
Using those digestibility figures as a value proxy, a 4-inch weathered layer costs about 7 further points: 25% of the bale at about 28% less digestibility (Crop Root Zone estimate). We add it as a separate evidence set in Section 4.
Ground Truth: The loss table is really a calendar. A tight bale fed by late winter is a different asset from the same bale carried to next summer. Most of the frightening numbers in the storage literature come from the long-storage columns or from loose bales, so an operation's first question is how many of its bales will still be outside when spring warm-up starts.
3. What each system costs in 2026
What's new: The extension budgets most people quote are out of date. Kentucky's "about $10 per ton of storage capacity per year" is from 1997, with construction at $2 to $4 a square foot [9]. Oklahoma's $11.76 assumes $3 a square foot [10]. We repriced both.
Evidence: Our inputs, per ton of hay at 1,000-lb bales:
| Input | Value | Basis |
|---|---|---|
| Barn space | 21 sq ft/ton | 5×5 bales, three high, vertical stack [10] |
| Building shell, 7,200 sq ft | $6.98/sq ft | $50,229 listed installed shell, 60×120×16 ft open barn, undated, before tax and shipping [16] |
| Scale effect | Shell cost/sq ft ∝ area^−0.38* | Fitted to Holmes's 2003 builder quotes, $8.45 at 1,200 sq ft vs. $5.56 at 3,600 [7] |
| Floor, site work, freight | +$2.00/sq ft* | Rock floor below, plus $0.90 allowance |
| Annual building charge | 11.53% of cost* | 20-yr depreciation; interest at 2/3 of 6.79%; 2% repairs, taxes, insurance. Huhnke's method [10]; Chicago Fed Q2 2026 real estate rate [17] |
| Rock pad | $1.10/sq ft, 12.5 sq ft/bale, 20-yr life* | 6 in. of stone at an assumed $35/st delivered, plus fabric and grading; USGS puts 2025 stone at $18.50/mt before freight [18]; footprint per Holmes [7] |
| Tarp | $0.30/sq ft, 28 sq ft/bale, 3-yr life* | Retail about $0.26 to $0.40 [19][20]; coverage per Huhnke [10]; life per Manitoba's example [21] |
| Tie-downs | +17% of tarp* | Manitoba's $25 on a $150 tarp [21] |
| Labor above bare ground | 20 hr tarp, 140 hr barn per 900 tons, at $25/hr* | Hours from Iowa State's worksheet [22]; the rate is our assumption |
*Crop Root Zone estimates or assumptions. Pallets or gravel at Iowa State's inputs, $0.80 a square foot and a 5-year life [22], come to about $5.31 a ton a year on our footprint.
| System, 1,000-lb bales, one year | $/ton/yr | |
|---|---|---|
| Bare ground, net wrap or twine already paid | 0.00 | ░░░░░░░░░░ |
| Rock pad, uncovered | 3.17 | █░░░░░░░░░ |
| Tarp on rock pad | 11.15 | ███░░░░░░░ |
| Barn, 1,000 bales | 23.36 | █████░░░░░ |
| Barn, 700 bales | 25.48 | ██████░░░░ |
| Barn, 400 bales | 29.47 | ███████░░░ |
| Barn, 200 bales | 35.73 | ████████░░ |
| Barn, 100 bales | 43.90 | ██████████ |
Source: Crop Root Zone model; inputs above. Bars scale to $43.90 = ten blocks. The 100- and 1,000-bale rows extrapolate outside the quotes behind the scale effect. Hay value lost is excluded here and enters in Section 4.
Iowa State's worksheet, with 2017 defaults at 3% interest, comes out at about $12.25 a ton for a new building and $5.07 for a tarp on gravel, using 1,250-lb bales (Crop Root Zone calculation) [22]. We are a little over twice that on both. Higher rates, a higher building price, lighter bales and a higher labor rate all contribute. Our figures may still flatter the barn. The general 2026 cost guides we reviewed quote higher installed prices than the single listing we anchor on, though we did not treat those guides as reliable, and that listing excludes shipping, tax and local code items [16].
The assumptions that move the numbers:
| Change from base | Barn, 400 bales | Tarp on rock |
|---|---|---|
| Base | 29.47 | 11.15 |
| All-in building $15/sq ft | 40.20 | — |
| Stacked two high, 31 sq ft/ton | 37.42 | — |
| Barn 75% full | 35.12 | — |
| 15-yr building life | 33.16 | — |
| 30-yr building life | 25.77 | — |
| Farm Storage Facility Loan rate, 5.0% | 26.82 | 10.58 |
| 1,200-lb bales, 17 sq ft/ton | 24.78 | 9.38 |
| Tarp lasts 2 yr | — | 14.41 |
| Tarp lasts 5 yr | — | 8.53 |
| Tarp at $0.40/sq ft | — | 13.62 |
| Rock pad re-laid every 5 yr | — | 15.27 |
Source: Crop Root Zone model. Rate per FSA's October 2026 12-year term [23]; hay storage is an eligible use of the program, with a 15% minimum down payment [24]. Tarp life of 5 to 7 years is Kentucky's figure for durable covers [9]; the retail tarp we priced carries a 90-day warranty [19].
The tarp number depends on how long the tarp survives. The barn number depends on how full it stays and how high it stacks. A breathable wrap is the other route: about $5 to $7 a bale over net wrap in older reports [11][15], or $10 to $14 a ton at this bale size. That is about the tarp's cost, with Wisconsin's 2 to 3% loss and no pad or tarp labor, but it requires a compatible baler and a decision made at baling. We did not find a 2026 price.
4. The hay price and bale count that make each one pay
What's new: Break-even hay price is the extra cost divided by the extra dry matter saved. Since the loss evidence is wide, we ran six versions of it.
Evidence:
| Evidence set: ground / tarp on rock / barn, % lost | Tarp on rock vs. ground | Barn vs. ground | Barn vs. tarp |
|---|---|---|---|
| 13-source mean, 6 mo: 27 / 8 / 5 | $59 | $134 | $611 |
| Wisconsin 12 mo plus 7-pt weathered-layer discount: 20 / 5 / 2 | $74 | $164 | $611 |
| Kentucky, net wrap, midpoints: 20 / 5.5 / 5.5 | $77 | $203 | never |
| Wisconsin, 12 mo: 13 / 5 / 2 | $139 | $268 | $611 |
| Wisconsin, 6 mo: 9.5 / 4 / 2 | $203 | $393 | $916 |
| Tight net wrap, about a year: 8 / 5 / 2 | $372 | $491 | $611 |
Source: Crop Root Zone model at 400 bales; loss sets from Section 2 [7][8][9][12]. Hay price in $/ton at which the saved dry matter equals the added annual cost. The last row pairs the Oklahoma newsletter's net-wrap figure with Wisconsin's tarp and barn figures, and the newsletter does not describe ground contact.
The tarp clears at or below $143 hay in four of the six. The two it fails are the cases with the lowest bare-ground loss, and those are short storage or tight wrap. That agrees with Holmes, who found the rock pad with tarp lowest in cost at most hay values for 6-month storage and at all values for 12-month storage, across $40 to $100 hay on his 2003 costs [7]. A rock pad alone costs $3.17 and saves 1.5 to 5 points, for a break-even of about $63 to $211. Holmes judged it close to bare ground at 6 months and worth having mainly as insurance against a wet year [7].
The barn does not beat the tarp on dry matter at any price in the current market. Three points against $18.32 of extra cost needs $611 hay, and the best price in USDA's table, $355 Pennsylvania premium alfalfa, is $7.67 a ton short at that three-point gap [1]. Kentucky's equal loss range would mean no break-even at all. Against the tarp, the barn has to earn its way another way. It needs about $18 a ton of extra sale price at 400 bales, $14 at 700 and $33 at 100.
The barn does better against a tarp that fails. At $208 hay, tarp losses would have to reach about 11% to erase the barn's cost gap, and at $143 about 15%. Oklahoma's range for tarps on soil at 12 to 18 months is 10 to 15% [10], and a tarp that blows off in January can do worse. Securing one takes 2 to 3 people and repeated tightening as the stack settles [13].
Bale count sets the barn's case against bare ground, the comparison most operations without a pad actually face:
| Barn vs. bare ground, bales needed to pay | At $143 hay | At $208 hay | At $275 hay |
|---|---|---|---|
| 13-source mean, 22-pt saving | about 315 | under 100 | under 100 |
| Wisconsin 12 mo plus weathered layer, 18-pt saving | about 675 | about 175 | under 100 |
| Kentucky net wrap, 14.5-pt saving | over 1,000 | about 370 | about 140 |
| Wisconsin 12 mo, 11-pt saving | not in range | over 1,000 | about 365 |
Source: Crop Root Zone model. 1,000-lb bales. A 400-bale barn at $10.57 a square foot all-in costs about $44,400 to build and about $5,900 a year to carry, labor included.
Prices then decide it by state:
| Price, $/ton, Sep 2026 | $/ton | Tarp net, Wisconsin 12 mo | Tarp net, 13-source mean | Barn net, Wisconsin 12 mo | Barn net, 13-source mean |
|---|---|---|---|---|---|
| Kentucky, other hay | 210 | +5.65 | +28.75 | −6.37 | +16.73 |
| US, alfalfa | 208 | +5.49 | +28.37 | −6.59 | +16.29 |
| Pennsylvania, other hay | 200 | +4.85 | +26.85 | −7.47 | +14.53 |
| New York, other hay | 180 | +3.25 | +23.05 | −9.67 | +10.13 |
| Ohio, other hay | 170 | +2.45 | +21.15 | −10.77 | +7.93 |
| US, other hay | 143 | +0.29 | +16.02 | −13.74 | +1.99 |
| Iowa, other hay | 112 | −2.19 | +10.13 | −17.15 | −4.83 |
| Oklahoma, other hay | 101 | −3.07 | +8.04 | −18.36 | −7.25 |
| Missouri, other hay | 95 | −3.55 | +6.90 | −19.02 | −8.57 |
| Nebraska, other hay | 89 | −4.03 | +5.76 | −19.68 | −9.89 |
| North Dakota, other hay | 68 | −5.71 | +1.77 | −21.99 | −14.51 |
Source: USDA NASS, Oct 30, 2026 [1]; Crop Root Zone model at 400 bales, dollars per ton stored per year. State prices cover all bale types, and round bales often trade below squares [7]. Holmes's losses are for a humid climate, and drier states such as Nebraska and North Dakota should expect less loss than either column [7][10].
Humid country and high prices line up in Kentucky, Pennsylvania, New York and Ohio, and the tarp pays there on nearly any reading. Missouri and Oklahoma are the harder case: wet enough to lose hay and priced low enough that a modest tarp budget is a close call.
Ground Truth: Treat a new hay barn as a marketing investment. On feed saved it loses to a tarp at every price in USDA's table, by about $8 to $16 a ton at 400 bales. Against that, one grade step on a large round bale was worth $20 to $38 at Rock Valley last week. A seller who can show that barn storage holds a grade over tarped hay has a case at 400 bales and up. A cow-calf operator feeding $100 hay to the home herd has none, and that $44,000 is better spent elsewhere.
5. What to do with the bales you have now
What's new: A barn cannot go up before this winter's feeding starts, but several decisions can still be made this month.
Set the feed order. This one costs nothing. Feed outside bales first and hold protected bales for last. On Oklahoma's midpoints, an exposed bale on the ground carried past spring goes from 12.5% to 32.5% loss, or about $29 a ton at $143 hay, while a covered, elevated bale goes from 3% to 7.5%, or about $6 (Crop Root Zone calculation) [10]. The tarp and the barn earn most of their money on carryover, so sizing either one to total inventory overstates the need.
Spend on the feeding loss too. Undersander puts waste at up to 40% with unrestricted bale access, about 25% in a ring feeder and about 10% with ring access limited to 8 to 12 hours (Oct 21, 2024) [25]. That 15-point step is five times the barn's edge over a tarp and needs no construction. Those are his general estimates, not results from a single controlled trial.
If you have rock or can get it before freeze-up, move the bales you expect to carry and tarp them. Well-drained ground, end-to-end rows and gaps between rows are free [10]. Do not pack uncovered bales into a pyramid, because the upper layer sheds rain onto the bottom tier [13].
Sort by destination. Test the hay you intend to sell, put it in the best storage you have, and let the feed hay take the weather. An existing barn has no capital charge left to recover in this decision, so it should hold the bales with the highest price per point.
For 2027, run your own numbers. Holmes's point stands: a building fits someone in the hay business for 15 to 20 years and not someone who may leave in five [7]. Iowa State's worksheet and the Wisconsin spreadsheet both take local inputs [8][22]. Get a written quote before trusting our $10.57 a square foot. Manitoba's 2013 example, a full shed of square bales at $7 a ton against a 7% outside loss, put the shed's break-even at about $120 hay [21], on building costs and rates that no longer apply.
What to watch: USDA's November Agricultural Prices, and whether other hay's $9 September drop continues into feeding season. USDA's December 1 hay stocks, due in January, will show how much carryover the market expects to hold, and carryover is where storage pays most.
We could not establish current installed prices for small open-sided barns from a builder or an index, and no recent replicated trial compares a modern tarp on rock with a building in the same climate. The three-point gap at the center of this piece rests on older work and a 2017 summary.
Ground Truth: Budget for rock and tarps first, sized to the bales that will still be outside in April. That is a spend of about $47 a ton up front, or about $9,400 for 200 tons, against about $44,400 for a barn, and it captures most of the loss reduction. Revisit the barn only once you can name the buyer who pays for what it adds.
References
- USDA National Agricultural Statistics Service, Agricultural Prices, released Oct 30, 2026 (September prices; hay tables on p. 18). https://s3.amazonaws.com/barchart-news-store-prod/external_links/NASS:Scheduled/agpr1026.pdf
- Crop Root Zone, TRZ-0267, "A Ton of Alfalfa Hay Carries Off $27 to $33 of Phosphate and Potash, 13% to 16% of the $206 Farm Price…," Oct 9, 2026.
- USDA AMS Livestock, Poultry and Grain Market News, Rock Valley Hay Auction, Rock Valley, IA, weighted average report for Oct 29, 2026, published Oct 30, 2026. https://www.ams.usda.gov/mnreports/ams_2244.pdf
- USDA AMS, Nebraska Direct Hay Report, Oct 22, 2026. https://www.ams.usda.gov/mnreports/ams_2935.pdf
- USDA AMS, Iowa Direct Hay Report, Oct 20, 2026. https://www.ams.usda.gov/mnreports/ams_2807.pdf
- University of Wisconsin–Madison Extension, "Hay Market Report for the Upper Midwest for September 1, 2026." https://cropsandsoils.extension.wisc.edu/hay-market-report-for-the-upper-midwest-for-september-1-2026/
- Holmes, B., University of Wisconsin, "Dry Round Hay Bale Storage Costs," Focus on Forage Vol. 6 No. 5, 2004. https://fyi.extension.wisc.edu/forage/files/2014/01/LRB_StorageCosts-FOF.pdf
- Edwards, W., Iowa State University, "Stacking up your hay storage options," Progressive Forage, Nov 29, 2017, with Table 1. https://www.agproud.com/articles/32375-stacking-up-your-hay-storage-options ; https://www.agproud.com/ext/resources/PF/images/downloads/2017/11/1117PF-edwards-tb1.pdf
- Collins, M., D. Ditsch, J.C. Henning, L.W. Turner, S. Isaacs and G.D. Lacefield, "Round Bale Hay Storage in Kentucky," University of Kentucky AGR-171, 1997. https://publications.mgcafe.uky.edu/files/agr171.pdf
- Huhnke, R.L., "Round Bale Hay Storage," Oklahoma Cooperative Extension BAE-1716, Jul 2003 printing. https://pods.okstate.edu/fact-sheets/BAE-1716pod.pdf
- Hay & Forage Grower, "Breathable film wrap improves hay consumption," date not visible (read from a search-index summary because the page returned 403). https://hayandforage.com/article-permalink-285.html
- New, M., "Cow-Calf Corner: Hay Storage, Minimizing Loss," via Texas & Southwestern Cattle Raisers Association, Nov 3, 2021. https://tscra.org/cow-calf-corner-hay-storage-minimizing-loss
- Ruff, G. and J. Hartschuh, Ohio State University Extension, "Hay Storage Considerations," Factsheet 21-96, 2021 (summarizing Harrigan and Rotz, 1994). https://forages.osu.edu/sites/forages/files/imce/2021%20Hay%20Storage%20Factsheet.pdf
- Collins, M., L.D. Swetnam, G.M. Turner, J.N. Hancock and S.A. Shearer, "Storage Method Effects on Dry Matter and Quality Losses of Tall Fescue Round Bales," Journal of Production Agriculture 8(4): 507–514, 1995 (abstract). https://agris.fao.org/search/en/providers/122535/records/65df874d7c7033e84bedfce5
- Gasch, R.J., "Choices for round bale storage," Progressive Forage, Mar 27, 2015. https://agproud.com/articles/33362-choices-for-round-bale-storage
- Summertown Metals, "60x120x16' Open Hay Barn," Building ID BKFA6012016-1, undated listing, accessed Nov 2, 2026. https://summertownmetals.com/?p=8406
- Federal Reserve Bank of Chicago, AgLetter, Aug 2026. https://www.chicagofed.org/publications/agletter/2025-2029/august-2026
- U.S. Geological Survey, Mineral Commodity Summaries 2026, "Stone (Crushed)," 2026. https://pubs.usgs.gov/periodicals/mcs2026/mcs2026-stone-crushed.pdf
- Tractor Supply, Weathermaster Hay Bale Heavy-Duty Tarp, 25 ft × 36 ft, $229.99, accessed Nov 2, 2026 (read from a search-index summary because the page timed out). https://www.tractorsupply.com/tsc/product/weathermaster-hay-bale-heavy-duty-tarp-25-ft-x-36-ft-1101138
- Walmart, Tarps Now hay tarp, 25 ft × 33 ft, $333.44, accessed Nov 2, 2026 (read from a search-index summary). https://www.walmart.com/ip/Tarps-Now-Hay-Tarps-with-Brass-Spur-Grommets-12Mil-Waterproof-Tarp-Cover-25-x-33/624673213
- Winters, D., "Run the numbers before deciding on how to store hay," Manitoba Co-operator, Jul 5, 2013 (Canadian-market figures). https://www.manitobacooperator.ca/crops/run-the-numbers-before-deciding-on-how-to-store-hay
- Iowa State University Extension, Ag Decision Maker, Hay Storage Cost Comparison worksheet, as published with Progressive Forage, Nov 2017, Figure 1. https://www.agproud.com/ext/resources/PF/images/downloads/2017/11/1117PF-edwards-fg1.pdf
- USDA Farm Service Agency, "USDA Announces October 2026 Lending Rates for Agricultural Producers," Oct 1, 2026 (read from a search-index summary because the page timed out). https://www.fsa.usda.gov/news-events/news/10-01-2026/usda-announces-october-2026-lending-rates-agricultural-producers
- USDA Farm Service Agency, Farm Storage Facility Loans fact sheet, Nov 2024 (read from a search-index summary). https://www.fsa.usda.gov/sites/default/files/2024-12/FSA-FactSheet-Farm%20Storage%20Facility%20Loans.pdf
- Undersander, D., "Protecting the hay you have harvested," Progressive Forage, Oct 21, 2024. https://agproud.com/articles/60475-protecting-the-hay-you-have-harvested
Disclosures
Crop Root Zone is an independent publication. Nothing here is investment advice. Market calls, where included, reflect the editors' own read and are not a recommendation to buy or sell any security.
A Five-Year-Old Combine Asks About $299,000 and a Ten-Year-Old About $137,000. Against Iowa's Custom Rate, the Older One Pays at About 1,460 Acres and the Younger at 2,800. Buying at Auction Moves Those Lines to 910 and 1,710.
Used combine auction values are up 2.7% on the year and down about 3.5% since March, with inventory 9.5% lower, so the market has not moved enough to change the decision. What changes it is the machine's age and the gap between asking and auction, which is 38% on Sandhills' index. In our model, age moves the break-even by about 1,300 acres, the purchase route by 550 to 1,090, and a $50,000 rebuild on the older machine by 500 to 550.
Used combine auction values rose 2.74% in the year to September and fell 3.19% in the month, and Sandhills Global rates the trend as down. Inventory is 9.51% below a year ago. Asking values barely moved, at +0.26% on the year (Sandhills Global, Oct 6, 2026) [1]. New sales are weaker: US retail combine sales were 369 units in September against 414 a year earlier, and 2,432 for the year to date, down 9.4% (AEM, Oct 12, 2026) [9]. This is a thin market with slightly softer prices, and that does not settle whether to buy. Our earlier pieces covered the trade differential on application rigs [23] and destocking in the dealer channel [24], and we costed a new and a five-year-old combine against custom hire in September [25]. This piece prices actual listings by model year and carries them through to a per-acre cost. The market's one-year move turns out to be small. The gap between a five-year-old and a ten-year-old is large, and so is the gap between the asking price and the hammer price.
1. How far values have moved
What's new: September erased August. Auction values rose 3.23% in August and gave almost all of it back in September [1][2]. Compounding Sandhills' monthly changes from April through September, auction values are down about 3.5% since March and asking values about 2.6% (Crop Root Zone calculation) [1][2][3][4][5][6].
Evidence:
| 2026 data month | Inventory, Y/Y | Asking, Y/Y | Auction, Y/Y | Auction, M/M | EVI spread |
|---|---|---|---|---|---|
| January | −11.43% | −3.82% | +2.35% | +1.92% | 36% |
| February | −9.95% | −1.09% | +3.92% | +0.68% | 36% |
| March | n/a | n/a | n/a | n/a | 37% |
| April | −11.89% | +1.32% | +2.16% | −0.99% | 40% |
| May | −10.09% | −1.22% | +0.76% | −1.52% | 38% |
| June | −10.19% | −1.28% | +0.72% | −0.51% | 38% |
| July | −11.79% | −1.69% | +0.38% | −0.49% | 38% |
| August | −10.18% | +1.46% | +4.66% | +3.23% | 37% |
| September | −9.51% | +0.26% | +2.74% | −3.19% | 38% |
Source: Sandhills Global monthly releases, Feb 4 through Oct 6, 2026 [1][2][3][4][5][6][7][8]; US used combines. We did not locate the March release; the 37% is from the April release [6]. Sandhills defines the EVI spread as the percentage difference between asking and auction values.
Combines are the soft spot in the used fleet. In September, used planter auction values were up 14.89% on the year and tractors over 100 horsepower up 4.8%, against 2.74% for combines [1].
Single-model data runs softer than the index. Machinery Pete put the 2026 average auction price of the John Deere S770 at $234,757, down 7.9% from about $254,900 (AgWeb, 2026) [11]. An average across all model years depends on which machines sold, and an index adjusts for that, so the two are not directly comparable. We take direction from the index and read the S770 as a warning that the year-over-year gain is not universal.
Falling supply has not lifted prices. Inventory has run 9.5% to 11.9% below year-ago levels in every month we could read, and asking values are still flat [1][2][3][4][5][6][7][8]. New machines are not filling the gap: AEM's 911 combines of beginning field inventory equal about 3.4 months of this year's average US retail pace (Crop Root Zone calculation) [9]. Canada was weaker still, with September combine sales reported down 37.6% (Manufacturing.net, relaying AEM, Oct 2026) [10].
Ground Truth: A seller reading "+2.7% on the year" is reading the kinder of two numbers. The direction since March is down, and tight inventory has not stopped it. Anyone holding out for a spring premium on a late-model combine should price the sale on the September number, not the January one.
2. The asking-to-auction gap
What's new: The EVI spread for combines stands at 38%, up a point from August [1]. Its 2026 high was 40% in April, and Sandhills has repeatedly said the spread sits below its 2015 peak [3][6].
Evidence: Machinery Pete publishes a similar measure, average auction price divided by average dealer advertised price. He puts the normal range at 71% to 76% [11][13].
| Model and date | Auction ÷ dealer ask | |
|---|---|---|
| Historical norm, midpoint | 73.5% | ██████████ |
| John Deere S770, 2026 | 65.5% | █████████░ |
| John Deere S780, Mar 2024* | 60.6% | ████████░░ |
| John Deere S680 and S690, Aug 2019 | about 51% | ███████░░░ |
Source: AgWeb, 2026 [11]; Machinery Pete, Aug 5, 2019 [13] and Mar 4, 2024 [12]. *Crop Root Zone calculation: $291,923 average 2023 auction price ÷ $481,557 current dealer ad price at the time. Bars scale to 73.5% = ten blocks.
Three cautions apply. These ratios compare averages across different machines, and the auction mix often has more hours and less reconditioning than the dealer mix. A dealer price can also include inspection, service and some warranty, which an auction does not. And Sandhills' definition does not say which price is the base: a 38% spread means auction at 62% of asking if measured on the ask and about 72% if measured on the auction price. The S770's 65.5% falls inside that range. We use two-thirds of asking as our auction estimate and test 62% to 75% in Section 4.
3. What the listings say about age
What's new: We took Machinery Pete's public listing pages on October 31 and calculated medians by model year: pages 1, 2, 3, 6, 9 and 12 of 16 for the S780 and all three for the S680. We left out auction lots, Canadian listings and a rice combine.
Evidence:
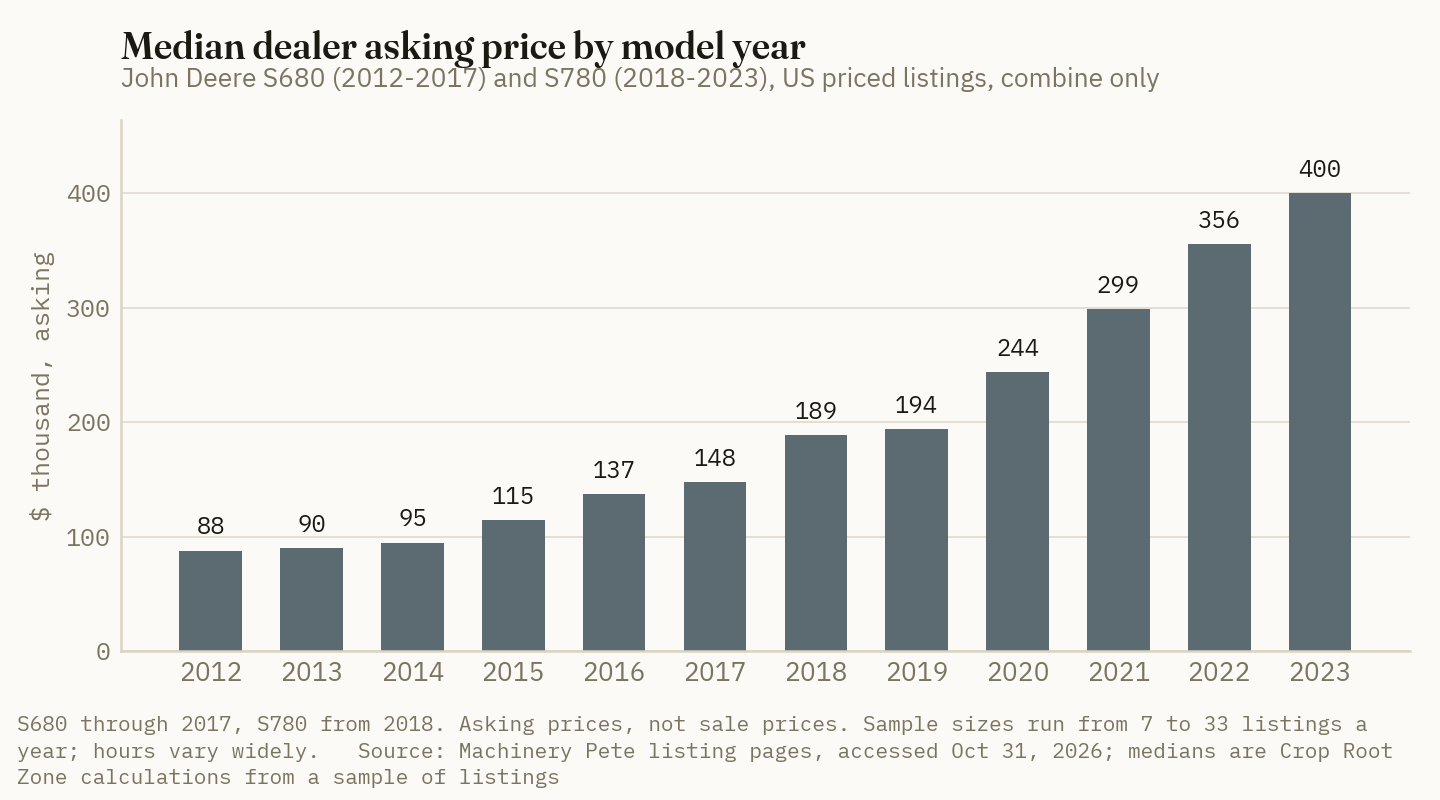
| Model year, age | Model | Listings | Median ask | Median hours | Ask as % of $784,500 list* | ISU table value* |
|---|---|---|---|---|---|---|
| 2021, 5 yr | S780 | 33 | $298,700 | 1,466 | 38% | 39% |
| 2016, 10 yr | S680 | 10 | $137,275 | 2,316 | 17% | 23% |
| 2012, 14 yr | S680 | 19 | $87,500 | 3,684 | 11% | 14% |
Source: Machinery Pete listings, accessed Oct 31, 2026 [14][15]; farmdoc, Aug 2025 [20]; Iowa State A3-29, Mar 2026 [18]. *Crop Root Zone calculation. List is farmdoc's 470-hp combine, used here as the nearest public proxy for these models; table values assume 300 hours a year. The 2016 sample is thin, with a range of $113,900 to $195,000.
Three things stand out. First, the five-year-old's median ask matches Iowa State's table almost exactly, at 38% against 39% of list. Second, the ten-year-old's does not. The ask falls 54% between ages 5 and 10, where the table implies 41% (Crop Root Zone calculation). That is about $43,000 less than the table would say for a 2016 machine. Third, some of the gap is a change of model: in these listings the S780 takes over from the S680 at model year 2018, so the comparison crosses a machine generation, and the steepest step in the chart may partly reflect that. Hours explain another part. Across the 33 2021 listings, each extra hour took about $88 off the ask (Crop Root Zone regression, R² 0.58). Applied to the 850-hour median difference, that is about $75,000 of the $161,000 gap, a rough figure because it stretches a one-model slope across two models.
$161,000
Difference in median dealer ask between a 2021 S780 and a 2016 S680, before heads. About half is hours on a rough reading. The rest is age and model generation. (Crop Root Zone calculation from Machinery Pete listings, Oct 31, 2026)
The list prices and medians carry their own limits. Listing pages can be stale, the S780 pages sampled lean toward certain regions, and these are one manufacturer's machines. We treat the medians as a working estimate of asking levels, not a price guide.
Ground Truth: Budgets built on an extension salvage table are probably overstating what a ten-year-old combine is worth by a meaningful margin, at least on this make. That cuts both ways. A buyer gets more machine for the money than the table implies at age ten, and an owner planning to trade at age ten should not book the table value as equity.
4. Ownership cost per acre against custom hire
What's new: We ran both machines through Iowa State's own-versus-hire worksheet (A3-33) [17], holding each for five years and using today's asks one age band later as the exit value. Our September piece used the table's values and a smaller, 330-hp machine, and found a five-year-old breaking even near 1,420 acres [25]. This version is a larger package, priced from listings, with an exit at auction value, so its break-even is higher, and the two should not be read as a change in the market.
Evidence: The inputs:
| Input | Value | Basis |
|---|---|---|
| Purchase, dealer route | $298,700 / $137,275 | Median asks [14][15] |
| Purchase, auction route | $199,133 / $91,517* | Two-thirds of ask |
| Heads, 12-row plus 35-ft, at age 5 / 10 / 14 | $121,344 / $88,480 / $70,784* | 48% / 35% / 28% of $252,800 list; A3-29 "Other" column [18][20] |
| Exit, combine only | $91,517 / $58,333* | Two-thirds of 2016 and 2012 median asks |
| Real interest; capital recovery, 5 yr | 5%; 0.231 | About 7% nominal (Chicago Fed: 7.12% on operating loans, Q2 2026 [22]) less 2% inflation, per A3-33 [17] |
| Insurance and housing | 1% of purchase | A3-33 [17] |
| Repairs | A3-33 combine percentages × $1,037,300 package list | Fitted curve; extrapolated past 3,000 hours* |
| Fuel | 1.25 gal/acre corn, 1.00 soybeans, plus 15% lube, at $5.71 | A3-27 [19]; A3-33 [17]; USDA AMS, Oct 30, 2026 [21] |
| Capacity, labor | 9.7 and 11.8 acres/hour; 1.2 × hours × $25 | farmdoc [20]; A3-33 [17]; A3-10 [16] |
| Custom charge | $47.04 per acre blended | $45 corn, $42 soybeans [16], plus diesel by gallons from the survey's $2.89*; 60/40 mix |
*Crop Root Zone estimates. Used heads were not priced from listings, and we hold them at the same value on every route.
The bill for each route, per acre:
| Acres a year | 5-yr-old, dealer | 5-yr-old, auction | 10-yr-old, dealer | 10-yr-old, auction | Custom |
|---|---|---|---|---|---|
| Ownership cost only, 1,000 | $68.65 | $44.66 | $31.04 | $20.01 | — |
| Ownership cost only, 1,500 | $45.77 | $29.77 | $20.69 | $13.34 | — |
| Total, 1,000 | $88.49 | $64.50 | $56.15 | $45.12 | $47.04 |
| Total, 1,500 | $66.34 | $50.35 | $46.56 | $39.21 | $47.04 |
| Total, 2,000 | $55.64 | $43.65 | $42.16 | $36.65 | $47.04 |
| Total, 3,000 | $45.70 | $37.70 | $38.53 | $34.86 | $47.04 |
Source: Crop Root Zone model; inputs above. Ownership cost is depreciation, interest, insurance and housing, which come to $68,651, $44,656, $31,037 and $20,009 a year. Total adds fuel, lube, repairs and operator labor. Grain cart, trucks and timeliness are excluded from both sides.
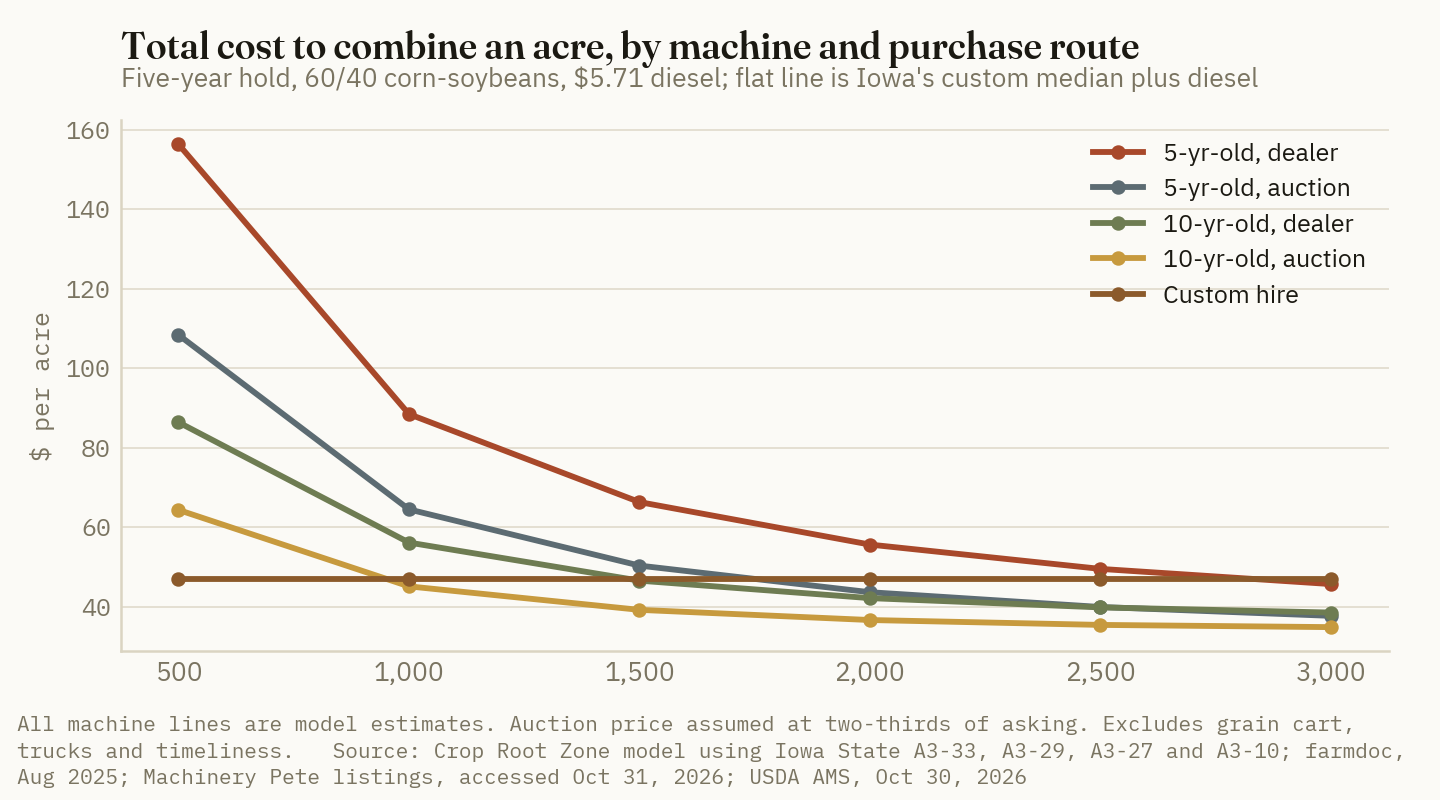
Repairs reduce the older machine's edge. At 1,500 acres the five-year-old carries $10.15 an acre of repairs and the ten-year-old $15.44 (Crop Root Zone estimate), and the gap persists at every acreage. Past about 2,550 acres, a five-year-old bought at auction costs less than a ten-year-old bought from a dealer.
Here are the break-evens and what moves them:
| Scenario, acres a year to match custom* | 5-yr-old, dealer | 5-yr-old, auction | 10-yr-old, dealer | 10-yr-old, auction |
|---|---|---|---|---|
| Base: $47.04 custom | 2,800 | 1,710 | 1,460 | 910 |
| February rate, no diesel: $43.80 | 3,360 | 1,980 | 1,770 | 1,080 |
| Kansas-level rate: $40.59 | 4,380 | 2,390 | 2,310 | 1,340 |
| Nebraska-level rate: $50.77 | 2,380 | 1,480 | 1,230 | 770 |
| Real interest 6% | 2,960 | 1,820 | 1,560 | 980 |
| Auction at 62% of ask | 2,860 | 1,610 | 1,500 | 870 |
| Auction at 75% of ask | 2,700 | 1,880 | 1,390 | 980 |
| $50,000 unplanned rebuild during the hold | — | — | 2,010 | 1,410 |
*Crop Root Zone estimates, rounded to 10 acres. Kansas and Nebraska rates are the 60/40 blends of the 2026 survey averages reported in TRZ-0196 [25]; no diesel pass-through. The $50,000 rebuild is our assumption, not a sourced figure, and is spread over five years.
Read the rows against each other. Age moves the dealer-route break-even by about 1,340 acres. The purchase route moves it by about 1,090 on the five-year-old and 550 on the ten-year-old. An unplanned $50,000 repair gives back 500 to 550 of the older machine's advantage. Whether the custom operator passes diesel through moves the line by 170 to 560 acres, depending on the route.
Ground Truth: The best-looking row is the 10-year-old at auction, and it carries the most risk. That $45,758 saving against the dealer ask comes with no warranty, and a single rebuild in the $50,000 range wipes it out. A farm at 1,000 acres should treat the auction route as worthwhile only if it can inspect the machine, read the rotor and feederhouse wear, and keep that amount in reserve. Without that, the dealer premium is partly insurance, and hiring is close to the same cost.
5. What this means by farm size
Under about 900 acres: Hire. No route in our model gets under the custom rate. At 1,000 acres the closest is the ten-year-old at auction, at about $45,120 a year against a $47,043 custom bill. Saving $1,900 a year is not enough to carry that capital and repair risk, though it does buy control of the calendar, which we valued in September at about $1.27 an acre per day of soybean delay [25].
About 1,000 to 1,500 acres: The ten-year-old is the working choice, and extra acres matter. A 1,000-acre farm with a dealer-bought ten-year-old pays about $56,150 a year against about $47,040 to hire. Add 500 acres of custom work at the same rate, and the net falls to about $46,330, just under the hire bill (Crop Root Zone calculation). Iowa State's worksheet has a line for this calculation [17], and it turns a losing purchase into a break-even one, as long as the neighbor's acres do not take the owner's own timeliness with them.
About 1,700 to 2,800 acres: The five-year-old enters the picture only at near-auction money. At dealer asks it loses to custom until 2,800 acres. A buyer who can negotiate well below the ask, or buy a clean machine at auction, moves into range around 1,700. Each 1% off the $298,700 ask is worth $2,987 at purchase, or about $690 a year in capital recovery (Crop Root Zone calculation).
What to watch: Sandhills' October data, due in early November; whether the 38% spread widens as harvest ends and trades arrive on lots; and any move of the monthly auction change back above zero. TractorHouse's manager says the auction market has seen a jump in activity and that dealers are growing more optimistic into 2027 [1]. A rise in auction volume with falling hammer prices would be a buyer's signal, and a rise with rising prices would close some of the gap this piece prices. We also do not have any public, model-year auction series, and Tractor Zoom's summaries were not reachable for this piece, so our auction route remains an estimate from ratios, not a record of sales.
Ground Truth: Negotiate the spread before you choose the machine. A dealer holding a 2021 at a 38% gap to auction and a falling trend has more room this winter than the one-year figure suggests, and every thousand dollars comes off a number that decides whether ownership beats hiring at your acreage. Get an auction-comparable for the exact model year and hours, ask for the reconditioning record, and walk into the conversation with your own break-even from Section 4.
References
- Sandhills Global, "Sandhills Sees Optimism in the Farm Equipment Market as Corn Prices Rise During Harvest Season" (September data), Oct 6, 2026. https://www.sandhills.com/news/article/250048470 ; https://www.prnewswire.com/news-releases/sandhills-sees-optimism-in-the-farm-equipment-market-as-corn-prices-rise-during-harvest-season-302900012.html
- Sandhills Global, "Economic Uncertainty Extending Sales Cycles in Used Heavy Equipment Market" (August data), Sep 4, 2026. https://www.sandhills.com/news/article/250048193
- Sandhills Global, "Heavy-Duty Trucks Racking Up More Mileage While Used Truck Inventory Levels Continue to Fall" (July data), Aug 10, 2026. https://www.sandhills.com/news/article/250047909
- Sandhills Global, "Sandhills Market Reports Show Continued Inventory Declines Across Used Equipment and Truck Markets" (June data), Jul 6, 2026. https://www.sandhills.com/news/article/250047595
- Sandhills Global, "Used Construction Equipment Rentals Remain Strong as Sales Cool" (May data), Jun 4, 2026. https://www.sandhills.com/news/article/250047334
- Sandhills Global, monthly market reports release (April data), May 7, 2026. https://www.sandhills.com/news/article/250047072
- Sandhills Global, monthly market reports release (February data), Mar 6, 2026. https://www.sandhills.com/news/article/250046662
- Sandhills Global, "Despite Inventory and Price Drops, Dealers Cautiously Optimistic About Used Equipment and Truck Markets" (January data), Feb 4, 2026. https://www.sandhills.com/news/article/250046401
- Association of Equipment Manufacturers, United States Ag Tractor and Combine Report, September 2026, released Oct 12, 2026. https://www.aem.org/getattachment/dd9b4c30-f615-4bad-b1a0-809fe96aceed/September-2026-Farm_Flash_Trade_Press_With_Chart_PreRelease-United-States.pdf
- Manufacturing.net, "U.S. Tractor, Combine Sales Decline in September," Oct 2026 (relaying AEM; read from a search-index summary because the page returned 403). https://www.manufacturing.net/operations/news/22976362/us-tractor-combine-sales-decline-in-september
- AgWeb, "Pete's Pick of the Week Draws Attention to Late-Model Tractor Prices At Missouri Auction," 2026 (exact date not visible; read from a search-index summary because the page returned 403). https://www.agweb.com/news/machinery/petes-pick-week/petes-pick-week-draws-attention-late-model-tractor-prices-missouri
- Machinery Pete, "Are Used Combine Values On the Decline?", Mar 4, 2024. https://www.machinerypete.com/media_posts/are-used-combine-values-on-the-decline
- Machinery Pete, "History Points to Buying Opportunity," Aug 5, 2019. https://www.machinerypete.com/media_posts/machinery-pete-history-points-to-buying-opportunity
- Machinery Pete, Used John Deere S780 combine listings, pages 1, 2, 3, 6, 9 and 12, accessed Oct 31, 2026. https://www.machinerypete.com/harvesting/combines/john-deere/s780
- Machinery Pete, Used John Deere S680 combine listings, pages 1 to 3, accessed Oct 31, 2026. https://www.machinerypete.com/harvesting/combines/john-deere/s680
- Iowa State University Extension and Outreach, Ag Decision Maker File A3-10, "2026 Iowa Farm Custom Rate Survey," revised Mar 2026. https://www.extension.iastate.edu/agdm/crops/pdf/a3-10.pdf
- Iowa State University Extension and Outreach, Ag Decision Maker File A3-33, "Self-Propelled Harvesting and Spraying: Machinery Ownership Versus Custom Hire," revised Jul 2015. https://www.extension.iastate.edu/agdm/crops/pdf/a3-33.pdf
- Iowa State University Extension and Outreach, Ag Decision Maker File A3-29, "Estimating Farm Machinery Costs," revised Mar 2026. https://www.extension.iastate.edu/agdm/crops/pdf/a3-29.pdf
- Iowa State University Extension and Outreach, Ag Decision Maker File A3-27, "Fuel Required for Field Operations," revised Feb 2026. https://www.extension.iastate.edu/agdm/crops/pdf/a3-27.pdf
- Lattz, D. and G. Schnitkey, University of Illinois farmdoc, "Machinery Cost Estimates: Harvesting," Aug 2025. https://farmdoc.illinois.edu/assets/management/machinery-costs/harvest_operations_2025.pdf
- USDA Agricultural Marketing Service, Illinois Production Cost Report (Bi-weekly), Oct 30, 2026: No. 2 farm diesel, average $5.71 per gallon, F.O.B. https://www.ams.usda.gov/mnreports/ams_3195.pdf
- Federal Reserve Bank of Chicago, AgLetter No. 2013, Aug 2026. https://www.chicagofed.org/publications/agletter/2025-2029/august-2026
- Crop Root Zone, TRZ-0049, "Your Trade-In Is Appreciating and Your Replacement Is Tariffed. The Fleet Math Just Inverted.," 2026-07-29.
- Crop Root Zone, TRZ-0115, "Deere Beat, and 87% of the Growth Came From Machines That Never Enter a Corn Field," Aug 20, 2026.
- Crop Root Zone, TRZ-0196, "A New Combine Has to Cover About 2,700 Acres a Year to Beat Iowa's Custom Rate. Diesel Moved That Line by 60 Acres; a Slow Soybean Queue Moves It 500.," Sep 15, 2026.
Disclosures
Crop Root Zone is an independent publication. Nothing here is investment advice. Market calls, where included, reflect the editors' own read and are not a recommendation to buy or sell any security.
Iowa Had 53% of Its Corn Still Standing on October 25, on the Wettest Topsoil in the Corn Belt. Tracks on a Grain Cart Cost About $49,000 More Than Tires and Fix Only the Shallow Half of the Damage.
The research on a single wet pass at 10 to 12 tons per axle has held for 30 years: about 15% off the next crop, of which about 10 points sit in the topsoil and upper subsoil and fade within 5 to 10 years, and 3 to 5% sit below 16 inches and stay. Tire pressure, IF/VF casings, CTIS and tracks work on the shallow part. Only axle load works on the deep part, and a loaded 1,100-bushel cart carries three to four times the research threshold. On our model, VF combine fronts pay on about 60 farm acres, CTIS on 200 to 350 and cart tracks on about 700, if each avoids half the shallow loss and one harvest in three is wet.
Iowa had 47% of its corn harvested in the week ending October 25, against a 2021–2025 average of 67%. Its topsoil was rated 13% surplus, the highest share of any major Corn Belt state, against 10% in Nebraska, 5% for the 48 states and 2% to 4% in Illinois, Minnesota, Indiana and Ohio. Across the 18 main corn states, 60% of the crop was out against a 66% average; Ohio stood at 35% against 46% (USDA NASS, Oct 26, 2026) [1]. So more than half of the largest corn state's crop is still in the field, on the wettest ground in the Corn Belt, and every remaining bushel will cross that ground at least twice: once in a combine tank and once in a grain cart. Our earlier piece on carts and trucks left compaction out of the arithmetic on purpose [22]. This one puts it back in. We price what VF tires, central tire inflation (CTIS) and tracks cost, and set those costs against the yield loss that 30 years of axle-load research attributes to wheel traffic on wet soil. The research gives a clear answer on what each fix can and cannot do. Flotation buys back the shallow damage. It does nothing for the deep damage, and the deep damage is the part that does not go away.
1. What the research says one wet pass costs, and where the loss sits
What's new: Nothing, and that is the point. The core finding has held since 1994. Håkansson and Reeder pooled more than 20 compaction experiments in North America and Europe, some run for 12 years. Traffic at 10 to 12 tons per axle on moist soil cut yields about 15% in the first year. Ten years later the loss was still 3 to 5% (Håkansson and Reeder, 1994; as summarized by Penn State Extension, updated Feb 12, 2005) [2][3]. Penn State and Purdue Extension both attribute about 10 points of that first-year loss to the topsoil and upper subsoil. The topsoil effect faded in about 5 years and the upper-subsoil effect in about 10. The deep subsoil loss persisted through the full measurement period (Purdue Extension, Oct 24, 2016) [4]. The paper's own abstract puts compaction at about 50 cm (20 inches) under a 10 Mg axle load on wet soil, and calls compaction below about 40 cm "effectively permanent," even in clays that freeze every winter [2].
Evidence: The split matters because each layer has a different cause. Purdue's summary of the same work is blunt. Topsoil compaction depends only on ground contact pressure. Upper subsoil compaction depends on contact pressure and axle load. Lower subsoil compaction depends only on axle load [4]. Tire pressure, tire construction and tracks change contact pressure. They do not change axle load.
The newer North American work agrees on direction and differs on size:
| Study | Load | Soil and conditions | Yield effect |
|---|---|---|---|
| Håkansson and Reeder, 20+ sites in N. America and Europe [2][3] | 10–12 t/axle, one-time | Moist to wet | About −15% year 1; −3 to −5% at year 10 |
| Voorhees (USDA-ARS, Morris, MN), 6 corn sites [5] | 8–10 and 12–20 t/axle, one-time | 25–38 in. annual rain | −1% to −55% |
| Voorhees, Waseca, MN [5] | 20 t/axle, one-time | Two wet years vs. one dry | About −10% to −30% in wet years; no loss in the dry year |
| Blanco-Canqui and Lal, Ohio, 20 years no-till [7][8] | 10 and 20 Mg/axle | Clay loam vs. silt loam | Clay loam: grain −13%, stover −23%; silt loam: no yield loss |
| Klopfenstein, Ohio State, 2,000-bu cart [9] | About 100 t loaded | Normal and wet | Compaction to 34 in.; projected loss over 50% the next corn year |
| USDA trial, Wever, IA, 3 years [13] | Tractors and combines, 18 psi tires vs. 6 psi and 2.5 psi tracks | Field scale | Corn 86 bu (tires), 98 (tracks), 102 (low-pressure tracks) |
Source: Håkansson and Reeder, Soil & Tillage Research, 1994 [2], as summarized by Penn State Extension [3]; Voorhees data as presented by DeJong-Hughes, University of Minnesota Extension, Feb 2026 [5]; Blanco-Canqui and Lal, Agronomy Journal, 2008 (abstract) [7]; Lessiter, No-Till Farmer, May 21, 2015 [9]; FARM SHOW, 1991 [13]. The Klopfenstein cart figure is reported as "about 30 tons per axle" and "about 200,000 lb loaded" in the same article; the two do not reconcile, and we use neither in the model.
Two cautions carry through the rest of this piece. First, the dry-year result at Waseca is not an outlier. The University of Minnesota's own summary of that work shows the 20-ton pass costing nothing in a dry year [5], and Ohio's silt loam lost no yield at either load [7]. Compaction is a wet-soil, heavy-soil problem. Ohio State's own release on that work also reported earthworm numbers down 70% on the clay and 50% on the silt loam, and effects lasting as long as eight years (Farm and Dairy, Mar 3, 2009) [8]. Second, almost every controlled study stops at 20 tons per axle. The machines now running in Iowa's corn are well past that, so the published losses are a floor for them, not a ceiling.
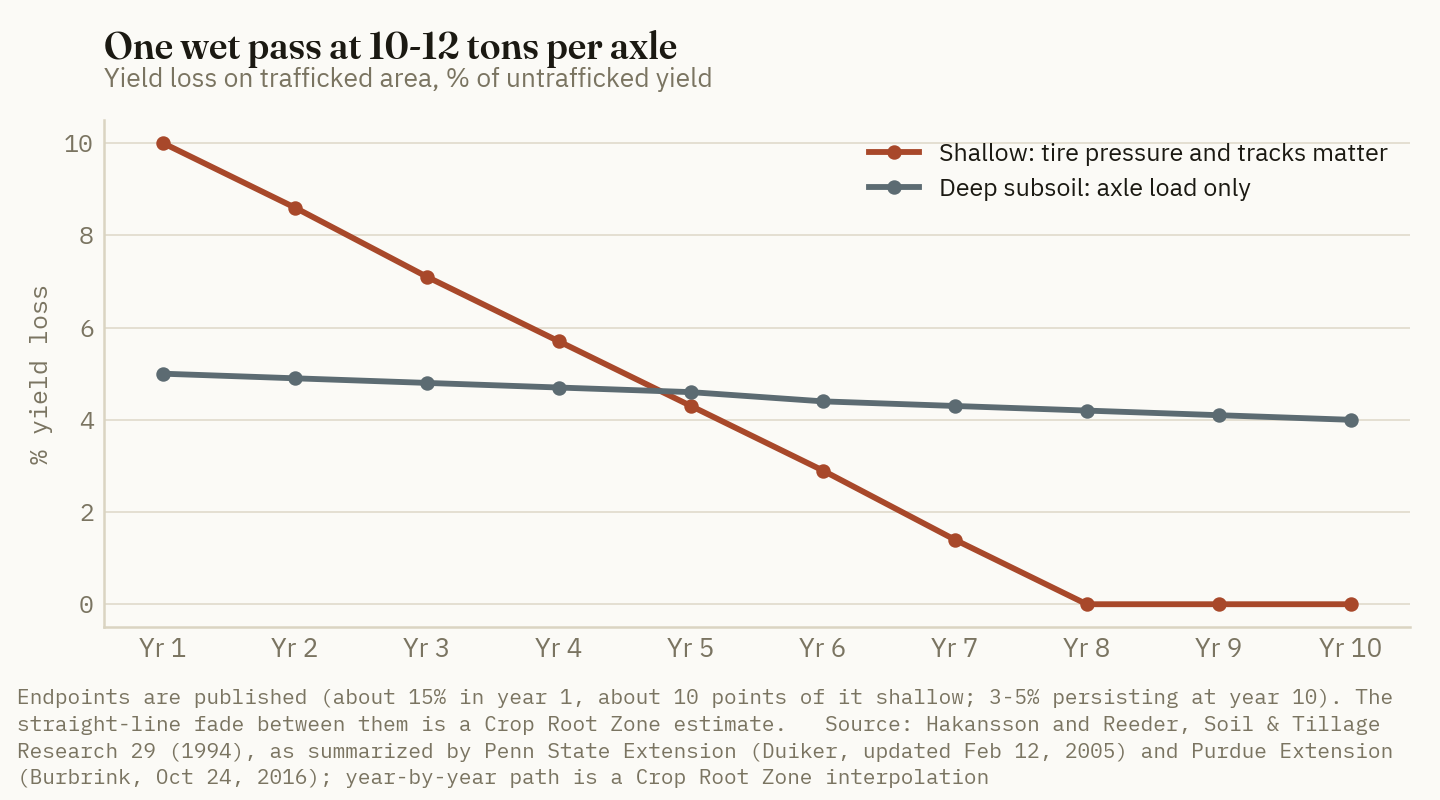
Ground Truth: Read the research as two separate bills. The shallow bill is large, fast and temporary, and a grower can cut it by buying flotation. The deep bill is smaller each year but never stops arriving, and no tire or track lowers it. Any vendor claim that tracks or VF tires "eliminate compaction" is talking about the first bill only.
2. What harvest machines put on one axle now
What's new: The University of Minnesota's compaction presentation for this year's North Dakota advanced crop advisers' workshop lists full-weight axle loads for current harvest equipment. A Class 9 combine with a 12-row head and a 360-bushel tank carries 20 tons on an axle. A Class 11 combine with a 16-row head and 485-bushel tank carries 44 tons. A single-axle 1,200-bushel grain cart runs 35 to 40 tons. Its guidance is to stay around 5 tons per axle on poorly structured soil and 10 on well-structured soil (DeJong-Hughes, University of Minnesota Extension, Feb 2026) [5].
Evidence:
| Machine, fully loaded | Tons per axle | |
|---|---|---|
| 2,000-bu grain cart, single axle, tandem or tracked | 73–80 | ██████████ |
| Class 11 combine, 16-row, 485-bu tank | 44 | ██████░░░░ |
| 1,200-bu grain cart, single axle | 35–40 | █████░░░░░ |
| 12-row combine, full tank (Iowa State) | 26 | ███░░░░░░░ |
| Single-axle grain cart (Iowa State) | 22 | ███░░░░░░░ |
| Class 9 combine, 12-row, 360-bu tank | 20 | ███░░░░░░░ |
| 4WD tractor, 325 hp, front axle | 13 | ██░░░░░░░░ |
| 560-bu gravity wagon, two axles | 10 | █░░░░░░░░░ |
| Håkansson and Reeder test load | 10–12 | █░░░░░░░░░ |
| Minnesota guidance, poor soil structure | 5 | █░░░░░░░░░ |
Source: DeJong-Hughes, "Compaction: quick to cause, slow to remedy," University of Minnesota Extension, presented to the NDSU Advanced Crop Advisors Workshop, Feb 2026 [5]; Al-Kaisi, Licht and Tekeste, Iowa State University ICM News, Sep 10, 2019 [6]; research load from [2]. Figures are tons as published; ranges use the midpoint for the bar. For single-axle carts the published figure is effectively the whole loaded weight. Bars scale to 76.5 tons = ten blocks.
Iowa State's 2019 figures are lower, at 26 tons for a full 12-row combine and 22 tons for a single-axle cart [6], because they describe smaller machines. The weight is still rising. Keller and Or traced laden combine weight from about 4 metric tons in 1958 to about 36 metric tons in 2020, with front-wheel loads rising from 1.5 to 12.5 tons. They estimate that about 20% of the world's arable land, concentrated in mechanized regions including North America, now carries traffic heavy enough to cause chronic subsoil compaction at 50 cm (Keller and Or, PNAS, May 16, 2022) [11]. An earlier paper by Keller and colleagues linked the same weight trend to higher subsoil stress, lower hydraulic conductivity and slower root growth (Keller et al., Soil & Tillage Research, 2019) [12].
The cart is the worst offender because it does all its work on one axle. A full 1,150-bushel load of corn weighs about 64,400 pounds, or 32 tons, before counting the cart (Crop Root Zone arithmetic at 56 lb/bu). Ohio State's Scott Shearer has seen carts of 2,500 bushels, about 95 tons loaded. He says compaction that used to reach 15 to 18 inches now reaches 30 to 40 inches after a wet harvest. He also says the first pass does about 85% of the damage (Western Producer, Apr 16, 2025) [10].
3–5% a year
The yield loss still measured ten years after a single 10- to 12-ton axle pass on moist soil. It sits in the deep subsoil, where only axle load matters, and today's loaded single-axle carts run three to four times that load. (Håkansson and Reeder, 1994, via Penn State and Purdue Extension)
3. What the fixes cost in 2026
What's new: Public prices exist for each option, though only some are current US list or asking prices.
Evidence: Tires. NTS Tire Supply lists a Firestone VF900/60R32 CFO combine tire at $5,380.24, rated 25,400 lb single at a 46 psi maximum, with three units available for pickup by November 3. The same store lists the Firestone IF900/60R32 CFO at $3,988, rated 18,700 lb at 35 psi, shown as not available (NTS Tire Supply, accessed Oct 29, 2026) [14][15]. Farmers Weekly reports the usual rule of thumb: IF construction carries a given load at about 20% less pressure than a standard tire, and VF at about 40% less (Farmers Weekly, Mar 15, 2022) [17].
Central tire inflation. Integrated factory systems sold in the UK at £13,490 (John Deere 8R) and £14,585 (Fendt VarioGrip) in 2022. A PTG-based TractAir retrofit ran about £6,000 to £8,000. A trailer-mounted system that uses the tractor's brake compressor ran about £4,800 per trailer [17]. The entry tier is far cheaper: in 2016 TractAir sold a manual two-tire coupling kit for £590 and in-cab control for £2,300 to £5,000 (Farmers Weekly, Jan 20, 2016) [19]. In the US, NTS quotes $25,000 for CTIS on a John Deere 8R's two axles plus a DB66 planter, with no date beyond its 2026 copyright (NTS Tire Supply, accessed Oct 29, 2026) [16]. We found no current US list price for a CTIS kit on a grain cart.
Tracks. One Iowa dealer, Keast Enterprises of Henderson, lists the same J&M 1112-20 cart both ways. New 2026 tire units with 1250/50R32 tires are listed at $82,449 to $86,746, depending on scales and tires. The 2026 tracked 1112-20T, a 1,150-bushel unit on a 36-by-120-inch track system, is listed at $133,265 to $133,307 (Keast Enterprises listings on Fastline and Tractor Zoom, accessed Oct 29, 2026) [18]. Against the $84,079 scale-equipped tire unit, the track premium is $49,186.
| Option | Price | Basis | Life | Cost a year* | Bushels a year to pay* |
|---|---|---|---|---|---|
| VF instead of IF, combine front pair | $2,784 premium | NTS list, 900/60R32, Oct 29, 2026 | 6 yr | $586 | 125 |
| CTIS, tractor plus one implement, low case | $15,000* | Estimate from UK retrofit range and US package | 10 yr | $2,148 | 457 |
| CTIS, tractor plus one implement, high case | $25,000 | NTS 8R + planter package | 10 yr | $3,579 | 762 |
| Tracks on a 1,150-bu cart | $49,186 premium | Keast asking prices, same model | 10 yr | $7,042 | 1,498 |
*Crop Root Zone calculation. Capital recovery at 7.12%, the Chicago Fed's second-quarter 2026 average farm operating-loan rate (Federal Reserve Bank of Chicago, Aug 2026) [21], with no salvage value. Bushels at $4.70, USDA's 2026/27 season-average corn price forecast (USDA WASDE, Oct 9, 2026) [20]. The $15,000 CTIS case is an estimate. Track undercarriage maintenance and any resale premium for tracks are excluded. Source: NTS Tire Supply [14][15][16]; Farmers Weekly [17]; Keast Enterprises dealer listings [18].
Two caveats on these prices. The cart figures are one dealer's asking prices, not manufacturer list. We read them from search-indexed listing summaries, because both listing sites refused direct page requests (403 and 429). The VF-over-IF comparison also understates what VF buys. The VF tire in the table carries 36% more load than the IF tire beside it. A grower choosing VF is often buying the ability to run a heavier combine at the same pressure, not a lower pressure on the same combine.
Ground Truth: Inflation is the cheap part of flotation, and it is the part most often skipped. An IF or VF casing run at road pressure in the field is a standard tire with a higher price. Before paying $25,000 for CTIS, a grower can get most of the field benefit from a gauge, the manufacturer's load-and-inflation table and a weighed load. CTIS earns its price on machines that cross the road between every field, where the right road pressure and the right field pressure are far apart.
4. The break-even: when each fix pays for itself
What's new: We built a per-acre loss model from the research in Section 1 and set it against the annual costs in Section 3. These are Crop Root Zone estimates. They are not field measurements, and each assumption is listed below.
Evidence: The model starts from the published endpoints: about 15% loss in year one, about 10 points of it shallow, and about 4% deep loss still present at year ten [2][3][4]. We fade the shallow share in a straight line to zero by year eight, and the deep share from 5% to 4% over ten years. That is the interpolation shown in the chart in Section 1. At 200 bushels an acre and $4.70 corn [20], discounted at 7.12% [21], one wet-soil pass costs about $308 an acre in shallow loss and about $300 an acre in deep loss over ten years. That is per trafficked acre, the area actually under the wheels.
Three more assumptions turn that into a farm-level break-even. First, the share of the field under cart and combine wheels in a harvest: we use 20%, an estimate; Minnesota's presentation puts all-season traffic on a conventionally farmed field near 85% and controlled-traffic systems at 20 to 40% [5]. Second, how often harvest happens on wet soil: we use one year in three, also an estimate. Third, how much of the shallow loss each fix avoids. No trial isolates that number for these machines, so we bracket it at 25%, 50% and 75%.
| Option | Cost a year* | Farm acres to pay, avoids 25%* | ...50%* | ...75%* |
|---|---|---|---|---|
| VF fronts on combine | $586 | 114 | 57 | 38 |
| CTIS, $15,000 | $2,148 | 418 | 209 | 139 |
| CTIS, $25,000 | $3,579 | 697 | 349 | 232 |
| Tracks on 1,150-bu cart | $7,042 | 1,372 | 686 | 457 |
*Crop Root Zone estimates. Break-even farm acres = annual cost ÷ ($308 × share of shallow loss avoided × 20% trafficked × one wet year in three). Inputs as in Section 3, plus Håkansson and Reeder (1994) via Penn State and Purdue Extension [2][3][4]; 200 bu/acre is an assumption.
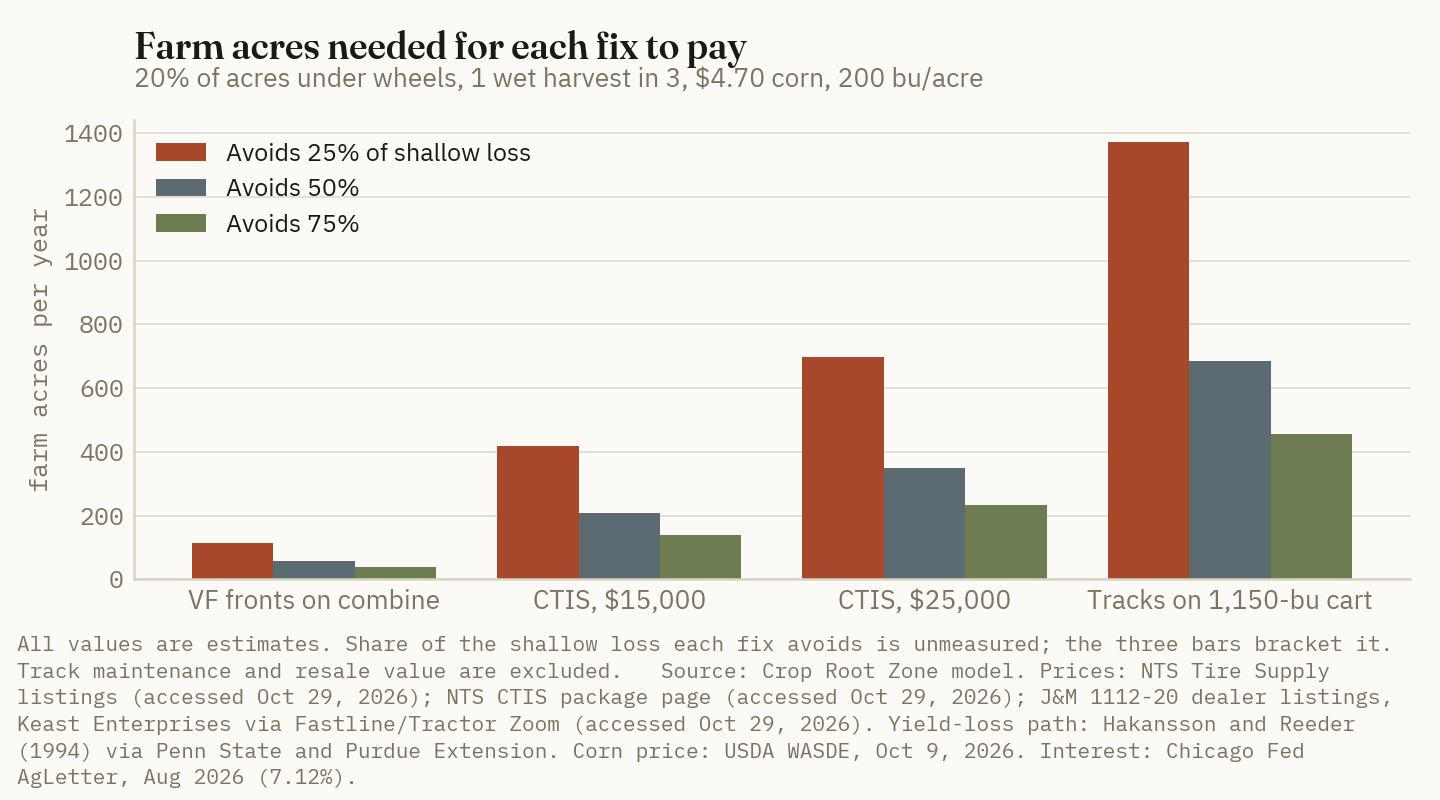
On these numbers every option pays on a commercial Corn Belt farm, and the order is clear. VF fronts on a combine pay almost anywhere. CTIS pays on a few hundred acres. Cart tracks need about 700 acres at the midpoint. The result is most sensitive to the wet-year frequency. If wet harvests come one year in five rather than one in three, every break-even rises by two-thirds. On well-drained silt loams, where Ohio measured no yield loss [7], the true break-even may not exist at all.
The research on whether tracks beat well-inflated tires is mixed, and that limits the track case. The Wever, Iowa trial found 12 to 16 more bushels under tracks than under 18 psi tires [13]. Ohio State work summarized by Penn State found that a tractor on large tires at 6 to 7 psi left less compaction than tracked tractors, and Penn State concluded that tracks can compact as much as tires at the same total load [3]. Ohio State's Randall Reeder put it as tracks at 10 psi compacting about like tires at 25 to 30 psi (No-Till Farmer, May 21, 2015) [9]. Tracks win against tires run hard. Against tires run at the bottom of the load table, the gap narrows. Track carts are also built to carry more. The tracked J&M is a 1,150-bushel unit [18], so part of the flotation it buys goes to hauling more weight on the same axle.
Ground Truth: The break-even is low enough that the question for most farms is not whether flotation pays, but in what order to buy it. Start with pressure, which is free. Then put VF casings on the combine at the next tire change, where the premium is small and the machine is on every acre. Buy CTIS for machines that road between fields. Buy cart tracks last, and only on heavy, poorly drained soil where wet harvests are routine. On that soil, once flotation has done its work, the deep loss in the next section is the larger bill left.
5. The part no tire or track fixes: axle load
What's new: The deep half of the loss is about as large as the shallow half. On our model it is about $300 per trafficked wet-soil acre against $308 for the shallow share. On a 1,000-acre farm at 20% traffic and one wet harvest in three, each is worth about $20,000 a year (Crop Root Zone estimate). The research says only axle load moves it [2][4].
Evidence: The extension advice on axle load is consistent and cheap to follow. Iowa State recommends not running equipment full in the far reaches of a field, keeping full loads near the end rows, and putting grain carts on dedicated travel lanes, because 60 to 80% of compaction comes from the first wheel passes (Iowa State University, Sep 10, 2019) [6]. Purdue adds axles to spread weight, limits field traffic when wet and concentrates repeated traffic in fixed lanes so any deep tillage can be limited to those lanes [4]. Deep tillage is not a reliable cure. Minnesota's summary of Midwest zone-tillage trials found no yield gain where there was no restrictive layer, and an Iowa Soybean Association series found growers judged the gains too small to pay with no second-year benefit [5].
None of these steps has a public price, and we do not invent one. The cost of a half-full cart on wet ground is extra trips, and whether that slows the combine depends on the cart-to-combine ratio. Our earlier analysis of carts and trucks found unloading already takes 8 to 10% of combine capacity [22]. A farm with a second cart or an extra truck can lighten loads in a wet field without stopping the combine. A farm running one cart cannot.
Ground Truth: On wet ground, the most valuable compaction decision this fall costs nothing to buy: fill the cart half-full in the interior of the field and full only at the headland. Tracks and VF tires can claw back the shallow loss. Only a lighter axle protects the subsoil, and the subsoil is where the damage stays for a decade. With more than half of Iowa's corn still standing on 13% surplus topsoil, the farms that change how they load the cart this week will lose less in 2027 than the farms that change what it rolls on next year.
References
- USDA National Agricultural Statistics Service, "Crop Progress," week ending Oct 25, 2026, released Oct 26, 2026. https://release.nass.usda.gov/reports/prog4326.txt
- Håkansson, I. and R.C. Reeder, "Subsoil compaction by vehicles with high axle load — extent, persistence and crop response," Soil & Tillage Research 29(2–3): 277–304, 1994 (abstract; full text not reached).
- Duiker, S., "Avoiding Soil Compaction," Penn State Extension, updated Feb 12, 2005. https://extension.psu.edu/avoiding-soil-compaction
- Burbrink, J., Purdue Extension, "Strategies Reduce Compaction," InkFreeNews, Oct 24, 2016. https://archive.inkfreenews.com/?p=150456
- DeJong-Hughes, J., "Compaction: quick to cause, slow to remedy," University of Minnesota Extension, presentation to the NDSU Advanced Crop Advisors Workshop, Feb 2026 (includes Voorhees, USDA-ARS, multi-state and Waseca data). https://www.ndsu.edu/agriculture/sites/default/files/2026-02/2026%20ACAW%20DEJONG-HUGHES%20Compaction%20quick%20to%20cause%2C%20slow%20to%20remedy.pdf
- Al-Kaisi, M., M. Licht and M. Tekeste, "Plan Ahead to Minimize Soil Compaction During Harvest," Iowa State University Extension and Outreach, ICM News, Sep 10, 2019. https://crops.extension.iastate.edu/cropnews/2019/09/plan-ahead-minimize-soil-compaction-during-harvest
- Blanco-Canqui, H. and R. Lal, "Axle-Load Impacts on Hydraulic Properties and Corn Yield in No-Till Clay and Silt Loam," Agronomy Journal, 2008 (abstract). https://doi.org/10.2134/agronj2008.0127
- Farm and Dairy, "Study on soil compaction goes deeper" (Ohio State, R. Lal), Mar 3, 2009. https://www.farmanddairy.com/?p=11314
- Lessiter, F., "Heavier Equipment, Deeper Compaction Mean Lower Yields," No-Till Farmer, May 21, 2015. https://no-tillfarmer.com/articles/4729-heavier-equipment-deeper-compaction-mean-lower-yields
- Halsall, M., "Supersized grain carts a weighty problem for soil compaction," The Western Producer, Apr 16, 2025. https://www.producer.com/crops/supersized-grain-carts-a-weighty-problem-for-soil-compaction/
- Keller, T. and D. Or, "Farm vehicles approaching weights of sauropods exceed safe mechanical limits for soil functioning," PNAS 119(21): e2117699119, May 16, 2022. https://pmc.ncbi.nlm.nih.gov/articles/PMC9173810
- Keller, T., M. Sandin, T. Colombi, R. Horn and D. Or, "Historical increase in agricultural machinery weights enhanced soil stress levels and adversely affected soil functioning," Soil & Tillage Research 194: 104293, 2019. https://doi.org/10.1016/j.still.2019.104293
- FARM SHOW Magazine, "Experimental Cat Tractor" (USDA trial, Wever, Iowa), Vol. 15, Issue 3, 1991. https://www.farmshow.com/a_article.php?aid=3481
- NTS Tire Supply, Firestone VF900/60R32 CFO Maxi Traction R-1W 193B, product listing, accessed Oct 29, 2026. https://store.ntstiresupply.com/shop/006311-vf900-60r32cfo-firestone-maxi-traction-r-1w-193b-100-35231
- NTS Tire Supply, Firestone IF900/60R32 Radial All Traction 23 CFO R-1 182B, product listing, accessed Oct 29, 2026. https://store.ntstiresupply.com/shop/000903-if900-60r32-firestone-radial-all-traction-23-cfo-r-1-182b-100-34922
- NTS Tire Supply, "PTG Central Tire Inflation Systems for Planters," accessed Oct 29, 2026. https://www.ntstiresupply.com/central-tire-inflation-systems/planter-kits
- Hill, P., "Central tyre inflation systems – the options and prices," Farmers Weekly, Mar 15, 2022. https://www.fwi.co.uk/machinery/technology/central-tyre-inflation-systems-the-options-and-prices
- Keast Enterprises (Henderson, Iowa), new 2026 J&M 1112-20S and 1112-20T grain cart listings on Fastline and Tractor Zoom, accessed Oct 29, 2026 via search index (listing pages returned 403/429 to direct requests). https://www.fastline.com/farm-equipment/listing-detail/2026-jm-1112-20t-keast-enterprises-henderson-iowa/51859a17-eb41-413b-983c-3695aebc679f ; https://tractorzoom.com/equipment/2026-jandm-1112-20t-d624401b-a5b9-4a54-afb9-0b965c891346
- Cousins, D., "In-cab tyre inflation cuts costs and compaction" (TractAir/PTG Airbox prices), Farmers Weekly, Jan 20, 2016. https://www.fwi.co.uk/machinery/central-tyre-inflation-kit-tractors-gets-cheaper
- U.S. Department of Agriculture, World Agricultural Outlook Board, World Agricultural Supply and Demand Estimates, WASDE-676, Oct 9, 2026. https://www.usda.gov/oce/commodity/wasde/wasde1026.pdf
- Federal Reserve Bank of Chicago, AgLetter No. 2013, Aug 2026 (second-quarter 2026 survey; farm operating loans 7.12%). https://www.chicagofed.org/publications/agletter/2025-2029/august-2026
- Crop Root Zone, TRZ-0296, "A Grain Cart Costs About What a Used Farm Semi Costs to Own. Whether It Beats a Third Truck Depends on the Tractor in Front of It.," Oct 20, 2026.
Disclosures
Crop Root Zone is an independent publication. Nothing here is investment advice. Market calls, where included, reflect the editors' own read and are not a recommendation to buy or sell any security.
Monitoring a 30,000-Bushel Bin Costs $71 to $1,162 a Year. It Pays If It Saves Corn 0.7 Point of Over-Drying, or Soybeans 0.3.
A single-point alarm lists at $499 with no subscription. GSI's automated cable-and-fan package starts at $6,000 for a 50,000-bushel bin before installation and fees. Annualized over ten years, a wired cable system runs 2 to 4 cents a bushel a year on bins of 20,000 bushels and up, and automated control 2.6 to 5.8 cents. One musty discount is 10 cents on the whole bin, and one point of soybean over-drying is 13.6 cents. The break-even turns on crop and storage horizon more than bin size: soybeans and corn held past May clear it easily, corn sold by February barely needs it. Purdue documented 21 grain entrapments in 2025, the lowest in ten years.
USDA's October 9 supply-and-demand report raised 2026/27 corn ending stocks by 282 million bushels to 1.8 billion and cut the season-average corn price a dime to $4.70. Soybeans held at $12.00 on a 4.56-billion-bushel crop (USDA WASDE, Oct 9, 2026) [1]. December corn futures closed at $4.79¾ the next trading day, the lowest since mid-August (University of Arkansas, Oct 13, 2026) [2]. A big crop with a thin price means more bushels stored on the farm for longer, waiting on carry or basis. A full 30,000-bushel bin is now about $141,000 of corn or $360,000 of soybeans (Crop Root Zone arithmetic on [1]). The question this piece answers is how much of that is worth spending to watch it. We price temperature and moisture cables, wireless sensors and automated aeration controllers against the discounts, shrink and spoilage they guard against, and then set them against Purdue's latest count of people caught in grain.
Earlier pieces in this series covered the fan's electricity on a 30,000-bushel bin [14], three-phase power for fans [15], drying cost per point [16] and the build-or-rent storage decision [17]. This one does not repeat them. It prices the instruments that tell you when to run the fan and when to empty the bin.
1. What monitoring costs: four tiers, $499 to about $10,000 a bin
What's new: Bin monitoring is now sold at four price points, and only two of them publish a price. GSI's public GrainVue page advertises automated systems "starting as low as $6,000." The footnote prices a 50,000-bushel bin with a cellular gateway, a cable hub, a fan control module and one temperature cable. Installation, modifications, utility work and subscriptions are excluded (GSI, accessed Oct 28, 2026) [3]. At the other end, Farm Shop Mfg lists its Grain Temp Guard, a wired temperature-and-humidity monitor with one 15-meter probe and an audible alarm, at $499 with no monthly fee. A two-unit version lists at $999 (Farm Shop Mfg, accessed Oct 28, 2026) [4].
Evidence: The middle tiers have no public price list. Most vendors quote per bin through a dealer. The best public guide we found is a Manley Farms buyer's guide dated May 1, 2026. It puts a full temperature-cable install on a 30,000-bushel bin at $2,500 to $5,000 before labor, a cellular control box at a further $500 to $1,000, a single-bin wireless sensor kit with gateway and one season of service at $800 to $1,500, and an installed aeration controller at $500 to $1,000 for a basic unit or $1,500 to $3,000 for a cellular multi-fan model (Manley Farms, May 1, 2026) [5]. That is one source, so we treat its figures as estimates. For subscriptions we use $200 a bin a year, the cellular and data-hosting fee GSI charged when GrainVue launched (AgriNews, Sep 21, 2022) [6]. It is four years old and GSI's current page does not state a fee [3].
| Tier | What it does | Hardware, 30,000-bu bin | Annual fee | Hardware ¢/bu of capacity |
|---|---|---|---|---|
| Single-point alarm | One probe, local alarm, no remote access | $499 | $0 | 1.7 |
| Wireless sensors | Sensors on or in the grain, cellular gateway, phone app | $800–$1,500* | $200* | 2.7–5.0 |
| Wired cables, cellular | Temperature (or temperature-moisture) cables from the roof, remote reads | $3,000–$6,000* | $200* | 10–20 |
| Cables + automated control | As above, plus fan control on temperature and humidity | $3,500–$9,000*; GSI from $6,000 at 50,000 bu before install | $200* | 12–30 |
Estimate. Source: Farm Shop Mfg list price, accessed Oct 28, 2026 [4]; GSI GrainVue page, accessed Oct 28, 2026 [3]; Manley Farms buyer's guide, May 1, 2026 [5]; fee as reported by AgriNews, Sep 21, 2022 [6]. Ranges are single-source dealer guidance, not quotes. Cents per bushel are Crop Root Zone arithmetic on capacity.
Cable systems do not scale smoothly with bin size, because cable count follows bin diameter. OPI Systems' guidance is one center cable up to 24 feet, a center cable plus three outer cables from 24 to 39 feet, and four outer cables up to 42 feet (Alberta Farm Express, Jun 22, 2009) [7]. The guidance is old but the geometry has not changed. A 20,000-bushel bin and a 30,000-bushel bin often take the same four cables. That is why cost per bushel drops sharply between them. GSI's $6,000 single-cable base package is a starting point. A 42-foot bin wired to the OPI spacing would carry four or five cables, so a quote for full coverage will run above it.
2. What it protects: the discount sheet, the shrink and the pocket
What's new: The losses monitoring prevents are listed on every elevator's discount schedule. Bartlett's yellow corn scale for Sheffield, Illinois, effective August 1, 2026, takes 10 cents a bushel for musty or sour corn and 15 cents for infested corn. Heat damage costs 4 cents for 0.3% to 0.7%, 8 cents for 0.8% to 1.2% and 12 cents for 1.3% to 1.7%, on top of the general damage discount. Heat damage above 0.2% is subject to rejection. Total damage costs 2 cents a point from 5.1% to 10% and 13 cents a bushel at 10.1% to 11% (Bartlett, effective Aug 1, 2026) [11]. Those lines follow the federal grade: U.S. No. 2 corn allows 0.2% heat-damaged kernels, and musty, sour or heating corn grades Sample (7 CFR 810.404) [12].
Evidence: The other loss is self-inflicted. Fans run without a controller over-dry grain. Each point of moisture removed below the buyer's base costs about 1.16% of the weight at 14% final moisture, and about 1.14% at 12% (SDSU Extension, Aug 12, 2020) [13]. Buyers do not pay back for grain drier than base. At $4.70, a point of corn over-drying is 5.5 cents a bushel. On soybeans, assuming the common 13% market base, a point is 13.6 cents at $12.00 (Crop Root Zone arithmetic on [1][13]). Iowa State's Dirk Maier, as reported in our earlier piece, put the range at 0.3 to 1.9 points under market moisture for corn binned at 14.5% to 15.5% [14]. The electricity is small by comparison. Three fall cooling cycles on a 30,000-bushel bin cost about $146 [14], so a controller that halves fan hours saves tens of dollars. The value of control is in the shrink it avoids, not the power.
| One event on a 30,000-bu bin | $ | |
|---|---|---|
| Soybeans: 1 point over-dried below 13% | 4,091 | ██████████ |
| Corn: total damage 10.1–11% | 3,900 | ██████████ |
| Soybeans: 1% of bin spoiled (300 bu) | 3,600 | █████████░ |
| Corn: musty or sour discount | 3,000 | ███████░░░ |
| Corn: heat damage 0.8–1.2% | 2,400 | ██████░░░░ |
| Corn: 1 point over-dried below 15% | 1,640 | ████░░░░░░ |
| Corn: 1% of bin spoiled (300 bu) | 1,410 | ███░░░░░░░ |
| Cables + automated control, per year | 1,162 | ███░░░░░░░ |
| Wired cables, per year | 842 | ██░░░░░░░░ |
| Wireless sensors, per year | 364 | █░░░░░░░░░ |
| Single-point alarm, per year | 71 | ░░░░░░░░░░ |
Source: discounts from Bartlett Sheffield, IL yellow corn scale, effective Aug 1, 2026 [11]; shrink factors from SDSU Extension, Aug 12, 2020 [13]; prices from USDA WASDE, Oct 9, 2026 [1]. System rows (italic) are Crop Root Zone annualized costs from Section 1: midpoint hardware over 10 years at 7%, plus the $200 fee except on the alarm. The 1% spoiled-pocket rows are illustrations, not measured loss rates. Bars scale to $4,091 = ten blocks.
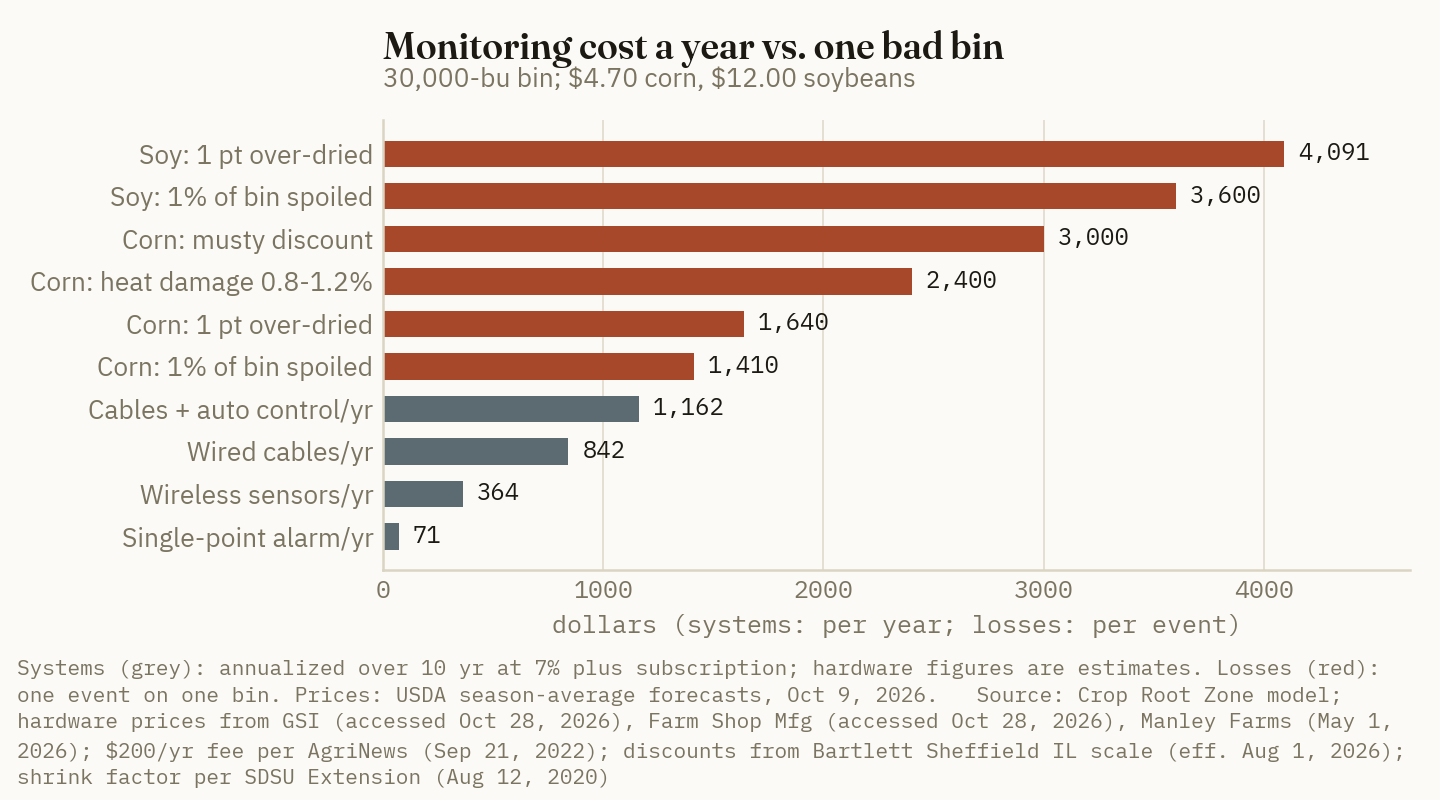
The soybean rows explain most of the result. A bin of beans is worth about two and a half times a bin of corn. Each point of over-drying costs more than twice as much per bushel. The same fan mistake that costs $1,640 on corn costs $4,091 on beans.
3. The break-even: bin size matters less than crop
What's new: We annualized each tier over a ten-year life at 7% interest and added the $200 fee. Then we asked how much loss the system must prevent each year to pay for itself. These are Crop Root Zone estimates built on the price ranges in Section 1. Cable cost is modeled as $750 for the cellular box plus about $940 per installed cable. That splits Manley's 30,000-bushel midpoint across four cables. The automated tier adds a $2,250 controller.
Evidence:
| Bin size | Cables | Wired cables, ¢/bu/yr | Automated, ¢/bu/yr | Automated pays if it saves, corn (points/yr) | ...soybeans (points/yr) | Wired cables pay if they stop one musty corn bin every... |
|---|---|---|---|---|---|---|
| 10,000 bu | 1 | 4.4 | 7.6 | 1.39 | 0.56 | 2.3 years |
| 20,000 bu | 4 | 4.2 | 5.8 | 1.06 | 0.43 | 2.4 years |
| 30,000 bu | 4 | 2.8 | 3.9 | 0.71 | 0.28 | 3.6 years |
| 50,000 bu | 5 | 2.0 | 2.6 | 0.47 | 0.19 | 5.1 years |
Basis: hardware at Section 1 midpoints, 10-year life, 7% interest (capital recovery factor 0.142), $200/yr fee; corn $4.70 and soybeans $12.00 [1]; over-drying valued at 5.47¢ (corn) and 13.6¢ (soybeans) per point [13]; musty discount 10¢/bu [11]. Wireless sensors run 3.6, 1.8, 1.2 and 0.7¢/bu/yr across the same sizes; the 50,000-bu figure assumes one kit and is a floor. All figures are Crop Root Zone estimates.
0.28 point
How much soybean over-drying an automated controller must prevent each year to pay for itself on a 30,000-bushel bin at $12.00 beans. On corn at $4.70 the bar is 0.71 point. (Crop Root Zone estimate on USDA WASDE, Oct 9, 2026, and SDSU Extension shrink factors)
Three points follow from the table. First, the cost per bushel falls fast up to about 30,000 bushels and then flattens. Below 20,000 bushels, cable count and the fixed fee dominate. Above 30,000, the system is cheap per bushel by any measure. Second, the crop moves the break-even more than size does. An automated controller on a 10,000-bushel soybean bin needs to save less shrink (0.56 point) than the same controller on a 20,000-bushel corn bin (1.06 points). Third, the cheap tiers are hard to argue against. A single-point alarm costs 15 bushels of corn a year. Wireless sensors cost about 77. That is a fraction of a percent of the bin.
Ground Truth: The question is not whether monitoring pays, because on a bin of 30,000 bushels or more a wired system clears its cost if it prevents one musty bin in three to five years. The question is which tier. Our read: automated control earns its premium over plain cables only where the controller actually changes fan behavior, and that is mostly on soybeans and on corn binned at or near market moisture. On corn binned at 16% that you mean to cool and sell by early summer, a few tenths of a point of shrink is part of the plan, and the controller's edge is small. On beans, every hour a thermostat-driven fan runs in dry afternoon air comes off the check. Put the automated controller on the soybean bins first. Put cables or wireless sensors on everything else that will be held past winter.
4. The horizon: monitoring earns its money in April, not December
What's new: Stored-grain risk is mostly a temperature problem, and temperature follows the calendar. Nebraska's shelf-life table for aerated shelled corn gives the days before 0.5% dry-matter loss. At 15% moisture, corn keeps 621 days at 50°F but only 275 at 60°F and 154 at 70°F. At 17% moisture it is 199, 88 and 49 days. Without aeration, shelf life is about a third of those values (UNL CropWatch, Oct 17, 2008) [9].
Evidence:
| Grain temperature | 15% corn, days | 17% corn, days | 19% corn, days |
|---|---|---|---|
| 40°F | not listed | 448 | 197 |
| 50°F | 621 | 199 | 88 |
| 60°F | 275 | 88 | 39 |
| 70°F | 154 | 49 | 22 |
Source: Dorn, UNL CropWatch, Oct 17, 2008, Table 1 (shelf life of aerated shelled corn to 0.5% dry-matter loss; laboratory estimates) [9].
NDSU's Ken Hellevang gives the field version. Dry corn at 15% keeps only about four months at 70°F and two at 80°F. He tells growers to check stored grain at least every two weeks. He also warns that a cable reads only the grain beside its sensors, and that grain a few feet away can be much warmer (NDSU, Jun 9, 2023) [10]. That last point cuts both ways. It is the case for more than one cable in a large bin. It is also the reason a single-point alarm is a tripwire, not a map.
The market side points the same way. Carl Zulauf's study of storage returns from 1974 to 2024 found that hedged and cash storage ending by June roughly covered its full cost on average. Cash storage past June usually lost money (farmdoc daily, Oct 8, 2025) [8]. So the bushels that need monitoring most are the ones a grower holds into May and June for carry or basis. That is also when the bin is warming from the south wall and the shelf-life numbers are falling fastest.
Ground Truth: Match the tier to the sale date, not to the bin. Corn cooled to the 30s in November and sold by February spends its whole storage life in the cold half of the table. A $499 alarm and a probe at the hatch every two weeks is enough for it. Corn and beans held into May and June are the bushels that earn monitoring back. With 1.8 billion bushels of projected ending stocks and $4.70 corn, more growers will be holding into that window this year than in most. If you add one system before spring, put it on the bin you expect to empty last.
5. The safety ledger: 21 entrapments, and the cost not on the discount sheet
What's new: Purdue's Agricultural Safety and Health Program documented at least 48 agricultural confined-space cases in 2025, 22 of them fatal. That is down 5.9% from 51 in 2024 and below the ten-year average of 60.2. Grain entrapments fell to 21, six of them fatal, from about 34 in 2024. That is a 38% drop and well under the five-year average of 30.6. The fatality rate for entrapments fell to 28.6% from 41.2% (Purdue, Jul 2026) [18].
Evidence: Purdue's caveats matter more than the drop. It estimates about 30% of cases go unreported. More than two-thirds of U.S. grain storage capacity is on farms, which are largely exempt from OSHA's grain-handling and confined-space reporting rules. The average entrapment victim in 2025 was 67.3 years old. Purdue also notes that civil settlements in recent grain-bin and manure-facility deaths have run $10 million to $17 million, against OSHA fines of $50,000 to $100,000 [18].
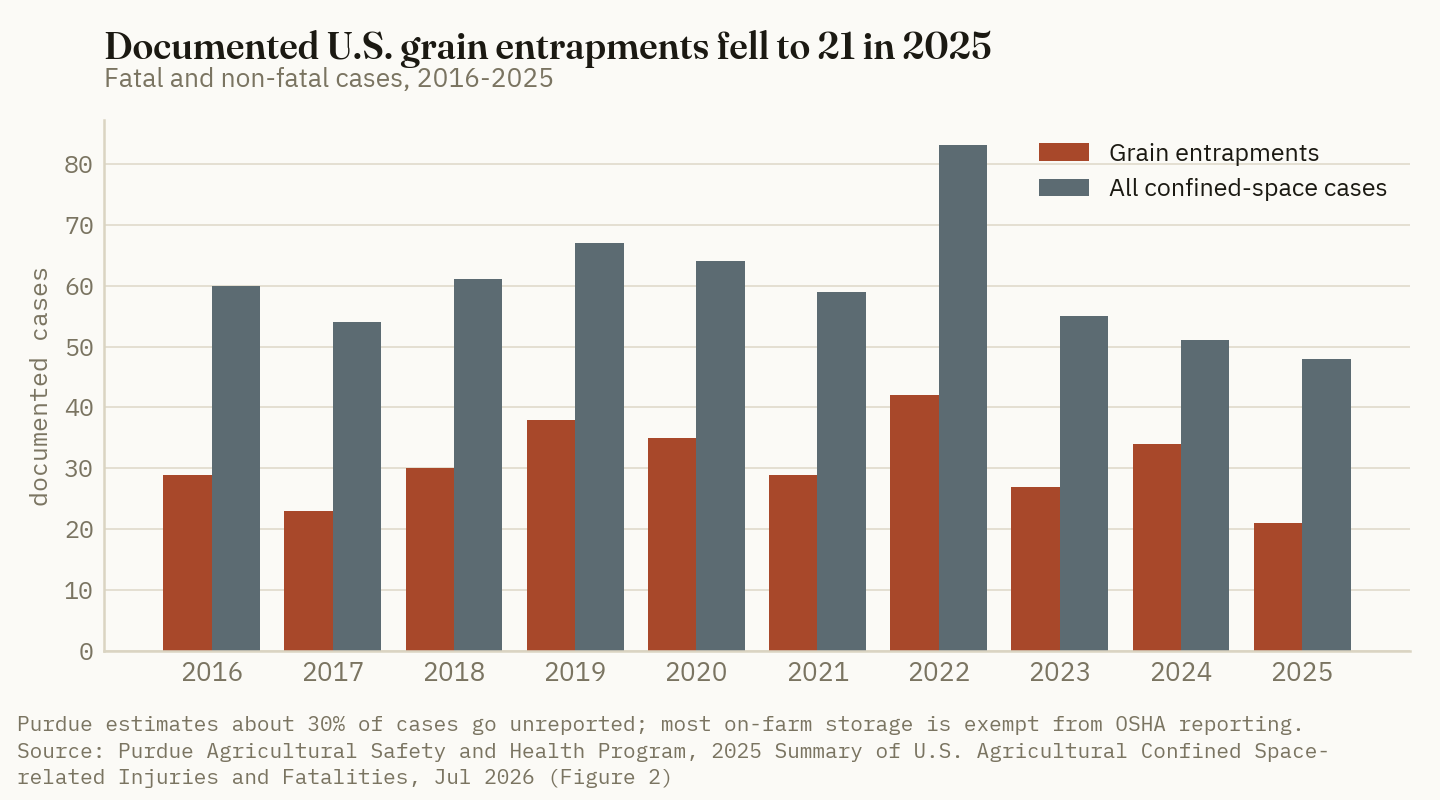
Purdue does not report how many entrapments began with out-of-condition grain, and we do not claim a number. The connection is practical. People go into bins when grain stops flowing: crusted tops, bridges and spoiled clumps that plug the unload. Those conditions start as a moisture or temperature problem a cable or sensor can flag weeks earlier.
Ground Truth: None of the break-evens in Section 3 count safety, and they should not need to. The economic case already clears on large bins and on anything held into spring. What the safety record adds is a tie-breaker for the bins where the economics are close: small bins, corn sold by late winter, older bins with poor aeration. A bin that never crusts is a bin nobody has to climb into, and the cheapest tier that gives an early warning is worth more on those bins than its 15 bushels a year suggest. Purdue's 21 is a low year, not a trend. Its own data show counts swing by a third from year to year, so plan on the ten-year pattern, not the last print.
References
- U.S. Department of Agriculture, World Agricultural Outlook Board, World Agricultural Supply and Demand Estimates, WASDE-676, Oct 9, 2026. https://www.usda.gov/oce/commodity/wasde/wasde1026.pdf
- Hightower, M., "WASDE hands corn prices another blow," University of Arkansas System Division of Agriculture, Oct 13, 2026. https://uaex.uada.edu/media-resources/news/2026/october/10-13-2026-ark-corn-price-folo.aspx
- GSI (Grain Systems), GrainVue campaign page, "Systems starting as low as $6,000," with pricing footnote, accessed Oct 28, 2026. https://www.grainsystems.com/na/en/campaigns/grainvue/
- Farm Shop Mfg, Grain Temp Guard grain bin temperature monitor, product listing, accessed Oct 28, 2026. https://farmshopmfg.com/product/grain-temp-guard/
- Manley Farms, "Grain Bin Monitoring: Temperature and Aeration Control," May 1, 2026. https://www.manleyfarms.com/blog/grain-bin-monitoring/
- Blum, M., "System provides continuous monitoring of stored grain," AgriNews, Sep 21, 2022. https://agrinews-pubs.com/news/farm-equipment/2022/09/21/system-provides-continuous-monitoring-of-stored-grain
- Garvey, S., "Monitoring key to safe grain storage" (sensor cable placement guidance from OPI Systems), Alberta Farm Express, Jun 22, 2009. https://www.albertafarmexpress.ca/?p=9246
- Zulauf, C., "Net Return to Storing U.S. Corn and Soybeans since 1973," farmdoc daily, University of Illinois, Oct 8, 2025. https://farmdocdaily.illinois.edu/2025/10/net-return-to-storing-us-corn-and-soybeans-since-1973.html
- Dorn, T., "Monitor Stored Grain Condition; Retain the Value of Your Crop," CropWatch, University of Nebraska–Lincoln, Oct 17, 2008. https://cropwatch.unl.edu/monitor-stored-grain-condition-retain-value-your-crop/
- North Dakota State University Extension, "NDSU Extension Offers Summer Grain Storage Tips" (K. Hellevang), Jun 9, 2023. https://www.ag.ndsu.edu/news/newsreleases/2023/june/ndsu-extension-offers-summer-grain-storage-tips
- Bartlett (a Savage company), Yellow Corn Discount Scale, Sheffield, Illinois, effective Aug 1, 2026. https://bartlettco.com/wp-content/uploads/2026/05/Sheffield-Scale-of-Discounts-8-1-26.pdf
- U.S. Code of Federal Regulations, 7 CFR 810.404, Grades and grade requirements for corn. https://www.ecfr.gov/current/title-7/subtitle-B/chapter-VIII/part-810/subpart-D/section-810.404
- Karki, D., "Corn Grain Moisture Discount: Why and How Much?," SDSU Extension, South Dakota State University, updated Aug 12, 2020. https://extension.sdstate.edu/corn-grain-moisture-discount-why-and-how-much
- Crop Root Zone, TRZ-0252, "Cooling a 30,000-Bushel Corn Bin This Fall Takes About $146 of Electricity. A Point of Shrink Below 15% Costs $1,600, and a Musty Load Costs $3,000.," Oct 2, 2026.
- Crop Root Zone, TRZ-0300, "Co-op Three-Phase Lines Run $9 to $17 a Foot. A 50 HP Fan's Converter Costs $13,000 to $21,000 Over 15 Years, So the Line Loses Past About Half a Mile.," Oct 21, 2026.
- Crop Root Zone, TRZ-0292, "A Point of Moisture Costs 2.8 Cents a Bushel to Remove in a Mixed-Flow Dryer at Iowa's October Propane and 4.1 Cents in an Old Cross-Flow. Natural Air Costs 4.4, and Five Elevator Schedules Charge 4.5 to 7 Cents Once Shrink Is Counted.," Oct 19, 2026.
- Crop Root Zone, TRZ-0029, "16 Billion Bushels Need Somewhere to Go: On-Farm Storage Economics Into the 2026 Harvest," Jul 23, 2026.
- Cheng, Y.-H., B. Field, J.E. Price, K. Ambrose, E. Sheldon and N. Haslett, 2025 Summary of U.S. Agricultural Confined Space-related Injuries and Fatalities, Purdue Agricultural Safety and Health Program, Purdue University, Jul 2026. https://www.purdue.edu/engineering/abe/agconfinespaces/wp-content/uploads/2026/07/2025-Summary-of-Confined-Spaces.pdf
Disclosures
Crop Root Zone is an independent publication. Nothing here is investment advice. Market calls, where included, reflect the editors' own read and are not a recommendation to buy or sell any security.
A Urease Inhibitor Adds About 6.5 Cents to a 73-Cent Pound of Urea Nitrogen. In Montana's Wheat Trials It Saved Enough Nitrogen to Pay in 9 of 17. Yield Moved in 1 of 9.
We estimate NBPT treatment at 5 to 8 cents a pound of N, which is $3 to $5 an acre on 60 pounds of wheat topdress and $7.50 to $12 on 150 pounds of surface-applied corn nitrogen. On nitrogen alone it has to conserve 7 to 11 points of applied N, roughly an 11% to 17% untreated loss. Corn needs 1.7 to 2.7 bushels. Trial results split on rain within days of application, more than on crop or soil.
Retail urea averaged $674 a ton in DTN's survey for October 19 to 23, up 13% from a year earlier, or $0.73 a pound of nitrogen (DTN, Oct 28, 2026) [1]. That raises the cost of every pound left on the soil surface. It also lands as wheat growers plan winter and early-spring topdress and corn growers price 2027 nitrogen. The coated-urea question has already been answered here: TRZ-0234 priced that coating against plain urea five weeks ago, and TRZ-0034 covered the blend case in July [2][3]. The cheaper add-on has had only a passing section, in a piece on nitrification inhibitors (TRZ-0075) [4]. So we priced the urease inhibitor on its own. NBPT is a different purchase from a coating. It costs about a third as much, it works for days rather than weeks, and it protects against only one loss route.
1. What the treatment costs per pound of N
What's new: We could not find a 2026 retail price for treated urea. The figure below is therefore our estimate, and it is the softest number in this piece. Three public anchors agree reasonably well.
Evidence: A 2.5-gallon nitrogen stabilizer whose listing address names Nitrain, an NBPT product in the 2023 Brazilian work below, shows at $224, or $89.60 a gallon (AgCare Products, read Nov 2, 2026; listed as sold out, active content not shown) [5][13]. NBPT labels we saw through search call for 2 to 3 quarts a ton of urea on Protek-N 267, 3 quarts on N-Stall and 3 to 5 quarts on one FBN product [6]. At $89.60 a gallon, 2 to 3 quarts works out to 4.9 to 7.3 cents a pound of N, and 5 quarts to 12.2 cents. That is a jug price. A retailer treating by the truckload may pay less and will also charge for the service. A Tennessee analysis used $1.05 a kilogram of N for urea and $1.19 for NBPT urea, a gap of 6.4 cents a pound (as cited in Liu et al., Scientific Reports, 2019) [7]. Nebraska's specialists put it at 4 to 6 cents in 2008, when nitrogen also cost less (Ferguson and Shapiro, University of Nebraska, Mar 7, 2008) [8].
We use 5 to 8 cents, with 6.5 as the midpoint.
| Program, one acre (CRZ calculation) | lb N | Premium at 5¢ | At 6.5¢ | At 8¢ | Break-even, bu |
|---|---|---|---|---|---|
| Winter wheat topdress, light | 60 | $3.00 | $3.90 | $4.80 | 0.5–0.8 |
| Winter wheat topdress, Montana trial rate | 90 | $4.50 | $5.85 | $7.20 | 0.8–1.2 |
| No-till corn, Tennessee low rate | 110 | $5.50 | $7.15 | $8.80 | 1.2–2.0 |
| Corn, all surface-applied | 150 | $7.50 | $9.75 | $12.00 | 1.7–2.7 |
Sources: premium is a Crop Root Zone estimate from [5][6][7][8]. Bushels use December futures at the Oct 30, 2026 close, corn $4.4775 and Chicago wheat $6.035 (Brownfield, Oct 30, 2026) [9]. Kansas City wheat was not on that report, and local basis will move these figures. Application is excluded because treated and plain urea take the same pass.
As a cross-check, the Tennessee budget's own break-even was 147 kilograms of corn a hectare at 168 kilograms of N, about 2.3 bushels an acre by our conversion [7]. That is close to our 150-pound midpoint of 2.2.
The other nitrogen options set the frame. Treated urea at 78 to 81 cents sits beside UAN28 at $0.80 and UAN32 at $0.76 on DTN's same sheet, with anhydrous at $0.60 [1]. Polymer-coated urea carried an estimated 16- to 22-cent premium in TRZ-0234 [2]. A treated-urea quote should be read against those lines and not against plain urea alone.
2. How much nitrogen it has to save
What's new: The fertilizer-only test is simple division. Divide the premium by the urea price. At 6.5 cents over 73 cents, the inhibitor must conserve 8.9 points of the applied N. The range is 6.8 points at 5 cents and 10.9 at 8 cents.
8.9 points
The share of applied nitrogen an inhibitor must keep out of the air to pay for itself on fertilizer value alone, at $674 urea and a 6.5-cent treatment. (Crop Root Zone calculation from DTN, Oct 28, 2026, and the estimate in Section 1)
Montana State's fact sheet says NBPT typically cuts cumulative ammonia loss by 60% to 65% (Engel and Jones, May 2021) [10]. At 63%, the break-even becomes an untreated loss of about 11% to 17%. Few field datasets test that as directly as Montana's. Rick Engel's group used a mass-balance method on 0.3-acre plots on private farms at 90 pounds of N, and published trial-level results for urea with and without Agrotain [10][11].
Evidence: The table ranks Montana's 17 published trials by the nitrogen the inhibitor conserved.
| Trial, date | Urea loss, % of N | With NBPT | Points saved | Value per 100 lb N applied | Pays at | |
|---|---|---|---|---|---|---|
| Willow Creek, Feb 26, 2010 | 44.1 | 11.9 | 32.2 | $23.59 | 8¢ | ██████████ |
| N. Havre, Nov 14, 2008 | 31.3 | 3.8 | 27.5 | $20.15 | 8¢ | █████████░ |
| W. Havre, Mar 26, 2009 | 39.9 | 18.1 | 21.8 | $15.97 | 8¢ | ███████░░░ |
| N. Havre, Mar 25, 2009 | 35.6 | 18.0 | 17.6 | $12.89 | 8¢ | █████░░░░░ |
| Willow Creek, Jan 27, 2010 | 24.3 | 9.3 | 15.0 | $10.99 | 8¢ | █████░░░░░ |
| Kremlin, Apr 20, 2010 | 14.7 | 1.8 | 12.9 | $9.45 | 8¢ | ████░░░░░░ |
| N. Havre, Oct 19, 2009 | 15.7 | 3.4 | 12.3 | $9.01 | 8¢ | ████░░░░░░ |
| Denton, Mar 5, 2011 | 20.7 | 10.1 | 10.6 | $7.77 | 6.5¢ | ███░░░░░░░ |
| Coffee Creek, Feb 28, 2012 | 13.0 | 4.1 | 8.9 | $6.52 | 6.5¢ | ███░░░░░░░ |
| Denton, Nov 29, 2011 | 13.4 | 5.9 | 7.5 | $5.49 | 5¢ | ██░░░░░░░░ |
| Kremlin, Oct 6, 2009 | 11.6 | 4.3 | 7.3 | $5.35 | 5¢ | ██░░░░░░░░ |
| Kremlin, Dec 30, 2011 | 14.9 | 8.2 | 6.7 | $4.91 | no | ██░░░░░░░░ |
| W. Havre, Oct 13, 2009 | 10.4 | 4.8 | 5.6 | $4.10 | no | ██░░░░░░░░ |
| W. Havre, Mar 29, 2010 | 6.1 | 1.7 | 4.4 | $3.22 | no | █░░░░░░░░░ |
| W. Havre, Apr 3, 2008 | 8.4 | 4.4 | 4.0 | $2.93 | no | █░░░░░░░░░ |
| W. Havre, Oct 8, 2008 | 3.1 | 1.4 | 1.7 | $1.25 | no | █░░░░░░░░░ |
| Coffee Creek, Apr 24, 2012 | 1.1 | 0.0 | 1.1 | $0.81 | no | █░░░░░░░░░ |
Source: Engel, Montana State University, trial results page, undated (read Nov 2, 2026) [11]. Points saved and dollar value are Crop Root Zone calculations at $0.73 a pound of N. "Pays at" is the highest of our three premiums (5, 6.5 or 8 cents) that the saving covers. Bars scale points saved, 32.2 = ten blocks, with small values rounded up to one. Trials used 2 pounds of NBPT a ton of urea, so check the active content of any product you price.
The inhibitor cleared 8 cents in 7 trials, the 6.5-cent midpoint in 9 and 5 cents in 11. The median trial saved 8.9 points, almost exactly the midpoint break-even. So in one of the better-documented high-loss settings we found, the product was close to a fair bet on nitrogen alone, averaging 18.1% loss untreated and 6.5% treated [11].
Other measurements bracket that. A published meta-analysis put cumulative loss at 31.0% for urea and 14.8% with NBPT, a saving of 16.2 points, but that pool mixes many methods and climates (Agronomy Journal, 2017, abstract as indexed) [12]. Three Brazilian maize sites averaged 39% for urea and 16% to 19% for Anvol and Limus, in a Nutrien-funded study at V3 topdress (Guelfi et al., Scientific Reports, 2023) [13]. Oregon State found 10.25 pounds saved per 100 pounds of N on burned Kentucky bluegrass in the Columbia Basin (Holcomb and Horneck, Oregon State University, undated) [14].
Then there is the low end. Wisconsin's guidance says up to 20% can be lost without incorporation (Laboski, 2006) [15]. Kansas State says losses from cool-season wheat topdress are low, and unlikely to exceed 20% even in ideal conditions, while also noting a 2020 Kansas study that found significant cold-weather loss (Ruiz Diaz, Kansas State University, Mar 14, 2022) [16]. Koch, which sells Agrotain and funded the work, reports losses of "up to 30 percent" from untreated urea in Kansas State trials averaging 37°F, against an average of 2.7% with Agrotain (Koch Agronomic Services, Dec 21, 2023) [17]. We could not check that against the university's data.
Ground Truth: Cold is not the protection most agronomy shorthand implies. Montana's largest losses came on Feb 26, Nov 14 and late-March applications, and Kansas's cold-weather work points the same way. The soil was slow, but the urea stayed on the surface for weeks, and that exposure is what the inhibitor buys time against. A grower spreading urea on frozen ground in the dry-winter Plains should budget for double-digit loss until enough water has moved it in. We would not carry Montana's size to wetter ground without local data.
3. What the yield trials show
What's new: Conserved nitrogen and harvested bushels are separate results, and the gap between them is the main finding in this literature. Montana also measured what the saved nitrogen did for wheat.
Evidence:
| Trial | Setting | Yield result, inhibitor vs. urea | Read |
|---|---|---|---|
| Montana State, 2011–14 | Winter wheat, 90 lb N, 3 timings, 3 seasons | Mean +0.9 bu; 1 of 9 significant (+6.7 bu, late fall, 2011–12) | Protein up about 0.8 units |
| Arkansas, 2007–08 | Soft red winter wheat, 75 lb N | +3.6 bu in 2007, mainly late March; 2008 source effect varied by date | Authors: little benefit in Arkansas |
| Oklahoma State thesis | Winter wheat topdress | Super U (NBPT plus DCD) +4% over broadcast urea; drilling urea +5.5% | Only 1 of 21 drilling contrasts significant |
| Tennessee, 2013–15 | No-till corn, broadcast at first leaf, 110–150 lb N | +1 to +45 bu, mean +27; 5 of 6 significant | Measured ammonia loss far too small to explain it |
| Hendrickson summary, 78 sites, 17 states | Corn, surface urea, five years | +4.3 bu at all sites; +6.6 at 59 sites with significant loss | At least 10 bu lower at 7% of sites |
| Purdue, 1989 | Corn, four locations | 130 vs. 143 bu | Best without timely rain |
| Wisconsin, Hancock, 1988 | Irrigated sand corn | +8 bu at 70 lb N; −2 bu at 140 lb N | Rate above need erased it |
| Iowa State, 2013–14 | Corn, two research farms | No agronomic benefit | Rain came soon after application |
| North Carolina, Virginia | Corn | No yield improvement | N in ear leaves rose, grain did not |
Sources: [11][18][19][7][15][20][21][22]. Conversions to bu/acre and the Montana mean are Crop Root Zone's, at 67.25 kg/ha per bushel for wheat and 62.77 for corn. Tennessee's yields are means over two N rates. The Oklahoma State result was read through a search index; the record returned a 404 on Nov 2, 2026. We read Hendrickson and Hancock through Laboski's 2006 summary, not the originals.
Three of these need a closer read.
Tennessee is the outlier. Urea yields of 126 to 223 bushels became 159 to 224 with NBPT [7]. Five of six site-years separated. But the authors' chambers recorded only 0.5 to 5.5 pounds of N an acre lost from urea over 20 days, by our conversion. Those chambers excluded rain and wind, and the authors suspect they understated field loss. Even so, 33 bushels of corn on about 5 pounds of measured ammonia does not add up, and the paper does not reconcile it. At five of six site-years, ammonium nitrate still beat treated urea by 18 to 38 bushels, so something beyond this inhibitor's reach was also limiting those plots. We would treat the size of the Tennessee response as a ceiling, not a forecast.
The frequency math is more useful. Wisconsin's Larry Bundy estimated that benefits occur 30% to 40% of the time, with yield harm 5% to 10% of the time [15]. At a 2.2-bushel cost on 150 pounds of N, a program bought every year needs about 5.5 to 7.3 bushels in the years it responds. Hendrickson's 6.6 at sites with significant loss falls inside that range. Those trials are decades old, and yield levels have risen since, so a percentage gain would now be worth more bushels. A 2019 paper restates the same work as 3.8%, which is 7.6 bushels on a 200-bushel crop [7]. That cuts in the product's favor, and we would not lean on it far, since the more recent Iowa, North Carolina and Virginia results are near zero.
Wheat's return is in the protein. Montana's mean yield gain of 0.9 bushels sits inside the 0.8- to 1.2-bushel break-even at 90 pounds, and only one comparison was significant [11]. Protein moved more consistently, by about 0.8 units on Montana's reported average. With no yield credit at all, a 54-bushel crop and a $5.85 treatment need about 14 cents a bushel per point of protein, by our calculation. We did not find a dated public protein schedule to price against, so check your elevator's. That test applies to hard wheat with a protein market. Arkansas's soft red fields do not have that second payer, and the authors there saw low loss anyway [18].
Ground Truth: On wheat, the application date beat the inhibitor in Montana's own numbers. Spring application raised protein to 12.3% from about 10.7% and N recovery to 37.4% from 26% to 28%, roughly twice the protein effect Agrotain delivered [11]. Spring is not immunity, since the late-March 2009 Havre trials lost 36% and 40% untreated. But a grower choosing between moving the date and adding the chemical should move the date first, and then watch the forecast. Treat the winter pass only when the logistics force it, such as ground that will not carry a spreader later or application capacity that will not be there in March.
4. The field test: days to a half-inch of rain
What's new: The inhibitor buys time. It does not move nitrogen into the soil. Water or tillage does that, and the sources agree on the water. Kansas State says half an inch, ideally within two to three days [16]. Wisconsin says 0.5 to 0.75 inches [15]. Montana finds that a single rain over 0.7 inches can hold loss under 10%, and that light scattered rain under 0.2 inches on a damp cold surface produced its worst results, above 20% [10].
Evidence: Oregon's mast data show why small rain is the danger. Urea's largest daily losses followed rain on October 3, 4 and 5, when granules that had still been visible dissolved without moving deep. The treated urea's daily loss did not respond to that rain [14]. Snowpack is its own hazard: Montana measured 24% and 21% in two trials on packs under 6 inches [11]. How long protection lasts is less well defined. Sources give 3 to 14 days, 7 to 21 days and 14 days at a 5-quart rate, depending on conditions and on who is writing [13][14][15]. We would plan on about a week and treat anything longer as a bonus.
| Field situation at spreading | Our read | Why |
|---|---|---|
| Dry surface, half-inch rain very likely within 2 days | Skip | Water does the job for free [16] |
| Irrigated, half-inch available within 2 days | Skip | Same; Iowa's rain-driven and Brazil's irrigated null results fit [21][24] |
| Injected, knifed, drilled or tilled in | Skip | The product targets surface exposure |
| N rate above crop need | Skip | Hancock's 140-pound result; Arlington saw no gain either [15] |
| Coarse sand | Discount it | Meta-analysis found limited yield gains on coarse soils [12] |
| No-till corn, broadcast, forecast dry or showery | Buy | Largest response set in the table [7] |
| Moist, damp or thawing surface, light showers forecast | Buy, or wait | Montana's worst pattern [10] |
| Frozen ground or thin snow | Wait if possible; buy if not | November through March applications ran above 10% in Montana's summary, and thin snow 21% to 24% [10][11] |
Source: Crop Root Zone judgment from the cited trials. These are decision rules drawn from them, not trial outputs.
Treated urea versus UAN is a narrower call than it looks. Half the nitrogen in UAN is urea, and Hendrickson's gain from treating it was 1.6 bushels against urea's 4.3, which fits with less of it being exposed [15]. At the current sheet, UAN32 costs less than treated urea and allows one-pass herbicide blending, while treated urea carries the logistics of a dry product.
5. Which inhibitor, and what to ask the retailer
What's new: The market has moved past plain NBPT. Limus combines NBPT and NPPT, and Anvol adds Duromide to NBPT [13]. Koch describes Agrotain as the predecessor to Anvol, introduced in 2019 [17].
Evidence: We found no independent North American field comparison across these products. The field numbers closest to hand are Brazilian maize, where Anvol and Limus averaged 16% and 19% loss against 39% for urea, and where the authors say the losses did not directly affect agronomic results, at sites with high yields even without N [13]. A separate Brazilian study reports Duromide plus NBPT cutting losses by up to 33% from NBPT alone on subtropical soil (Revista Brasileira de Ciência do Solo, as indexed) [23]. Koch's US comparisons were run under its own funding agreements, and the universities involved do not endorse the product [17]. Those results deserve a look but do not settle the question. The practical comparison at the counter is price against forecast length. A longer-lasting product is worth extra only on fields where the wait for rain is likely to outlast plain NBPT.
Storage matters more than most quotes acknowledge. In that Brazilian work, the NBPT half-life on stored urea at 25°C and 76% humidity ranged from 2.7 to 4.7 in the units the paper reports, and its text is inconsistent on whether those are months or days [13]. Either way the active ingredient declines on the pile. So treat close to use, and ask when it was treated. Do not assume a bin of last spring's treated urea still carries its label dose. More active is not automatically better either: the meta-analysis found limited yield gains above 1,060 mg/kg of NBPT, and the Tennessee authors found higher concentrations added little [12][7].
Ground Truth: Ask three questions before signing for treated urea this season. What is the treatment premium as its own line, in cents per pound of N? Divide it by your urea price and you have the points it must save. When was it treated? What is the seven-day forecast for the day it goes on? At 73-cent urea we would buy it for dry-forecast no-till corn and for any winter pass we cannot move. We would leave it off when a half-inch rain is close, when the urea goes in the ground, and on spring passes to wheat when the forecast does the work. A 6.5-cent treatment bought on every ton failed to pay back its nitrogen in 8 of Montana's 17 trials, and those were run under the kind of exposure the product was built for.
References
- DTN/Progressive Farmer, "DTN Retail Fertilizer Trends: Fertilizer Prices Continue Climb," Oct 28, 2026 (survey week Oct 19–23, 2026) — https://www.dtnpf.com/agriculture/web/ag/crops/article/2026/10/28/fertilizer-prices-continue-climb-6
- Crop Root Zone, TRZ-0234, "Polymer-Coated Urea Needs Six Bushels to Pay This Fall. The Trials Find Them on Claypan and Sand, and Roughly One Year in Four Anywhere Else," Sep 28, 2026.
- Crop Root Zone, TRZ-0034, "Polymer-Coated Urea's Second Look: It Pays One Year in Four — and a Blend Beats Buying It Straight," Jul 24, 2026.
- Crop Root Zone, TRZ-0075, "A Nitrogen Stabilizer Costs 8 Cents a Pound. Anhydrous Nitrogen Costs 59. Do That Division," Aug 7, 2026.
- AgCare Products, "Nitrogen Stabilizer 2.5 Gal" (Product 5001, Nitrain), $224.00, listed as sold out; undated listing read Nov 2, 2026 — https://agcareproducts.com/products/5001-nitrogen-stabilizer-nitrain-agr
- Specimen labels for Protek-N 267, RZT N-Stall and FBN Nitrogen Stabilizer, read from the search index on Nov 2, 2026 — https://www.fbn.com/api/store/market/documents/specimen-label/protek-n-267.pdf ; https://www.fbn.com/api/store/market/documents/specimen-label/rzt-n-stall.pdf ; https://www.fbn.com/api/store/market/documents/specimen-label/fbn-nitrogen-stabilizer.pdf
- Liu, S.; Wang, X.; Yin, X.; Savoy, H.J.; McClure, A.; Essington, M.E., "Ammonia Volatilization Loss and Corn Nitrogen Nutrition and Productivity with Efficiency Enhanced UAN and Urea under No-tillage," Scientific Reports 9:6610, 2019 (includes the budget from Zhou et al. and the restatement of Hendrickson as 3.8%) — https://pmc.ncbi.nlm.nih.gov/articles/PMC6488641/
- Ferguson, R.B.; Shapiro, C.A., "Protecting Your Nitrogen Fertilizer Investment," University of Nebraska CropWatch, Mar 7, 2008 — https://cropwatch.unl.edu/protecting-your-nitrogen-fertilizer-investment
- Brownfield Ag News, "Closing Grain and Livestock Futures: October 30, 2026," Oct 30, 2026 — https://brownfieldagnews.com/news/closing-grain-and-livestock-futures-october-30-2026/
- Engel, R.; Jones, C., "Ammonia Loss from Surface-applied Urea to Cold Soils: A Second Look," Fertilizer Facts No. 70, Montana State University, May 2021 — https://landresources.montana.edu/fertilizerfacts/html/FF70.html
- Engel, R., "Ammonia Volatility from Urea," trial results, Montana State University, undated, read Nov 2, 2026. A 2013 abstract from the same group reports closely similar trial values and a late-fall yield gain (Engel, Jones and Wallander, ASA-CSSA-SSSA Annual Meetings, Nov 5, 2013) — https://landresources.montana.edu/ureavolatilization/results.html ; https://scisoc.confex.com/crops/2013am/webprogram/Paper77307.html
- "Urease Inhibitor NBPT on Ammonia Volatilization and Crop Productivity: A Meta-Analysis," Agronomy Journal 109(1):1–13, 2017 (abstract read through a search index; we did not open the full paper) — https://peeref.com/works/45014477
- Guelfi, D., et al., "Urease inhibitors technologies as strategy to mitigate agricultural ammonia emissions and enhance the use efficiency of urea-based fertilizers," Scientific Reports, Dec 2023 (funded by Nutrien) — https://pmc.ncbi.nlm.nih.gov/articles/PMC10733344/
- Holcomb, J.C., III; Horneck, D.A., "Effect of Agrotain Treated Urea on Ammonia Volatilization in Kentucky Bluegrass in the Columbia Basin Oregon," Oregon State University, Special Report 10-02 as indicated by the file name, undated — https://cropandsoil.oregonstate.edu/sites/agscid7/files/crop-soil/Report17-SR10-02-HolcombandHorneck.pdf
- Laboski, C., "Does It Pay to Use Nitrification and Urease Inhibitors?," Proc. Wisconsin Fertilizer, Aglime & Pest Management Conference, Vol. 45, 2006 (summarizing Hendrickson, J. Prod. Agric. 5:131–137, 1992, and Bundy, 1992) — https://extension.soils.wisc.edu/wp-content/uploads/sites/68/2016/07/Laboski_inhibitors-2006-1.pdf
- Ruiz Diaz, D., "Management Practices Affecting Nitrogen Loss from Urea," Kansas State University, republished by Farms.com, Mar 14, 2022 — https://farms.com/news/management-practices-affecting-nitrogen-loss-from-urea-177443.aspx
- Koch Agronomic Services, "Study Shows Threat of Cold-Weather Volatilization Without Urease Inhibitor," Dec 21, 2023 (Kansas State data under a financial support agreement with Koch; manufacturer source), and Koch's "Duromide Drives Extended Nitrogen Protection," undated, read from the search index — https://kochagronomicservices.com/knowledge-center/study-shows-threat-of-cold-weather-volatilization-without-ur ; https://kochagronomicservices.com/knowledge-center/duromide-drives-extended-nitrogen-protection
- Slaton, N., et al., "The Influence of Nitrogen Application Time and a Urease Inhibitor on Winter Wheat Yield," University of Arkansas, ASA-CSSA-SSSA Annual Meetings, Nov 3, 2009 — https://scisoc.confex.com/crops/2009am/webprogram/Paper54993.html
- "Winter Wheat Response to Topdress Nitrogen Application Method and Source," Oklahoma State University thesis (read from the search index; the record returned a 404 on Nov 2, 2026) — https://shareok.org/handle/11244/320966
- Brouder, S., article in Purdue Pest Management & Crop Production Newsletter, Apr 5, 1996 (1989 trials) — https://www.agry.purdue.edu/ext/corn/news/articles.96/sb9602.htm
- Barker, D.W.; Sawyer, J.E., "Evaluation of Nitrogen Fertilizer Additives for Enhanced Efficiency in Corn on Iowa Soils," Crop, Forage & Turfgrass Management, 2017 (as reported in TRZ-0234) — https://doi.org/10.2134/cftm2017.02.0010
- Frame, W.H., "Ammonia Volatilization, Urea Hydrolysis, and Urease Inhibition with the Application of Granular Urea in Agroecosystems," PhD dissertation, Virginia Tech, Mar 22, 2012; the North Carolina and Virginia yield result as cited in [7] — https://vtechworks.lib.vt.edu/server/api/core/bitstreams/86647714-b16b-4c8f-b934-6cf7f28a1f84/content
- "Duromide increase NBPT efficiency in reducing ammonia volatilization loss from urea," Revista Brasileira de Ciência do Solo (read from the search index on Nov 2, 2026) — https://scielo.br/j/rbcs/a/jGyMQy6d3prmMsWKJNYSz6D/?lang=en
- "Urease inhibitor and irrigation management to mitigate ammonia volatilization from urea in no-till corn," Brazil (read from the search index on Nov 2, 2026) — https://lume.ufrgs.br/handle/10183/185917
Disclosures
Crop Root Zone is an independent publication. Nothing here is investment advice. Market calls, where included, reflect the editors' own read and are not a recommendation to buy or sell any security.
A Gallon of Real Liquid Lime Holds 9.5 Pounds of Neutralizing Value, Worth 26 Cents at Delivered Ag Lime Prices. It Retails Near $29. In 16 Kentucky Fields, the Calcium Chloride Kind Moved pH No More Than Doing Nothing.
Liquid lime costs about $3 per pound of effective calcium carbonate at the retail price we could find, against 2.7 cents for ag lime delivered and spread and 11 to 21 cents for pellets. Calcium chloride carries no neutralizing value at any price. A 5-gallon rate of the true suspension holds what 84 pounds of ag lime holds, about $1.29 worth, and offsets the acidity from 13 pounds of nitrogen. At these prices a low-rate program has to return 10 to 34 bushels of corn an acre, and we found no independent trial showing it moves pH.
In October 2025, a Morgan County, Tennessee, pasture tested at pH 5.99 with a recommendation for 1.5 tons of lime an acre. The producer was advised to use a liquid lime product instead. By February 2026 the same pasture tested 5.87 (Pedreira, University of Tennessee, Apr 30, 2026) [1]. Four months and one soil test prove little on their own. But university specialists are still fielding this question: North Dakota State reports that "liquid lime" products are being heavily marketed into its acid soils in the west, and Kansas State reports many questions about liquid calcium (NCERA-103 state reports, 2024) [2]. The pitch has barely changed: 2 to 5 gallons an acre in place of a ton or more of limestone. Lime is bought by the pound of neutralizing value, and that test can be run on a gallon. We ran it and found about 9.5 pounds in the best-documented product that carries any, and none in the product Kentucky tested. Our earlier piece priced pelletized lime against ag lime on the same basis (TRZ-0257) [3]. This one extends that ledger to the liquids.
1. Two products share one name
What's new: "Liquid lime" and "liquid calcium" are used for two materials with different chemistry. One is finely ground limestone suspended in water. The other is a dissolved salt, usually calcium chloride. Texas A&M's Tony Provin wrote that most liquid calcium products are calcium chloride, a few are calcium nitrate, and that soluble calcium moves acidity off exchange sites without neutralizing it (ForageFax, Feb 20, 2026) [4]. Neutralization takes a carbonate, oxide or hydroxide. The calcium is incidental, and Kentucky's specialists say so directly: the ions associated with limestone have nothing to do with the reaction (Ritchey, Grove and Teutsch, University of Kentucky, Nov 2022) [5].
Evidence: A label gives everything needed for the calculation: pounds per gallon times calcium carbonate equivalent (CCE). North Carolina's state agronomists use the same arithmetic to set rates (NCDA&CS, Soil Fertility Note 18, as indexed) [6].
| Product, as labeled or described | lb/gal | CCE | Neutralizing value, lb/gal | Worth at 2.7¢/lb |
|---|---|---|---|---|
| Cal-Flo suspended limestone (Burnett Lime) | 14.8 | 64.17% | 9.5 | $0.26 |
| NCDA&CS worked example, suspension | 12.0 | 73% | 8.8 | $0.24 |
| CalOx pH | 15.66 | 73.3% | 11.5 | $0.31 |
| Kentucky rule of thumb: half lime, half water | not stated | not stated | under 5.7 | under $0.16 |
| Calcium chloride, 10% Ca (Kentucky-marketed product) | 11.07 | none | 0 | $0 |
| Calcium chloride, 12% Ca (Kugler KQ, Nebraska trial) | about 11.0 | none | 0 | $0 |
Sources: Burnett Lime Co. label [7]; NCDA&CS [6]; CalOx pH label as indexed by search [8]; McGrath and Ritchey, University of Kentucky, Apr 8, 2015 [9]; University of Nebraska–Lincoln On-Farm Research, 2016 [10]. Neutralizing value and dollar value are Crop Root Zone calculations, using the 2.7 cents a pound in Section 2. The Kentucky figure is our reading of "over 700 gallons" to supply 2 tons of 100% effective lime. The Kugler density is our conversion from its 1.32 specific gravity. Fineness is not discounted for the suspensions: Cal-Flo's label reports 100% passing a 200-mesh screen.
So a gallon of the best-documented true suspension holds about 9.5 pounds, and Cal-Flo's label makes the implication plain. Its North Carolina statement says 2,849 pounds of product equal 2,000 pounds of dry liming material [7]. At 14.8 pounds a gallon, that is 192 gallons a ton, or 10.4 pounds a gallon on the label's own basis. We use the lower 9.5 from its guaranteed CCE, and the difference does not change any conclusion here. The same label calls 2.5 to 5 gallons an acre "the accepted application rate," and its front panel says it is formulated for turf, ornamentals, greenhouses and fish ponds [7]. It says nothing about replacing a ton of field lime. That claim comes from elsewhere: a Sam Houston State poster quotes one provider's marketing that 2.5 gallons gives results similar to one ton of dry lime (Lane, Mills and Anderson, ASA meetings, 2013) [11]. Kentucky saw the same claim for 2 to 4 gallons of its calcium chloride product [5].
Ground Truth: The first question to a liquid-lime seller is not the price. Ask for the anion. If the label's calcium is "derived from calcium chloride" or nitrate, the lime calculation ends at zero and the product should be judged only as a calcium fertilizer. If it shows a carbonate and a CCE, multiply. A seller who cannot give pounds per gallon and CCE is asking you to buy lime without its analysis, and no buyer should accept that from a quarry either.
2. What a pound of neutralizing value costs
What's new: We found no 2026 farm-scale price sheet for liquid lime, so we used the public prices that exist and dated each one. Cal-Flo's 2.5-gallon jug shows at $51.99 to $108.99 in retail listings seen through search. DoMyOwn shows $71.52 each on a two-jug order [12][13]. Those listings are undated, and the sites would not open for us directly. Texas A&M agents paid $46.75 for 2.5 gallons of an unnamed liquid lime in September 2020, or $18.70 a gallon (Perkins et al., Texas A&M AgriLife, 2020) [14]. A Sam Houston State budget carried a similar product at $74 a hectare with application in 2013, about $30 an acre at about 3 gallons [11].
Evidence: Ag lime at Missouri's 2026 survey average of $30.58 a ton delivered and spread, and Iowa State's tested ag lime at 1,124 pounds of effective material a ton, works out to 2.7 cents a pound (University of Missouri Extension, Mar 2026; TRZ-0257) [15][3].
| Product and price basis | Price | Cents per lb neutralizing value | |
|---|---|---|---|
| Dry lime in the Sam Houston budget, with application, 2013 | $40/acre | 2.4 | █░░░░░░░░░ |
| Ag lime, delivered and spread, Missouri average, 2026 | $30.58/ton | 2.7 | █░░░░░░░░░ |
| Calcium silicate slag, delivered and spread | $75/ton* | 4.6 | █░░░░░░░░░ |
| Pelletized lime, public prices, before spreading | $188–$373/ton | 11–21 | █░░░░░░░░░ |
| Mojo Lime in the Sam Houston budget, with application, 2013 | $30/acre | 105* | ██░░░░░░░░ |
| Cal-Flo, low retail listing | $20.80/gal | 219 | █████░░░░░ |
| Cal-Flo, DoMyOwn two-jug price | $28.61/gal | 301 | ███████░░░ |
| Cal-Flo, high retail listing | $43.60/gal | 459 | ██████████ |
| Calcium chloride at $30 a gallon | $30/gal | no neutralizing value |
Source: Crop Root Zone calculation from [3][7][11][12][13][15][23]. Bars scale cents per pound, 459 = ten blocks, with the dry products rounded up to one block. The slag row divides TRZ-0289's estimated $75 a ton by 1,620 lb CCE a ton, with no fineness discount [23]. The Mojo row assumes Cal-Flo's 14.8 lb/gal, because Mojo's published analysis is nearly identical but the poster gives no density. Retail jug prices are small-package prices, and a bulk buyer should pay less. *Estimate.
26 cents a gallon
What a gallon of Cal-Flo-grade liquid lime is worth when its 9.5 pounds of neutralizing value are priced at delivered-and-spread ag lime. The retail price we could find is about $29. (Crop Root Zone calculation from Burnett Lime label; University of Missouri Extension, Mar 2026)
At $28.61 a gallon, the gap to ag lime is 111 to 1. Replacing the 1,124 pounds of effective material in a ton of ag lime takes 118 gallons, or $3,386. A bulk price would shrink that figure a great deal without changing the conclusion. The cheapest figure on the table, the 2013 Sam Houston budget, is still about 44 times the dry lime in the same budget. Fineness earns some credit, since Iowa's score undervalued how fast fine material moves pH in the first year. TRZ-0257 found that correction closes the pellet gap by about a fifth [3]. Applied here, the 111-to-1 gap is still about 90 to 1, by our estimate.
That is the price gap. The dose problem is separate. Five gallons of Cal-Flo is 47 pounds of neutralizing value, about the content of 54 pounds of Iowa State's tested pellets and $1.29 of ag lime. Iowa State's 100-pound pellet rate, which carried about 89 pounds, lifted average pH from 5.53 to 5.60 [3]. The liquid rate holds roughly half of that. The "one ton" claim at 2.5 gallons overstates the content 47 times against Iowa's tested ag lime.
The nitrogen arithmetic is less forgiving still. Kansas State's table puts the acidity from urea, UAN or anhydrous at 3.6 pounds of effective calcium carbonate per pound of N (Kansas State University, via Strip-Till Farmer, Feb 13, 2013) [16]. On that factor, 47 pounds neutralizes what 13 pounds of N generates. A 180-pound corn program generates 648 pounds. Other extension tables run lower: Cornell's course uses 5.4 for ammonium sulfate where Kansas uses 7.2 [17]. Even at half the Kansas factor, 5 gallons a year covers about 26 pounds of N.
Ground Truth: A low-rate liquid cannot be a slow route to the same place. At 47 pounds a year, delivering one ton of tested ag lime's content takes 24 years, and a corn rotation would out-acidify the program in the first season. It is not maintenance either. Budget any such program as a surface treatment and leave the lime requirement on the soil test exactly where it was.
3. What the independent trials measured
What's new: The strongest trial is still Kentucky's. Field and lab work started in summer 2021 and ran about a year, at 16 field sites with three replications and in a lab incubation on a Crider silt loam starting at pH 5.2 [5]. Kentucky's sources disagree on the dates: the authors' November 2022 newsletter says summer 2021 for about a year, while the 2024 NCERA-103 state report says 2022 to 2023, and we use the newsletter because it is the trial write-up and its date fits its own publication [5][2]. The treatments were an untreated check, a calcium chloride product at 5 gallons an acre, and pelletized and ag lime each at 2 tons of 100% effective lime. The liquid rate was above the 2 to 4 gallons in the product's claims [5].
Evidence: The liquid calcium plots tracked the untreated plots at every sampling.
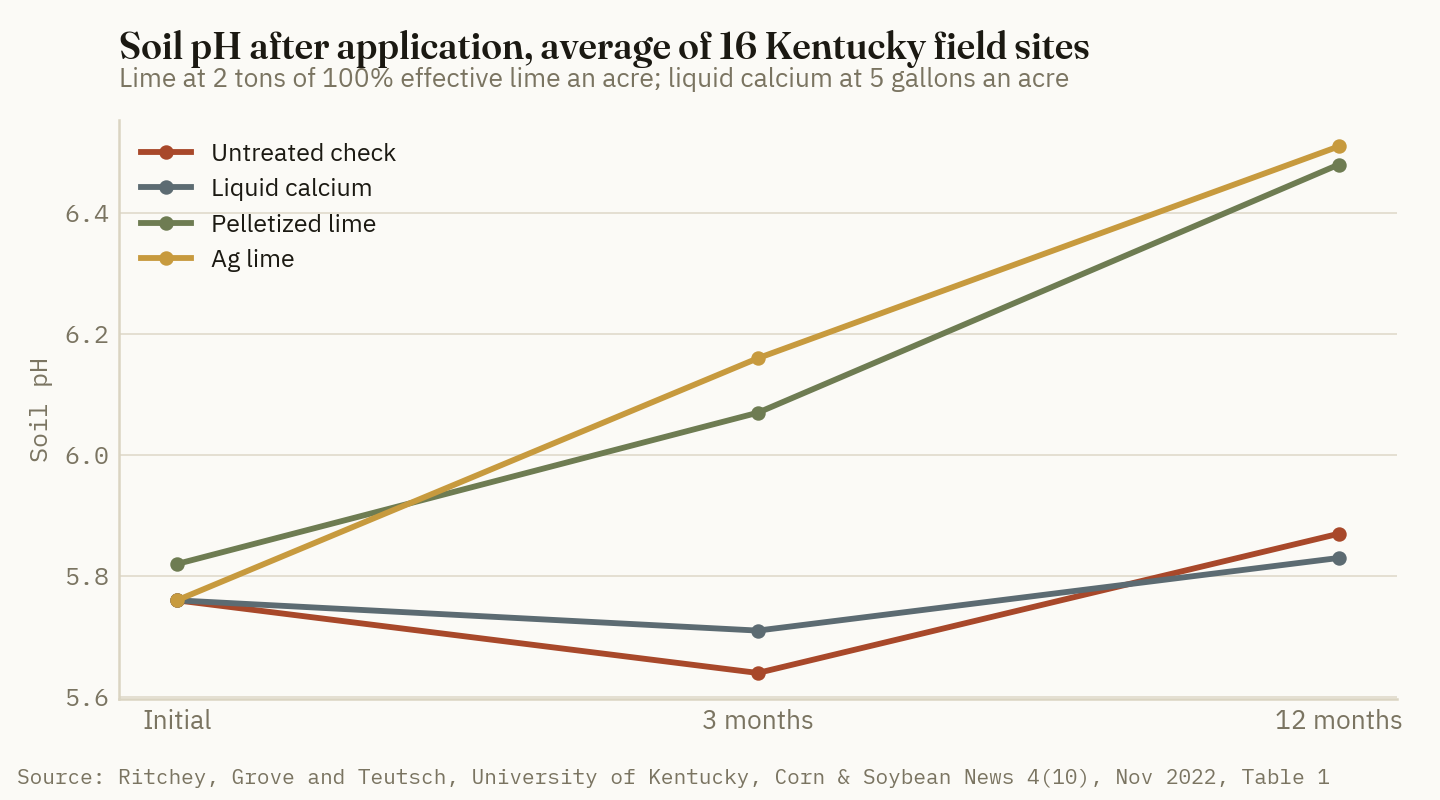
The authors attribute the small rise in check and liquid plots to the environment and seasonal variation, not to treatment. They add that limestone's full reaction takes 2 to 3 years, so the 12-month gain understates it [5]. In the lab, at 12 months, liquid calcium sat at 4.98, the check at 5.10, pellets at 6.26 and ag lime at 6.20. The building housing that incubation was destroyed by a tornado before the 6-month sample, and moisture control lapsed afterward, which the authors disclose [5].
| Trial | Design | Liquid product and rate | Result | Limits |
|---|---|---|---|---|
| Kentucky, 2021–22 | 16 sites, 3 reps, plus lab | Calcium chloride, 5 gal/acre | +0.08 pH vs. check +0.11, pellets +0.67, ag lime +0.77 at 12 months | pH only; no yield reported |
| Texas A&M, East Texas, 2019–20 | Strip demo, not replicated | Unnamed liquid lime, 2.5 gal/acre | Flat at 5.2 for a year; 1 ton ag lime 6.2; 2 tons 6.4; 400 lb pellets 5.5 | One site; materials donated |
| Sam Houston State, 2013 | 1 site, 3 reps, about 8 weeks | Two 64% CCE suspensions, about 3 gal/acre | No difference among control, dry lime and liquids | Short window; dry lime also showed nothing |
| Oklahoma State, first year, reported 2019 | 2 bermudagrass sites near Stillwater | Liquid calcium, rate not seen | "No statistical differences" in pH against traditional liming agents | Article paywalled; numbers not read |
| Nebraska on-farm, 2016 | Soybean, 4 reps, not randomized | Calcium chloride, 1 gal/acre | 68 vs. 66 bu/acre; authors: "no conclusions can be drawn" | Field was pH 6.3, not acid |
| Washington State, 2015, via NDSU | Surface-applied, depths to 3 in. | Fluid lime at ½ and 2 tons/acre | Top half-inch 6.0 and 6.6 vs. check 5.2; no change below about 1.5 in. | Conference slide; not low-rate |
Sources: Ritchey, Grove and Teutsch, Nov 2022 [5]; Perkins et al., 2020 [14]; Lane, Mills and Anderson, 2013 [11]; Crummett, No-Till Farmer, Nov 26, 2019 [18]; University of Nebraska–Lincoln, 2016 [10]; Franzen, NDSU, Feb 12, 2019 [19].
Two entries deserve a closer read. Sam Houston concluded that liquid is "cheaper and as effective" on a one-year lease [11]. The first part is arithmetic. The second rests on a test that ended about eight weeks after application, with about 7 inches of rain, in which a ton of dry lime also failed to separate from the control. The study did not show that the liquids work. It could not detect lime working at all, so its null says nothing about either product. Texas's ag lime plots read no change at one month and had moved by two, and Kentucky's had moved by three, so a longer sampling window was the obvious next step.
The Washington State row is the fair counterweight. Fluid lime does neutralize when enough of it is applied. Two tons an acre matched beet lime in the top half-inch [19]. North Carolina's example puts a ton-equivalent rate at 228 gallons an acre, and Kentucky's 2-ton figure at over 700 [6][9]. Those are truckload rates, in a different category from a jug product. A separate Texas A&M note warns that buyers face water-hauling costs and under-liming risk from spread rate (Corriher-Olson, ForageFax, Feb 17, 2023) [20].
We found no replicated North American trial that measured corn, soybean or forage yield from a low-rate liquid on acid soil. Kansas State's David Hallauer says he could not locate the university studies one product's advertising refers to (Kansas State University, Nov 19, 2024) [21]. That absence is an evidence gap and should be read as one.
Ground Truth: Kentucky tested calcium chloride, and suspension sellers will say correctly that it was not their product. But the suspension's own numbers make the same prediction: 47 pounds of effective material sits below the rate at which pellets barely register. Sellers holding a replicated pH result at 2.5 to 5 gallons should publish it. We could not find one. Until then, the burden of proof is theirs, and a university's silence on your particular brand is not a finding in its favor.
4. The break-even
What's new: Nothing in the agronomy. This section prices the bushels at Friday's closes: December corn at $4.4775 and November soybeans at $12.2225 (Brownfield, Oct 30, 2026) [22].
Evidence: The liquid rows are annual if the program is repeated. Cal-Flo's label calls for reapplying every 8 to 12 weeks for prolonged maintenance [7], and Sam Houston's budget assumed one application a year against three years from dry lime [11].
| Program, one acre (CRZ calculation) | Cost | Corn break-even, bu | Soybean break-even, bu | Neutralizing value, lb |
|---|---|---|---|---|
| Ag lime, 1 ton delivered and spread | $30.58 | 6.8 | 2.5 | 1,124 |
| Pellets, 200 lb from a tote, spread | $40.65 | 9.1 | 3.3 | 177 |
| Liquid lime, 2.5 gal at the Texas 2020 price | $46.75 | 10.4 | 3.8 | about 24* |
| Calcium chloride, 2 gal at $30 | $60.00 | 13.4 | 4.9 | 0 |
| Cal-Flo, 2.5 gal at $28.61 | $71.52 | 16.0 | 5.9 | 24 |
| Calcium chloride, 4 gal at $30 | $120.00 | 26.8 | 9.8 | 0 |
| Cal-Flo, 5 gal at $28.61 | $143.04 | 31.9 | 11.7 | 47 |
| Calcium chloride, 5 gal at $30 (Kentucky trial rate) | $150.00 | 33.5 | 12.3 | 0 |
Sources: Crop Root Zone calculation from futures [22]; ag lime [15]; pellets [3]; Texas price [14]; Cal-Flo price and label [7][13]; Kentucky's approximately $30 a gallon, as stated in a University of Kentucky county newsletter seen through search [24]. Liquid rows exclude application; the ag lime and pellet figures include spreading. *Assumes Cal-Flo's analysis; the Texas product was not identified.
The Kentucky write-up framed it as about $30 an acre for ag lime, $400 to $600 for pelletized lime, and $60 to $120 for liquid calcium at the recommended 2 to 4 gallons. That ag lime price assumed roughly $15 a ton in western Kentucky, before a separate delivery fee, and pellets at $200 to $300 a ton [24]. Pricing the same job by what it delivers changes the order. Ag lime's $30.58 is the only row in the table with a measured return. In Iowa, a 1-ton CCE rate added about 12 bushels of corn at the three responsive sites of six, and 6.2 bushels of soybean the following year [3]. Against a 6.8-bushel break-even, that clears on the responsive half of those sites.
Now invert the question and ask what a liquid gallon could cost.
| To match, per lb of neutralizing value | Cal-Flo grade, 9.5 lb/gal | NCDA&CS example, 8.8 lb/gal | CalOx pH, 11.5 lb/gal |
|---|---|---|---|
| Ag lime at 2.7¢, delivered and spread | $0.26/gal | $0.24/gal | $0.31/gal |
| Pelletized at 11¢, before spreading | $1.04/gal | $0.96/gal | $1.26/gal |
| Pelletized at 21¢, before spreading | $1.99/gal | $1.84/gal | $2.41/gal |
Source: Crop Root Zone calculation from Sections 1 and 2. Application is excluded on both sides.
5. Where a liquid can still pay, and what to ask
What's new: Kentucky's 2024 state report says most of those interested are smaller producers who cannot get, or do not want, a lime truck on limited areas. It gives a conservative estimate of 20 people a year who ask and then decide against the product, on over 1,000 acres [2]. That is the real market, and it has a real problem. Pricing it honestly takes the options in order.
Evidence:
A few acres with no truck access. Pellets through a farm spinner are the alternative. A ton of ag lime's 1,124 pounds of effective material costs about $206 from a $325 tote of pellets, against $3,386 at the Cal-Flo jug price, by our calculation [3][13]. Bagged and awkward beats 16 times the cost.
Pre-seeding on no-till, where the top inch is the problem. This is the strongest agronomic case for a fluid, and the Washington State data support the placement [19]. It takes tons, or at least half a ton, not gallons. Ask for a price per ton of CCE and compare it with the table above.
Turf, greenhouse and small plantings. This is where Cal-Flo's label aims the product [7]. On a few thousand square feet, $29 a gallon is not the deciding number, and handling, dust and speed can be. It has no bearing on a row-crop budget.
A genuine calcium need. Provin's case is narrow: a soil test showing a calcium need where pH does not call for lime, which he says is uncommon in Texas and mainly peanuts on very sandy neutral soils [4]. Even then the liquid has to compete on price per pound of calcium.
| Calcium source | Price basis | lb Ca per unit | $/lb Ca |
|---|---|---|---|
| Ag lime, assumed pure calcitic | $30.58/ton, delivered and spread | 800 | 0.04 |
| Gypsum | $140–$195/ton, gate | 400 | 0.35–0.49 |
| Calcium chloride, 12% Ca (Nebraska, 2016) | $5/gal, implied | 1.32 | 3.78 |
| Calcium chloride, 10% Ca (Kentucky) | about $30/gal | 1.11 | 27.10 |
Source: Crop Root Zone calculation from [9][10][15][24][25]. Nebraska's $5 is the product cost per acre at its 1-gallon rate. Pure calcitic lime is the Kentucky authors' assumption; most lime carries less.
Kentucky's 2 to 5 gallons supplies 2.2 to 5.5 pounds of calcium an acre [9]. Penn State's Charles White puts typical exchangeable calcium in a Pennsylvania plow layer at 2,600 pounds an acre (Penn State Extension, as indexed by search) [26]. The Nebraska and Kentucky rows are the same chemistry at a sixfold price difference, though years and suppliers differ. Our gypsum piece covers that product's real supply and sulfur case (TRZ-0168) [25], and our slag piece covers a by-product that does carry a liming value, 81% CCE in the LSU analysis (TRZ-0289) [23].
Ground Truth: Three numbers settle a liquid-lime quote at the kitchen table: pounds per gallon, CCE, and price per gallon. Multiply the first two, divide the third by the result, and set that beside your quarry's cost per effective pound. Above about 26 cents a gallon, it loses to delivered ag lime, and above about $2 it loses to retail pellets. For a grower whose soil test calls for lime this fall, we would buy the ton, or the pellets if no truck will come. On calcium chloride we would spend nothing for pH. On a suspension at low rates we would run an untreated strip beside it and pull a soil sample at 12 months, so the next decision rests on a pH reading from that field and not on a brochure.
References
- Pedreira, B., "Forage Management: Liquid Lime vs. Ag Lime — The Soil Test Tells the Story," UT Beef & Forage Center, University of Tennessee, Apr 30, 2026 — https://utbeef.tennessee.edu/forage-management-liquid-lime-vs-ag-lime-the-soil-test-tells-the-story/
- NCERA-103, "State Reports — 2024" (Kentucky, North Dakota and Kansas State entries), file dated Feb 11, 2025 — https://nimss.org/storage/11439/2024-NCERA-103-State-Report.pdf
- Crop Root Zone, TRZ-0257, "Ag Lime Costs 2.7 Cents a Pound of Effective Neutralizing Material, Delivered and Spread. Pelletized Lime Costs 11 to 21. In Six Iowa Trials, 200 Pounds an Acre Moved pH by a Tenth," Oct 5, 2026 (reporting Mallarino and Haq, Iowa State University, 2017 and 2022).
- Provin, T., "Liquid Calcium: A substitute for what?," ForageFax, Texas A&M AgriLife Extension, Feb 20, 2026 (an earlier version was reposted by TSCRA on Oct 21, 2019) — https://foragefax.tamu.edu/liquid-calcium-a-substitute-for-what
- Ritchey, E.; Grove, J.; Teutsch, C., "Calcium or Lime? Which Raises Soil pH? A Follow-up," Corn & Soybean News 4(10), University of Kentucky Grain and Forage Center of Excellence, Nov 2022 — https://graincrops.mgcafe.uky.edu/files/cornsoynewsletter2022vol04_iss10_nov.pdf
- NCDA&CS Agronomic Services, Soil Fertility Note 18, "Lime," undated (worked example read from the search index; the document returned a 404 on Oct 31, 2026) — https://ncagr.gov/soil-fertility-note-18-lime/download
- Burnett Lime Company, Inc., "CAL-FLO Liquid Limestone" label, file dated May 12, 2015 — https://www.domyown.com//msds/Cal_Flo_Label.pdf
- BioSafe Systems, "CalOx pH" specimen label, 2012 (analysis read from the search index; the document returned a 404 on Oct 31, 2026) — https://hydrobuilder.com/media/pdf/specs/biosafe_CalOx_pH_V2_2012-2.5_Specimen_label_24.pdf
- McGrath, J.; Ritchey, E., "Buyer Beware When It Comes to Alternatives to Ag Lime," Grain Crops Update, University of Kentucky, Apr 8, 2015 — https://graincrops.blogspot.com/2015/04/buyer-beware-when-it-comes-to_8.html
- University of Nebraska–Lincoln Extension On-Farm Research, "Kugler KQ Calcium Chloride on Soybeans," Study 319039201601, Cuming County, 2016 — https://resultsfinder.unl.edu/sites/unl.edu.ianr.extension.on-farm-research.results-finder/files/pdf/0319039201601.pdf
- Lane, R.A.; Mills, F.D., Jr.; Anderson, M.J., "Effectiveness and Economic Feasibility of Two Liquid Alkalizers in a Bermudagrass Hay Pasture," Sam Houston State University, poster, ASA-CSSA-SSSA Annual Meetings, 2013 — https://scisoc.confex.com/crops/2013am/webprogram/Handout/Paper81436/ASA%20Poster-Mojo%20lime%20study%20final.pdf
- Retail listings for 2.5-gallon Cal-Flo: Toledo Indoor Garden $51.99; DIY Pest Control $95.50; Walmart $102.91 and $108.99. Undated, read from the search index on Oct 31, 2026; the pages could not be opened — https://toledoindoorgarden.com/products/burnett-2-5gal-cal-flo-liquid-lime ; https://diypestcontrol.com/cal-flo-limestone-liquid-lime-2-5-gallons
- DoMyOwn, "CAL FLO Liquid Limestone," 2.5-gallon listing, "Buy 2 or more: $71.52 each." Undated, read from the search index on Oct 31, 2026; the page returned a 403 — https://www.domyown.com/cal-flo-liquid-limestone-p-8744.html
- Perkins, C.; Gowin, S.; Davis, S.; Perkins, S., "2019-2020 Liming Material Study," Result Demonstration Report, Texas A&M AgriLife Extension (prices dated Sep 29, 2020) — https://agrilifeextension.tamu.edu/wp-content/uploads/2026/05/2020-Liming-Study.pdf
- Kientzy, D.; Brown, B., "Custom Rates for Farm Services in Missouri," University of Missouri Extension, G302, revised Mar 2026 ("Deliver and spread lime: including lime, per ton" average $30.58, as reported in TRZ-0257; the guide page confirms the revision, and we did not reopen the rate table) — https://extension.missouri.edu/publications/g302
- Kansas State University, table of effective calcium carbonate per pound of N, republished as "The Role of Nitrogen Fertilizer in Soil pH Levels," Strip-Till Farmer, Feb 13, 2013 — https://www.striptillfarmer.com/articles/439-the-role-of-nitrogen-fertilizer-in-soil-ph-levels
- Cornell University, Certified Crop Adviser soil fertility training, Competency Area 5, ammonium sulfate worked example (read from the search index; we did not open the page) — https://courses2.cit.cornell.edu/cca/soilFertilityCA/CA5/CA55.html
- Crummett, D., "Liquid Calcium Study Shows Little pH Effect," No-Till Farmer, Nov 26, 2019 (visible portion only; the remainder is behind a subscription wall) — https://www.no-tillfarmer.com/articles/9286-liquid-calcium-study-shows-little-ph-effect
- Franzen, D., "Taking the Burn Out of Acid Soils, Part 3: Lime Sources and Strategies to Remediate Stratified Acidity in No-till," NDSU, Advanced Crop Advisors Workshop, Feb 12, 2019 (slide titled "McFarland, Washington State 2015") — https://www.ag.ndsu.edu/carringtonrec/archive/documents/extensionoutreach/franzen-acaw-2019-taking-the-burn-out-of-acid-soils
- Corriher-Olson, V., "Liquid Lime," ForageFax, Texas A&M AgriLife Extension, Feb 17, 2023 — https://foragefax.tamu.edu/liquid-lime
- Hallauer, D., "Fertilizer Product Claims…," Meadowlark Extension District, K-State Research and Extension, Nov 19, 2024 — https://www.k-state.edu/news/meadowlark-agronomy/articles/2024/11/fertilizer-product-claims.html
- Brownfield Ag News, "Closing Grain and Livestock Futures: October 30, 2026," Oct 30, 2026 — https://brownfieldagnews.com/news/closing-grain-and-livestock-futures-october-30-2026/
- Crop Root Zone, TRZ-0289, "A Ton of Silicate Slag Has to Return 15 Bushels of Corn, or 6 Where the Field Needs Lime. Rice Needs 3 Hundredweight a Year. Florida Ran 28 Rice Trials to Set Its Rate. We Found One Replicated Corn Site, and It Showed No Yield Gain," Oct 16, 2026.
- University of Kentucky Cooperative Extension, Daviess County, "Liming Acidic Soils," file dated Jan 14, 2023, with similar text in a Pulaski County newsletter of Mar 2022 (price passage read from the search index; both direct links redirected away from the documents on Oct 31, 2026) — https://daviess.ca.uky.edu/sites/daviess.ca.uky.edu/files/1-14-23_Liming%20Acidic%20Soils.pdf
- Crop Root Zone, TRZ-0168, "Every Sulfur Fertilizer Is Priced Off One Tampa Contract. Gypsum Is the Exception, and That Is Getting Less True," Sep 7, 2026.
- White, C., "Beware of Liquid Calcium Products," Penn State Extension, undated (read from the search index; the link redirected to a listing page on Oct 31, 2026) — https://extension.psu.edu/beware-of-liquid-calcium-products
Disclosures
Crop Root Zone is an independent publication. Nothing here is investment advice. Market calls, where included, reflect the editors' own read and are not a recommendation to buy or sell any security.
A Corn Tissue Test Costs $31.65 and Needs a Quarter-Bushel an Acre to Pay. A Five-Set Sap Program Needs Three. The Lab Fee Is Not the Hard Part.
At 2026 public lab fees, a tissue program runs 79 cents to $2.37 an acre on a 40-acre zone and a season of sap analysis $11 to $14. The fee is small next to two problems: most of the published leaf-test calibration says the result arrives too late, or points the wrong way, to fix the crop it came from, and no North American land-grant trial we found has calibrated commercial leaf-sap numbers against yield in corn or soybeans. When a rescue responds in one field in 18, a sap program on soybeans has to find almost 20 bushels where it is right.
Ward Laboratories in Kearney, Nebraska, charges $31.65 for its routine plant analysis, a 12-nutrient panel from nitrogen to molybdenum, on the schedule it updated January 1, 2026 (Ward Laboratories, Jan 1, 2026) [1]. Its end-of-season cornstalk nitrate test is $15.15 [1]. With December corn at $4.56 at Friday's close (Brownfield, Oct 23, 2026) [2], one ear-leaf sample and one stalk sample on a 40-acre zone cost $1.17 an acre, or about a quarter of a bushel. A season of leaf-sap analysis on the same zone costs about ten times that. In a 2023–2025 Western SARE wheat project, the farmers paid $85 per paired old-leaf/new-leaf sap set, plus $25 for recommendations (Palouse Conservation District, 2026) [3]. Before a grower buys either program for 2027, the question is not the fee. It is whether the result predicts a yield response that a rescue application can still capture. For most nutrients, the university record says tissue tests do that poorly, and the record on sap is close to empty. This piece prices both programs, sets out what the calibration research found nutrient by nutrient, and works out how much yield response each program has to find to pay.
1. What a sample costs at public fee schedules
What's new: Several labs posted 2026 prices, which makes a real comparison possible. North Carolina's state lab raised its grower tissue fee to $10, effective March 2, 2026 (NCDA&CS, Mar 2026) [4]. Ward's schedule is dated January 1, 2026 [1]. The commercial sap market is less transparent. We found no public 2026 price list from NovaCropControl, its U.S. distributor Crop Health Laboratories, or Apical. Waypoint Analytical's current tissue submittal sheets list the packages but not the prices [5]. Midwest Laboratories and A&L Great Lakes do not post plant analysis prices that we could find.
Evidence: The tissue panels below differ slightly in what they include. The basic panel at each lab covers N, P, K, Ca, Mg, S and the main micronutrients. The two sap entries are the only sap prices we found in primary documents.
| Lab | Test | Price per sample | What it covers | Date / basis |
|---|---|---|---|---|
| NCDA&CS (NC growers) | Plant tissue analysis | $10.00 | Standard panel | Effective Mar 2, 2026; in-state grower rate |
| Penn State AASL | Plant analysis kit | $24.00 | 10 elements, with crop interpretation | Current page, © 2026 |
| Penn State AASL | Complete acid digestion | $24.00 | 13 elements, no interpretation | Current page, © 2026 |
| Ward Laboratories | P-2 Routine | $31.65 | 12 elements incl. Mo | Updated Jan 1, 2026 |
| Ward Laboratories | P-3 Super Complete | $41.55 | P-2 plus chloride | Updated Jan 1, 2026 |
| Colorado State | P1 Complete | $45.00 | 11 elements | Undated price page |
| Ward Laboratories | P-4 Cornstalk nitrate | $15.15 | End-of-season stalk nitrate | Updated Jan 1, 2026 |
| Cornell Soil Health Lab | Sap: 10 elements + nitrate/ammonium | $45.00 per leaf sample | B, Ca, Cu, K, Mg, Mn, Na, P, S, Zn; NO3, NH4 | External price, Apr 2023 form |
| Commercial sap lab (via Palouse CD) | Paired-leaf sap set + recommendation | $110.00 per set | Old and new leaf | Paid 2023–2025 |
| Tissue lab (via Palouse CD) | Tissue test | $30.00 | Not specified | Paid 2023–2025 |
Sources: Ward Laboratories pricing, updated Jan 1, 2026 [1]; NCDA&CS Agronomic Services grower fee schedule, effective Mar 2, 2026 [4]; Penn State Agricultural Analytical Services Laboratory, accessed Oct 29, 2026 [6]; Colorado State University Soil, Water and Plant Testing Laboratory, accessed Oct 29, 2026 [7]; Cornell Soil Health Laboratory, plant analyses submission form, Apr 2023 [8]; Palouse Conservation District, Western SARE OW23-386, Table 6 notes, 2026 [3]. The Cornell figure is our sum of its $20 elemental sap test and $25 nitrate/ammonium sap test at external prices. A set of old and new leaves would be two samples, or $90.
The spread in tissue prices is mostly about service, not chemistry. Penn State's $24 kit includes an interpretation for the crop named on the form, and its individual analyses at the same price do not [6]. Two other sap prices are in circulation, and we could not verify either from a primary document. An AgWired article indexed by search engines quotes Crop Health Laboratories, NovaCropControl's U.S. distributor, at $45 to $75 per set depending on volume. The page did not load for us (it failed a security-certificate check), and the article carries no visible date. A 2020 Grainews piece on a new Alberta sap lab quoted a consultant's estimate of about $40 per leaf sample, or about $80 a pair (Grainews, Feb 13, 2020) [9].
Ground Truth: The cost of a sap program is not set by the price per sample. It is set by how many times the program samples. A tissue sample is taken once, at a calibrated stage. A sap program, as it is sold, samples old and new leaves at each of several stages, and every set comes with an interpretation fee. A grower comparing quotes should ask for the price of a season, not of a sample, and ask what the recommendation fee buys.
2. What a season's program costs per acre
What's new: Nothing in the prices themselves. The per-acre cost depends on two choices growers seldom write down: how big a sampling zone is, and how many times it is sampled.
Evidence: Penn State asks for one composite of at least 10 plants, preferably 20 to 30, per field or sub-field (Penn State Extension, May 19, 2025) [10]. The cornstalk test is one composite of 15 stalk segments from no more than 10 acres (Waypoint Analytical, citing Iowa State, undated) [11]. That makes a strict stalk-test program four times as dense as our zone assumption. For sap, we used the sampling stages from a 2015 corn and soybean comparison run by Davidson Agronomics with Crop Health Labs. Corn there was sampled at V6, V12–V14, VT, R2 and R4, five timings, with old and new leaves at each (Davidson and Gregg, ASA-CSSA-SSSA, Nov 18, 2015) [12]. All four programs below assume a 40-acre zone, which is our assumption, and count lab fees only. Sampling labor and shipping are not included.
| Program, one 40-acre zone (CRZ calculation) | Season lab cost | $/acre | |
|---|---|---|---|
| Corn: one R1 ear leaf (Ward P-2) + one stalk nitrate (P-4) | $46.80 | $1.17 | █░░░░░░░░░ |
| Corn: tissue at V5–V6, V10–V12 and R1 (Ward P-2 ×3) | $94.95 | $2.37 | ██░░░░░░░░ |
| Sap: 5 paired sets at Cornell external prices | $450.00 | $11.25 | ████████░░ |
| Sap: 5 paired sets at the Palouse project price | $550.00 | $13.75 | ██████████ |
Sources: Crop Root Zone calculation from Ward Laboratories, Jan 1, 2026 [1]; Cornell Soil Health Laboratory, Apr 2023 [8]; Palouse CD/Western SARE OW23-386 [3]; sampling stages from Davidson and Gregg, 2015 [12]. On an 80-acre zone, every figure halves.
Set against current futures, those costs translate into the yield gain each program must produce on every acre it covers just to pay its own lab bill. The gain has to come from a decision the test changed. A test that confirms the plan has value as insurance, but it adds no bushels.
| Program (CRZ calculation) | $/acre | Break-even, corn at $4.56 | Break-even, soybeans at $12.565 |
|---|---|---|---|
| One tissue sample per zone (soybean leaf, or corn ear leaf alone) | $0.79 | 0.17 bu | 0.06 bu |
| Corn ear leaf + stalk nitrate | $1.17 | 0.26 bu | — |
| Three-timing tissue | $2.37 | 0.52 bu | 0.19 bu |
| Five-set sap, Cornell prices | $11.25 | 2.47 bu | 0.90 bu |
| Five-set sap, Palouse price | $13.75 | 3.02 bu | 1.09 bu |
| Plus a rescue: 40 lb N as UAN32 at $0.76/lb N | $30.40 | 6.67 bu | — |
Sources: Crop Root Zone calculation. Futures: December 2026 corn $4.56 and November 2026 soybeans $12.565, Brownfield closing futures, Oct 23, 2026 [2]. UAN32 at $0.76 per lb of N, DTN retail survey for Oct 12–16, 2026 (DTN, Oct 21, 2026) [13]. The rescue row excludes the cost of a high-clearance pass, which we could not price from a public source.
The bottom row matters more than the others. A test that finds a corn nitrogen shortfall saves nothing by itself. It triggers a $30-an-acre purchase before application, and the purchase has to return about 6.7 bushels before the test's own cost is counted.
3. Does the result predict a response? Nutrient by nutrient
What's new: The best calibration data in the region is not new. Iowa State's tissue P and K calibration was published in 2016, Arkansas's corn N work in 2018, and the Illinois sulfur dataset in 2025. Read together, they say the same thing. A tissue test can say whether a crop is short. It rarely says so in time, or reliably enough, to justify a rescue in the field that was sampled.
Evidence: We summarized the calibration record by nutrient.
| Nutrient and test | What the research found | Can a rescue still pay? |
|---|---|---|
| Corn N, ear leaf at R1 | 24 Arkansas N-rate trials, 2013–2016: 3.0% ear-leaf N separated adequate from deficient corn | Mostly no. R1 is after the window in which late N reliably recovers yield |
| Corn N, stalk sap nitrate at V7–V9 | 8 Iowa site-years: sap nitrate rose with N rate at every site and tracked relative yield | Possibly. The window is still open, but this is a research sensor method, not a commercial leaf-sap service |
| Corn N, end-of-season stalk nitrate | Under 250 ppm low; 250–700 marginal; 700–2,000 optimal; over 2,000 excess | No. The result is for next year's rate |
| Corn K, ear leaf at R1 | 67 Iowa site-years, 37 responsive; critical range 1.06–1.42% K | Doubtful for the sampled crop, per ISU |
| Soybean K, upper leaf at R2–R3 | 52 Iowa site-years, 22 responsive; critical range 1.56–1.99% K | Doubtful for the sampled crop, per ISU |
| Corn S, ear leaf | 40 Illinois trials: 2 yield gains, 5 losses; ear-leaf S moved with rate at 7 of 13 sites | No. The test tracked the fertilizer, not the yield |
| Soybean Mn, foliar | Ohio: 2 of 36 trials responded; national 2019 foliar protocol: 1 of 20 environments | Rarely, and mostly where chlorosis is visible on high-pH or sandy ground |
Sources: Greub et al., Agronomy Journal 110(4), 2018 [14]; Mahal et al., Field Crops Research 310, 2024 [15]; Waypoint Analytical Crop Notes, citing Sawyer and Mallarino 2018 and Murdock and Schwab 2004 [11]; Mallarino, ISU ICM News, Jun 6, 2016 [16] and Jun 13, 2016 [17]; Preza Fontes et al., Agronomy Journal 117(5), 2025, as reported in Crop Root Zone TRZ-0144 [18]; Lindsey, Culman and Matcham, Ohio State C.O.R.N. Newsletter 2020-21 [19].
Corn nitrogen: the window closes before the standard sample. Purdue's 2010 Wanatah field trial delivered sidedress N at V15 after weather delays. Those plots yielded 100 bushels more than the starter-only check and only 13 less than the conventional V7 timing (Miller, Nielsen and Camberato, Purdue, Jun 15, 2011) [20]. That is the case for rescue. The limit is timing. Purdue's Dan Quinn says the benefit drops quickly after VT. Iowa State's Mark Licht notes that by VT or R1 the plant has taken up nearly all the N it will use (Farm Progress, May 28, 2025) [21]. Penn State's sampling stage for corn is the ear leaf at silking, and its own guidance concedes that a rescue may be too late once corn is tasseling [10]. The test that is best calibrated comes too late to act on. Iowa's 2024 stalk-sap work went after exactly this gap, sampling at V7–V9 [15]. Nebraska's extension soils specialist recommended a calibrated crop sensor for mid-season N decisions instead of sap. His reason: a sensor reads many plants, and a leaf sample only a few (UNL CropWatch, Jun 12, 2015) [22].
Potassium: the deficiency line depends on whose table you read. Iowa State's 2016 calibration put the corn ear-leaf critical range at 1.06% to 1.42% K. Mallarino wrote that it sits at or below the lower part of the sufficiency levels in the older literature [16]. Penn State's current table puts the bottom of corn ear-leaf sufficiency at 1.70% [10].
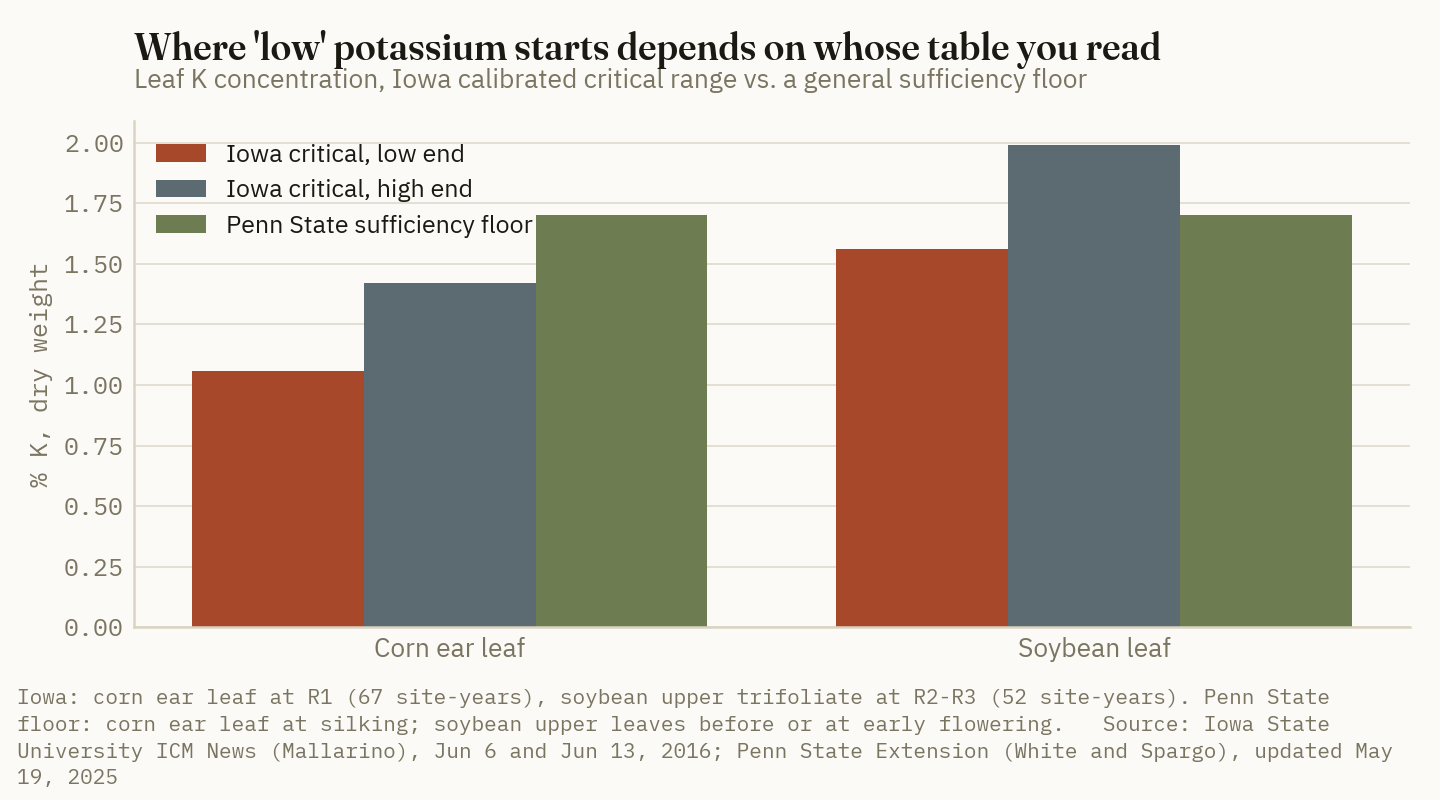
A corn ear leaf at 1.5% K reads low on one table and adequate on the other. The soybean ranges overlap more closely: Iowa's critical range at R2–R3 is 1.56% to 1.99% K, against Penn State's 1.70% floor [10][17]. Both Iowa analyses end with the same caution. Tissue testing is no better a diagnostic than soil testing, and it is of doubtful value for correcting a deficiency in the crop that was sampled [16][17]. Potassium is also a nutrient growers do not usually rescue in-season by foliar spray at agronomic rates.
Sulfur: the test measures the input. We covered this in August. In 40 Illinois trials, sulfur raised soil and ear-leaf sulfur reliably and raised yield at two sites, against five sites where it lowered yield. The authors called both diagnostics unreliable for predicting yield response in the upper Midwest (Crop Root Zone, TRZ-0144, Aug 31, 2026) [18]. A plant test that moves whenever sulfur is applied will confirm that the purchase was made. It will not show whether the purchase paid.
Micronutrients: the response is rare, so false positives dominate. Ohio State reports that manganese, the micronutrient most likely to be short in Ohio soybeans, produced a significant yield response in 2 of 36 trials. Under the 2019 national foliar protocol, 1 of 20 environments showed a benefit from foliar fertilizer [19]. Copper is the contrast. In 115 Prairie wheat trials, a DTPA soil test under 0.4 ppm predicted a response 87% of the time (Crop Root Zone, TRZ-0313, Oct 26, 2026) [23]. Where a calibrated soil test exists for a micronutrient, it does the job that leaf tests are being sold to do.
Ground Truth: Most of the value in a tissue test arrives after the season. The ear-leaf result and the stalk nitrate test are inexpensive inputs to next year's rate, and on that basis they clear their quarter-bushel easily. Using either to trigger a rescue this season is a different purchase, with a much weaker record. On potassium the result also depends on the reference table, so a grower should ask the lab which calibration its "low" comes from before buying a foliar K product.
4. Sap analysis: what the evidence base actually contains
What's new: The largest public North American field test of commercial sap analysis we found is a wheat project, not a corn or soybean study. The Palouse Conservation District in eastern Washington ran sap-managed and conventionally managed one-acre strips on three dryland no-till farms from 2023 to 2025, with Western SARE funding of $74,929 (Western SARE OW23-386, 2026) [24]. The conventional strips were managed by soil and tissue tests. The sap strips got one to three extra in-season applications, depending on site and year [3].
Evidence: The project's economics table shows the sap strips ahead in four of the five wheat site-years it reports in dollars per acre.
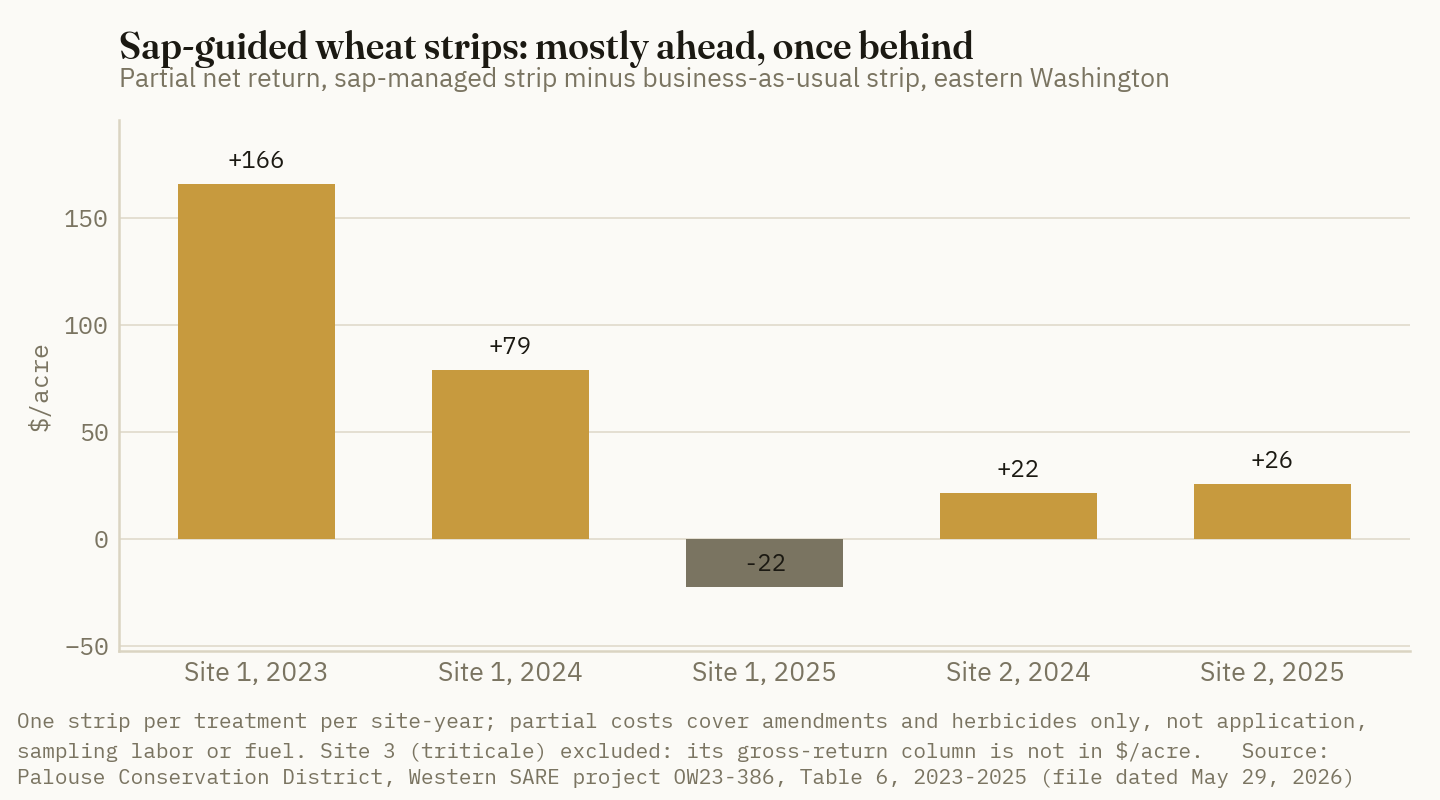
The detail matters more than the totals. At Site 2, the gain came from spending less, not from a rescue. In 2024, sap-strip input costs were $128.71 an acre against $150.45 for the conventional strip, and both yielded 122.5 bushels [3]. That year's report says Site 2 cut seeding-time N, P, S, Zn and B by 20% and fed the crop in-season as needed [24]. At Site 1, sap strips outyielded the conventional strips by about 26 bushels in 2023 and 20 in 2024. The project reports the 2024 difference as significant only at p ≤ 0.10, and the 2023 replicates were combined, so that year has no statistical test [24]. Site 1 lost money in 2025 on the sap strip: the economics table shows −$22.22 an acre, while the narrative summary reports −$5. We used the table. Site 3's dollar columns are not on a per-acre basis, so we left them out. The authors developed provisional sap thresholds for 9 of 14 nutrients and say they need validation before anyone uses them for management [24]. With one strip per treatment per site-year, this is a demonstration, not a calibration.
The corn and soybean record is thinner. A 2015 abstract by Davidson Agronomics and Crop Health Labs described a corn and soybean comparison of sap, tissue and soil tests at five stages. It claimed sap shows deficiencies several weeks before tissue testing does, but the abstract includes no data [12]. The same summer, Nebraska's Charles Shapiro said he knew of no research linking corn sap values to yield or deficiency. He said he "would not use it to generate nutrient recommendations for a lot of acres" until it was confirmed, and that anyone selling an interpretation should show the research behind it [22]. The Iowa State work published in 2024 is real calibration progress, but on a different method. It measured stalk sap nitrate at V7–V9 across eight site-years with four to eight N rates each, and found sap nitrate tracked both N rate and relative yield [15]. That supports measuring nitrate in sap as a corn N signal. It does not validate the commercial two-leaf, many-element sap report. We could not get the paper's full statistics; only its abstract and metadata were reachable.
Ground Truth: The Palouse result points to where sap analysis may earn its fee. It did not earn it by catching hidden hunger and adding bushels. It earned it by giving a grower enough in-season visibility to cut the upfront fertilizer bill and hold yield. That is a testable claim, and a grower can test it on his own farm. Pair a sap-managed strip with a conventional strip on the same field, cut the sap strip's preplant rate, and keep the yield monitor honest. A program that will not support that comparison is selling the report, not a result.
5. What a program has to find to pay
What's new: Nothing in the agronomy. This section applies the rescue frequencies from section 3 to the program costs from section 2.
Evidence: A testing program pays only on the acres where it changes a decision and the changed decision raises yield. If a rescue responds in only a few fields, the bushels on those fields have to carry the lab bill for all of them. Our calculation assumes the test identifies every responsive field and no unresponsive ones, so the true requirement is higher.
19.7 bu/acre
The soybean gain a $13.75-an-acre sap program would need in each responding field to break even, if manganese rescue responds in 2 fields of 36 as it did in Ohio. Ohio's documented manganese response was 2.1 bushels. (Crop Root Zone calculation from Lindsey, Culman and Matcham, Ohio State [19]; Brownfield, Oct 23, 2026 [2]; AgroLatam summary of USDA-ARS/Ohio work [25])
| Scenario (CRZ calculation) | Response frequency | Program break-even, all acres | Gain needed where it responds |
|---|---|---|---|
| Soybean Mn, sap at $13.75/acre | 2 of 36 (5.6%) | 1.09 bu | 19.7 bu |
| Soybean Mn, one tissue sample at $0.79/acre | 2 of 36 (5.6%) | 0.06 bu | 1.1 bu |
| Corn S, sap at $13.75/acre | 2 of 40 (5%) | 3.02 bu | 60.3 bu |
| Corn S, ear leaf + stalk test at $1.17/acre | 2 of 40 (5%) | 0.26 bu | 5.1 bu |
| Corn K, three-timing tissue at $2.37/acre | 37 of 67 (55%) | 0.52 bu | 0.9 bu |
Sources: Crop Root Zone calculation; response frequencies from Ohio State [19], Illinois via TRZ-0144 [18] and Iowa State [16]; futures from Brownfield, Oct 23, 2026 [2]. The calculations exclude the product and application cost of the rescue itself, and the cost of tissue samples taken where nothing responds. The Iowa K frequency is the response to fertilizer K in calibration trials, not to an in-season rescue, so the last row is an upper bound on what a K test could find.
The table makes one point. At the response rates the trials actually found, a cheap test can carry a rare response, and an expensive one cannot. A single tissue sample needs about a bushel of soybeans in each field where manganese responds, which is inside the range Ohio documented. A five-set sap program needs about 20 bushels in those fields, roughly ten times what Ohio documented. The arithmetic turns only where responses are common or large. Corn N on ground that lost nitrogen to a wet spring is the clearest case: Purdue measured a 100-bushel recovery at V15 [20].
Ground Truth: For 2027 we would buy three things. First, one ear-leaf tissue sample and one stalk nitrate sample per management zone on corn, for about $1.17 an acre, to set next year's N, S and K plans. Second, a calibrated canopy sensor or a V7–V9 nitrate measurement where a wet June is the real nitrogen risk, because that is the only diagnostic still inside the rescue window. Third, a single soybean leaf sample, on the fields that show yellowing, before anything goes in the foliar tank. We would not buy a five-set leaf-sap program across corn or soybean acres. A grower who wants to try sap should run it on paired strips, with the preplant rate cut on the sap side, so that a lower fertilizer bill rather than a report is what has to pay for it.
References
- Ward Laboratories, Inc., "Pricing — Plant Analysis," updated Jan 1, 2026, accessed Oct 29, 2026 — https://www.wardlab.com/pricing/
- Brownfield Ag News, "Closing Grain and Livestock Futures: October 23, 2026," Oct 23, 2026 — https://brownfieldagnews.com/news/closing-grain-and-livestock-futures-october-23-2026/
- Palouse Conservation District, "Table 6: Economic analysis and nitrogen use efficiency (NUE)," Western SARE project OW23-386, 2023–2025 seasons (file dated May 29, 2026) — https://projects.sare.org/media/pdf/T/a/b/Table-6-Economic-analysis-and-Nitrogen-Use-Efficiency-across-three-growing-seasons-2023-2025.pdf
- North Carolina Department of Agriculture and Consumer Services, Agronomic Services Division, grower fee schedule, effective Mar 2, 2026 — https://www.ncagr.gov/agronomic-services-nc-grower-fee-schedule/open ; see also NC State Extension, Bertie County, "Agronomic Services N.C. Grower Fee Increases" — https://bertie.ces.ncsu.edu/news/agronomic-services-n-c-grower-fee-increases/
- Waypoint Analytical, "Plant Tissue Information Sheet," Grand Island, NE (file dated Jul 18, 2025; packages PT2 and PT3, no prices listed) — https://waypointanalytical.com/docs/samplesubmittalforms/gne/Waypoint%20Plant%20Tissue%20Infosheet-Nebraska.pdf
- Penn State Agricultural Analytical Services Laboratory, "Plant Tissue Total Analysis," accessed Oct 29, 2026 — https://agsci.psu.edu/aasl/plant-analysis/plant-tissue-total-analysis
- Colorado State University Soil, Water and Plant Testing Laboratory, "Plant Tissue Sampling, Submissions, Pricing," accessed Oct 29, 2026 — https://agsci.colostate.edu/soiltestinglab/?p=26132
- Cornell Soil Health Laboratory, "Elemental Plant Tissue Analyses submission form (Form P)," Apr 2023 — https://www.css.cornell.edu/extension/soil-health/Form-P.pdf
- Isaacs, J., "New lab offers plant sap analysis," Grainews, Feb 13, 2020 — https://www.grainews.ca/features/new-lab-offers-plant-sap-analysis/
- White, C.; Spargo, J., "Mid-Season Crop Tissue Testing," Penn State Extension, updated May 19, 2025 — https://extension.psu.edu/mid-season-crop-tissue-testing
- Waypoint Analytical, "Crop Notes: End of Season Corn Stalk Nitrate Test," undated, citing Sawyer and Mallarino (2018), Iowa State Crop 3154, and Murdock and Schwab (2004), University of Kentucky AGR-180 — https://www.waypointanalytical.com/docs/cropnotes/EndofSeasonCornStalkNitrateTest.pdf
- Davidson, D.J. (Davidson Agronomics); Gregg, M. (Crop Health Labs), "Sap Analysis: New Technique for Assessing Nutrient Levels," Abstract 367-4, ASA-CSSA-SSSA International Annual Meetings, Minneapolis, Nov 18, 2015 — https://scisoc.confex.com/crops/2015am/webprogram/Paper95752.html
- Quinn, R., "DTN Retail Fertilizer Trends," DTN/Progressive Farmer, Oct 21, 2026 (survey of Oct 12–16, 2026) — https://www.dtnpf.com/agriculture/web/ag/crops/article/2026/10/21/uan32-uan28-anhydrous-lead-prices
- Greub, C.E.; Roberts, T.L.; Slaton, N.A.; Kelley, J.P.; Gbur, E.E., "Evaluating Tissue Tests to Improve Nitrogen Management in Furrow-Irrigated Mid-South Corn Production," Agronomy Journal 110(4):1580–1588, 2018, doi:10.2134/agronj2017.12.0707 (abstract via FAO AGRIS) — https://agris.fao.org/search/en/records/65df28f80f3e94b9e5d5b5c7
- Mahal, N.K.; Miguez, F.E.; Sawyer, J.E.; Dong, L.; Schnable, P.S.; Castellano, M.J., "Stalk sap nitrate test as a potential tool for nitrogen fertilizer recommendations for maize," Field Crops Research 310, Mar 2024, doi:10.1016/j.fcr.2024.109330 (record via OSTI; abstract summarized from search index) — https://www.osti.gov/pages/biblio/2323972
- Mallarino, A., "Research Shows a Role for Phosphorus and Potassium Tissue Testing in Corn," Iowa State University Integrated Crop Management News, Jun 6, 2016 — https://crops.extension.iastate.edu/cropnews/2016/06/research-shows-role-phosphorus-and-potassium-tissue-testing-corn
- Mallarino, A., "Value of Soybean Tissue Testing for Phosphorus and Potassium," Iowa State University Integrated Crop Management News, Jun 13, 2016 — https://crops.extension.iastate.edu/cropnews/2016/06/value-soybean-tissue-testing-phosphorus-and-potassium
- Crop Root Zone, TRZ-0144, "Forty Sulfur Trials, Two Yield Gains and Five Yield Losses. The Soil Test Moved Every Time," Aug 31, 2026 (reporting Preza Fontes et al., Agronomy Journal 117(5):e70169, Sep 9, 2025).
- Lindsey, L.; Culman, S.; Matcham, E., "Foliar Fertilizer Applications in Soybean," Ohio State University C.O.R.N. Newsletter 2020-21 (2019 trial results) — https://agcrops.osu.edu/newsletter/corn-newsletter/2020-21/foliar-fertilizer-applications-soybean
- Miller, E.; Nielsen, R.L.; Camberato, J., "Response of Corn to Late-season Nitrogen Application," Corny News Network, Purdue University, Jun 15, 2011 — https://agry.purdue.edu/ext/corn/news/timeless/CornRespLateSeasonN.html
- Bechman, T.J., "Late-season nitrogen rescue: Can it save your corn yield?," Farm Progress, May 28, 2025 — https://farmprogress.pl.barchart.com/mobile/news/story/32597353
- Shapiro, C., "Sampling Corn Sap," UNL CropWatch, Jun 12, 2015 — https://cropwatch.unl.edu/sampling-corn-sap
- Crop Root Zone, TRZ-0313, "A Five-Pound Copper Build Needs Two Bushels of 2027 Spring Wheat a Year. A Foliar Quart Needs 1.8, Every Year. In 115 Prairie Trials, Soils Under 0.4 ppm Responded 87% of the Time.," Oct 26, 2026.
- Western SARE, "Plant sap analysis as a diagnostic tool for winter wheat nutrient use efficiency," project OW23-386, Palouse Conservation District (R. Boylan, PI), project reports through Jan 2026, accessed Oct 29, 2026 — https://projects.sare.org/project-reports/ow23-386/
- AgroLatam, "Foliar fertilizer on soybeans: USDA study," undated summary of Ohio manganese trials, 2014–2015 (secondary source; original not read) — https://www.agrolatam.com/crops/foliar-fertilizer-soybeans-yield-usda-study/
Disclosures
Crop Root Zone is an independent publication. Nothing here is investment advice. Market calls, where included, reflect the editors' own read and are not a recommendation to buy or sell any security.
A Granular Pea Inoculant Needs About 3 Bushels to Pay. On First-Time Pulse Ground, Trials Found 3 to 17. The Nitrogen It Leaves Is Worth $6 to $33 an Acre, Depending on Whose Rule You Use.
On fields new to peas and lentils, inoculant is the cheapest yield protection on the Northern Plains and Prairies, and granular earns its premium. On pea or lentil stubble, seed-applied peat or liquid is enough, and chickpeas need their own strain every time. The credit for the next crop runs from 10 lb of N in Montana to 40 lb in North Dakota. At mid-October retail N prices, the gap between those two rules is worth $18 to $22 an acre.
Inoculant for peas and lentils costs a few dollars an acre, and it is the input where field history matters most. In a December 2024 NDSU trial at Carrington, inoculants raised green pea yield by 19% to 39% on ground with no pulse crop in more than seven years. On ground that had grown peas two seasons earlier, the same products moved yield between −17% and +25%, and none of those differences was statistically significant (NDSU, Dec 2024) [1]. Montana and Saskatchewan trials going back to 1999 show the same split [4][5]. The nitrogen a well-nodulated pea crop leaves behind is the second half of the decision. North Dakota credits the next crop with 40 lb of N per acre after a field pea, lentil or chickpea crop [8]. Montana credits about 10 lb for a field that has grown pulses once or twice [6]. At the mid-October retail averages of $0.60 a pound of N in anhydrous and $0.73 in urea (DTN, Oct 21, 2026) [15], that is a $24 credit in one state and a $6 credit in the next one west. This piece covers which inoculant to buy for 2027, where it pays, and how much of the credit is real.
1. Three formulations, and the soil each one is built for
What's new: Not the products. What has changed is the evidence that the right formulation depends on the field more than the brand. The Saskatchewan Pulse Growers updated their inoculant guide in February 2026. It lists four delivery systems: peat powder on seed, liquid on seed or in-furrow, granular in the seed row, and seed pre-inoculated at a commercial plant, which keeps for weeks rather than hours [3].
Evidence: All three common formulations carry the same organism for peas, lentils and faba beans: Rhizobium leguminosarum. Chickpeas need Mesorhizobium ciceri [3]. A strain carried over from a pea or lentil crop will not nodulate a chickpea, so a chickpea field is effectively first-time ground every time it is seeded. Under ideal conditions, inoculated pulses take 50% to 80% of their nitrogen from fixation [2][3]. Saskatchewan's fixing order is faba bean, pea, chickling vetch, chickpea, lentil, soybean, lupin, dry bean [2].
| Formulation | Placement | Where it performed best | Known failure mode | Cost basis we found |
|---|---|---|---|---|
| Peat powder | On seed, dry or slurry | Moist springs; organic matter over 6% showed no gap to granular in AAFC pea work | Bacteria on seed survive 1–2 days in cool, dark storage; seed should be planted within 6 hours | Bundled in SK budget line C$3.57–10.59/acre with seed treatment, 2025 |
| Liquid | On seed or in-furrow | Matched granular in AAFC Brandon and Indian Head soil-applied work | Lowest nodulation of the three in NDSU's summary; ranked last in dry springs | About $6.80/acre less than granular in a 2014 SK trial (likely C$) |
| Granular | Seed row or side band, separate from fertilizer | Dry springs, acid soils, first-time pulse ground | Blended with 11-51-0, lost 93% of live bacteria in 3 hours | $9.50/acre, 2014 SK trial (likely C$); $3.50/lb at 4–6 lb/acre ($14–21) in 2008 |
| Pre-inoculated seed | Treated at plant | Logistics; shelf life measured in weeks | Strain and count are the seed supplier's call | Not published |
Sources: Saskatchewan Ministry of Agriculture, accessed Oct 28, 2026 [2]; Saskatchewan Pulse Growers, updated Feb 2026 [3]; NDSU, Dec 2024 [1]; MSU Extension, Jan 2018, citing Grenkow et al. 2014 [5]; Western Producer, Feb 14, 2008 [14]; Saskatchewan Crop Planning Guide 2025 [13]. Label rates for current granular products run from about 2.7 lb/acre at 10-inch rows [17] to 5.5 lb/acre at 6-inch rows [18]. We found no public 2026 dealer price for any pea or lentil inoculant.
Moisture is what separates the formulations. Saskatchewan's AAFC work at Indian Head and Melfort ranked granular first, peat second and liquid third in below-normal moisture. It found no difference among them in a normal year on soils above 6% organic matter [2]. A Montana State greenhouse comparison found granular peat placed in the soil fixed about 29 mg of N per plant. Peat on seed fixed about 26 mg, liquid on seed about 14 mg, and no inoculant about 2 mg (Rice et al. 2003, as presented by MSU, Jan 2017) [4]. MSU also reports that granular was the only source that formed nodules at pH 4.4 [5]. Below pH 5.5, nodulation and fixation fall, and inoculant strains differ in how well they tolerate it [4].
The cost data is thin and old, which is itself a finding. The most specific figure in the public record is a 2014 Saskatchewan trial: $9.50 an acre for granular, $6.80 more than liquid, in what we take to be Canadian dollars [5]. In 2008, granular sold at $3.50 a pound, at a little over 4 lb an acre for a 30-bushel pea target and 6 lb for 60 bushels [14]. Saskatchewan's 2025 budgets combine inoculant and seed treatment in one line: C$3.57 an acre for red lentils, C$5.41 for large green lentils, C$5.53 for desi chickpeas, C$8.62 for large kabuli and C$8.21 to C$10.59 for yellow peas [13].
Ground Truth: For 2027 we use $3 to $6 an acre for seed-applied peat or liquid and $12 to $18 for granular. Those are Crop Root Zone estimates, scaled up from the 2008 and 2014 figures because no current public price list exists. On those estimates the granular premium is $6 to $15 an acre, about $10 in the middle, and that is the number to test. At the Min-Dak yellow pea bid of $9.25 a hundredweight on October 26 [16], or $5.55 a bushel, the premium costs 1.1 to 2.7 bushels, about 1.8 in the middle. A grower with a mixed field list should not buy one product for the whole farm. Granular belongs on the new ground and peat on the stubble.
2. First-time ground versus repeat ground: what the trials found
What's new: The NDSU Carrington report is the newest Northern Plains data, and it was designed to separate field history from product. Six treatments, including a no-inoculant check, were run on green (ND Victory) and yellow (ND Dawn) peas, at one site with no pulse crop in more than seven years and one where peas were grown two seasons before [1].
Evidence: Inoculant effects were significant only on the low-history ground. Every liquid product raised yellow pea yield there, by 9% to 12%; granular added 3%. On green peas, granular added 19% and the custom liquids added 28% to 39%. At the high-history site, the yellow pea effects ran from −1% to +5%, and the green pea effects scattered from −17% to +25% with no significant difference from the check [1]. The authors note that the high-history site also drained slowly and had root rot, which lowered its yields [1].
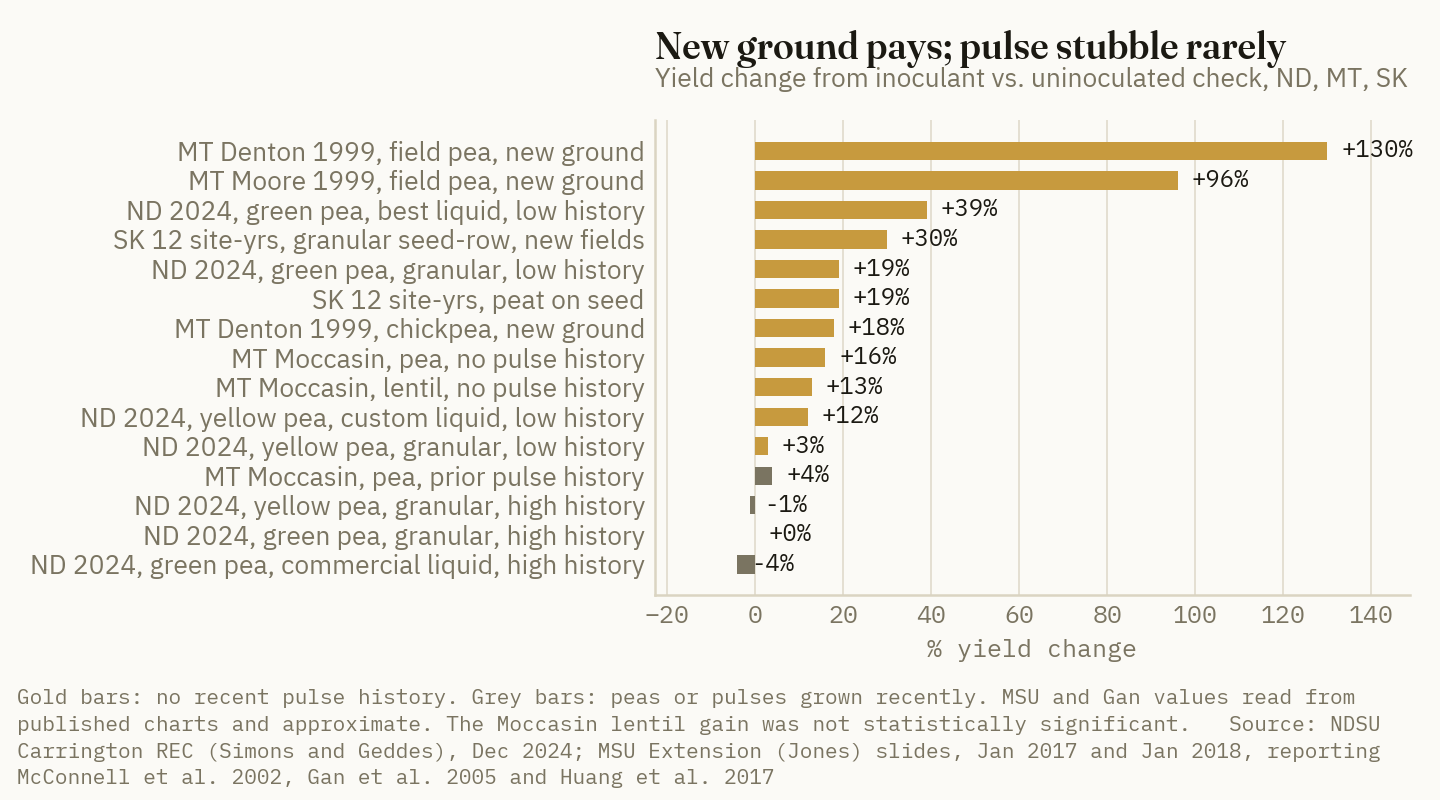
The older trials are larger in effect and agree on direction. In 1999, at Denton and Moore, Montana, on fields with no recent pulse history, inoculated field peas yielded about 1,010 and 2,040 lb an acre. Uninoculated peas yielded about 440 and 1,040 lb [4]. That is 9.5 and 16.7 bushels lost to a skipped inoculant. Uninoculated peas given fertilizer N recovered most of the gap, at about 900 and 1,930 lb (McConnell et al. 2002, as presented by MSU) [4]. Across 12 Saskatchewan site-years, granular in the seed row lifted pea yield from about 19.5 to 25.4 bushels, and peat on seed lifted it to 23.3 (Gan et al. 2005) [4]. MSU's summary says granular beat peat or no inoculant in 8 of the 12 years on new fields [5]. At Moccasin, Montana, inoculation added about 3.2 bushels to peas on new ground and about 0.9 on ground with pulse history. Lentil responses at Moccasin were not significant in either case (Huang et al. 2017) [4].
| Trial | Crop | Field history | Check (bu/acre) | Inoculated (bu/acre) | Gain | Value at $5.55/bu |
|---|---|---|---|---|---|---|
| Denton, MT, 1999 | Field pea | No recent pulse | 7.3 | 16.8 | +9.5 | $52.73 |
| Moore, MT, 1999 | Field pea | No recent pulse | 17.3 | 34.0 | +16.7 | $92.69 |
| Saskatchewan, 12 site-years | Field pea, granular | New fields | 19.5 | 25.4 | +5.9 | $32.75 |
| Moccasin, MT | Field pea | No pulse history | 20.0 | 23.2 | +3.2 | $17.76 |
| Moccasin, MT | Field pea | Prior pulse history | 20.5 | 21.4 | +0.9 | $5.00 |
| Moccasin, MT | Lentil | No pulse history | 19.0 | 21.5 | +2.5 (n.s.) | — |
| Indian Head, Scott, Swift Current, SK, 2021 | Lentil, granular | 13 years without pulses at Indian Head | — | — | None detected | — |
Sources: MSU Extension slides, Jan 13, 2017, presenting McConnell et al. 2002, Gan et al. 2005 and Huang et al. 2017 [4]; IHARF/Saskatchewan Pulse ADOPT report, Dec 2021 [11]; Min-Dak yellow pea grower bid, USDA AMS via Protein Report, Oct 26, 2026 [16]. Montana 1999 yields converted from lb/acre at 60 lb/bu. All trial values are read from published charts and are approximate. Values use today's yellow pea bid for comparison only; the trials were not priced at it. n.s. = not statistically significant.
Lentils are the weak link in the case for inoculant. The 2021 Saskatchewan Pulse demonstration at Indian Head, Scott and Swift Current found no yield or protein response to granular inoculant at any site. That included Indian Head, which had not grown peas, lentils or faba beans in 13 years, and where the uninoculated plants were well nodulated [11]. The same report summarizes Bowness et al. (2019), five Alberta locations over four years on fields without a pea, lentil or faba crop for at least five years. That study also found no yield benefit, and again attributed it to adequate native nodulation [11]. Against that, Yan et al. (2005) reported a 45% lentil yield gain from inoculation in Saskatchewan's Brown soil zone [11]. The IHARF authors still would not recommend dropping inoculant on lentils. They suggest a cheaper seed-applied product where a field has a pea or lentil history and no record of nodulation failure [11].
Chickpeas sit at the other end. At Denton in 1999, inoculated chickpeas yielded about 400 lb an acre against 340 uninoculated. At Moore the gap was 700 against 675 and not significant [4]. Two site-years are too few to rank chickpea's response against pea's. The species point is the useful one. Chickpea's rhizobium is a different species from the one that peas and lentils leave in the soil [3], so a pea or lentil history does not protect a chickpea crop.
Ground Truth: The pattern in this record is about downside protection, not average gain. On a field new to pulses, skipping inoculant has cost up to half the pea crop. On pea stubble, buying the best product has gained about a bushel. A grower adding peas or lentils to a wheat-canola rotation for the first time in 2027 should treat granular as mandatory, and consider granular plus seed-applied product in a dry spring. Saskatchewan notes that some growers already combine two products on first-time fields [2]. The same grower on a field that grew peas in 2023 or 2024 can switch to peat and use the savings for a spring nodule check at the 3rd to 4th week after emergence. A spring nodule check catches a failure while rescue N can still fix it. Saskatchewan suggests 40 to 50 lb, applied no later than about six weeks after seeding or emergence [2][4].
3. How much nitrogen a pea or lentil fixes, and how much leaves in the truck
What's new: Nothing new in the science. The farm-level point keeps being missed. A pulse crop fixes nitrogen mostly to feed its own seed, and the harvest takes most of that seed off the field.
Evidence: The most direct regional measurement is from Montana's Gallatin Valley. Using the N-difference method, McCauley (2011) measured nitrogen fixed by spring-planted peas and lentils at pod stage in a dry year and a wet year [4]. We set those numbers against what a harvested pea crop removes.
| Measure | lb N/acre | |
|---|---|---|
| Pea, fixed by pod stage, wet year | 121 | ██████████ |
| N removed in a 45-bu pea crop at 22% protein* | 95 | ████████░░ |
| Lentil, fixed by pod stage, wet year | 80 | ███████░░░ |
| Pea, fixed by pod stage, dry year | 67 | ██████░░░░ |
| Lentil, fixed by pod stage, dry year | 66 | ██████░░░░ |
| North Dakota credit to the next crop | 40 | ███░░░░░░░ |
| Montana credit, pulse grown 1–2 times | 10 | █░░░░░░░░░ |
Sources: McCauley 2011, Gallatin Valley, MT, as presented by MSU, Jan 2017 (values read from chart, approximate) [4]; NDSU SF882 [8]; MSU, Nov 2016 [6]. *Crop Root Zone arithmetic: 45 bu × 60 lb × 22% protein ÷ 6.25. Saskatchewan's 2025 yellow pea budget uses a 45-bu target in the Dark Brown zone [13].
In the dry year, peas had fixed more by flowering, about 75 lb, than by pod, and nodules stop working when the soil around them dries [4]. In this record, fixation and removal are about equal. A 45-bushel pea crop exports about 95 lb of N in the seed. That is close to everything fixed in the wet year and more than was fixed in the dry year. A 30-bushel pea crop needs about 150 lb of N in total, on Saskatchewan figures quoted by the Western Producer in 2008 [14]. The rest comes from the soil. Saskatchewan guidance warns that more than about 35 lb of soil plus fertilizer N reduces nodulation. Above about 50 lb, nodulation can be delayed or eliminated and the crop draws on soil N instead [2]. MSU's target is 10 to 15 lb of total available N in the top foot in spring [5]. At Moccasin, 20 lb of seed-row N cut pea yield from about 29 to 21 bushels [4].
The credit, then, is not fixed nitrogen left over. It is soil nitrate the pea did not use, plus N released as the residue breaks down. Montana's extension specialist separates the two: the N benefit is soil nitrate after a pulse minus soil nitrate after a non-pulse, plus residue N. The N credit is the amount a grower can safely cut from the next crop's rate, and it is smaller [6]. Residue N also comes back slowly. North-central Alberta work found 43% of pea residue N released under no-till against 55% with tillage (Lupwayi et al. 2004, via MSU) [6]. Work cited by Manitoba Agriculture found rapid mineralization in the four to five weeks after harvest (Lupwayi and Soon 2009) [9]. The benefit is also cumulative. Montana doubles its credit, from about 10 to about 20 lb, once a field has grown pulses three or more times [6].
4. The credit, and what it is worth at October nitrogen prices
What's new: Anhydrous averaged $987 a short ton at retail in the second week of October, up 18% from a year ago. Urea averaged $674, up 13% (DTN, Oct 21, 2026) [15]. Per pound of N, that is $0.60 for anhydrous and $0.73 for urea [15]. Every pound of credit is worth more than it was a year ago.
Evidence: The agencies agree that a pulse leaves N. They disagree on how much, by a factor of four.
$18 to $22 an acre
The difference, at mid-October retail anhydrous and urea, between North Dakota's 40-lb credit after peas and Montana's 10-lb credit for the same crop. (Crop Root Zone calculation from NDSU SF882 [8], MSU Extension [6] and DTN, Oct 21, 2026 [15])
| Jurisdiction | Published credit after field pea | lb N/acre | At anhydrous ($0.60) | At urea ($0.73) | Basis |
|---|---|---|---|---|---|
| North Dakota | Field pea, lentil, chickpea | 40 | $24.00 | $29.20 | ND/MN N-rate response trials; no second-year credit |
| Saskatchewan | ½–1 lb N per bu of peas | 22.5–45* | $13.50–27.00 | $16.43–32.85 | Rule of thumb |
| Manitoba | Field pea | 25 | $15.00 | $18.25 | 1998–2000 trials, 0–26 lb measured |
| Montana | Pulse grain crop grown 3+ times | ~20 | $12.00 | $14.60 | Extension recommendation |
| Montana | Pulse grain crop grown 1–2 times | ~10 | $6.00 | $7.30 | Extension recommendation |
| Prairie yield rule | 5 lb N per 1,000 lb of pea; 4 lb per 1,000 lb of lentil; 2.5 lb per 1,000 lb of chickpea | 15 / 6 / 6.25* | $9.00 / $3.60 / $3.75 | $10.95 / $4.38 / $4.56 | Pulse Agronomy Update #26, 2005 |
Sources: NDSU SF882, 2023 revision [8]; Manitoba Agriculture (Heard), Sep 2020, citing Przednowek et al. 2004 [9]; MSU Extension, Nov 29, 2016 [6]; Top Crop Manager, Nov 19, 2007 [10]; DTN, Oct 21, 2026 [15]. Values are Crop Root Zone calculations, before application cost. *Saskatchewan range applied to a 45-bu pea crop, our assumption. The yield-rule values use the published examples of 3,000 lb of peas, 1,500 lb of lentil and 2,500 lb of chickpea. We found no current Alberta provincial credit.
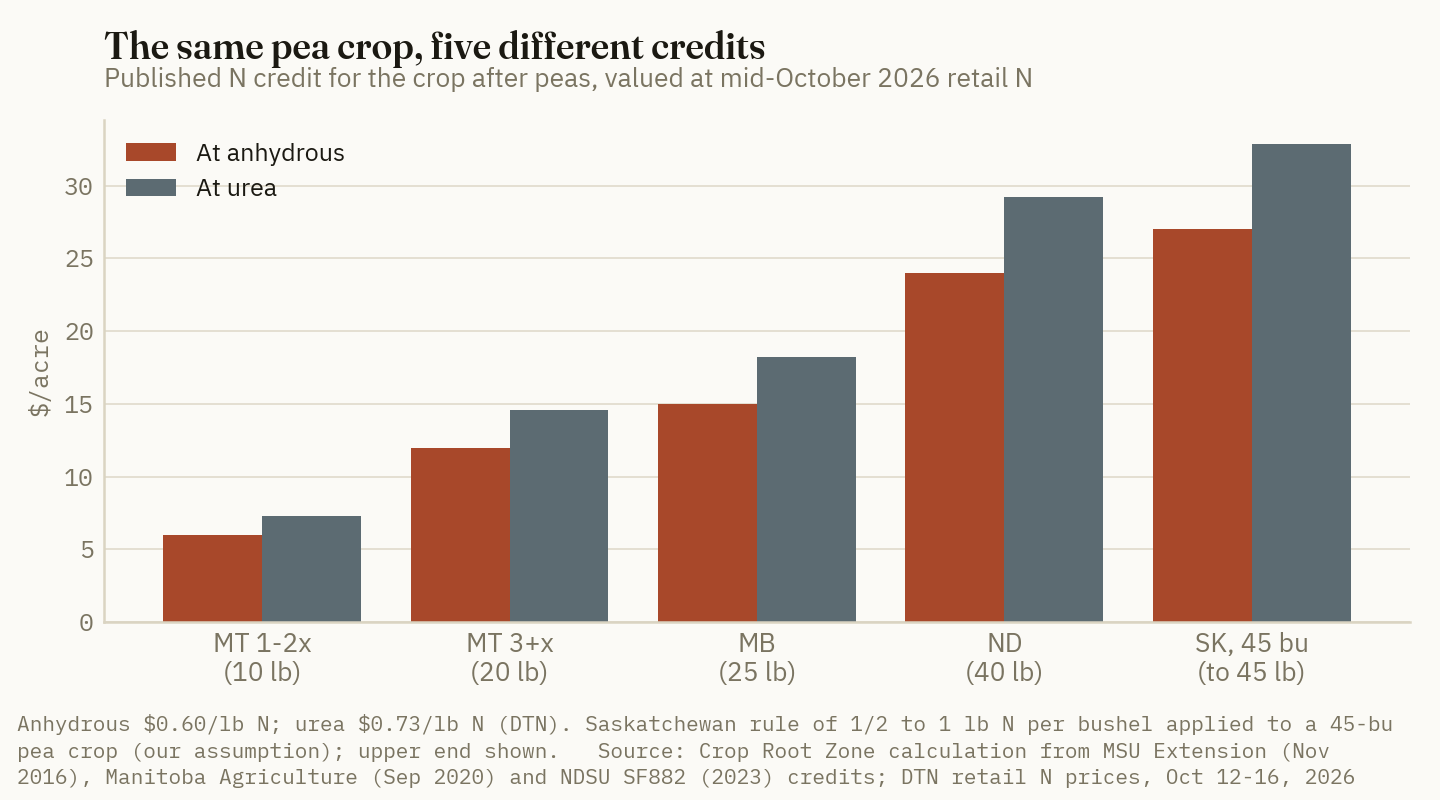
The measured numbers sit at the low end of that table. Manitoba's 1998–2000 trials found 0 to 26 lb of apparent credit to wheat after peas. The zero came at Carman in 2000, after a 53-bushel pea crop [9]. Manitoba's own advice is not to scale the credit up with pea yield. Higher-yielding pea crops send more N to the elevator, and a late-October soil nitrate test on the pea stubble will catch most of what the residue released [9]. In north-central Montana, the 2015 rotation trial assumed 9 to 13 lb for a pea or lentil harvested for seed [7]. A University of Manitoba summary put average apparent credits after peas at 10 lb or less [10].
None of this means the rotation benefit is small. It means most of it is not nitrogen. Saskatchewan work cited by Top Crop Manager attributed only 8% of the wheat yield gain after peas to the N credit and 92% to non-N rotation effects [10]. Northeastern Saskatchewan work found barley 21% higher in the first year and wheat 12% higher in the second year after a pulse, and barley on barley stubble did not catch up even at 180 lb of N [10]. The Prairie-wide residue trial led by AAFC Lacombe found canola on pea residue yielded 158 to 320 kg a hectare more than canola on wheat residue in 2010, averaged over N rates. Beaverlodge, Alberta, was one of the four sites where the gain was significant [12]. The same trial found pea residue lowered canola yield at Beaverlodge, Lacombe, Indian Head and Brandon in 2012 [12]. The effect is real, but it is not guaranteed.
Ground Truth: A grower in North Dakota who takes the full 40-lb table credit in 2027 is betting $24 to $29 an acre of N that the credit is real. Montana and Manitoba field data say it is closer to 10 to 25 lb. Taking a 40-lb credit when 15 lb is real leaves a 2027 spring wheat crop 25 lb short to save $15 to $18 an acre. We would not make that trade on a crop that is paid partly on protein. The answer is not a different table. Pull a soil nitrate sample on pea stubble in late October, after the residue has had its four to five weeks [9], and take the credit the test shows. Then check the result against wheat protein. MSU's rule is to keep taking a credit only while spring wheat after pulses holds protein above 13.2%, or winter wheat above 12.5% [6]. This credit is a measurement, unlike the fixed rule for a cover crop [22].
5. What to buy for 2027, field by field
What's new: Two things have changed since most of this research was done. Retail nitrogen is up 13% to 18% from a year ago [15]. Pulse prices are low: the Min-Dak yellow pea bid was $9.25 a hundredweight on October 26 [16], or $5.55 a bushel. Low pea prices make a bushel of inoculant response worth less. High N prices make the credit worth more.
Evidence: We set the inoculant costs from section 1 against the yield record in section 2 and the credit in section 4. This is the same calculation we ran for soybean inoculant [19], molybdenum seed treatment [20] and phosphate biologicals [21], with one difference. A pulse inoculant protects the crop that produces the rotation benefit, so a failure costs the following crop as well.
| Situation | Our read | Break-even at $5.55/bu peas |
|---|---|---|
| Pea or lentil on ground with no pulse in 7+ years, or none ever | Granular in the seed row or side band, kept away from phosphate; add seed-applied product in a dry spring or on acid soil | Granular at $12–18: 2.2–3.2 bu |
| Pea on ground that grew peas or lentils within 4 years, no nodulation problems on record | Peat or liquid on seed, planted the same day | $3–6: 0.5–1.1 bu |
| Lentil on established pulse ground | Cheapest seed-applied product at label rate; IHARF found no gain from granular or dual inoculation | $3–6; lentil is priced by the pound |
| Chickpea, any field | Chickpea-specific Mesorhizobium every year; granular in dry Brown-zone springs; side-band starter N can cut 4–5 days off maturity in long-season years | Not priced; chickpea sells by the pound |
| Any pulse, 3–4 weeks after emergence | Dig plants. Pink to red nodules mean fixation; white means none. Rescue with 40–50 lb N topdress by the 9- to 12-node stage in pea | 45 lb of N as urea ≈ $33 plus a pass |
| Crop after the pulse | Late-October nitrate test on stubble; take the measured credit, not the table credit | 10 lb of N at $0.60 = $6 |
Source: Crop Root Zone decision rule, drawing on [1][2][3][4][5][6][8][9][11][15][16]. Inoculant costs and break-evens are Crop Root Zone estimates in U.S. dollars; the underlying 2014 and 2025 Saskatchewan figures are Canadian. Chickpea maturity effect: Gan et al. 2009, as presented by MSU [5].
On new ground, $15 of granular at $5.55 peas needs 2.7 bushels. The new-ground trials in section 2 returned 3.2 to 16.7. On established pea ground, the Moccasin gain of 0.9 bushels does not cover granular. It does cover a $4 peat treatment, barely. A low-yield Saskatchewan trial in 2014 is the caution: on sites under 45 bushels, granular added roughly a bushel and returned about the same net dollars per acre as no inoculant at $6.50 peas [5]. Low yield potential, dry soil and high soil N are the three conditions MSU names in which granular does not pay [5].
Ground Truth: The inoculant decision costs a few dollars an acre either way. The N-credit decision is the expensive one. It moves $6 to $29 an acre of 2027 fertilizer, and most growers make it from a table. A pulse field that nodulated well, on a soil test that shows it, is the one place where the credit and the rotation benefit are both likely to be there next year. If a grower spends more on inoculant for 2027, the spending should be on new ground. The other money worth spending is on the nodule check and the fall nitrate sample that tell the grower whether the credit exists.
References
- Simons, K.; Geddes, B., "Inoculants Improve Pea Yield when Peas are Grown in Areas of Low Pulse History," NDSU Carrington Research Extension Center, research report, Dec 2024 — https://www.ndsu.edu/agriculture/node/11844 (PDF: https://info.ext.nodak.edu/agriculture/sites/default/files/2025-03/24%20Inoculants%20Improve%20Pea%20Yield.pdf)
- Government of Saskatchewan, Ministry of Agriculture, "Inoculation of Pulse Crops," undated, accessed Oct 28, 2026 — https://www.saskatchewan.ca/business/agriculture-natural-resources-and-industry/agribusiness-farmers-and-ranchers/crops-and-irrigation/soils-fertility-and-nutrients/inoculation-of-pulse-crops
- Saskatchewan Pulse Growers, "Inoculant Options for Pulse Crops," published Mar 2025, updated Feb 2026, accessed Oct 28, 2026 — https://saskpulse.com/resources/inoculant-options-for-pulse-crops/
- Jones, C., "Pulse Crop Inoculation and Fertilization," Hill County Extension Pulse Workshop, Montana State University, Jan 13, 2017 (source for our summaries of McConnell et al. 2002, Gan et al. 2005, Huang et al. 2017, McCauley 2011 and Rice et al. 2003, which we did not read in the original) — https://landresources.montana.edu/soilfertility/documents/PDF/pres/PulseInocFertJan2017.pdf
- Jones, C., "Nutrient Management of Pulses," Crop and Pest Management School, Montana State University, Jan 2, 2018 (source for our summaries of Grenkow et al. 2014 and Gan et al. 2009) — https://landresources.montana.edu/soilfertility/documents/PDF/pres/PulseFertCPMS2018.pdf
- Jones, C., "Pulse Crops and Nitrogen Credits," Montana Pulse Growers, Montana State University, Nov 29, 2016 — https://landresources.montana.edu/soilfertility/documents/PDF/pres/PulseNCreditsNov2016.pdf
- Miller, P.; Jones, C.; Bekkerman, A.; Holmes, J., "Short-term (2-yr) Effects of Crop Rotations and Nitrogen Rates on Winter Wheat Yield, Protein and Economics in North Central Montana," Fertilizer Facts No. 68, Montana State University, Jan 2015 — https://landresources.montana.edu/fertilizerfacts/documents/FF68%20CropRotationNWheatYieldProtEcon.pdf
- NDSU Extension, "North Dakota Fertilizer Recommendation Tables and Equations," SF882, 2023 revision (copy hosted by American Crystal Sugar; previous-crop credits table) — https://www.crystalsugar.com/wp-content/uploads/2025/03/ND-Fertiziler-Recommendation-Tables-2023.pdf
- Heard, J., "What about N credits from peas?," Manitoba Agriculture, Sep 2020 (document date from file metadata), citing Przednowek, Entz, Irvine, Flaten and Thiessen Martens, Can. J. Plant Sci. 84:1093–1096, 2004, and Lupwayi and Soon, Can. J. Plant Sci. 89:239–246, 2009 — https://www.gov.mb.ca/agriculture/crops/seasonal-reports/pubs/what-about-n-credits-from-peas.pdf
- Barker, B., "Nitrogen credit," Top Crop Manager, Nov 19, 2007 (source for the Pulse Agronomy Update #26 yield rule and the Stevenson and van Kessel 8%/92% finding, which we did not read in the original) — https://www.topcropmanager.com/nitrogen-credit-906/
- Holzapfel, C.; Fletcher, A., "Lentil Response to Fertilizer Applications and Rhizobial Inoculation," ADOPT Project #20200528, Indian Head Agricultural Research Foundation and Saskatchewan Pulse Crop Development Board, Dec 2021 (source for our summaries of Bowness et al. 2019 and Yan et al. 2005) — https://iharf.ca/wp-content/uploads/2024/02/Lentil-Response-to-Fertilizer-Applications-and-Rhizobial-Inoculation1.pdf
- Canola Council of Canada Research Hub, "Legume crops to improve soil fertility," O'Donovan, J. (AAFC Lacombe) et al., project begun 2010, final report c. 2013, accessed Oct 28, 2026 — https://www.canolacouncil.org/research-hub/legume-crops-to-improve-soil-fertility
- Government of Saskatchewan, Ministry of Agriculture, "Crop Planning Guide 2025" — https://publications.saskatchewan.ca/api/v1/products/122661/formats/142532/download
- Raine, M., "Higher inoculant, nutrient rates fill bins," The Western Producer, Feb 14, 2008 — https://www.producer.com/?p=54657
- Quinn, R., "DTN Retail Fertilizer Trends," DTN/Progressive Farmer, Oct 21, 2026 (second week of October 2026 survey) — https://www.dtnpf.com/agriculture/web/ag/crops/article/2026/10/21/uan32-uan28-anhydrous-lead-prices
- USDA Agricultural Marketing Service, U.S. #1 whole yellow pea, Min-Dak grower bid average, week of Oct 26, 2026, $9.25/cwt, as compiled by Protein Report — https://www.proteinreport.org/data/series/us-whole-yellow-pea-min-dak-grower-bid-average-price
- Lallemand Plant Care, "LALFIX START SPHERICAL PRO, Pulses," product sheet, Jun 2024 (27-lb bag covers about 10 acres at 10-inch rows; as summarized by search index) — https://lallemandplantcare.com/wp-content/uploads/2022/08/LALFIX-SPHERICAL_PRO_Pea-Lentil-Faba-CAN-EN_06-2024.pdf
- FMC Canada, "TagTeam BioniQ" technical sheet, 2025 (5.5 lb/acre at 6-inch rows; as summarized by search index) — https://ag.fmc.com/ca/sites/default/files/2026-03/TagTeam%20BioniQ%20Tech%20Sheet_2025.pdf
- Crop Root Zone, TRZ-0225, "A $2.50 Soybean Inoculant Needs a Fifth of a Bushel to Pay. On Ground That Has Grown Soybeans, Two Decades of University Trials Mostly Can't Find It. On New Ground, Manitoba Found 15.," Sep 23, 2026.
- Crop Root Zone, TRZ-0261, "A Molybdenum Seed Treatment Needs a Sixth of a Bushel of 2027 Soybeans. Liming the Same Acre to pH 6.0 Needs 5.3. Alabama Found a Molybdenum Response on One Soil in Eight.," Oct 6, 2026.
- Crop Root Zone, TRZ-0285, "A $10-an-Acre Phosphate Biological Must Return 2 Bushels of Corn or Replace 12 Pounds of P2O5. In 56 Independent Prairie Site-Years It Lowered Yield 10 Times and Raised It 6.," Oct 15, 2026.
- Crop Root Zone, TRZ-0013, "The Cover Crop Ledger: What the Nitrogen Credit Is Actually Worth in 2026," Jul 18, 2026.
Disclosures
Crop Root Zone is an independent publication. Nothing here is investment advice. Market calls, where included, reflect the editors' own read and are not a recommendation to buy or sell any security.
Discussion
This issue finds that a stabilized fall anhydrous pass keeps about $11.93 of a $34.50 nitrogen spread at DTN's averages, and that against flat UAN28 the walk-away price at a 20-pound agronomic gap is $970 a ton, under today's retail average. So: what is your dealer quoting per ton, delivered, for fall anhydrous and for spring UAN28 on the same acres, and at those two prices are you going in this fall?
Corrections are as welcome as answers. If you check our arithmetic against a primary source and find we have it wrong, tell us. The sharpest replies get answered in next week's Letters & Responses.