Issue 15 · 2026-10-26
Every story in this issue measures the gap between two prices, and most of those gaps are set by something other than trade. Canadian potash enters the United States at 0%, but the zero rests on executive exemption lists, not USMCA, and a 50% duty would add about $121 a ton. Barge freight to Peoria, at $37.19 a ton, exceeded the Corn Belt's whole September premium over NOLA on UAN. Egyptian urea sits $24 a tonne above the NOLA barge before it leaves port.
The crop and farm side runs on reference points too. Runner peanuts brought $436 a ton against a $630 reference price. The 2027 Kansas wheat guarantee is $274 an acre at 75% on a 45-bushel APH. An Iowa ethanol plant earns about $3.60 a bushel over its corn and still bids a dime over local elevators. A diesel pivot pays $16.58 to pump an acre-inch that controlled electric pumps for $3.37 to $4.39.
Why now: 2027 input sheets are being priced against these anchors this fall, and several can move by proclamation or river stage rather than by trade. The next Section 338 scope change takes effect October 30. For each gap we show what sets it and what would close it.
— Crop Root Zone, Editorial Desk.
Letters & Responses
No reader correspondence reached us this week. We searched the publication inbox from October 18 onward and found no questions, corrections or pushback about RZ-014; the same search returned older threads, so this is a real zero, and we will not invent a letter to fill the space.
On the RZ-004 letter about hedging nitrogen. The one letter we keep returning to came from a reader with a career on the nitrogen side of the trade. The reader asked why a grower can hedge corn, beans and wheat but has no instrument to lock in ammonia, urea, UAN or AMS. Our answer then was that nitrogen is several products with wide regional spreads, so there was no single deliverable to write a contract on.
Our update: something changed this week. MIAX began trading four physically settled futures for delivery at NOLA, on urea, DAP, MAP and potassium chloride, on October 19, in 25-short-ton lots. CME already lists cash-settled fertilizer swaps. No first-day volume had been published (Fertilizer Daily, Oct 21, 2026). A Gulf contract still leaves the barge freight and the dealer markup unhedged. This issue's barge feature finds freight to Illinois River terminals exceeded September's whole Corn Belt premium over NOLA on UAN. So the instrument covers the Gulf price, not the farm price. The correspondent remains anonymous.
Open questions (ours, not readers'). Two questions from recent issues are still unanswered, this issue adds evidence to both, and it adds a third.
- RZ-014's sulfur question. What sulfur source and rate are you booking for 2027 corn, and on what basis? The China-denominated sulfur benchmark has fallen 27% in a month, and we still find no public fourth-quarter Tampa settlement.
- RZ-012's booking question. What were you quoted for spring nitrogen, and on what terms? This issue's UAN feature puts the October retail markup at $163 over the July–August barge fill, $37 wider than last fall.
- This issue's potash question. If a duty were ever placed on Canadian potash, would your dealer's contract pass it through on tons already in the warehouse? Discussion, at the end of the issue, asks for the quote.
Corrections, disagreements and figures from your own operation are welcome by email. We answer the sharpest ones here the following week.
In This Issue
This week's features, by department.
- Canadian Potash Crosses the Border at 0% Under Four US Tariff Layers, and USMCA Holds Up Only One of Them. A 50% Duty Would Add About $121 a Ton and $12 an Acre to a Corn-Soy Rotation.As of Oct 26, Canadian muriate pays no US duty: the general rate is free, the IEEPA tariff is dead, the 10% Section 301 duty on Canada lists potassium chloride as a universal exemption, and the 50% Section 338 proclamations name potash as excluded. Only the Section 301 layer gives USMCA-qualifying goods a separate pass, and the Section 338 layer applies whether or not goods qualify, so the zero rests on executive lists rather than the treaty. Canada shipped 88% of US potassium chloride imports by volume in 2025. On a customs value of about $241 a short ton, a 10% duty would add $24 and a 50% duty $121, which works out to $2.45 and $12.24 an acre over a 210-bushel corn, 70-bushel soybean rotation.
- The River Freight Benchmark to Peoria Is $37.19 a Ton, Up 22% on the Year. In September the Illinois Barge Rate Was Bigger Than the Corn Belt's Whole Premium Over NOLA on UAN.USDA publishes no upbound fertilizer barge rate, so we use the same-reach downbound rates as the benchmark: $23.63 a ton for St. Louis, $37.19 for Peoria and $49.52 for the Twin Cities on October 20, up 20% to 37% from a year earlier, with the biggest rise on the longest haul. Northbound loading drafts have not been cut on the Lower Mississippi, upbound fertilizer through Lock 27 ran 64% above last September, and Memphis is forecast to reach a carrier's low-water trigger on October 26. On our estimate, freight equalled about 72% of September's Corn Belt premium over NOLA for urea and more than all of it for UAN. That puts the inland premium, not the barge rate, under pressure this fall.
- Egyptian Urea Sold Near $505 a Tonne FOB in Mid-October, $24 Above the NOLA Barge Before It Even Leaves Port. Last Fall's CBAM Rush Put That Gap Above $80; This Fall It Is Europe's €90 Gas. Shipped to the Gulf, an Egyptian Cargo Would Land Roughly $50 to $65 Too High to Compete.North African granular urea traded at $480 to $530 a tonne FOB in the week to October 16, while the October US Gulf futures contract sat at $436.75 a short ton, or $481 a tonne. Dutch gas above €90/MWh has pushed European urea production costs toward an estimated $780 a tonne, so Europe can pay Egypt's price and the US Gulf does not have to. That leaves NOLA priced off China, India and Russia this fall, and puts the level at which Mediterranean tonnes would start to compete for US spring supply at roughly $481 to $494 a short ton, $21 to $34 above the March 2027 futures.
- Brazil Paid $50 a Tonne Over NOLA for Urea in June. By September the Gulf Paid $13 to $38 More, and in Mid-October the Gap Is $2 to $12. Brazil Has Bought 21.5% Less Urea This Year and Still Has a Safrinha Crop to Supply.Brazil's urea, potash and MAP imports for January–September 2026 are running 21.5%, 3.6% and an unstated amount below last year, and CFR Brazil prices sit at $470, $355 and $830 a tonne. Converted to metric tonnes, the NOLA barge is above Brazil on all three. For urea the gap has nearly closed, so Brazil's fourth-quarter buying now decides where the next cargo goes and what US spring nitrogen costs. For potash and MAP, Brazil is not competing with the US this winter: it is soft on potash and sitting out MAP.
- Retail UAN32 Sat $114 Over the NOLA Barge in September, the Narrowest Gap in Four Falls. Against the July Fill That Dealers Actually Bought, the October Markup Is $163, $37 Wider Than Last Year.USDA's Green Markets series puts the September NOLA UAN32 barge at $343 a short ton, up $36.75 in a month, while DTN's retail survey held at $457 and then rose $28 to $485 in early October. The narrow September gap was retail lagging a rising barge, not a thinner dealer margin. Measured against the July–August fill, the October markup is $163, against $126 last fall. Per pound of nitrogen, UAN32 costs 4.5 cents more than urea at the Gulf and the same at the farm, so the liquid premium is set at the barge, not at the dealer.
- Runner Peanuts Brought $436 a Ton in Mid-October Against a $630 Reference Price. A Wiregrass Irrigated Acre Needs 2.6 Tons to Cover Full Cost, and Georgia Is Forecast at 2.03.The 2025 reconciliation law raised the peanut reference price to $630 a ton and the national loan rate to $390, and USDA has implemented both. We set those against the 2026 market and the Alabama Extension Wiregrass budgets. At current prices an irrigated acre needs 2.4 to 2.6 tons to cover total specified cost, while Georgia is forecast at 2.03 tons. The projected $150-a-ton PLC payment is paid on base acres, not on this year's crop. Lime, gypsum and boron make up about 7% of irrigated operating cost.
- The 2027 Kansas Wheat Guarantee Is $274 an Acre at 75% on a 45-Bushel APH, 45% Above Last Year's Starting Point. The July Board Now Sits 4 Cents Under the 85% Price Trigger.RMA set the 2027 hard red winter projected price at $8.11 with a 0.25 volatility factor, against $5.61 and 0.19 for the 2026 crop, which finished at a $6.28 harvest price. We work out the Revenue Protection guarantee for 35- to 55-bushel APHs at 70% to 85% coverage. We set it, net of an estimated premium built from 2026 Kansas rates, against five K-State wheat budgets repriced to October fertilizer. At 75% coverage, the guarantee covers cash costs plus rent once the APH reaches 35 to 47 bushels. Covering full cost, machinery included, takes an APH of 49 to 57. Basis can take about a tenth off the cash floor near the trigger. Below the trigger, a spring rescue application of nitrogen returns nothing.
- Corn Was 9.5 Cents of Every Dollar It Cost to Finish an Iowa Steer Sold in September. The Calf Was 68. A 50-Cent Corn Move Shifts a Feedlot Breakeven About $2.30/cwt; Feeder Cattle Have Moved the Equivalent of $4.49 Corn Since June.Iowa State's September closeout puts corn at $320.57 of a $3,357 steer and the 550-lb calf at $2,274. On a pen of 800-lb steers placed this week at the $342.98 CME Feeder Index, we estimate a $243/cwt breakeven against a $228.71 projected April sale, a loss of about $215 a head. Corn would have to fall about $3.11 a bushel to close that gap. K-State projects losses on every steer closeout month from September through June except May, after August closeouts lost $489 a head. The feeder-to-fed ratio is 1.48 against a 1.24 average. USDA raised 2026/27 feed and residual to 6.0 billion bushels, but August placements were the lowest since 1996, and the corn at risk is days on feed, not head count.
- Red River Beet Growers Were Paid $43.85 a Ton for 2025. At North Dakota's 28-Ton 2026 Yield, Covering 2024-Level Costs Takes About $56. Fifty Pounds of Excess Nitrogen Costs About $95 an Acre.American Crystal's forecast payment for the record 2025 crop is $43.85 a ton, down from $78. USDA now puts North Dakota's 2026 beet yield at 28.0 tons, 5.2 tons below last year, so covering FINBIN's 2024 cost of $1,563 an acre takes about $56 a ton. Midwest beet sugar for 2026-27 delivery was quoted at 44 to 48 cents a pound in July, 6 to 12 cents above the 2025 spot price. We estimate each cent is worth about $2.95 a ton to a grower, so the 2026 crop can close the gap. Nitrogen is the input to watch. NDSU's data show recoverable sugar falling as available N rises past 100 lb/acre. At the 2025 payment, 50 lb of excess N costs about $95 an acre in lost sugar and fertilizer, against $24 to $58 an acre for a full soil-tested fall rate.
- An Iowa Ethanol Plant Earns About $3.60 a Bushel Over Its Corn, 71 Cents More Than a Year Ago. Feed and Oil Return 48 Cents of Every Corn Dollar. The Plants Still Pay Only a Dime Over Iowa Elevators.At mid-October USDA prices, the ethanol, distillers grains and corn oil from one bushel are worth $7.95 at an Iowa plant, and the plant pays $4.36 for the corn. Distillers grains are up 44% from a year ago and cost more per ton than corn. Co-products gained 58 cents a bushel while corn rose 46, so net corn cost per gallon fell. After energy and operating costs, we estimate the plant nets 55 to 65 cents a gallon, about three times the 2025 average. The margin rests on $3.50 gasoline, and ethanol stocks are 1.3 million barrels above a year ago. Little of it reaches the corn bid: plants pay 11 cents over country elevators in Iowa, 16 in Indiana, 27 in Illinois and nothing in Nebraska.
- A Diesel Pivot Costs $16.58 to Pump an Acre-Inch at October's Record Farm Diesel. Controlled Electric Does It for $3.37 to $4.39, and Natural Gas for $2.91.On the Nebraska Pumping Plant Performance Criteria, a 125-acre pivot lifting from 150 feet at 40 psi burns about $22,800 of diesel in an 11-inch season at $5.76 a gallon. The same water costs $4,600 to $9,200 on five 2026 public-power and co-op irrigation tariffs, $12,800 on propane and $4,000 on natural gas. Converting to electric pays back in about 2 to 5 years within a mile of three-phase at today's diesel, but at half a mile it needs diesel to average above $4.16 to pay back in five. A pumping-plant tune-up is worth about $3,200 a year on a diesel well and under $900 on electric.
- DEF Ran 1.7% to 8.5% of Diesel Burn in Nebraska Tests, or $0.68 to $18 an Engine Hour. Where a Farm Buys It Moves That Bill More Than Urea Does: A $100-a-Ton Urea Move Adds About 15 Cents a Gallon.Bulk co-op DEF was posted at $1.99 a gallon this fall, truck-stop pumps at $4.60 to $4.90, and 2.5-gallon jugs at $3.60 to $7.60. OECD tests run in Nebraska show SCR-only engines burning about 8.5 gallons of DEF per 100 of diesel, against 1.7 to 5.8 for the tested Deere tractors. On a corn-soybean rotation that is $0.12 to $1.89 an acre. A heated bulk station pays only above about 725 to 1,215 gallons a year, and for most farms shelf life, not price, decides how big the tank should be.
- Iowa Propane Asks Spanned 37 Cents a Gallon in September, and Tank Rent Runs $0 to $225 a Year. An Owned 1,000-Gallon Tank Pays From About 2,400 to 3,700 Gallons If Shopping Saves 18 Cents. A 30,000-Gallon Transport Tank Needs 33,000 to 58,000.Iowa wholesale propane rose 19 cents in two weeks to $1.190 on October 19, 68% above a year ago, while the residential price rose 7 cents. The rent on a leased tank is the small part of the deal. The large part is that state law lets only the tank's owner fill it. Owning pays when local suppliers' prices are far apart or when the tank can take a transport load. It does not change what a farm pays in a shortage unless the tank is big enough to wait one out.
- Co-op Three-Phase Lines Run $9 to $17 a Foot. A 50 HP Fan's Converter Costs $13,000 to $21,000 Over 15 Years, So the Line Loses Past About Half a Mile.Published co-op rules put a new three-phase line at $9.00 to $16.71 a foot, about $47,500 to $88,000 a mile. A rotary or digital converter for a 50 hp dryer fan, installed and run 15 years, costs $12,900 to $21,300 on our model. The converter wins beyond roughly 0.15 to 0.6 miles. Its losses run $335 to $617 a year. An engine-driven fan costs about $10,000 a year more to run. The real limit on a converter is how many amps the single-phase line can carry.
- A Five-Pound Copper Build Needs Two Bushels of 2027 Spring Wheat a Year. A Foliar Quart Needs 1.8, Every Year. In 115 Prairie Trials, Soils Under 0.4 ppm Responded 87% of the Time.At a farm-store bag price, 5 lb of copper as copper sulfate costs $60 an acre spread: 8.6 bushels of December 2027 Minneapolis wheat in year one, about 2 a year over five. It pays on sandy, low-organic-matter, high-pH or peat ground under the provincial and state thresholds, if it is worked in. Canola and corn on mineral soils are not the target.
- KTS Prices Potash at $1.12 to $1.69 a Pound Once Its Sulfur Is Credited, Against 42 Cents in Muriate. A 4-Gallon Corn Starter Has to Return 2 to 4 Bushels to Pay.The last public KTS price is Green Markets' $715 a ton FOB in the Eastern Corn Belt, from May 2025, so we model KTS at $715 to $1,000. Against October 2026 potash and Oklahoma ATS, the same potash and sulfur cost $1.60 to $2.90 an acre more in a 3-quart pop-up, $8.60 to $15.50 more in a 4-gallon 2x2 starter and $21 to $39 more in a 10-gallon band. Both programs deliver the same sulfur, so only the placement of the potassium can pay that premium. We found no university trial that has measured a placement benefit for KTS.
- A Dry Ton of Biochar at North Carolina's $160-a-Yard Average Has to Return 208 Bushels of Corn. Temperate Field Trials Average a 0.2% Yield Response, and the Nutrients and Lime in a Ton Are Worth About $10.North Carolina's September 2026 supplier survey puts delivered woody biochar at $66 to $250 a cubic yard, or $396 to $1,500 a dry ton at USDA-ARS's 6.0 yards per ton. At a 4-ton rate that is $1,653 to $6,069 an acre spread, or 46 to 167 bushels of extra corn every year for ten years at $4.70. The largest meta-analysis of field trials finds a 0.2% response in temperate climates. Carbon credits mostly pay the producer. Only the cheapest supply with full NRCS cost share brings the hurdle near a yield gain the trials can show.
- A 500 mL Bottle of Nano Urea Holds 20 Grams of Nitrogen. The 45 kg Bag It Claims to Replace Holds 20.7 Kilograms, and at India's Own Price That Nitrogen Costs $54 a PoundIFFCO's 4% liquid nano urea carries about 1/1,000th of the nitrogen in the bag it was sold to replace, and its 20% successor about 1/200th. Priced at ₹225 a bottle, that works out to $54 and $11 a pound of N, against 73 cents for urea at October U.S. retail. Punjab Agricultural University measured 13% to 21.6% yield losses when half the soil N was swapped for sprays. A 2026 review of 194 papers found the workable cut is 20% to 25%, and a 21-site Indian trial found a plain 5% urea spray did the same job. No North American registration or retail price turned up in our search.
State of the Industry
Last week's column found the urea barge rising while grain fell. This week grain fell harder, retail nitrogen edged up again, and the wholesale benchmarks we can see went sideways. The ratio moved against the grower, and it was the crop side that moved it.
Grain took the hit. December corn settled at $4.56 on October 23, 18¼ cents lower on the week. December Chicago wheat lost 35½ cents to $6.25, and November soybeans slipped 4¾ cents to $12.56½ [2][13]. North-central Illinois elevators bid an average $4.20 for corn, about 19 cents lower, and $12.23 for soybeans [2]. Corn harvest is still behind: 44% was out by October 18 against a 52% average, with Iowa at 26% against 50%. Soybeans, at 64%, have caught up to the 65% average [8]. Exports are the offset. Inspections of soybeans bound for China out of the Pacific Northwest reached 682,779 tonnes in the week to October 15, the most from those terminals since November 2024 [9].
Nitrogen at retail keeps catching up with the barge. DTN's October 12–16 survey put anhydrous at $987 a ton, urea at $674 and UAN32 at $486. All three are up on the month, and anhydrous is 18% above a year ago [1]. At the Gulf, the October urea futures contract last settled at $436.75 a short ton and March 2027 at $460 [4]. The Trading Economics urea benchmark eased 1.0% on the week to $453 a tonne [5][13]. Retail urea now sits about $237 over the October contract (our arithmetic; the two prices are from different weeks). A ton of anhydrous costs about 235 bushels of north-central Illinois corn, against about 223 a week ago (our arithmetic). The risk to supply sits abroad. An S&P Global Institute report puts about 29% of global urea trade through the Strait of Hormuz [10], and StoneX expects Brazilian nitrogen to stay firm into safrinha buying [11].
Phosphate is flat at wholesale and short abroad. The DAP benchmark held at $802.50 a tonne for a month [6]. Retail DAP averaged $937 and MAP $981 [1]. In India, Haryana suspended a major importer's authorization to sell non-subsidized fertilizer after DAP rakes were allegedly diverted, a sign of how tight rabi supply is [14].
Potash steady, sulfur still falling. Retail potash was $503, up $8 on the month [1], and StoneX calls potash the stable leg in Brazil [11]. The China-denominated sulfur benchmark fell another 7.6% in a week and is 27% below a month ago [7][13]. We found no public fourth-quarter Tampa sulfur or November Tampa ammonia settlement.
Freight eased, fuel did not. The Illinois River barge rate fell to 773% of tariff, $35.87 a ton, still 22% above a year ago. U.S. diesel rose 9.7 cents to $6.276 a gallon, $2.66 above last year [9]. Illinois distributors asked an average $5.76 for farm diesel [3].
What to watch. MIAX's physically settled NOLA urea, DAP, MAP and potash futures began trading October 19 in 25-ton lots. No volume had been published at launch [12]. Today's Crop Progress and DTN's third-week October survey were not out as we closed.
| Benchmark | Level | Basis | Move |
|---|---|---|---|
| Anhydrous | $987/ton | Delivered retail, Oct 12–16 | +$42 MoM; +17.8% YoY |
| Urea | $674/ton | Delivered retail, Oct 12–16 | +$15 MoM; +13.3% YoY |
| UAN32 | $486/ton | Delivered retail, Oct 12–16 | +$28 MoM; +4.3% YoY |
| UAN28 | $441/ton | Delivered retail, Oct 12–16 | +$20 MoM; +6.5% YoY |
| 10-34-0 | $702/ton | Delivered retail, Oct 12–16 | −$16 MoM; +5.4% YoY |
| Anhydrous | $947.50/ton | Illinois distributor ask, FOB, wk Oct 16 | +$2.50 vs prior report |
| Urea | $436.75/st | CBOT U.S. Gulf futures, Oct 2026, last settle | Mar 2027 at $460.00 |
| Urea | $453/t | Benchmark, Oct 23 | −1.0% w/w; +19.8% YoY |
| DAP | $937/ton | Delivered retail, Oct 12–16 | +$12 MoM; +1.6% YoY |
| MAP | $981/ton | Delivered retail, Oct 12–16 | +$14 MoM; +5.3% YoY |
| DAP | $802.50/t | Benchmark, Oct 23 | 0.0% m/m; +4.6% YoY |
| Potash | $503/ton | Delivered retail, Oct 12–16 | +$8 MoM; +3.5% YoY |
| Potash | $515/ton | Illinois distributor ask, FOB, wk Oct 16 | −$1.36 vs prior report |
| Sulfur | 5,614 CNY/t | China-denominated benchmark, Oct 26 | −7.6% w/w; −27.4% m/m; +69.4% YoY |
| Dec corn | $4.56/bu | CBOT settlement, Oct 23 | −18¼¢ w/w |
| Nov soybeans | $12.56½/bu | CBOT settlement, Oct 23 | −4¾¢ w/w |
| Dec Chicago wheat | $6.25/bu | CBOT settlement, Oct 23 | −35½¢ w/w |
| Corn, cash | $4.20/bu | N-central Illinois elevator avg, Oct 23 | −19¢ w/w; +7.4% YoY |
| Soybeans, cash | $12.23/bu | N-central Illinois elevator avg, Oct 23 | −3¢ w/w; +21.2% YoY |
| U.S. diesel | $6.276/gal | On-highway retail, wk Oct 19 | +9.7¢ w/w; +$2.66 YoY |
| Illinois River barge | 773% of tariff | $35.87/ton, wk Oct 20 | 825% a week earlier; +22% YoY |
| Corn harvested | 44% | 18 states, Oct 18 | 52% five-year avg |
| Soybeans harvested | 64% | 18 states, Oct 18 | 65% five-year avg |
Sources: DTN/Progressive Farmer, Oct 21, 2026 (retail, Oct 12–16; month and year moves computed from the survey's month-ago and year-ago rows); USDA AMS Illinois Production Cost Report, Oct 16, 2026; Farmbucks quote page for CBOT U.S. Gulf urea futures, accessed Oct 26, 2026 (page notes no recent trades, so these are the last settlements shown); Trading Economics, accessed Oct 26, 2026 (urea and DAP, Oct 23; sulfur, Oct 26; week-on-week moves computed against the Oct 16 and Oct 19 prints in our last issue); USDA AMS Illinois Grain Bids, Oct 23, 2026 (CBOT settlements and cash bids; week-on-week moves computed against the Oct 16 figures in our last issue, year-on-year from the report's year-ago averages); U.S. diesel and barge rates as reported in USDA AMS Grain Transportation Report, Oct 22, 2026; USDA NASS Crop Progress, Oct 19, 2026. No weekly NOLA barge print for urea, phosphate or potash was public as we closed, and the November Tampa ammonia and fourth-quarter Tampa sulfur contracts are left out: we found no public settlement for either.
The week's verdict: fertilizer barely moved and corn fell 18 cents, so the bushel cost of a ton of anhydrous rose about 5% in a week; this fall the grain price, not the fertilizer price, is moving the input math.
References
- DTN/Progressive Farmer, "UAN32, UAN28 and Anhydrous Lead Fertilizer Prices Higher," Oct 21, 2026. https://www.dtnpf.com/agriculture/web/ag/crops/article/2026/10/21/uan32-uan28-anhydrous-lead-prices
- USDA Agricultural Marketing Service, Illinois Grain Bids, Oct 23, 2026. https://www.ams.usda.gov/mnreports/ams_3192.pdf
- USDA Agricultural Marketing Service, Illinois Production Cost Report (Bi-weekly), Oct 16, 2026. https://www.ams.usda.gov/mnreports/ams_3195.pdf
- Farmbucks, "Urea (US Gulf) Futures (CBOT UFV)," accessed Oct 26, 2026. https://farmbucks.com/futures/fertilizer/urea-us-gulf
- Trading Economics, Urea, accessed Oct 26, 2026. https://tradingeconomics.com/commodity/urea
- Trading Economics, Di-ammonium Phosphate, accessed Oct 26, 2026. https://tradingeconomics.com/commodity/di-ammonium
- Trading Economics, Sulfur, accessed Oct 26, 2026. https://tradingeconomics.com/commodity/sulfur
- USDA National Agricultural Statistics Service, Crop Progress, Oct 19, 2026 (week ending Oct 18). https://release.nass.usda.gov/reports/prog4226.txt
- USDA Agricultural Marketing Service, Grain Transportation Report, Oct 22, 2026. https://ams-prod.azureedge.us/sites/default/files/media/GTR10222026.pdf
- Fertilizer Daily, "Global food crisis risk builds as Hormuz cuts 29% of urea trade, S&P Global warns," Oct 20, 2026. https://www.fertilizerdaily.com/20261020-global-food-crisis-hormuz-sp-global-el-nino/
- Fertilizer Daily, "Brazil fertilizer prices diverge in Q4 as StoneX sees firm nitrogen, stable potash," Oct 22, 2026. https://www.fertilizerdaily.com/20261022-brazil-fertilizer-prices-q4-2026-stonex/
- Fertilizer Daily, "MIAX fertilizer futures go live with 4 physically settled NOLA contracts," Oct 21, 2026. https://www.fertilizerdaily.com/20261021-miax-fertilizer-futures-go-live-nola/
- Crop Root Zone, RZ-014, "State of the Industry" (Oct 16 CBOT settlements and cash bids, Oct 16 urea and Oct 19 sulfur benchmarks, and the prior week's anhydrous-to-corn ratio, with their original sources).
- Fertilizer Daily, "India DAP shortage deepens as Haryana suspends IPL sales over critical supply delays," Oct 22, 2026, relaying The Tribune. https://www.fertilizerdaily.com/20261022-india-dap-shortage-haryana-ipl-suspension/
Weekly Briefing
Fertilizer
Physically settled NOLA fertilizer futures start trading — MIAX listed urea, DAP, MAP and potassium chloride futures for physical delivery at New Orleans from the October 19 trade date, in 25-short-ton lots, after CFTC certification on October 1. Urea must be free-flowing granular with at least 46% nitrogen. A market-maker program covers urea, and no first-day volume or open interest had been published. CME already lists cash-settled fertilizer swaps. (Fertilizer Daily, Oct 21, 2026)
S&P Global puts 29% of urea trade through Hormuz — An S&P Global Institute report says about 29% of global urea trade, nearly half of seaborne sulfur and about 21% of merchant ammonia normally pass through the Strait of Hormuz. It also notes that four of Bangladesh's five urea plants have stopped since March for lack of LNG. The authors call a food crisis a risk, not a certainty, and say price effects may lag into 2027. A UN mechanism to move fertilizer ships through the strait still awaits U.S. and Iranian approval. (Fertilizer Daily, Oct 20, 2026)
India's DAP squeeze reaches the state level — Haryana suspended Indian Potash Limited's authorization to sell non-subsidized fertilizer after DAP rakes meant for Sirsa and Hisar were allegedly sent elsewhere. Punjab reported 160,000 tonnes of DAP in stock against a 550,000-tonne rabi requirement in late September. Wheat sowing in both states runs from late October to mid-November. (Fertilizer Daily, Oct 22, 2026, relaying The Tribune)
A small Saskatchewan potash module gets its operating approval — Buffalo Potash received provincial approval to complete and operate a 125,000-tonne-a-year solution-mining module at Disley, northwest of Regina, with first output targeted for early 2027. The company held C$15.1 million in cash at June 30 and says it needs more financing. It is proceeding without a feasibility study. (Fertilizer Daily, Oct 22, 2026, relaying MINING.COM)
Crops
USDA announces $8 billion Harvest Fuel Relief — The one-time payments, announced October 19, will cover part of modeled 2026 losses using planted acreage, ERS cost-of-production estimates and WASDE forecasts. Crop insurance is not required. Commodity-specific rates for Title I crops are due in November. Application dates, payment caps and per-acre rates have not been set. (Fertilizer Daily, Oct 23, 2026, relaying USDA)
Corn harvest trails, soybeans catch up — By October 18, 44% of corn and 64% of soybeans were harvested across 18 states, against five-year averages of 52% and 65%. Iowa had 26% of its corn out against 50%. Winter wheat was 63% planted against 69%, and 56% of corn was rated good to excellent. (USDA NASS, Oct 19, 2026)
Pacific Northwest ships China the most soybeans in nearly two years — Inspections of soybeans bound for China out of PNW terminals reached 682,779 tonnes on 10 ships in the week to October 15, the most since November 2024. Gulf cargoes to China are being routed around the southern tip of Africa because of Panama Canal congestion and restrictions, which widens the PNW's usual freight advantage. (USDA AMS Grain Transportation Report, Oct 22, 2026)
Red crown rot reaches 51 Illinois counties — Illinois Extension's soybean pathologist says the soilborne fungus Calonectria ilicicola, first found in Pike County in 2018, is now in 51 Illinois counties and has been detected in seven other states. Losses can reach 60% to 70% in severe patches. There is no sure control: the advice is to scout, sanitize equipment, plant infected fields last and ask dealers for variety ratings. (University of Illinois, via Phys.org, Oct 23, 2026)
Home & Garden
Prime your tomatoes with a mild heat wave — German researchers found that tomato plants given a moderate heat dose before severe, repeated heat set about 41% more fruit in controlled conditions and about 53% more in one field trial. The protection lasted 10 days but was gone by 20. One field season: the authors say the field result does not yet support firm conclusions. (The Plant Journal, via Phys.org, Oct 26, 2026)
Pick red peppers for sweetness, cook them for carotenoids — A Conversation explainer notes that red bell peppers stay on the plant about four weeks longer than green ones and come out sweetest. Orange and red carry the most vitamin C and beta-carotene. Cooking cuts the vitamin C but makes the carotenoids easier to absorb. (The Conversation, via Phys.org, Oct 24, 2026)
Let the fall wreath lead to a planted doorstep — A Conversation essay argues that the "doorscaping" trend could get more front yards planted. In Britain, the Royal Horticultural Society estimates 55% of front-yard space is paved, against 36% of back gardens. Containers, bulbs, hardy perennials and climbers are the low-effort start. (The Conversation, via Phys.org, Oct 22, 2026)
Micronutrients
Iron chelate lifts microgreen iron three- to fivefold — Penn State researchers fed five iron fertilizers through irrigation to soilless radish and pea microgreens. Fe-EDTA raised iron about 3–5 times in radish and 2–3 times in pea, with little effect on yield. Mixed red and blue LED light raised broccoli microgreen iron 15% to 20%. Greenhouse work on three species: human absorption was not measured. (Biological Trace Element Research and Horticulturae, via Phys.org, Oct 22, 2026)
Twenty non-essential elements outweigh molybdenum in plant tissue — A Texas A&M-led database of 5,474 plant samples from 73 countries, covering 52 elements, found 20 elements not considered essential at higher average concentrations than molybdenum, the scarcest essential nutrient in the set. The project started as a search for data on plants grown in simulated lunar and Martian soil. Descriptive only: a higher concentration does not show that an element helps the plant. (ACS Environmental Au, via Fertilizer Daily, Oct 26, 2026)
Sulfur falls another 7.6% in a week — The China-denominated sulfur benchmark was 5,614 yuan a tonne on October 26, 27% below a month earlier but still 69% above a year ago. We found no public settlement for the fourth-quarter Tampa molten contract. (Trading Economics, Oct 26, 2026)
Organics
Less tillage cuts N2O by up to 48% in organic transition — A three-year study of a soybean-wheat-corn rotation found the two lower-tillage organic transition systems emitted 37% and 48% less nitrous oxide than the most tillage-intensive one. Corn was the main source, at 11.2 kg of N2O-N a hectare a year. Yield effects were not reported in the published highlights, and that matters because organic growers rely on tillage for weed control. (Agriculture, Ecosystems & Environment, via Fertilizer Daily, Oct 23, 2026)
A microbial floor spray may cut barn ammonia — Wageningen researchers sprayed a microbial product on half of a dairy barn's slatted floor every four weeks. They estimate housing ammonia fell 30% or more, and volatile fatty acids in the slurry fell more than 60%. Not measured directly: emissions were inferred from manure composition, and higher slurry pH and ammonium could raise losses after spreading. (Wageningen University & Research, via Phys.org, Oct 25, 2026)
Manure, Bacillus and silica lift oat hay 25% on saline ground — A two-year Ningxia University trial combined 12 tonnes a hectare of cow-manure fertilizer, a Bacillus inoculant and silica powder on salt-affected soil. Hay yield from a salt-tolerant oat rose 25.2% over control, against 21.5% for manure alone. One site, three replicates, and pairwise combinations were not tested. (Frontiers in Microbiology, via Fertilizer Daily, Oct 21, 2026)
Up and Coming
AI ore sorting doubles potash grade, in one sample — Brazil Potash says AI-driven X-ray sorting raised a sample's KCl content from about 13% to about 27% at its Autazes project, with 1% to 2% KCl left in the rejects. Preliminary: it was a single small sample, and larger tests wait until commercial production. (Fertilizer Daily, Oct 23, 2026)
India's 1.1-million-tonne green ammonia conversion gets $100 million — AM Green Ammonia signed a $100 million loan, funded by JICA and administered by the Asian Development Bank, on October 15 to convert a former gas-based ammonia and urea plant at Kakinada to renewable power. Uniper holds a long-term offtake for up to 500,000 tonnes a year from 2028. Not yet producing. (Fertilizer Daily, Oct 23, 2026)
A Saskatchewan fertilizer-trading platform raises a Series A — ClearCost, founded in 2024, builds a bulk fertilizer marketplace that combines price discovery, logistics, payment and settlement. SaskWorks Venture Fund led the round with Motiv Ventures, and the amount was not disclosed. The company plans a North American relaunch in the first quarter of 2027. Early-stage: no transaction volumes were reported. (Fertilizer Daily, Oct 19, 2026)
Interesting
Short-line railroads get $400 million for grain routes — The FRA's CRISI program awarded more than $400 million to short lines that handle grain. About $100 million goes to track upgrades for 286,000-pound cars in six states. The Twin Cities & Western will get up to $22 million for 200 grain cars and track work. (USDA AMS Grain Transportation Report, Oct 22, 2026)
Fuel haulers may drive 16 hours a day until December 16 — FMCSA has waived standard hours-of-service rules for interstate drivers hauling gasoline and diesel, citing seasonal demand and global supply problems. Minimum rest periods still apply, and carriers with poor safety ratings are excluded. (USDA AMS Grain Transportation Report, Oct 22, 2026)
Listening for bees instead of trapping them — UMass Amherst researchers trained two neural networks on 594 field recordings from 43 northeastern sites. One detects bee activity, and the other separates honeybees from bumblebees, correctly identifying 93% to 97% of the bees in a sample. The authors say it complements lethal traps rather than replacing them, because many species can only be identified under a microscope. (Approaches in Entomology, via Phys.org, Oct 21, 2026)
Off the Wall Discovery
Saffron, 75 feet up, under solar panels — Colorado State researchers are growing saffron on a Denver rooftop. Early results suggest yield nearly doubles under the partial shade of solar arrays. The spice sells for $600 to $5,000 a pound but needs about 75,000 hand-picked flowers per pound. Very early: the researchers say it is not yet clear saffron can work as a supplemental crop, and no costs have been worked out. (Colorado State University, via Phys.org, Oct 23, 2026)
Plants that glow in two colors where they are infected — A team at the MRC Laboratory of Medical Sciences paired a red-shifted fungal luciferase with a green reporter so that Arabidopsis plants show the ratio of two colors, not just brightness, around infection sites. That corrects for metabolic changes that dim or brighten the glow. Model-plant lab work: "sentinel" crops that report nutrient status or disease remain an idea, not a result. (Nature Plants, via Phys.org, Oct 23, 2026)
Canadian Potash Crosses the Border at 0% Under Four US Tariff Layers, and USMCA Holds Up Only One of Them. A 50% Duty Would Add About $121 a Ton and $12 an Acre to a Corn-Soy Rotation.
As of Oct 26, Canadian muriate pays no US duty: the general rate is free, the IEEPA tariff is dead, the 10% Section 301 duty on Canada lists potassium chloride as a universal exemption, and the 50% Section 338 proclamations name potash as excluded. Only the Section 301 layer gives USMCA-qualifying goods a separate pass, and the Section 338 layer applies whether or not goods qualify, so the zero rests on executive lists rather than the treaty. Canada shipped 88% of US potassium chloride imports by volume in 2025. On a customs value of about $241 a short ton, a 10% duty would add $24 and a 50% duty $121, which works out to $2.45 and $12.24 an acre over a 210-bushel corn, 70-bushel soybean rotation.
Canadian muriate of potash crosses into the United States duty-free this week, and the reason is more fragile than most buyers assume. The ordinary US tariff on potassium chloride is free (USGS, Feb 2026) [11]. The 10% IEEPA tariff that applied to non-USMCA Canadian potash in 2025 ended when the Supreme Court struck the IEEPA tariffs down on Feb 20, 2026 (BDO, Feb 23, 2026) [6]. The 10% Section 301 "forced labor" duty that has applied to most Canadian goods since Jul 24 lists HTSUS 3104.20.00, potassium chloride, as exempt for every investigated economy (USTR, Jul 23, 2026) [3]. The 50% Section 338 duties signed Jul 20 exclude potash by name (White House, Jul 20, 2026) [1], and an Oct 23 proclamation that changes their product list from Oct 30 does not appear to have added it (GHY International, Oct 23, 2026) [2]. USMCA is a backstop under only one of these four layers. Canada supplied 88% of US potassium chloride imports by volume in 2025 (World Bank WITS, 2025) [12]. This piece sets out what each layer does, how dependent the US is on the product it covers, and what a duty would cost per ton and per acre if one of those exclusions were removed.
Our Oct 13 piece covered the fall price ladder from Nutrien's $430 Midwest posting down to the NOLA barge (Crop Root Zone, TRZ-0274, Oct 13, 2026) [20], and our Sep 18 piece covered the suspended Moroccan phosphate duty (Crop Root Zone, TRZ-0209, Sep 18, 2026) [21]. Neither is repeated here.
1. Four layers, four zeros, and only one runs through USMCA
What's new: Every US tariff measure that could reach Canadian muriate as of Oct 26 sets its rate at zero. They get there by different routes.
Evidence: The general rate is free for both potassium chloride lines, 3104.20.0010 (62% K2O or less) and 3104.20.0050 (more than 62%) (USGS, Feb 2026) [11]. Since that rate is free, a USMCA preference claim on potash saves nothing under ordinary tariff law.
The Section 301 action covers 60 economies. Canada is in the 10% group under heading 9903.05.29, and heading 9903.05.93 exempts Canadian goods entered duty-free under USMCA (GHY International, Jul 24, 2026) [4]. Annex II Part A of the USTR notice, which lists exemptions for "Goods of Any Investigated Economy," includes 3104.20.00 potassium chloride with no scope limitation. The same part also lists 3104.30.00 potassium sulfate, 3104.90.01 other potassic fertilizers, and the nitrogen and phosphate lines of chapter 31 (USTR, Jul 23, 2026) [3]. Canadian potash is therefore exempt from Section 301 whether or not it is entered under USMCA. We read the annex in a Canada-specific extract of the 431-page notice, which says it reproduces the pages verbatim. We did not read the full Federal Register version.
The Section 338 action is the one that ignores the treaty. The White House fact sheet says the 50% duties apply "whether or not a good qualifies" under USMCA, and it lists energy, potash, goods already under Section 232, and some other goods such as fish and critical minerals as exempt (White House, Jul 20, 2026) [1]. Argus, as relayed by trade press, reported that potash, sulfur and sulfuric acid were not on the lists of tariffed items (World Fertilizer, Jul 23, 2026; Fertilizer Daily, Aug 6, 2026) [9][10].
| Layer | Authority | Rate on Canadian goods | Treatment of Canadian MOP | Does USMCA status matter? |
|---|---|---|---|---|
| General (column 1) | HTSUS | Free on 3104.20 | Free | No: there is no duty to waive |
| Emergency tariff | IEEPA | 10% on non-USMCA potash in 2025 | Void since Feb 24, 2026; refunds being processed | Was the deciding test in 2025; now moot |
| Forced-labor action | Section 301, Trade Act of 1974 | 10% (9903.05.29) | Exempt under Annex II Part A | A second, independent exemption via 9903.05.93 |
| Discrimination action | Section 338, Tariff Act of 1930 | 50% on listed goods | Potash excluded from the lists | No: the duties apply regardless of USMCA |
Source: USGS Mineral Commodity Summaries, Feb 2026 [11]; BDO, Feb 23, 2026 [6]; USTR Section 301 notice, Jul 23, 2026 [3]; GHY International, Jul 24 and Oct 23, 2026 [2][4]; White House fact sheet, Jul 20, 2026 [1]. Basis: additional ad valorem duty on entered (customs) value. Crop Root Zone summary; not legal advice. Importers should confirm entries against CBP guidance.
Ground Truth: USMCA no longer decides whether potash pays a duty. Treaty status mattered most in 2025, when it separated a 0% entry from a 10% one under IEEPA. Since then, the zero has come to rest on two exclusion lists the executive can amend by proclamation: Annex II of the Section 301 notice and the exemption clause of Section 338. The 2027 USMCA joint review is the slower and less likely route to a change. The quicker route is an annex edit, which is how the Section 338 product lists were changed on Sep 15 and again on Oct 23. If potash were ever moved onto a Section 338 annex, a USMCA certificate would not help. If it were dropped from the Section 301 exemption, a USMCA claim would keep it at zero. For a retailer or importer, the cheapest step is to make sure every Canadian entry already claims USMCA. That covers the smaller risk in full and costs nothing.
2. How the zero was built, Mar 2025 to Oct 2026
What's new: The present zero is the fourth tariff arrangement Canadian potash has faced in 20 months, and the first in which potash is named as exempt rather than covered through treaty status.
Evidence: In March 2025, executive orders exempted USMCA-covered goods from the 25% IEEPA tariff on Canada and cut the rate on non-USMCA Canadian potash to 10%. Agriculture Secretary Brooke Rollins called that rate "strategic" (Farm Policy News, Mar 7, 2025) [7]. A Library of Parliament note dates the 10% non-CUSMA potash rate to Apr 2, 2025 rather than early March. Sources differ on the exact date, and both versions are reported here. The same note records that Nutrien said all of its potash is CUSMA-compliant and should cross tariff-free (HillNotes, Jun 5, 2025) [8].
The Supreme Court decided Learning Resources, Inc. v. Trump 6-3 on Feb 20, 2026, and CBP stopped collecting IEEPA duties on entries from Feb 24. A 10% Section 122 surcharge replaced them from Feb 24 to Jul 24. It exempted USMCA-qualifying goods and some fertilizers not produced in sufficient quantity in the US (BDO, Feb 23, 2026) [6]. Section 122 expired on Jul 24 and the Section 301 action began the same day, with Canada at 10% (RVIA, Jul 24, 2026) [5].
On Jul 1, USTR said the United States "did not agree to renew the USMCA in its current form." The agreement stays in force to 2036 and is now subject to annual joint reviews (Thompson Hine SmarTrade, Jul 6, 2026) [18]. Nineteen days later the Section 338 proclamations followed [1]. GHY dates their effective start to Aug 22, after a suspension of the original Aug 19 date. The fact sheet's 30-day clock and the trade press point to Aug 19 [1][2][9]. Both dates are reported here. Scope changes took effect Sep 15, and a further proclamation signed Oct 23 removes plywood, some paper products and certain machinery and adds valves, carpets and waste products from Oct 30. Potash appears on neither the added nor the removed list in GHY's summary [2]. GHY notes that it had not yet seen the full annexes or CBP guidance for the Oct 30 change, so this is a single, provisional source.
| Period | Measure | Non-USMCA Canadian MOP | USMCA-qualifying Canadian MOP |
|---|---|---|---|
| Mar 2025 – Feb 23, 2026 | IEEPA (Canada) | 10% | 0% |
| Feb 24 – Jul 23, 2026 | Section 122 surcharge | 0%* | 0% |
| Jul 24, 2026 – now | Section 301 forced-labor action | 0% (Annex II) | 0% |
| Aug 19/22, 2026 – now | Section 338, 50% | 0% (excluded) | 0% (excluded) |
Source: Farm Policy News, Mar 7, 2025 [7]; HillNotes, Jun 5, 2025 [8]; BDO, Feb 23, 2026 [6]; RVIA, Jul 24, 2026 [5]; USTR, Jul 23, 2026 [3]; White House, Jul 20, 2026 [1]; GHY International, Oct 23, 2026 [2]. *BDO describes the Section 122 fertilizer exemption as covering fertilizers not produced, or not produced in sufficient quantity, in the US. It does not name potash, so this cell is our reading of that language and not a quoted line. Basis: additional ad valorem duty.
One leftover from 2025 is money owed back. The Court did not order automatic refunds (BDO, Feb 23, 2026) [6]. Any importer that paid the 10% on non-USMCA potash before Feb 24 has a refund claim to pursue. We found no public figure for how much potash duty was actually paid, and since Nutrien said its tons were compliant, the amount may be small [8].
3. The dependence: 88% of the product, from one province
What's new: Three years of trade data show no move away from Canada. If anything, its share has held while total US imports have swung.
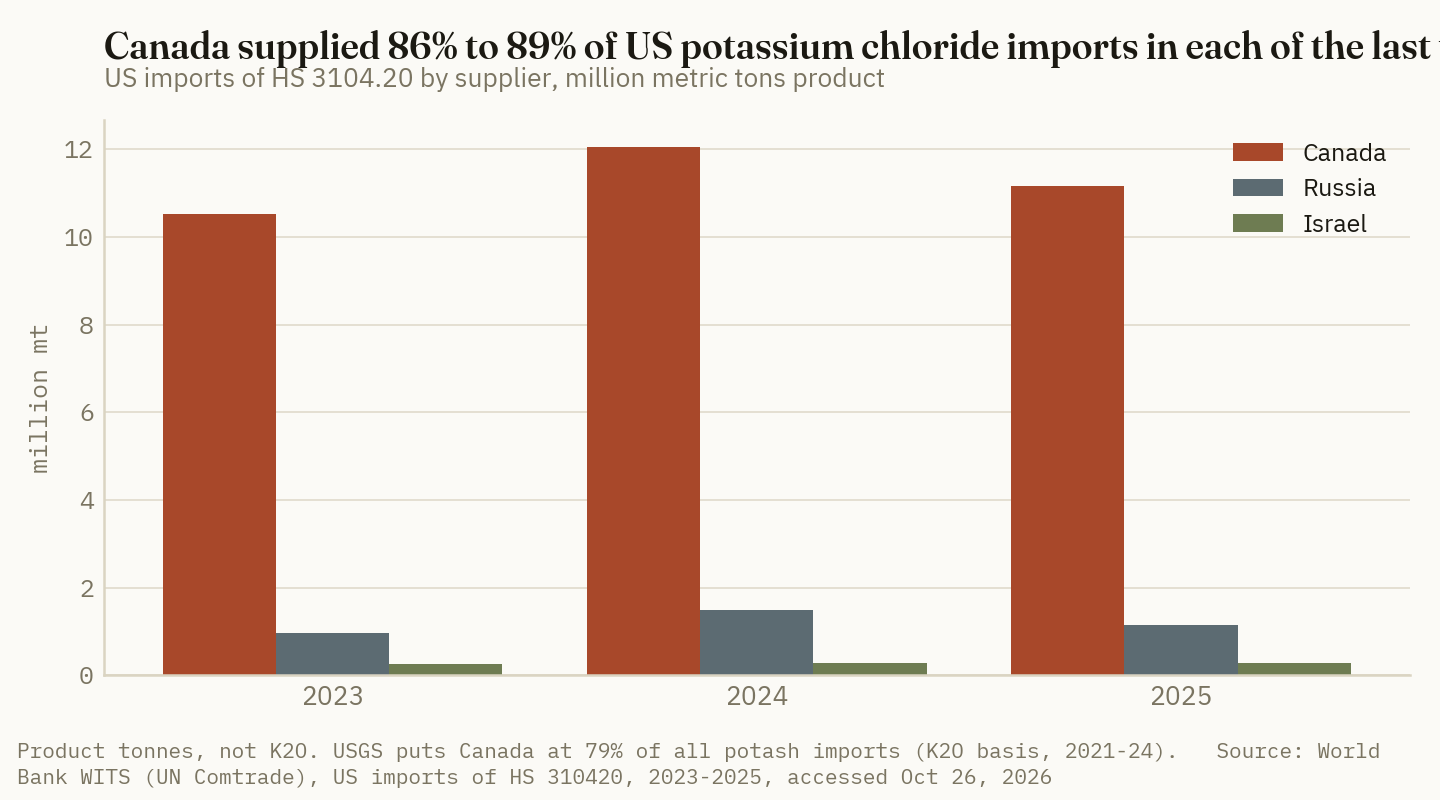
Evidence: US imports of HS 3104.20 were 11.85 million metric tons in 2023, 13.97 million in 2024 and 12.63 million in 2025. Canada supplied 10.53, 12.06 and 11.15 million, or 88.8%, 86.3% and 88.3% by volume. Russia was second each year at 8% to 11% (World Bank WITS, 2023–2025) [12]. The average customs value of Canadian tons was $345 a metric ton in 2023, $255 in 2024 and $266 in 2025. Russian tons averaged $326 in 2025 [12]. Percentages and unit values are Crop Root Zone calculations from the WITS totals.
USGS reports a lower figure: Canada at 79% of US potash import sources for 2021–24, with Russia at 12% and Israel at 3%. Its net import reliance was 92% to 94% of apparent consumption in every year from 2021 to 2025 (USGS, Feb 2026) [11]. The two figures measure different things. USGS works in K2O equivalent across all potash products over four years. WITS counts potassium chloride product tonnes only. Trade press uses "about 85%" (BNN Bloomberg, Aug 28, 2026) [19] and "about 90% of net imports" (Fertilizer Daily, Aug 6, 2026) [10]. We use 88% for muriate in 2025 and 79% for all potash in 2021–24, and we label each.
| Supplier, 2025 | Million mt KCl | Share of volume | |
|---|---|---|---|
| Canada | 11.15 | 88.3% | ██████████ |
| Russia | 1.14 | 9.0% | █░░░░░░░░░ |
| Israel | 0.29 | 2.3% | ░░░░░░░░░░ |
| All other | 0.05 | 0.4% | ░░░░░░░░░░ |
Source: World Bank WITS (UN Comtrade), US imports of HS 310420, 2025, accessed Oct 26, 2026 [12]. Shares are Crop Root Zone calculations; bars scaled to Canada = 10. Basis: product tonnes as reported, not K2O.
US production cannot fill the gap. Marketable domestic production was about 500,000 tons K2O in 2025, set against apparent consumption of 5.9 million, and more than 60% of US output is sulfate of potash and langbeinite rather than muriate (USGS, Feb 2026) [11]. The Canadian supply is also concentrated. All 11 active Canadian potash mines are in Saskatchewan [8], and Saskatchewan supplies more than 86% of the potash Canada sends to the US (BNN Bloomberg, Aug 28, 2026) [19].
The supplier's US business is substantial but shrinking as a share of its sales. Nutrien sold 2.21 million tonnes of potash into North America in the first half of 2026, against 5.25 million offshore. The North American volume was down from 2.35 million a year earlier. Its North American net selling price was $295 a tonne in the second quarter, against $259 offshore (Nutrien, Aug 5, 2026) [13]. The release does not mention USMCA and refers to tariffs only in its risk factors [13].
Political pressure on the Canadian side is real but divided. In late August, Ontario Premier Doug Ford said cutting off potash would hurt US agriculture quickly, and the federal NDP and Green leaders called for an export tax or withholding. Saskatchewan Premier Scott Moe rejected export taxes and withholding but said access to additional production could be used in negotiations (BNN Bloomberg, Aug 28, 2026) [19]. A CBC report on Moe's later comments about Belarusian potash returned a 403 error and was not used.
Ground Truth: The supply risk with the bigger price effect for US potash sits in Regina and Ottawa, not Washington. A US duty on Canadian muriate would raise US prices. A Canadian export tax would do the same, and the US tariff exemptions could not prevent it. For now the province that produces the tons has ruled it out, and the province pushing for it produces none. Moe's "additional production" offer is worth watching for a quieter reason: if BHP's Jansen tonnage, expected to start in 2026 [8], is held back from US-bound contracts as a bargaining chip, the effect would appear as a firmer NOLA basis, not a tariff line.
4. What a duty would add, per ton and per acre
What's new: None of these duties applies today. We price the three rates that have actually been used on Canadian goods: 10% (IEEPA potash in 2025, and the Section 301 rate on Canada), 25% (the IEEPA general rate) and 50% (Section 338).
Evidence: An ad valorem duty is charged on the entered (customs) value, not the retail price. We use two bases. The first is the 2025 average customs value of Canadian potassium chloride, $265.75 a metric ton or $241 a short ton [12]. Nutrien's second-quarter North American net selling price of $295 a tonne ($268 a short ton) [13] falls close to it. The second is the NOLA barge, which last traded at $340–$355 a short ton FOB on Oct 16, $347.50 at the midpoint (Advanced Turf Solutions, Oct 19, 2026) [15]. That is the price at which offshore tons compete, and it is a reasonable upper case for how far a duty could carry into US wholesale pricing. Retail averaged $503 a ton in DTN's Oct 12–16 survey, up from $495 a month earlier and $486 a year earlier (DTN/Progressive Farmer, Oct 21, 2026) [14].
| Duty rate | On customs value, $/st | On NOLA barge value, $/st | Retail increase if duty passes through at customs basis | |
|---|---|---|---|---|
| 10% | 24.11 | 34.75 | +4.8% | █░░░░░░░░░ |
| 25% | 60.27 | 86.88 | +12.0% | ███░░░░░░░ |
| 50% | 120.54 | 173.75 | +24.0% | ███████░░░ |
Source: Crop Root Zone calculations. Customs value from World Bank WITS 2025 Canadian unit value, $265.75/mt converted at 1.10231 st/mt [12]; NOLA barge midpoint $347.50/st FOB, Oct 16 [15]; retail $503/st, DTN Oct 12–16 [14]. Bars scaled to the 50% NOLA-basis case = 10. Scenario, not a forecast. Retail percentage assumes a fixed dollar pass-through on $503.
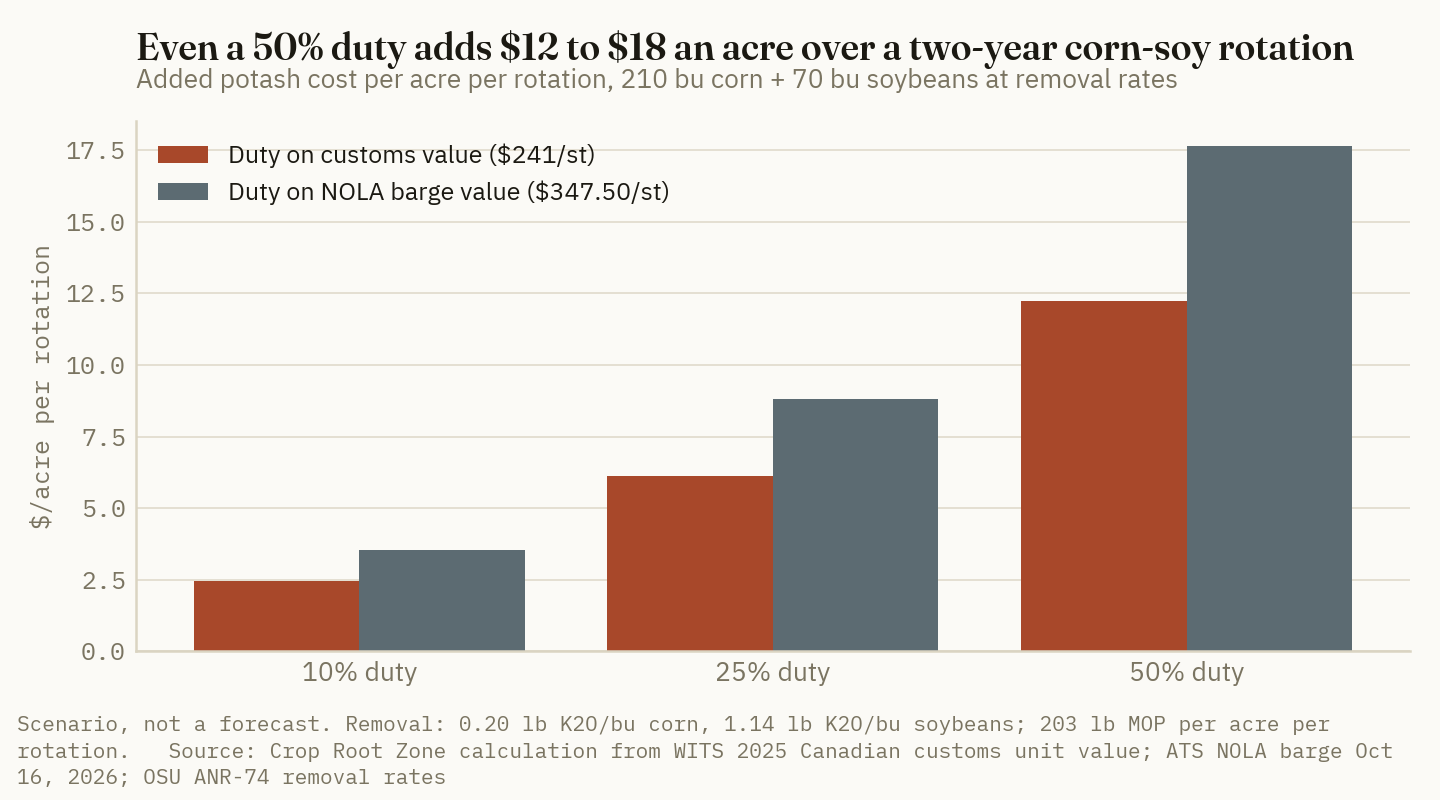
For the per-acre figures we use removal rates of 0.20 lb K2O per bushel of corn grain and 1.14 lb per bushel of soybeans (Ohio State University Extension, ANR-74, Jun 14, 2019) [16]. A 210-bushel corn crop then removes 42.0 lb of K2O and a 70-bushel soybean crop 79.8 lb, so replacing removal takes 121.8 lb of K2O, or 203 lb of 0-0-60, over the two years. At $503 retail that is $0.419 a pound of K2O and $51.05 an acre per rotation before any duty. Our Oct 13 piece used Iowa State coefficients and came out slightly higher [20].
| Duty rate | Basis | Corn year, $/acre | Soybean year, $/acre | Rotation, $/acre | Rotation cost vs $51.05 baseline |
|---|---|---|---|---|---|
| 10% | Customs value | 0.84 | 1.60 | 2.45 | +4.8% |
| 10% | NOLA barge | 1.22 | 2.31 | 3.53 | +6.9% |
| 25% | Customs value | 2.11 | 4.01 | 6.12 | +12.0% |
| 25% | NOLA barge | 3.04 | 5.78 | 8.82 | +17.3% |
| 50% | Customs value | 4.22 | 8.02 | 12.24 | +24.0% |
| 50% | NOLA barge | 6.08 | 11.55 | 17.64 | +34.6% |
Source: Crop Root Zone calculations from OSU ANR-74 removal rates [16], WITS 2025 customs value [12], ATS NOLA barge Oct 16 [15] and DTN retail Oct 12–16 [14]. Basis: 0.035 st MOP an acre in the corn year, 0.0665 st in the soybean year. Removal-rate maintenance on soils testing Optimum; not a rate recommendation. No spreading charge. Scenario, not a forecast.
$12.24 an acre
What a 50% duty on Canadian muriate would add to a two-year, 210-bushel corn and 70-bushel soybean potash program, priced on 2025 customs value. A 10% duty would add $2.45. (Crop Root Zone calculation from World Bank WITS 2025 and OSU ANR-74)
For scale, retail potash has risen $17 a ton in the past year with no tariff involved [14]. On the same program that is about $1.73 an acre per rotation, so a 10% duty on customs value would cost roughly 1.4 years of this year's drift. At the national level, 10% of the $2.96 billion of Canadian potassium chloride that entered in 2025 [12] is about $296 million a year, and 50% is about $1.48 billion. These are Crop Root Zone calculations that assume unchanged volumes.
Ground Truth: A tariff scare is not a good reason to pull potash purchases forward. A duty is charged at entry. Tons already brought into US terminals and warehouses for fall application and spring prepay have been entered and would not owe it, and a policy expert quoted in August pointed out that producers already hold US-side stocks [19]. The exposure is replacement tonnage for spring 2027 and later. Even the worst case on the table is $6 to $9 an acre in a single soybean year. A grower on soils testing Optimum who skips maintenance potash for one season to avoid a hypothetical duty will usually give up more than that. The decision that does change is for retailers: hold enough entered inventory to cover spring, and make sure every Canadian entry claims USMCA (see section 1).
5. What to watch, in date order
What's new: The next three months have fixed dates that could change the zero, and several open questions with no dates.
Evidence:
- Oct 30, 2026. The second Section 338 scope change takes effect. GHY's summary does not list potash among the additions, but the annexes and CBP guidance were not public when GHY updated its page [2]. Re-checking 3104.20 against the published Annex I is a five-minute task worth doing that week.
- Belarusian arrivals. The first 30,000-tonne Belarusian cargo in four years was due at New Orleans on Oct 14, and NOLA barges slipped to $340–$355 from $345–$360 on reports of Belarusian and Russian arrivals [15]. Section 301 Annex II Part A applies to goods of any investigated economy [3]. We did not establish whether Belarus is one of the 60 economies, so we make no claim about how its tons are treated. More non-Canadian tons at the Gulf would mean less Canadian leverage either way.
- Jan 12, 2027. Written comments and requests to appear for the 2027 USMCA joint review are due at 11:59 p.m. EST. USTR has not yet set the hearing date (USTR, Oct 2, 2026) [17]. Agricultural input groups that want potash's exemption treated as permanent rather than proclamation-by-proclamation have until then to say so on the record.
- No date: Canadian retaliation. GHY records about $20 billion of Canadian counter-tariffs from Sep 8, with a $27.6 billion figure elsewhere on the same page [2]. Neither touches potash leaving Canada. An export levy would be a separate decision, and Saskatchewan has said no [19].
- No date: IEEPA refunds. Refunds of the 2025 duty depend on CBP process and are not automatic [6].
| Date | Event | Possible effect on Canadian MOP | Source |
|---|---|---|---|
| Oct 30, 2026 | Section 338 scope change effective | None expected; potash not listed in summary | [2] |
| Ongoing | Belarus/Russia cargoes at NOLA | Barge pressure; dilutes Canadian share | [15] |
| Jan 12, 2027 | USMCA joint review comment deadline | Record for a permanent exemption | [17] |
| Jul 2027 (expected) | Annual USMCA joint review | Affects the Section 301 backstop only | [17][18] |
Source: as listed. Basis: event calendar; "possible effect" is the Crop Root Zone read. The July 2027 timing follows from the annual-review requirement and is not a date USTR has announced.
References
- The White House, "Fact Sheet: President Donald J. Trump Imposes Additional Tariffs on Canada," Jul 20, 2026 — https://www.whitehouse.gov/fact-sheets/2026/07/fact-sheet-president-donald-j-trump-imposes-additional-tariffs-on-canada/
- GHY International, "U.S. Imposes Section 338 Tariffs on Certain Canadian Imports (Further Scope Changes Effective Oct. 30)," updated Oct 23, 2026 — https://www.ghy.com/trade-compliance/us-imposes-50-section-338-tariffs-on-canadian-imports-dairy-alcoholic-beverages-and-motor-vehicles/
- Office of the US Trade Representative, "Notice of Actions in Section 301 Investigations ... Related to the Failure of Each Economy to Impose and Effectively Enforce a Prohibition on the Importation of Goods Produced with Forced Labor," Docket Nos. USTR-2026-0265 and -0266, Jul 23, 2026, Annex II Part A; read in the Canada extract compiled by the St. Gallen Endowment / Global Trade Alert — https://ricardo-dashboard.s3.eu-west-1.amazonaws.com/reports/forced-labour-section-301-final-action/economies/S301-FL_Canada.pdf
- GHY International, "Section 301 Forced Labor Tariffs on 60 Economies, Effective July 24 (CBP Guidance Available)," Jul 24, 2026 — https://www.ghy.com/trade-compliance/ustr-section-301-forced-labor-60-economies/
- RV Industry Association, "Section 122 Tariffs Replaced By New Section 301 Forced Labor Tariffs," Jul 24, 2026 — https://www.rvia.org/news-insights/section-122-tariffs-replaced-new-section-301-forced-labor-tariffs
- BDO USA, "Supreme Court Invalidates IEEPA Tariffs, Administration Replaces With New Surcharge: What Importers Need to Know," Feb 23, 2026 — https://www.bdo.com/insights/tax/supreme-court-invalidates-ieepa-tariffs-administration-replaces-with-new-surcharge-what-importers
- Farm Policy News (University of Illinois), "Trump Delays Some Mexico, Canada Tariffs, Lowers Potash Duty," Mar 7, 2025 — https://farmpolicynews.illinois.edu/2025/03/trump-delays-some-mexico-canada-tariffs-lowers-potash-duty/
- Library of Parliament, HillNotes, "Potash and the Canada–United States Trade Relationship," Jun 5, 2025 — https://hillnotes.ca/2025/06/05/potash-and-the-canada-united-states-trade-relationship/
- World Fertilizer, "New US tariffs on Canada exclude fertilizers" (citing Argus Media), Jul 23, 2026 — https://www.worldfertilizer.com/potash/23072026/new-us-tariffs-on-canada-exclude-fertilizers/
- Fertilizer Daily, report on the Section 338 tariffs and the potash and fertilizer exemption (citing Argus Media), Aug 6, 2026 — https://www.fertilizerdaily.com/20260806-us-section-338-tariffs-canada-potash-fertilizer-exempt/
- US Geological Survey, Mineral Commodity Summaries 2026, "Potash," Feb 2026 — https://pubs.usgs.gov/periodicals/mcs2026/mcs2026-potash.pdf
- World Bank WITS (UN Comtrade), United States imports of HS 310420 (potassium chloride) by partner, 2023, 2024 and 2025, accessed Oct 26, 2026 — https://wits.worldbank.org/trade/comtrade/en/country/USA/year/2025/tradeflow/Imports/partner/ALL/product/310420 (2023 and 2024 at the same path with the year changed)
- Nutrien Ltd., "Nutrien Reports Second Quarter 2026 Results," Form 6-K Exhibit 99.1, Aug 5, 2026 — https://www.sec.gov/Archives/edgar/data/0001725964/000119312526335517/d129364dex991.htm
- DTN/Progressive Farmer, "UAN32, UAN28 and Anhydrous Lead Fertilizer Prices Higher," Oct 21, 2026 — https://www.dtnpf.com/agriculture/web/ag/crops/article/2026/10/21/uan32-uan28-anhydrous-lead-prices
- Advanced Turf Solutions, "U.S. Fertilizer Market Summary 10/19/2026" (prices as of Oct 16, 2026) — https://www.advancedturf.com/wp-content/uploads/2026/04/ATS-Fertilizer-Market-Update-10_19_2026.pdf
- Ohio State University Extension, ANR-74, "Nutrients Removed with Harvested Corn, Soybean, and Wheat Grain in Ohio," Jun 14, 2019 — https://ohioline.osu.edu/factsheet/anr-74
- Office of the US Trade Representative, "USTR Seeks Public Comment on the 2027 Joint Review of USMCA," Oct 2, 2026 — https://ustr.gov/about/policy-offices/press-office/press-releases/2026/october/ustr-seeks-public-comment-2027-joint-review-usmca
- Thompson Hine SmarTrade, "USTR Issues Statement on Status of USMCA Review," Jul 6, 2026 (USTR statement of Jul 1, 2026) — https://www.thompsonhinesmartrade.com/2026/07/ustr-issues-statement-on-status-of-usmca-review/
- BNN Bloomberg (The Canadian Press), "Premiers at odds over leveraging potash in Canada's trade war with U.S.," Aug 28, 2026 — https://www.bnnbloomberg.ca/tariffs/2026/08/28/premiers-at-odds-over-leveraging-potash-in-canadas-trade-war-with-us/
- Crop Root Zone, TRZ-0274, "Nutrien's Midwest Potash Price Is $430, Up $35 to $45 Since Summer Fill. Retail Is $499, Up $6. A Ton Now Costs 113 Bushels of Iowa Corn, Not September's 102.," Oct 13, 2026.
- Crop Root Zone, TRZ-0209, "Washington Suspended the 16.60% Moroccan Phosphate Duty on July 8. Ten Weeks Later Retail DAP Is $923/st — $13 Higher Than the Week It Was Signed.," Sep 18, 2026.
Disclosures
Crop Root Zone is an independent publication. Nothing here is investment advice. Market calls, where included, reflect the editors' own read and are not a recommendation to buy or sell any security.
The River Freight Benchmark to Peoria Is $37.19 a Ton, Up 22% on the Year. In September the Illinois Barge Rate Was Bigger Than the Corn Belt's Whole Premium Over NOLA on UAN.
USDA publishes no upbound fertilizer barge rate, so we use the same-reach downbound rates as the benchmark: $23.63 a ton for St. Louis, $37.19 for Peoria and $49.52 for the Twin Cities on October 20, up 20% to 37% from a year earlier, with the biggest rise on the longest haul. Northbound loading drafts have not been cut on the Lower Mississippi, upbound fertilizer through Lock 27 ran 64% above last September, and Memphis is forecast to reach a carrier's low-water trigger on October 26. On our estimate, freight equalled about 72% of September's Corn Belt premium over NOLA for urea and more than all of it for UAN. That puts the inland premium, not the barge rate, under pressure this fall.
USDA put the cost of moving a ton of grain by barge from the Peoria reach of the Illinois River to the Gulf at $37.19 on October 20, 2026. A year earlier the same reach cost $30.52 (USDA AMS, Oct 20, 2026) [2]. The St. Louis reach was $23.63, up from $19.67. The Upper Mississippi between La Crosse and Minneapolis was $49.52, up from $36.21. USDA publishes those rates for grain moving south. It does not publish a rate for fertilizer moving north, and neither does any other free source we could find. Yet the same barges, on the same river, in the same weeks, carry the urea, UAN, phosphate and potash that land at New Orleans up to the terminals that supply Corn Belt retailers. This piece uses the public downbound rates to estimate what that upbound leg adds to a ton of NOLA fertilizer this October. It compares the result with recent seasons, sets it against the gap between NOLA and inland prices, and checks what the river is actually doing this week.
1. What a ton costs to move this October, and how we estimate it
What's new: All four upper reaches are dearer than a year ago, and the increase grows with distance. St. Louis is up $3.96 a ton, or 20%. Peoria is up $6.67, or 22%. The Quad Cities reach, Keithsburg to Savanna, is up $9.29, or 29%. The Minneapolis reach is up $13.31, or 37% (USDA AMS, Oct 20, 2026 and Oct 21, 2025) [2].
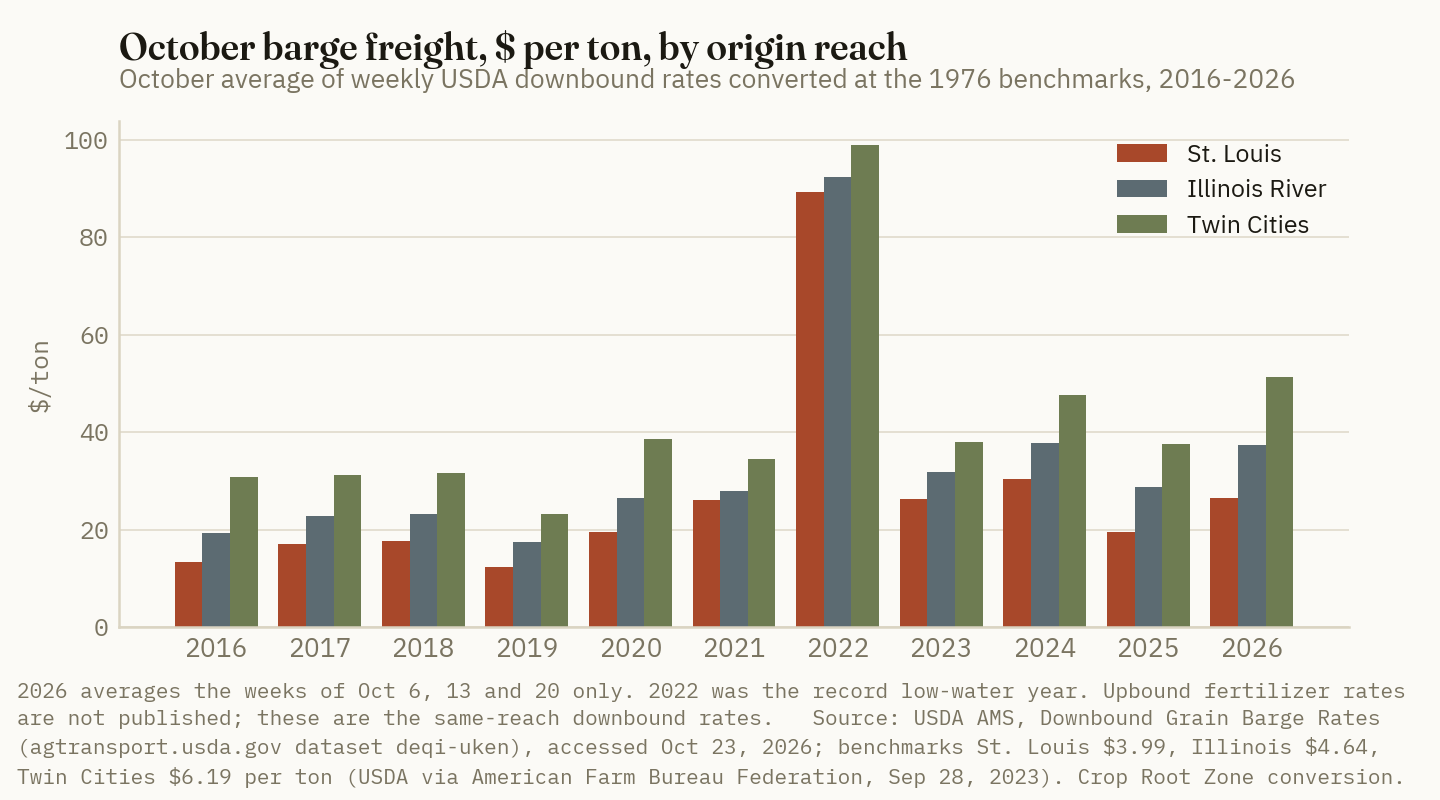
Evidence: USDA's per-ton series converts the weekly percent-of-tariff quotes into dollars using the 1976 benchmark rates: $3.99 a ton for St. Louis, $4.64 for the Illinois River and $6.19 for the Twin Cities (American Farm Bureau Federation, Sep 28, 2023) [8]. The St. Louis quote for the week of October 20 was 592.2% of tariff, the Illinois quote 773.1% and the Twin Cities quote 800% (USDA AMS, Oct 20, 2026) [1].
Method for the upbound estimate. The rate for a loaded barge going north is set privately between carrier and shipper. Two forces pull it in opposite directions. A fertilizer load fills a barge that would otherwise go north empty to collect grain, which argues for a discount. Against that, a northbound tow runs against the current, takes longer, and spends time at a fertilizer dock that it could have spent loading grain, which argues for a premium when barges are scarce. We do not know where between those two the market sits this month. So we treat the downbound rate for the same reach as the central estimate, and bracket it at 75% and 125% of that rate. The band is our assumption, not a market quote. We use it because it brackets both a backhaul discount and a scarcity premium of plausible size, and because the downbound rate is the only public price for moving a ton over that stretch of river.
| Reach (USDA per-ton series) | Oct 21, 2025, $/ton | Oct 20, 2026, $/ton | YoY | Upbound estimate, low–high, $/ton |
|---|---|---|---|---|
| Cape Girardeau–Grafton (St. Louis) | 19.67 | 23.63 | +20% | 17.72–29.54* |
| Hardin–Havana (lower Illinois River) | 29.44 | 35.87 | +22% | 26.90–44.84* |
| Kingston Mines–Peoria | 30.52 | 37.19 | +22% | 27.89–46.49* |
| Keithsburg–Savanna (Quad Cities reach) | 32.51 | 41.80 | +29% | 31.35–52.25* |
| La Crosse–Minneapolis | 36.21 | 49.52 | +37% | 37.14–61.90* |
Source: USDA AMS, Mississippi River System Downbound Grain Barge Per Ton Rates, weeks of Oct 21, 2025 and Oct 20, 2026 [2]. *Crop Root Zone estimate: 75% to 125% of the same-reach downbound rate. Not a quote. Excludes terminal unloading, storage and truck delivery from the river.
$37.19/ton
USDA's barge rate for the Peoria reach on October 20, up 22% from a year earlier. We use it as the central estimate of what it costs to move a ton of NOLA fertilizer up the Illinois River this month. (USDA AMS, Oct 20, 2026)
The October rates are not the highest on record. October 2022, the record low-water fall, averaged $89 a ton at St. Louis and $92 on the Illinois River by our conversion of the weekly quotes [1]. Against the seasons since, the picture splits by reach. St. Louis, at an average of $26.45 for the three October weeks so far, is level with October 2023 and below October 2024's $30.45. The Illinois River, at $37.31, is close to 2024's $37.83. The Twin Cities, at $51.25, is the highest October since at least 2016 outside 2022. In October 2023 the Twin Cities reach cost $11.55 a ton more than St. Louis. This October the gap is $24.80.
The forward quotes slope down. USDA's one-month quote for November was 560.9% of tariff at St. Louis and 671.9% on the Illinois River. Its three-month quote for January was 531.6% and 640.3% (USDA AMS, Oct 20, 2026) [3]. At the benchmarks, that is $22.38 and $31.18 a ton for November and $21.21 and $29.71 for January, by our conversion. The market expects freight to ease after harvest. Those quotes were set before the low-water forecasts in Section 3 hardened.
Ground Truth: The rise in freight is graded by distance, and so is the risk. A Peoria terminal pays about $7 a ton more than last year. A Minnesota terminal pays about $13 more and loses access when the Upper Mississippi closes for winter. If you buy off an Upper Mississippi terminal, expect its fall premium over NOLA to widen more than an Illinois River terminal's. Ask for the terminal's freight basis, not just the delivered price.
2. What freight adds to each product
What's new: The same dollar of freight is a much larger share of the price of a cheap product than of a dear one. Using the central estimate, river freight to Peoria is about 8% of the NOLA value of urea, about 11% for UAN and potash, and under 5% for DAP.
Evidence: NOLA barge prices in early October were $430 to $452 a short ton for urea, $805 for DAP and $345 to $360 for potash (Advanced Turf Solutions, Oct 5, 2026) [9]. The latest NOLA UAN figure we could source is the September average of $343 a short ton (USDA AMS/Green Markets, accessed Oct 23, 2026) [7]. The USDA series does not state the UAN grade.
| Product, NOLA barge | NOLA, $/st | Freight to St. Louis, % of NOLA | Freight to Peoria, % of NOLA | Basis |
|---|---|---|---|---|
| Urea | 441 (mid of 430–452) | 5.4%* | 8.4%* | FOB NOLA barge, Oct 2 |
| UAN | 343 | 6.9%* | 10.8%* | NOLA, Sep 2026 average |
| DAP | 805 | 2.9%* | 4.6%* | FOB NOLA barge, Oct 2 |
| Potash | 352.50 (mid of 345–360) | 6.7%* | 10.6%* | FOB NOLA barge, Oct 2 |
Sources: Advanced Turf Solutions, Oct 5, 2026 [9]; USDA AMS, Fertilizer Prices by Region (Green Markets), accessed Oct 23, 2026 [7]; USDA AMS per-ton barge rates, Oct 20, 2026 [2]. *Crop Root Zone calculation using the central freight estimates of $23.63 (St. Louis) and $37.19 (Peoria).
The more useful unit for a grower is the nutrient, because that is what is being bought. Urea carries 920 pounds of nitrogen per ton, UAN32 carries 640 and UAN28 carries 560. Potash carries 1,200 pounds of K2O. DAP carries 920 pounds of P2O5 plus 360 of nitrogen.
| Freight to Peoria, central estimate | ¢ per lb nutrient | |
|---|---|---|
| UAN28, per lb N | 6.64* | ██████████ |
| UAN32, per lb N | 5.81* | █████████░ |
| Urea, per lb N | 4.04* | ██████░░░░ |
| DAP, per lb P2O5 | 4.04* | ██████░░░░ |
| Potash, per lb K2O | 3.10* | █████░░░░░ |
Source: USDA AMS per-ton barge rate, Kingston Mines–Peoria, Oct 20, 2026 [2]. *Crop Root Zone calculation: $37.19 divided by pounds of nutrient per short ton. Bars scale 6.64¢ to ten blocks.
Per acre, these are small numbers. At 180 pounds of nitrogen, river freight to Peoria adds about $7.28 an acre as urea, $10.46 as UAN32 and $11.95 as UAN28, on the central estimate. The increase from last year is $1.31 an acre for urea and $2.14 for UAN28. Retail prices moved far more than that. DTN's survey for October 12–16 put urea at $674 a ton, up 13.3% from a year earlier, and UAN28 at $441, up 6.5% (DTN/Progressive Farmer, Oct 21, 2026) [10].
Ground Truth: Freight penalizes water. UAN28 is 72% water and other non-nitrogen material, and on a per-pound-of-N basis it pays 64% more river freight than urea does. In a year when freight is up 20% or more, that difference grows. It will not change a grower's choice of product by itself. But on Upper Mississippi terminals, where our high-end estimate exceeds $60 a ton, it is a reason to check the per-pound-N price of UAN against urea before you prepay.
3. What the river is actually doing: no northbound draft cut yet, but low water is a week away
What's new: As of October 23, northbound loading drafts are not reduced between the Gulf and Cairo, according to American Commercial Barge Line (ACBL). The carrier has cut tow sizes by 13%, or five barges, pending horsepower classification. It expects the Memphis gauge to reach 0.0 feet on October 26, when it will put its low-water protocol into effect and charge low-water surcharges under contract terms (ACBL, Oct 23, 2026) [11]. The amount of those surcharges is not public.
Evidence: The National Weather Service gauge at Memphis read 2.03 feet on the morning of October 23. The official forecast falls to −2.9 feet by November 2 and −5.2 feet by mid-November (NOAA, Oct 23, 2026) [12]. St. Louis read 8.54 feet, forecast to drop to 1.1 feet by November 4 (NOAA, Oct 23, 2026) [13]. The Army Corps' low-water action stages are −8.0 feet at Memphis and −3.2 feet at St. Louis. The record at Memphis since 1965 is −12.0 feet, set in 2023 (USACE Mississippi Valley Division, Sep 3, 2026) [14]. Neither gauge is at its action stage yet, and neither is forecast to reach it within the published horizon. DTN's meteorologist reported on October 22 that light rain through the end of October makes these forecasts "likely to be accurate" (DTN, Oct 22, 2026) [15].
| Gauge | Oct 23 reading, ft | Forecast, ft | Low-water action stage, ft |
|---|---|---|---|
| Mississippi at Memphis | 2.03 | −5.2 by Nov 16–18 | −8.0 |
| Mississippi at St. Louis | 8.54 | 1.1 by Nov 4 | −3.2 |
Sources: NOAA National Water Prediction Service, gauges MEMT1 and EADM7, Oct 23, 2026 [12][13]; USACE Mississippi Valley Division, Low Water Event Summary, Sep 3, 2026 [14].
The draft rules need care, because sources describe them differently. The Corps' September 3 summary recorded a Coast Guard safety advisory from September 7 that limited northbound barges between Lower Mississippi miles 953 and 303 to a 10-foot-6-inch draft and seven barges long [14]. A Louisiana trade report on October 23 described the 10-foot-6-inch northbound limit as still in force, applying from mile 869 (Louisiana Trade & Commerce, Oct 23, 2026) [16]. ACBL says its own northbound loading drafts are not reduced [11]. We could not find a current Coast Guard bulletin that settles the point. What the lock data show is that loads have not been cut. Excluding ammonia, upbound fertilizer barges through Mississippi Lock 27 at St. Louis averaged 1,687 tons in September 2026, against 1,685 in September 2025 (USDA AMS/USACE, accessed Oct 23, 2026) [4].
There is a reason a 10-foot-6-inch northbound limit matters less for fertilizer than for grain. The Upper Mississippi and the Illinois Waterway are maintained as 9-foot channels (Congressional Research Service, 2005) [17]. A barge bound for Peoria or Davenport is already loaded for that depth, so a Lower Mississippi limit set above it does not bind. The low-water costs that do reach fertilizer are smaller tows, slower transits and surcharges.
Lock work adds time. Lock 25 on the Upper Mississippi closed for 24 hours from October 21 for repairs. Peoria Lock on the Illinois has daily closures from 0700 to 1500 through October 23. ACBL has also issued its annual Upper Mississippi closeout guidance on final release and departure dates, and channel restrictions began October 19 for bridge work at Memphis, Lower Mississippi mile 734.7 [11].
Ground Truth: This October's risk to upbound fertilizer is not the draft limit. It is the calendar. The low-water protocol starts next week, and the Upper Mississippi closeout follows. Fertilizer not yet loaded at NOLA for Upper Mississippi terminals now has to clear a shrinking window with smaller tows and a surcharge. If your retailer is short on spring tons from a northern terminal, the cheapest time to fill was September.
4. The fertilizer moved early this year
What's new: Upbound fertilizer through Lock 27 totalled 640,430 tons in September 2026, up 64% from September 2025 and just below September 2024. Through Mississippi Lock 15 at the Quad Cities it was 432,500 tons, up 167%. Through Illinois River Lock 8 at LaGrange it was 187,310 tons, up 42% (USDA AMS/USACE, accessed Oct 23, 2026) [5].
Evidence: Nitrogen products made up most of the rise. Upbound tonnage in the urea, UAN and nitrogen-mixes category at Lock 27 was 401,810 tons in September, against 229,700 a year earlier [4].
| Upbound fertilizer, September, tons | 2023 | 2024 | 2025 | 2026 |
|---|---|---|---|---|
| Mississippi Lock 27 (St. Louis) | 535,800 | 695,200 | 390,200 | 640,430 |
| Mississippi Lock 15 (Quad Cities) | 205,400 | 370,000 | 161,800 | 432,500 |
| Illinois River Lock 8 (LaGrange) | 79,900 | 204,400 | 131,800 | 187,310 |
Source: USDA AMS, Monthly Grain and Fertilizer Barge Movements (data from U.S. Army Corps of Engineers), accessed Oct 23, 2026 [5].
The weekly counts at Lock 27 tell the same story from another angle. In the four September weeks, loaded northbound barges averaged 272 a week, against 214 in September 2025. Empty northbound barges averaged 92 a week, against 158. In the first three October weeks, loaded barges averaged 289 a week and empties 183. A year earlier the figures were 243 and 297 (USDA AMS, accessed Oct 23, 2026) [6]. Loaded northbound barges are not all fertilizer, so these counts are a guide, not a measure. But they fit the tonnage data. More of the northbound fleet has been carrying cargo and fewer barges have been running empty. That leaves less backhaul capacity available at a discount.
Ground Truth: The early movement is good news for supply this fall, and it tells us something about price. Shippers moved tons in September at freight rates near $31 a ton for St. Louis and $38 for the Illinois River (September averages, our conversion [1]). They did so rather than wait for the cheaper forward quotes. That suggests they valued getting tons in place before low water more than the few dollars of freight they might save. With fewer empty barges heading north, we think the upbound rate this fall sits in the upper half of our band, not the lower.
5. Freight against the inland premium: where the squeeze shows up
What's new: In September, the Corn Belt wholesale price was $53.12 a short ton above NOLA for urea, $34.50 for UAN, $55.00 for DAP and $48.75 for potash (USDA AMS/Green Markets, accessed Oct 23, 2026) [7]. The September Illinois River barge rate, our central freight estimate, averaged $38.16 a ton [1]. On that estimate, freight took about 72% of the urea premium and more than all of the UAN premium.
Evidence: The inland premium has to cover barge freight, unloading, storage, financing, the truck from the river terminal and the terminal's margin. Set against last year, the space left after freight has narrowed on every product we can measure.
| September | Illinois barge, $/st | Urea premium, $/st | UAN premium, $/st | DAP premium, $/st | Potash premium, $/st | Urea premium left after freight, $/st |
|---|---|---|---|---|---|---|
| 2023 | 37.67 | 61.60 | 49.28 | 57.60 | 48.70 | 23.93* |
| 2024 | 35.00 | 44.38 | 47.38 | 44.00 | 55.62 | 9.38* |
| 2025 | 31.15 | 66.00 | 51.25 | 58.75 | 45.62 | 34.85* |
| 2026 | 38.16 | 53.12 | 34.50 | 55.00 | 48.75 | 14.96* |
Sources: USDA AMS, Downbound Grain Barge Rates, September averages at the $4.64 Illinois benchmark [1][8]; USDA AMS, Fertilizer Prices by Region (monthly averages derived from Green Markets), Corn Belt minus U.S. Gulf NOLA [7]. *Crop Root Zone calculation. The barge figure is the downbound rate used as a stand-in for the unpublished upbound rate. Corn Belt UAN is also supplied by plants in the region, so its premium over NOLA is not set by barge freight alone.
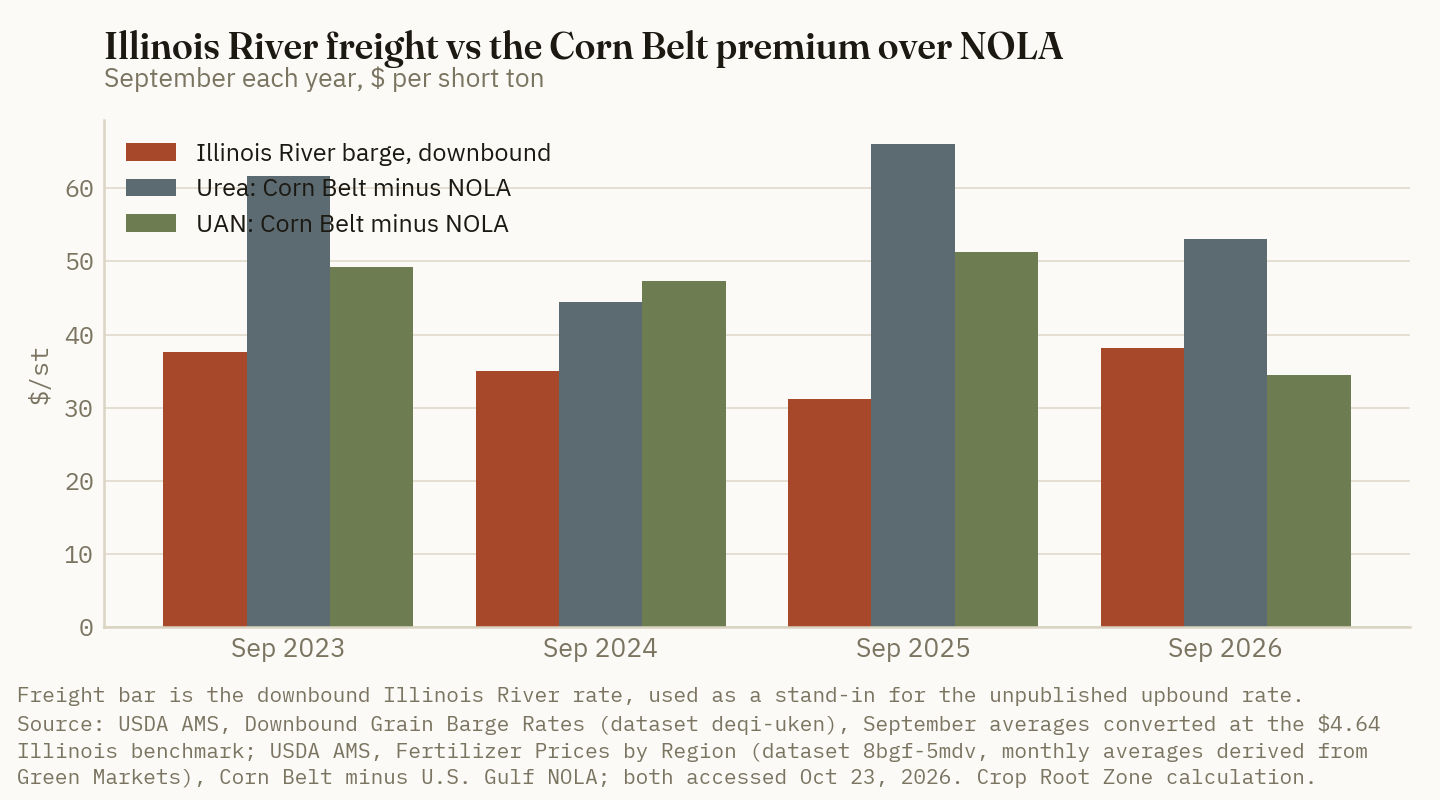
Terminal quotes from early October show the premium widening at the river terminal level. Eastern Corn Belt terminals offered urea at $500 to $525 a short ton FOB and Western Corn Belt terminals at $510 to $530. Corn Belt DAP terminals were at $855 to $865 and potash terminals at $400 to $420 (Advanced Turf Solutions, Oct 5, 2026) [9]. At midpoints, that puts terminal urea about $71.50 over the NOLA barge, DAP about $55 over and potash about $57.50 over, by our calculation. The urea terminal premium in early October was $18 above the September wholesale average premium.
Further down the chain, the barge is a modest share of the gap between NOLA and the farm. DTN's October 12–16 retail urea of $674 is $233 above the early-October NOLA midpoint. Freight to Peoria, at $37.19, is about 16% of that. For DAP the retail gap is $132 and freight is about 28%. For potash it is about $151 and freight is about 25% [9][10][2].
This is a different picture from 2022. In the low-water fall of that year, USDA economists found that urea prices at the Gulf fell about $100 a metric ton while prices upriver fell only half as much. They estimated that farmers might be paying $50 a ton more as a result (farmdoc daily, Nov 2, 2022) [18]. The mechanism was the same, an inland premium widening as river costs rose. The scale this year is much smaller, because October freight is between a third and two-fifths of its 2022 level.
Ground Truth: The squeeze is in the middle of the chain. Freight has risen about 22% on the Illinois River while the September wholesale premium over NOLA narrowed. That cannot last for terminals that buy at NOLA and ship by barge. Something gives, and the early-October terminal quotes suggest it is already giving. Terminal urea premiums are about $18 above the September average. Our read is that the inland premium widens by another $10 to $20 a ton through the closeout, even if NOLA stays flat. For a grower buying spring nitrogen off a river terminal, that means a flat NOLA barge price is not a reason to expect a flat delivered price.
What to watch, in order:
- Memphis on October 26. If the gauge reaches 0.0 feet as forecast, ACBL's low-water protocol and surcharges start [11]. A northbound draft cut below the 9-foot channel depth would be the first change that reduces fertilizer loads, not only tow sizes.
- The November forward quote against the spot rate. The forward curve slopes down today [3]. If the November quote rises above the spot rate, the market has started to price the low-water forecast.
- USDA's October fertilizer averages, due in November. A Corn Belt urea premium over NOLA above $60 a short ton would confirm that freight has passed into the inland price [7].
- October upbound tonnage at Lock 27. October 2025 was 762,900 tons [5]. A lower figure this October would mean the early movement in September brought tons forward rather than adding to them.
References
- USDA Agricultural Marketing Service, Downbound Grain Barge Rates (percent of tariff, weekly, by location; dataset deqi-uken), weeks of Sep 2016–Oct 20, 2026, accessed Oct 23, 2026 — https://agtransport.usda.gov/Barge/Downbound-Grain-Barge-Rates/deqi-uken
- USDA Agricultural Marketing Service, Mississippi River System Downbound Grain Barge Per Ton Rates (dataset 7spn-fbua), weeks of Oct 21, 2025 and Oct 20, 2026, accessed Oct 23, 2026 — https://agtransport.usda.gov/d/7spn-fbua
- USDA Agricultural Marketing Service, Downbound Grain Barge Rates: One Month Future Rates (dataset svms-9yya) and Three Month Future Rates (dataset uuhv-5etw), week of Oct 20, 2026, accessed Oct 23, 2026 — https://agtransport.usda.gov/d/svms-9yya and https://agtransport.usda.gov/d/uuhv-5etw
- USDA Agricultural Marketing Service, Monthly Fertilizer Barge Movements (tons and barges by product, lock and direction; data from U.S. Army Corps of Engineers; dataset 4pdq-r8e8), Sep 2025 and Sep 2026, accessed Oct 23, 2026 — https://agtransport.usda.gov/d/4pdq-r8e8
- USDA Agricultural Marketing Service, Monthly Grain and Fertilizer Barge Movements (data from U.S. Army Corps of Engineers; dataset sthp-khuk), upbound fertilizer, 2023–Sep 2026, accessed Oct 23, 2026 — https://agtransport.usda.gov/Barge/Monthly-Grain-and-Fertilizer-Barge-Movements/sthp-khuk
- USDA Agricultural Marketing Service, Upbound and Downbound Loaded and Empty Barge Movements (Count) (dataset w6ip-grsn), Mississippi Locks 27, Sep–Oct 2025 and 2026, accessed Oct 23, 2026 — https://agtransport.usda.gov/d/w6ip-grsn
- USDA Agricultural Marketing Service, Fertilizer Prices by Region (monthly averages derived from Green Markets; dataset 8bgf-5mdv), Corn Belt and U.S. Gulf NOLA, Sep 2023–Sep 2026, accessed Oct 23, 2026 — https://agtransport.usda.gov/d/8bgf-5mdv
- American Farm Bureau Federation, Daniel Munch, "Low Mississippi River Levels Drive up Grain Transportation Costs," Market Intel, Sep 28, 2023 (1976 tariff benchmarks by location and conversion method) — https://www.fb.org/market-intel/low-mississippi-river-levels-drive-up-grain-transportation-costs
- Advanced Turf Solutions, "U.S. Fertilizer Market Summary 10/5/2026" (NOLA barge prices as of Oct 2, 2026; Corn Belt terminal offers) — https://www.advancedturf.com/wp-content/uploads/2026/10/ATS-Fertilizer-Market-Update-10_5_2026.pdf
- DTN/Progressive Farmer, Russ Quinn, "DTN Retail Fertilizer Trends," Oct 21, 2026 (survey week Oct 12–16, 2026) — https://www.dtnpf.com/agriculture/web/ag/crops/article/2026/10/21/uan32-uan28-anhydrous-lead-prices
- American Commercial Barge Line, "American Currents" river conditions update, Oct 23, 2026 — https://bargeacbl.com/american-currents/
- NOAA National Water Prediction Service, Mississippi River at Memphis (MEMT1), observed stage and official forecast issued Oct 23, 2026 — https://water.noaa.gov/gauges/memt1
- NOAA National Water Prediction Service, Mississippi River at St. Louis (EADM7), observed stage and official forecast issued Oct 23, 2026 — https://water.noaa.gov/gauges/eadm7
- U.S. Army Corps of Engineers, Mississippi Valley Division, "Event Summary – Mississippi River Low Water," as of Sep 3, 2026 (low-water action stages, historic lows, Coast Guard safety advisory from Sep 7, 2026) — https://www.mvk-wc.usace.army.mil/mvd/lowwaterupdate.pdf
- DTN/Progressive Farmer, John Baranick, "Water Levels on Lower Mississippi River Starting to Run Low Again," DTN Ag Weather Forum, Oct 22, 2026 — https://www.dtnpf.com/agriculture/web/ag/blogs/ag-weather-forum/blog-post/2026/10/22/water-levels-lower-mississippi-river
- Louisiana Trade & Commerce, "873 Grain Barges in a Week: New Orleans Unloadings Climb 16% as Low Water Trims Harvest Tows," Oct 23, 2026 — https://www.louisianatradeandcommerce.com/post/mississippi-river-grain-barges-low-water
- Congressional Research Service, "Upper Mississippi River-Illinois Waterway Investments: Legislation in the 109th Congress," RL32915, 2005 (9-foot navigation channel) — https://www.everycrsreport.com/reports/RL32915.html
- Shawn Arita, Vince Breneman, Seth Meyer and Brad Rippey (USDA Office of the Chief Economist), "Low Mississippi River Barge Disruptions: Effects on Grain Barge Movement, Basis, and Fertilizer Prices," farmdoc daily (12):164, Nov 2, 2022 — https://farmdocdaily.illinois.edu/2022/11/low-mississippi-river-barge-disruptions-effects-on-grain-barge-movement-basis-and-fertilizer-prices.html
Disclosures
Crop Root Zone is an independent publication. Nothing here is investment advice. Market calls, where included, reflect the editors' own read and are not a recommendation to buy or sell any security.
Egyptian Urea Sold Near $505 a Tonne FOB in Mid-October, $24 Above the NOLA Barge Before It Even Leaves Port. Last Fall's CBAM Rush Put That Gap Above $80; This Fall It Is Europe's €90 Gas. Shipped to the Gulf, an Egyptian Cargo Would Land Roughly $50 to $65 Too High to Compete.
North African granular urea traded at $480 to $530 a tonne FOB in the week to October 16, while the October US Gulf futures contract sat at $436.75 a short ton, or $481 a tonne. Dutch gas above €90/MWh has pushed European urea production costs toward an estimated $780 a tonne, so Europe can pay Egypt's price and the US Gulf does not have to. That leaves NOLA priced off China, India and Russia this fall, and puts the level at which Mediterranean tonnes would start to compete for US spring supply at roughly $481 to $494 a short ton, $21 to $34 above the March 2027 futures.
The highest-priced urea origin on the market this October is on the Mediterranean, not the Mississippi. North African producers sold at $480 to $530 a tonne FOB in the week ending October 16, with prices climbing from about $480 to as high as $530 as traders covered short positions and European buyers returned in the face of rising gas costs (Australian Fertilizer Corporation, Oct 19, 2026) [1]. Egyptian cargoes had been reported around $505 a tonne FOB in early September and about $518 in mid-September, with producers targeting $525 (Australian Fertilizer Corporation, Sep 7 and Sep 21, 2026) [5][3]. On the US side, the October CBOT urea contract for the US Gulf settled the week at $436.75 a short ton on October 21, which is $481 a metric tonne (Farmbucks/CBOT, Oct 21, 2026) [24]. At the midpoint, Egyptian urea is worth $24 a tonne more at its own dock than US granular is worth on a barge in New Orleans. Before the product has paid a dollar of ocean freight, the Mediterranean is outbidding the Gulf. This piece sets out how that spread has moved over the past year, what holds the Egyptian price up, what sets the NOLA price instead, and what the gap implies for US spring urea and Corn Belt retail.
1. The spread: Egypt over NOLA, before freight
What's new: FOB Egypt and the NOLA barge have traded places three times in twelve months. A year ago they were close. The CBAM pre-buying rush in late October and November 2025 then sent Egypt above $500 FOB while NOLA averaged about $420 a tonne. In February 2026 NOLA was the higher of the two. In mid-March, at the height of the Hormuz shock, they were level at about $710. Since late July Egypt has been above NOLA every week we could document.
Evidence: No free source publishes a daily FOB Egypt series, so the comparison below is assembled from dated points. FOB Egypt is the price at an Egyptian load port, freight not paid. The NOLA barge is the price of product already discharged at New Orleans and loaded into a river barge, so it already carries ocean freight and discharge costs. A like-for-like comparison would add freight to the Egyptian price. We do that in the next section; the table shows the raw gap.
| Date | FOB Egypt, $/t | Egypt basis | NOLA, $/st | NOLA, $/t | NOLA minus Egypt, $/t |
|---|---|---|---|---|---|
| Sep 29, 2025 | 420–430 | Argus, Egypt to Europe | 370.00–387.50 | 408–427 | about −8 |
| Late Oct–early Nov 2025 | above 500 | Argus, pre-CBAM rush | 380.25 (Nov avg) | 419.15 | below −80 |
| Feb 27, 2026 | 480–485 | Argus assessment | 458.38 (Feb avg) | 505.27 | +20 to +25 |
| Mar 17, 2026 | 710–720 | Profercy, sales | above 645 | above 711 | about 0 |
| Jul 23, 2026 | 555 | AFC, Abu Qir sale | 401.20 (Jul avg) | 442.25 | −113 |
| Week to Aug 21, 2026 | 475 | AFC, Abu Qir sale | 398.13 (Aug avg) | 438.86 | −36 |
| Week to Aug 28, 2026 | about 490 | AFC, recent business | 398.13 (Aug avg) | 438.86 | −51 |
| Week to Sep 4, 2026 | about 505 | AFC, recent sales | 451.88 (Sep avg) | 498.11 | −7 |
| Week to Sep 18, 2026 | about 518 | AFC, last reported | 451.88 (Sep avg) | 498.11 | −20 |
| Week to Oct 16, 2026 | 480–530 | AFC, North Africa range | 436.75 (Oct futures, Oct 21) | 481.43 | −49 to +1; −24 at midpoint |
Sources: Egypt — Argus Nitrogen sample issue 25-52, Sep 29, 2025 [9]; World Fertilizer reporting Argus, Dec 11, 2025 [17]; Argus Media, Feb 28, 2026 [10]; Profercy, Mar 18, 2026 [11]; Australian Fertilizer Corporation (AFC) weekly updates, Aug 24–Oct 19, 2026 [1][3][5][6][7]. NOLA — Argus, Sep 29, 2025 [9]; Profercy, Mar 18, 2026 [11]; USDA AMS, Fertilizer Prices by Region (monthly averages derived from Green Markets), retrieved Oct 22, 2026 [23]; CBOT US Gulf urea futures, October 2026 contract, via Farmbucks, Oct 21, 2026 [24]. Conversion at 1.10231 short tons per metric tonne and spreads are Crop Root Zone calculations. Rows that pair a point sale with a monthly average are approximate. The July 23 Abu Qir sale is a single reported cargo; Fertilizer Daily, citing SunSirs data, put the early-July Egyptian peak at $448 FOB (Fertilizer Daily, Jul 17, 2026) [13], so July was volatile and the −113 figure overstates the month.
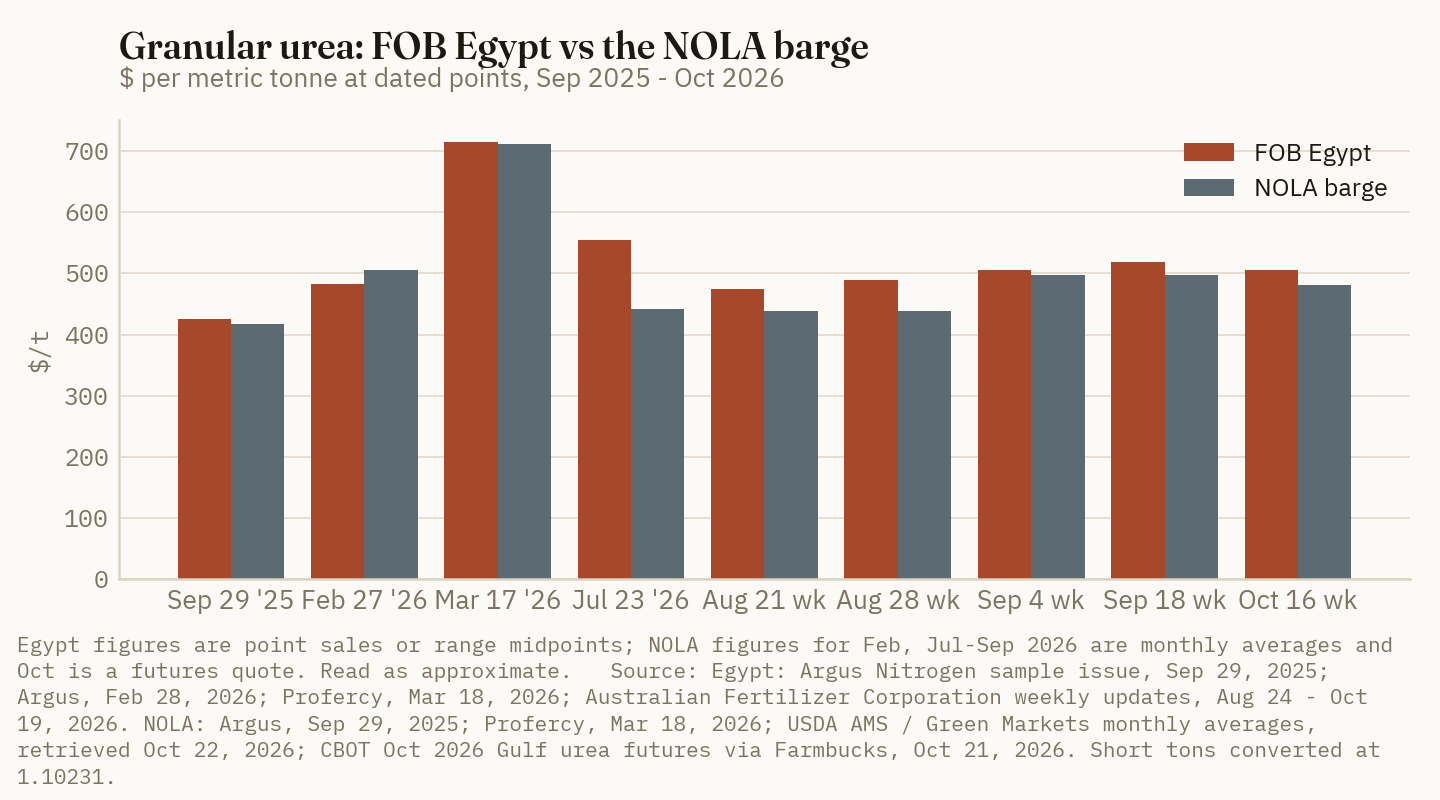
The pattern in the second half of 2026 is consistent. NOLA rose $53.75 a short ton from August to September, the steepest monthly gain since the spring spike (USDA AMS/Green Markets, retrieved Oct 22, 2026) [23]. Egypt rose faster, from seller targets of $450 to $460 in mid-August to $518 by mid-September [8][3]. Then NOLA gave back ground in October while North Africa held its range. Over the full year the two moved by similar amounts: Egypt's midpoint is up about $80 a tonne, or 19%, from September 29, 2025, and NOLA is up about $64, or 15%, from the same Argus reading [9][1][24], by our calculation. Neither move is out of line with the broader market. Trading Economics' urea benchmark, which does not state a delivery basis, was $444 a tonne on October 21, up 17.5% on the year and down 3.3% on the month (Trading Economics, Oct 21, 2026) [26].
$24/t
The mid-October premium of FOB Egypt granular urea over the NOLA barge, before Egyptian product pays any freight to reach the US. (Crop Root Zone calculation from Australian Fertilizer Corporation, Oct 19, 2026, and CBOT/Farmbucks, Oct 21, 2026)
Ground Truth: The sign of this spread matters more than its size. When FOB Egypt sits above a delivered US price, there is no arbitrage to argue about: Egyptian product will not come to the Gulf, and the Gulf is not bidding for it. The useful question for a US buyer is how far NOLA would have to rise before that changes. On our freight estimate, the answer is roughly $45 to $60 a short ton from the October futures. That is a buffer, not a threat.
2. Freight makes it wider: what an Egyptian cargo would cost at the Gulf
What's new: We found no public 2026 freight assessment for Egypt to the US Gulf. The last public freight table we could read, from an Argus sample issue, put Algeria to the US Gulf at $23 to $24 a tonne for 30,000-tonne cargoes, the Mideast Gulf to the US Gulf at $34 to $36 for 45,000 tonnes, and Egypt to the French Atlantic coast at $37 to $39 for 6,000-tonne parcels (Argus Nitrogen, Sep 29, 2025) [9].
Evidence: Egypt sits between Algeria and the Mideast Gulf in sailing distance to New Orleans, and the Mideast route also pays Suez transit. On that basis we use $25 to $40 a tonne as an estimated range for an Egyptian cargo to the US Gulf in fall 2026. That range is an estimate, not a quote, and freight could be higher this year given the vessel disruption around Hormuz.
| Delivered cost of an Egyptian cargo to the US Gulf | $/t | $/st |
|---|---|---|
| FOB Egypt, mid-October midpoint | 505 | 458.13* |
| Plus ocean freight, estimated | 25–40* | 22.68–36.29* |
| CFR US Gulf, implied | 530–545* | 480.81–494.42* |
| NOLA barge, October futures, Oct 21 | 481.43 | 436.75 |
| Shortfall: NOLA below Egyptian landed cost | 49–64* | 44.06–57.67* |
Sources: Australian Fertilizer Corporation, Oct 19, 2026 [1]; Argus Nitrogen, Sep 29, 2025, freight table [9]; CBOT/Farmbucks, Oct 21, 2026 [24]. *Crop Root Zone estimates and conversions. The barge price includes discharge and barge loading that a CFR price does not, so the true CFR-to-CFR gap is, if anything, a few dollars wider than shown.
The same arithmetic run a year ago gives a different answer. On September 29, 2025, Egypt was $420 to $430 FOB and the NOLA barge range was $408 to $427 a tonne [9]. With $25 to $40 of freight, an Egyptian cargo would then have landed about $18 to $62 above the barge as well, by our calculation. The difference is the level. In 2025 the gap reflected a slow European market and a weak Gulf. In 2026 it reflects a European market paying close to its own replacement cost.
Ground Truth: The roughly $481 to $494 a short ton band is the number to carry into the winter. It is our estimate of where NOLA would have to trade for Mediterranean urea to compete for US spring supply. Below it, the Gulf is supplied by other origins at other prices. Above it, Egyptian tonnes become one more source that can cap a US rally, provided Europe is not paying more.
3. What holds the Egyptian price up: Europe's gas, CBAM and Russian duties
What's new: The Dutch TTF front-month gas contract traded at €90.10/MWh on October 20, the first time above €90 since December 2022, up €2.06 on the day (Investing.com/Reuters, Oct 20, 2026) [21]. Australian Fertilizer Corporation reported the same week that European gas prices were at their highest since December 2022 and that curtailments at European ammonia plants were spreading [1].
Evidence: Egypt is Europe's largest outside urea supplier [17], so the Egyptian price is set by what a European buyer will pay rather than by the US. In mid-September AFC described Egyptian prices as "supported above USD 500/t FOB for European destinations" because of European production costs (Australian Fertilizer Corporation, Sep 14, 2026) [4]. Three things set that ceiling this fall.
First, European production cost. In late August, with September TTF above €66.50/MWh, Australian Fertilizer Corporation put break-even cost for an efficient European plant, before emissions, at about $605 a tonne ex-works for urea [6]. A week later, at gas near $24.50/MMBtu, it put the figure at about $650 and reported that one European producer was weighing curtailments [5]. At €90.10/MWh and the October 16 exchange rate of $1.1231 per euro (FRED, Oct 16, 2026) [27], gas is about $29.66/MMBtu by our conversion. Extending AFC's two cost points on a straight line gives roughly $780 a tonne for European urea at October gas. That is our estimate, not AFC's.
Second, the carbon charge. The EU's Carbon Border Adjustment Mechanism began charging imports in January 2026. Argus estimated that Egyptian urea would face an average levy of about €40 a tonne at then-current carbon prices (World Fertilizer/Argus, Dec 11, 2025) [17]. CRU put the added import cost from CBAM at roughly $40 to $60 a tonne (Nitrogen+Syngas/CRU, May 20, 2026) [18]. The Commission proposed in January a power to suspend CBAM on fertilizer imports (Quantum Commodity Intelligence, Jan 7, 2026) [28]; we found no public confirmation that a suspension has been adopted.
Third, Russian duties. On July 1, 2026, the EU's additional duty on Russian and Belarusian nitrogen fertilizers rose from €40 to €60 a tonne on top of a 6.5% ad valorem duty, on a schedule reaching €315 a tonne by 2028 (Commodity Board, Jul 7, 2026) [19]. CRU reported that Europe's share of Russian urea exports fell to 13% in 2025 [18]. Russian product that once set the floor in Europe now goes elsewhere, and Egypt and Algeria fill more of the gap. The EU also suspended its 5.5% to 6.5% MFN duties on urea and ammonia for one year from May 22, 2026, excluding Russia and Belarus (3tres3/EU Council, May 22, 2026) [20]. That narrows a duty edge Egypt has long held over Middle East urea in Europe, which Argus put at 6.5% (Argus Media, Mar 25, 2025) [29], but it does not change the Russian penalty.
| Granular urea, mid-October 2026 | $/t | |
|---|---|---|
| European urea production cost at Oct 20 gas, estimated | 780* | ██████████ |
| Egyptian urea landed in France, with CBAM, estimated | 588* | ████████░░ |
| FOB Egypt (North Africa range midpoint) | 505 | ██████░░░░ |
| NOLA barge (Oct futures, Oct 21) | 481 | ██████░░░░ |
| Brazil CFR, Chinese granular | 470 | ██████░░░░ |
| Oman granular FOB | 450 | ██████░░░░ |
| India tender, lowest CFR East Coast | 352 | █████░░░░░ |
| China prilled FOB, highest reported | 340 | ████░░░░░░ |
Sources: Australian Fertilizer Corporation, Aug 31, Sep 7, Oct 12 and Oct 19, 2026 [6][5][2][1]; Investing.com/Reuters, Oct 20, 2026 [21]; FRED DEXUSEU, Oct 16, 2026 [27]; World Fertilizer/Argus, Dec 11, 2025 [17]; Argus Nitrogen, Sep 29, 2025 [9]; CBOT/Farmbucks, Oct 21, 2026 [24]. *Crop Root Zone estimates. European cost is a straight-line extension of AFC's $605 (at $22.70/MMBtu) and $650 (at $24.50/MMBtu) points to $29.66/MMBtu. Landed France = $505 FOB + $38 freight (2025 Argus Egypt–French Atlantic rate, 6,000 t) + €40 CBAM at $1.1231. Bars scale $780 to ten blocks. Prices are on different bases and dates and are shown for scale only.
The gap between the first two bars is why European buyers keep paying. At an estimated $588 landed with carbon, Egyptian urea is still about $190 a tonne cheaper than urea made from European gas at €90. While that gap lasts, Egypt's price has room to rise, and NOLA does not set it.
Ground Truth: FOB Egypt is now, in effect, a European gas price with a carbon charge on top. For a US buyer that is useful, because it means the Mediterranean benchmark can rise sharply this winter on European weather without telling you much about US supply. Read Egypt as a gauge of how much competition Algerian and Nigerian granular will face from European buyers. Those origins do ship to the US Gulf, and they are the tonnes that link Europe's gas market to NOLA.
4. Egypt's own constraints: gas, a 10% export duty and a smaller export pool
What's new: Egypt replaced its $90-a-tonne levy on nitrogen fertilizer exports, imposed in May for three months, with a 10% ad valorem duty on FOB invoice value under Decree No. 258 of 2026, published June 25 with no expiry date (Fertilizer Daily, Jul 30, 2026) [14].
Evidence: At a $505 FOB sale, the new duty is $50.50 a tonne and the producer nets about $454.50, by our calculation. That is below the NOLA barge in metric terms. The duty is one reason Egyptian producers hold out for high prices: they keep only nine-tenths of each dollar.
Gas is the other. Egypt's own production of 4 to 4.2 billion cubic feet a day falls short of consumption of about 6 billion, and the gap is covered by Israeli pipeline gas and LNG imports. Gas allocations to fertilizer and petrochemical plants rose from about 650 million cubic feet a day in May to about 800 million in June. The price of gas to factories rose about 21% in April to $8.50/MMBtu (Al Manassa, Jun 21, 2026) [15]. The export council chairman said in March that gas makes up about 70% of urea and ammonia production costs, and that the government planned to link feedstock gas prices to international fertilizer prices (EnterpriseAM, Mar 31, 2026) [16]. After Israel halted gas exports at the start of the Iran war, producers told Argus they were still running at full rates. They also said they were not fully insulated from gas rationing (Argus Media, Mar 24, 2026) [12]. We found no public report of a new curtailment at Egyptian urea plants between July and October 2026.
| Egypt urea, export side | Figure | Basis |
|---|---|---|
| Urea capacity | 7.2–7.3 Mt/yr | Argus, Mar 24, 2026 [12] |
| Monthly volume left for export after domestic allocation | 350,000–400,000 t | Argus, Mar 24, 2026 [12] |
| Average exports, 2023–25 | about 4.5 Mt/yr | Argus, Mar 24, 2026 [12] |
| Exports, Jan–May 2026 | 1.22 Mt, −24% y/y | AFC, Aug 31, 2026 [6] |
| Largest market Jan–May 2026 | India, 319,000 t | AFC, Aug 31, 2026 [6] |
| Export duty at $505 FOB | $50.50/t* | 10% ad valorem [14] |
| Feedstock gas to factories | $8.50/MMBtu | Al Manassa, Jun 21, 2026 [15] |
*Crop Root Zone calculation.
The export figures show where the volume went. Shipments to several EU destinations fell after CBAM took effect, and India became Egypt's largest market in January–May, including 214,000 tonnes in May under an April Indian tender (Australian Fertilizer Corporation, Aug 31, 2026) [6]. Egypt's domestic season peaks from June to September [12], so export availability tends to rise in the fourth quarter. That is also when European buyers usually stock for spring.
Ground Truth: Egypt's 10% duty and its gas pricing plan both tie the producer's costs to the export price. When the price rises, the state takes more of it. That makes Egyptian sellers slow to discount and quick to follow Europe up, which keeps the spread to NOLA positive. We would not expect Egyptian prices to fall back to the NOLA level this winter unless European gas falls first.
5. What sets NOLA instead, and what it means for spring
What's new: With Europe paying above US levels, NOLA has been priced this fall by the eastern market. India's October 7 tender drew a lowest East Coast offer of $352.10 a tonne CFR, about $40 below the August tender. Chinese producers declined to sell at the implied $320 to $325 FOB, and India secured about 410,000 tonnes against an intended 1.7 million (Australian Fertilizer Corporation, Oct 12 and Oct 19, 2026) [2][1]. A fourth Chinese export tranche has been announced (Australian Fertilizer Corporation, Oct 5, 2026) [30]. On the Russian side, CRU reported the US took 23% of Russian urea exports in 2025, because tariff-free entry kept the market open [18]. On October 16 the White House waived most tariffs and sanctions under a new Russia sanctions law two days before they took effect; the reports we read did not mention fertilizer specifically (TNND, Oct 17, 2026) [22].
Evidence: The US Gulf futures curve on October 21 ran from $436.75 a short ton for October to $460 for March and April 2027, a seasonal rise of $23.25 [24]. Corn Belt wholesale urea averaged $505 a short ton in September, $53.13 over NOLA (USDA AMS/Green Markets, retrieved Oct 22, 2026) [23]. DTN's retail survey for October 5–9 put urea at $672 a ton, 12% above a year earlier (DTN/Progressive Farmer, Oct 14, 2026) [25]. The table holds October's $220.13 gap between that retail price and the September NOLA average fixed, and tests three spring barge levels, including the Egyptian landed-cost band from Section 2.
| NOLA urea by Mar 2027, $/st | Scenario | Implied retail urea, $/ton | $/lb N | Change at 150 lb N/acre vs Oct |
|---|---|---|---|---|
| 436.75 | October futures held flat | 656.88* | 0.714* | −$2.47* |
| 460.00 | March 2027 futures, Oct 21 | 680.13* | 0.739* | +$1.32* |
| 480.81–494.42 | Egyptian landed-cost band, estimated | 700.93–714.55* | 0.762–0.777* | +$4.72 to +$6.94* |
Sources: CBOT/Farmbucks, Oct 21, 2026 [24]; USDA AMS/Green Markets, retrieved Oct 22, 2026 [23]; DTN/Progressive Farmer, Oct 14, 2026 [25]. *Crop Root Zone estimates, not forecasts. Implied retail = scenario barge + $220.13, the gap between DTN's Oct 5–9 retail urea ($672) and the September NOLA average ($451.88). Urea at 920 lb N per ton; 150 lb N per acre = 0.163 ton. Retail usually moves less than the barge, so these figures overstate the retail move both ways. Excludes application and stabilizers.
The per-acre differences are small next to the spread between dealers. The point of the table is the order of events. NOLA can rise from October futures to the March futures level without Europe or Egypt being involved at all. Only inside the $481 to $494 band, on our freight estimate, would Egyptian cargoes begin to land competitively at the Gulf. Supply risk sits elsewhere: in September an estimated 600,000 tonnes of loaded urea was waiting on vessels to pass the Strait of Hormuz, and only occasional shipments were getting through (Australian Fertilizer Corporation, Sep 14 and Sep 21, 2026) [4][3].
Ground Truth: For a Corn Belt buyer this fall, the Egyptian price is a ceiling marker, not a driver. The drivers of US spring urea are China's export tranches, India's next tender, Russia's continued tariff-free access and the Hormuz backlog. We would price the spring tons a grower is certain to use against the March futures, not against FOB Egypt. If NOLA closes on the $481 to $494 band before January, Europe's gas market has started to bid for US supply, and the remaining tons should be priced then.
What to watch, in order:
- The Egypt–NOLA gap at midpoint. A move from today's $24 to above about $60 a tonne before freight would mean Europe is pulling North African and Nigerian granular away from the Americas. A move to zero or below would mean the Gulf has started to compete for Mediterranean tonnes.
- TTF front-month gas. Every €10/MWh is about $3.30/MMBtu at current exchange rates, by our conversion. On AFC's cost points that moves European urea cost by roughly $80 a tonne.
- India's next tender and China's fourth tranche. These set the floor under prilled urea and, through Brazil, under granular. A lower Indian price that China accepts would pull NOLA down regardless of Egypt.
- USDA's October Green Markets averages, due in November. An October NOLA average below the September $451.88 a short ton would confirm that the Gulf eased while North Africa held.
References
- Australian Fertilizer Corporation, "Weekly Update – Global Fertiliser Markets – w/e 16.10.2026," media release, Oct 19, 2026 — https://ausfertcorp.com/wp-content/uploads/2026/10/afc-media-release-weekly-update-20261016.pdf
- Australian Fertilizer Corporation, "Weekly Update – Global Fertiliser Markets – w/e 09.10.2026," media release, Oct 12, 2026 — https://ausfertcorp.com/wp-content/uploads/2026/10/afc-media-release-weekly-update-20261009.pdf
- Australian Fertilizer Corporation, "Weekly Update – Global Fertiliser Markets – w/e 18.09.2026," media release, Sep 21, 2026 — https://ausfertcorp.com/wp-content/uploads/2026/09/afc-media-release-weekly-update-20260918.pdf
- Australian Fertilizer Corporation, "Weekly Update – Global Fertiliser Markets – w/e 11.09.2026," media release, Sep 14, 2026 — https://ausfertcorp.com/wp-content/uploads/2026/09/afc-media-release-weekly-update-20260911.pdf
- Australian Fertilizer Corporation, "Weekly Update – Global Fertiliser Markets – w/e 04.09.2026," media release, Sep 7, 2026 — https://ausfertcorp.com/wp-content/uploads/2026/09/afc-media-release-weekly-update-20260904.pdf
- Australian Fertilizer Corporation, "Weekly Update – Global Fertiliser Markets – w/e 28.08.2026," media release, Aug 31, 2026 — https://ausfertcorp.com/wp-content/uploads/2026/09/afc-media-release-weekly-update-20260828.pdf
- Australian Fertilizer Corporation, "Weekly Update – Global Fertiliser Markets – w/e 21.08.2026," media release, Aug 24, 2026 — https://ausfertcorp.com/wp-content/uploads/2026/08/afc-media-release-weekly-update-20260821.pdf
- Australian Fertilizer Corporation, "Weekly Update – Global Fertiliser Markets – w/e 14.08.2026," media release, Aug 17, 2026 — https://ausfertcorp.com/wp-content/uploads/2026/08/afc-media-release-weekly-update-20260814.pdf
- Argus Media, Argus Nitrogen, issue 25-52, Sep 29, 2025, public sample issue (FOB Egypt to Europe, NOLA barge range, urea freight table) — https://view.argusmedia.com/rs/584-BUW-606/images/APAC-RSMT-FER-2025-10-01-SAM-FER-Fertilizer%20Campaign-Argus%20Nitrogen.pdf
- Argus Media, "Egypt urea sold higher after US, Israel attack on Iran," Feb 28, 2026 — https://www.argusmedia.com/en/news-and-insights/latest-market-news/2794509-egypt-urea-sold-higher-after-us-israel-attack-on-iran
- Profercy, "Urea: Middle East crisis midweek update – pace of price gains slows, yet FOB values edge higher," Mar 18, 2026 — https://www.profercy.com/insights/urea-middle-east-crisis-midweek-update-pace-of-price-gains-slows-yet-fob-values-edge-higher
- Argus Media, "Egypt's urea availability, production solid," Mar 24, 2026 — https://www.argusmedia.com/en/news-and-insights/latest-market-news/2805101-egypt-s-urea-availability-production-solid
- Fertilizer Daily, "Urea price rebound" (Egypt and Algeria FOB peaks, citing SunSirs), Jul 17, 2026 — https://www.fertilizerdaily.com/20260717-urea-price-rebound-ammonium-sulfate/
- Fertilizer Daily, "Egypt nitrogen fertilizer export duty," Jul 30, 2026 (Decree No. 258 of 2026; 10% ad valorem duty replacing $90/t levy) — https://www.fertilizerdaily.com/20260730-egypt-nitrogen-fertilizer-export-duty/
- Al Manassa, Mahmoud Salem, "Egypt boosts gas flows to fertilizer plants following export levy hike," Jun 21, 2026 — https://manassa.news/en/news/32526
- EnterpriseAM Egypt, "Egypt moves to link fertilizer feedstock costs to international gas prices," Mar 31, 2026 — https://enterpriseam.com/egypt/2026/03/31/egypt-moves-to-link-fertilizer-feedstock-costs-to-international-gas-prices/
- World Fertilizer, "Urea market braces for EU's CBAM" (reporting by Harry Minihan, Argus Media), Dec 11, 2025 — https://www.worldfertilizer.com/nitrogen/11122025/urea-market-braces-for-eus-cbam/
- Nitrogen+Syngas 401 (BCInsight/CRU), "Policy impacts on nitrogen markets," May 20, 2026 — https://www.bcinsight.crugroup.com/2026/05/20/policy-impacts-on-nitrogen-markets/
- Commodity Board, "EU steps up fertilizer tariffs on Russia and Belarus, redrawing global nutrient trade," Jul 7, 2026 — https://commodity-board.com/eu-steps-up-fertilizer-tariffs-on-russia-and-belarus-redrawing-global-nutrient-trade
- 3tres3, "EU suspends customs tariffs on certain fertilisers for one year," May 22, 2026 (Council of the EU decision) — https://www.3tres3.com/en/latest_swine_news/eu-suspends-customs-tariffs-on-certain-fertilisers-for-one-year_22501/
- Investing.com (Reuters), "European natural gas prices top €90 per MWh for first time since 2022," Oct 20, 2026 — https://in.investing.com/news/stock-market-news/european-natural-gas-prices-top-90-per-mwh-for-first-time-since-2022-93CH-5642598
- The National News Desk (TNND), Emma Koppelman, "Trump waives most Russia sanctions and tariffs days before they were to take effect," Oct 17, 2026 — https://nbcmontana.com/news/nation-world/trump-waives-most-russia-sanctions-and-tariffs-days-before-they-were-to-take-effect
- USDA Agricultural Marketing Service, Fertilizer Prices by Region (agtransport.usda.gov, dataset 8bgf-5mdv), monthly averages derived from Green Markets; urea, US Gulf NOLA and Corn Belt, Sep 2025–Sep 2026, retrieved Oct 22, 2026 — https://agtransport.usda.gov/d/8bgf-5mdv
- Farmbucks, Urea (US Gulf) Futures (CBOT UFV), contract-month quotes as of Oct 21, 2026 (delayed CME data) — https://farmbucks.com/futures/fertilizer/urea-us-gulf
- DTN/Progressive Farmer, Russ Quinn, "UAN32 Leads Fertilizer Prices Higher Again in First Week of October," DTN Retail Fertilizer Trends, Oct 14, 2026 (survey week Oct 5–9, 2026) — https://www.dtnpf.com/agriculture/web/ag/crops/article/2026/10/14/uan32-leads-fertilizer-prices-higher
- Trading Economics, "Urea," observation for Oct 21, 2026 (basis not stated) — https://tradingeconomics.com/commodity/urea
- Federal Reserve Bank of St. Louis, FRED, "U.S. Dollars to Euro Spot Exchange Rate" (DEXUSEU), observation for Oct 16, 2026: 1.1231 — https://fred.stlouisfed.org/series/DEXUSEU
- Quantum Commodity Intelligence, "EU proposes suspension of CBAM for fertiliser imports," Jan 7, 2026 (first paragraph only; remainder paywalled and not read) — https://www.qcintel.com/carbon/article/eu-proposes-suspension-of-cbam-for-fertiliser-imports-56177.html
- Argus Media, "Middle East urea price under pressure," Mar 25, 2025 — https://www.argusmedia.com/en/news-and-insights/latest-market-news/2671274-middle-east-urea-price-under-pressure
- Australian Fertilizer Corporation, "Weekly Update – Global Fertiliser Markets – w/e 02.10.2026," media release, Oct 5, 2026 — https://ausfertcorp.com/wp-content/uploads/2026/10/afc-media-release-weekly-update-20261002.pdf
Disclosures
Crop Root Zone is an independent publication. Nothing here is investment advice. Market calls, where included, reflect the editors' own read and are not a recommendation to buy or sell any security.
Brazil Paid $50 a Tonne Over NOLA for Urea in June. By September the Gulf Paid $13 to $38 More, and in Mid-October the Gap Is $2 to $12. Brazil Has Bought 21.5% Less Urea This Year and Still Has a Safrinha Crop to Supply.
Brazil's urea, potash and MAP imports for January–September 2026 are running 21.5%, 3.6% and an unstated amount below last year, and CFR Brazil prices sit at $470, $355 and $830 a tonne. Converted to metric tonnes, the NOLA barge is above Brazil on all three. For urea the gap has nearly closed, so Brazil's fourth-quarter buying now decides where the next cargo goes and what US spring nitrogen costs. For potash and MAP, Brazil is not competing with the US this winter: it is soft on potash and sitting out MAP.
Brazil imported 3.53 million tonnes of urea in the first nine months of 2026. That is the smallest January–September total since 2018 and 21.5% less than a year earlier (Farmnews, Oct 16, 2026; Itaú BBA, Oct 16, 2026). September was the strongest month of the year at 710,100 tonnes. Even so, the urea gap has not closed, because Brazilian buyers spent much of the spring and summer paying more than the US Gulf. In mid-October granular urea was offered at $480–$485 a tonne CFR Brazil against bids of $450–$470 (Australian Fertilizer Corporation, Oct 12, 2026). By the week ending Oct 16 it had settled at about $470 for Chinese product and $480 for other origins (Australian Fertilizer Corporation, Oct 19, 2026). On the US side, USDA's monthly Green Markets series put the September NOLA urea barge at $451.88 a short ton, or $498 a metric tonne. The CBOT US Gulf urea futures contract for October was quoted at $437.50 a short ton, or $482 a tonne, on Oct 20 (USDA AMS/Green Markets, retrieved Oct 21, 2026; Farmbucks/CBOT, Oct 20, 2026). In June, Brazil paid about $50 a tonne more than NOLA. In mid-October the two markets are within $2–$12 of each other. A small gap like that decides where the next Middle East or North African cargo goes. Brazil's safrinha corn crop, which needs nitrogen in January to March, decides whether that gap stays small. This piece sets out the spread for urea, potash and MAP, tests whether Brazil's import shortfall is lost demand or deferred buying, and works through what each case means for US winter and spring prices.
1. The urea spread: from Brazil's premium to near parity
What's new: For most of 2026 the Gulf and Brazil have taken turns as the more expensive urea market. In April and June Brazil paid more. In September NOLA paid more. Now the two are close to level.
Evidence: Neither market publishes a free daily benchmark, so the comparison has to be assembled from points. The Brazilian prices are CFR, meaning cost and freight to a Brazilian port. The NOLA prices are FOB barge, meaning product already discharged from the ocean vessel and loaded into a river barge at New Orleans. Both are destination prices for imported urea, so both measure what each market pays for the same cargo. They are not netbacks. Ocean freight from each origin to each destination is not in any public source we could find, so the spread below is gross.
| Date | Brazil CFR, $/t | Brazil source | NOLA, $/st | NOLA, $/t | NOLA minus Brazil, $/t |
|---|---|---|---|---|---|
| Apr 2026 | 805 | Argus, Apr 16 peak | 689.13 (Apr avg) | 759.63 | −45.37 |
| Jun 2026 | 480 | Argus, end-June | 389.88 (Jun avg) | 429.76 | −50.24 |
| Sep 2026 | 460+ | Profercy offers, mid-Sep | 451.88 (Sep avg) | 498.11 | about +38 |
| Sep 2026 | 485 | Itaú BBA, second half | 451.88 (Sep avg) | 498.11 | +13.11 |
| Mid-Oct 2026 | 470–480 | AFC, w/e Oct 16; Itaú BBA | 437.50 (Oct futures, Oct 20) | 482.26 | +2.26 to +12.26 |
Sources: Brazil — Argus Media, Sep 21, 2026; Fertilizer Daily/Profercy, Sep 17, 2026; Itaú BBA Agro Mensal via Portal do Agronegócio, Oct 16, 2026; Australian Fertilizer Corporation, Oct 19, 2026. NOLA — USDA AMS, Fertilizer Prices by Region (monthly averages derived from Green Markets), retrieved Oct 21, 2026; CBOT Urea (Granular) FOB US Gulf futures, October 2026 contract, via Farmbucks, Oct 20, 2026. Conversion at 1.10231 short tons per metric tonne and spreads are Crop Root Zone calculations. Brazil figures are point quotes; NOLA figures except October are monthly averages, so each row compares a point with an average and should be read as an approximate spread.
The pattern is clear even with that caveat. In April the Hormuz disruption sent both markets to their peaks, and Brazil topped out at $805 a tonne, about $45 above the NOLA monthly average. Brazil's price then fell by $325 a tonne to $480 by the end of June (Argus Media, Sep 21, 2026). The NOLA barge fell further and faster, to $389.88 a short ton in June. That left Brazil paying $50 a tonne more than the Gulf at the time when US buyers were filling for summer and fall. Our July import analysis found US urea imports had more than doubled from a year earlier (Crop Root Zone, TRZ-0278, Oct 14, 2026). This spread argues against reading that as a NOLA price pull. In June NOLA was the cheaper market.
The flip came in late summer. NOLA rose $53.75 a short ton from August to September, a 13.5% gain in one month, while Brazilian offers in mid-September stood only about $20 above the previous week's high (USDA AMS/Green Markets, retrieved Oct 21, 2026; Fertilizer Daily/Profercy, Sep 17, 2026). By September the Gulf paid $13–$38 a tonne more than Brazil, depending on which Brazilian quote is used.
$2–$12/t
The mid-October premium of the NOLA urea market over CFR Brazil, against $50 a tonne the other way in June. (Crop Root Zone calculation from CBOT/Farmbucks, Oct 20, 2026, Australian Fertilizer Corporation, Oct 19, 2026, and Itaú BBA, Oct 16, 2026)
The swing factor is Brazilian credit, not supply. Australian Fertilizer Corporation's weekly reports describe Brazilian buyers as cautious. They cite adverse weather, difficult agricultural trade financing and restricted credit, which have "significantly reduced import demand" (Australian Fertilizer Corporation, Oct 12 and Oct 19, 2026). On Oct 12 the Brazilian bid-offer gap was $10–$35 a tonne. That gap is wider than the whole spread between Brazil and the Gulf.
Ground Truth: For a cargo arriving in December or January, the bid-offer gap inside Brazil now matters more than the spread between Brazil and NOLA. If Brazilian importers lift offers at $480–$485, Brazil matches or beats the October Gulf futures and the marginal cargo goes south. If credit keeps them at $450–$470, the Gulf keeps the cargo by default. A US buyer watching NOLA should therefore also watch whether Brazil's bids reach its offers. That is the earliest public sign of whether winter supply to the Gulf will tighten.
2. Brazil's shortfall: lost demand or deferred buying?
What's new: Brazil's total fertilizer imports for January–September were 28.5 million tonnes, down 15.7% from a year earlier. Within that total, urea fell 21.5% and potassium chloride fell 3.6% (Itaú BBA, Oct 16, 2026). Ammonium sulfate, the nitrogen product most often substituted for urea in Brazil, fell 20% to 3.8 million tonnes (Australian Fertilizer Corporation, Oct 12, 2026). September imports were 3.10 million tonnes in total, 28.3% below September 2025 (Farmnews, Oct 16, 2026).
Evidence:
| Brazil imports, Jan–Sep | Million tonnes | Change | |
|---|---|---|---|
| Potassium chloride, 2025 | 11.20* | ██████████ |
|
| Potassium chloride, 2026 | 10.8 | −3.6% | ██████████ |
| Ammonium sulfate, 2025 | 4.75* | ████░░░░░░ |
|
| Ammonium sulfate, 2026 | 3.8 | −20% | ███░░░░░░░ |
| Urea, 2025 | 4.50* | ████░░░░░░ |
|
| Urea, 2026 | 3.53 | −21.5% | ███░░░░░░░ |
Sources: 2026 volumes and percentage changes — Itaú BBA Agro Mensal via Portal do Agronegócio, Oct 16, 2026 (all fertilizers, urea, KCl); Farmnews, Oct 16, 2026 (urea, 3.53 Mt); Australian Fertilizer Corporation, Oct 12, 2026 (ammonium sulfate). *2025 volumes are Crop Root Zone back-calculations from the 2026 volume and the reported percentage change, not published figures. Bars scale 11.2 Mt to ten blocks. MAP volumes were reported as down but without a figure, so MAP is not shown. Brazil's official Comex Stat API returned rate-limit errors on every request on Oct 21, so these totals come from the cited relays and not directly from the government database.
Two facts help separate lost demand from deferred buying. First, ammonium sulfate fell almost as much as urea. Brazil did not replace urea with a cheaper nitrogen form. It bought less nitrogen in total. Argus put January–August nitrogen imports about 21% below the prior year (Argus Media, Sep 21, 2026). Second, buying has been late rather than absent. By mid-August Brazilian farmers had bought roughly 40% of their nutrient needs for the 2026-27 safrinha corn crop (Argus Media, Sep 21, 2026). Urea imports rose from 508,700 tonnes in August to 710,100 tonnes in September (Farmnews, Oct 16, 2026).
Price explains why the buying came late. Brazil's average urea import price for January–September was $445.60 a tonne FOB, 14.7% above last year and the highest since 2022 (Farmnews, Oct 16, 2026). Brazil's total fertilizer import price for January–August averaged $394.47 a tonne, also the highest for the period since 2022 (Fertilizer Daily, Oct 1, 2026). Itaú BBA expects 2026 deliveries to Brazilian farms to finish below 2025 (Itaú BBA, Oct 16, 2026). Forecasts for full-year imports are 40–41 million tonnes, more than 10% below the 2025 record of 45.5 million (Fertilizer Daily, Oct 1, 2026).
Against last year's back-calculated January–September volume, the urea gap is about 970,000 tonnes (Crop Root Zone estimate). Part of that will not come back. Itaú's forecast of lower 2026 deliveries says some demand is gone, and tight credit is the usual reason a safrinha grower trims nitrogen rates. But the 40%-booked figure from mid-August leaves most of the safrinha requirement still to be bought, and the safrinha crop goes in from January.
Ground Truth: We read Brazil's urea shortfall as roughly half lost and half deferred. Even the deferred half, several hundred thousand tonnes, is a large volume to arrive in the November–February window. That window is also when NOLA imports for US spring application must arrive. The lack of an ammonium sulfate offset is what makes the deferred half likely. A grower who cut nitrogen permanently would also have cut ammonium sulfate. The figures show a buyer who has stopped buying everything for now, and most of what a safrinha corn crop needs cannot be skipped.
3. Potash: Brazil is softening while the US firms
What's new: CFR Brazil potash fell for nine consecutive weeks into late September, losing just under 10% (StoneX via Revista Cultivar, Sep 28, 2026). Itaú BBA put granular KCl at $355 a tonne CFR in mid-October, down from $375 (Itaú BBA, Oct 16, 2026). Australian Fertilizer Corporation quoted $355–$385 for the week ending Oct 9 and $355–$375 for the week ending Oct 16, with an outlook of "softening" for the coming months (Australian Fertilizer Corporation, Oct 12 and Oct 19, 2026). The US moved the other way. The September NOLA potash barge averaged $348.75 a short ton, up $7.50 on the month. Corn Belt wholesale rose $12.50 to $397.50 (USDA AMS/Green Markets, retrieved Oct 21, 2026). DTN's retail survey for Oct 5–9 put potash at $502 a ton. That is the first reading above $500 since the second week of August 2024 (DTN/Progressive Farmer, Oct 14, 2026).
Evidence:
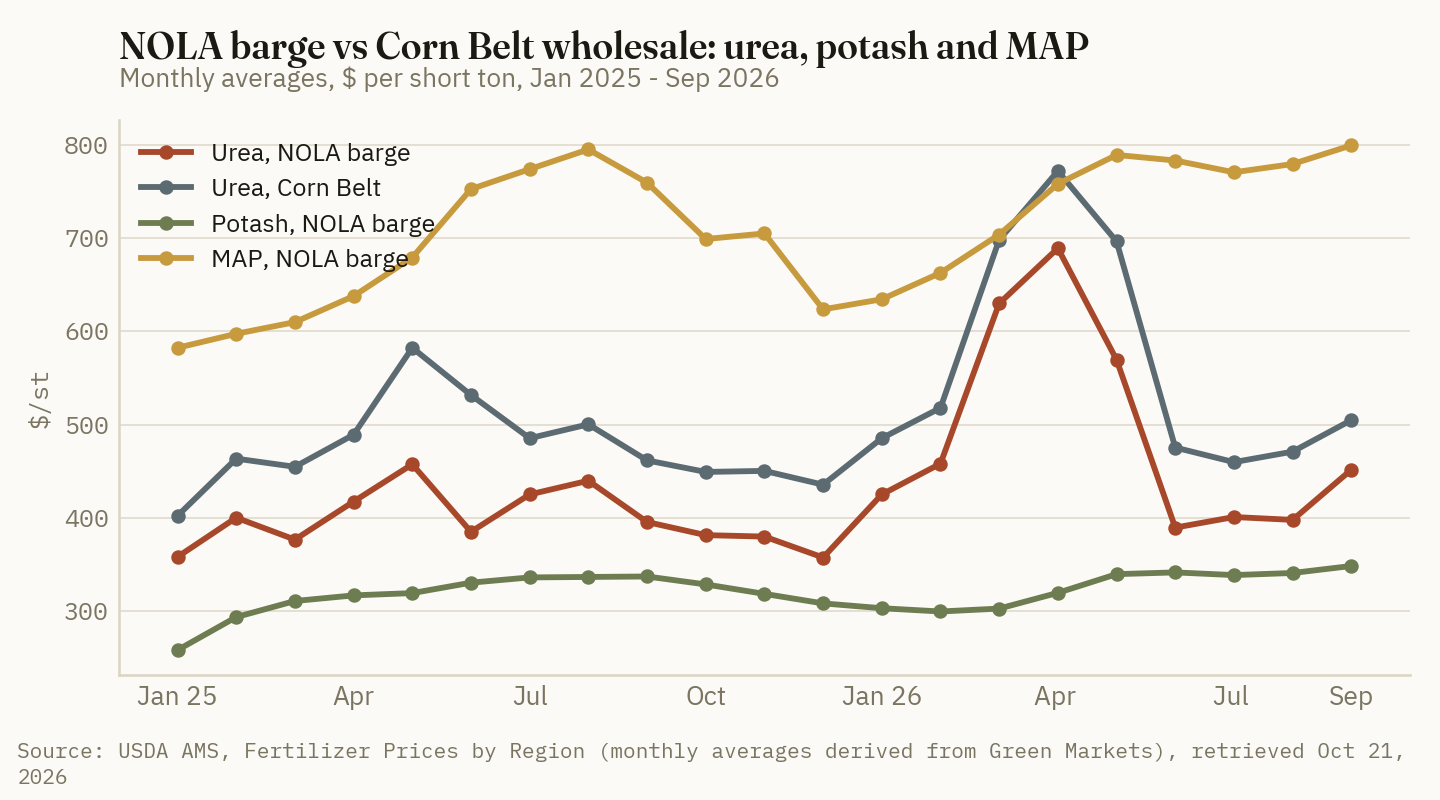
Source: USDA AMS, Fertilizer Prices by Region, monthly averages derived from Green Markets, retrieved Oct 21, 2026.
Converted to metric tonnes, the September NOLA potash average is $384. That puts the Gulf $9–$29 a tonne above CFR Brazil, depending on the Brazilian quote. For potash, though, the Gulf barge is not the main channel into the US Corn Belt. Most US potash comes from Canadian mines by rail. Canada also supplied 39% of Brazil's KCl imports in January–August, with Russia at 31% (StoneX via Revista Cultivar, Sep 28, 2026). That means the Brazilian price works for North American producers as an outlet: it sets what a tonne earns if it goes offshore instead of into the US. As that outlet weakens, the US domestic market becomes relatively more attractive to Canadian supply.
Brazil's import data point the same way. KCl imports in August were 930,000 tonnes against 1.50 million a year earlier, the lowest August since 2018. The average import price that month was $352.10 a tonne (Farmnews, Sep 15, 2026). Brazil's soybean planting is now under way, and StoneX notes that Brazilian demand lost momentum as planting advanced (StoneX via Revista Cultivar, Sep 28, 2026). Brazil buys potash mainly for soybeans, so the period of strongest Brazilian demand is ending.
The benchmark is also hard to see. The main published CFR Brazil granular potash assessment changed its specification on Sep 15 to 60–61% K2O product in 10,000–20,000 tonne lots, assessed weekly (S&P Global Platts, Sep 15, 2026). The assessment is subscriber-only. The public figures above are relays and ranges.
Ground Truth: On potash, Brazil is a cushion for US buyers this winter, not a competitor. A softening Brazilian market with a falling soybean-season pull gives Canadian supply more reason to stay in North America, and the $502 retail print came on a barge that rose only $7.50. We would not chase potash at $500-plus for spring. The more likely path is for the Brazilian softness to reach Corn Belt wholesale, and then retail, within one or two months.
4. MAP: neither market is buying, and sulfur sets the price
What's new: Itaú BBA put MAP at $830 a tonne CFR Brazil in mid-October, down 1.2% over 30 days (Itaú BBA, Oct 16, 2026). Australian Fertilizer Corporation quoted $830–$850 and said Brazilian MAP prices had "remained virtually unchanged for two months" (Australian Fertilizer Corporation, Oct 19, 2026). NOLA MAP averaged $799.38 a short ton in September, or $881 a tonne, the highest monthly figure in USDA's series for 2025–2026 (USDA AMS/Green Markets, retrieved Oct 21, 2026).
Evidence:
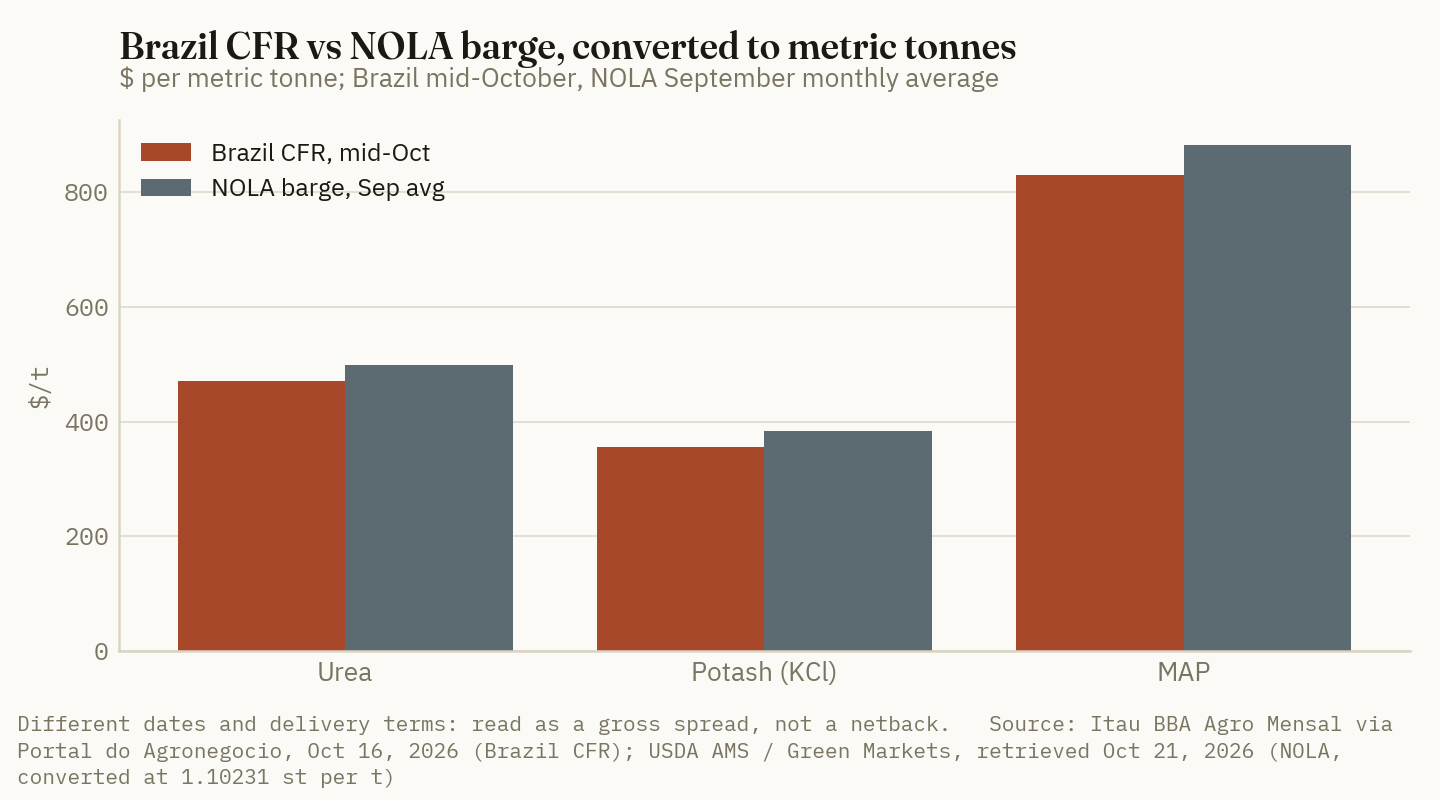
| Product | CFR Brazil, mid-Oct, $/t | NOLA Sep avg, $/t | NOLA minus Brazil, $/t | US retail Oct 5–9, $/ton | Retail minus NOLA, $/st |
|---|---|---|---|---|---|
| Urea | 470–480 | 498.11 | +18 to +28 | 672 | 220.13 |
| Potash | 355–375 | 384.43 | +9 to +29 | 502 | 153.25 |
| MAP | 830–850 | 881.16 | +31 to +51 | 979 | 179.63 |
Sources: Itaú BBA via Portal do Agronegócio, Oct 16, 2026, and Australian Fertilizer Corporation, Oct 19, 2026 (Brazil CFR ranges); USDA AMS/Green Markets, retrieved Oct 21, 2026 (NOLA, September monthly averages, converted at 1.10231); DTN/Progressive Farmer, Oct 14, 2026 (retail, delivered, survey week Oct 5–9). Spreads are Crop Root Zone calculations. Brazil and NOLA prices refer to different dates. The retail spread compares October retail with the September barge, the latest USDA month, and is not a margin.
MAP has the widest gap of the three, and it has not drawn tonnes either way. Brazil's MAP and SSP imports are down (no volume was published), and import programming points to lower MAP arrivals in October (Itaú BBA, Oct 16, 2026). The cause is cost, not a lack of need. Imported sulfur cost $1,161 a tonne in September, more than three times the year-earlier level, and has idled part of Brazil's domestic MAP, SSP and TSP capacity (Itaú BBA, Oct 16, 2026; Fertilizer Daily, Oct 1, 2026). Australian Fertilizer Corporation reports global phosphate plants running at about 50–60% of capacity, and Chinese MAP and DAP exports are unlikely to return before the end of 2026 (Australian Fertilizer Corporation, Oct 12, 2026).
Ground Truth: A $31–$51 premium at NOLA would normally pull Brazil-bound MAP to the Gulf. It has not, because the limit is production, not where the tonnes go. MAP is the one product here where the Brazil–NOLA spread tells a US buyer almost nothing about winter prices. The signals to watch are sulfur and Chinese export policy. A Brazilian buyer holding out at $830 lowers the global MAP price only if producers have tonnes to sell, and at 50–60% operating rates they have few.
5. What it means for US winter and spring prices
What's new: The public US Gulf price curve has gained two new reference points. The CBOT urea Gulf futures curve on Oct 20 ran from $437.50 a short ton for October to $460 for March 2027 (Farmbucks/CBOT, Oct 20, 2026). MIAX's four physically settled NOLA contracts, for urea, MAP, DAP and potash, were scheduled to start trading on Oct 19 (Fertilizer Daily, Oct 4, 2026). We found no public report of volumes or prices from their first sessions.
Evidence: The urea futures curve already prices a seasonal rise of $22.50 a short ton from October to March. Two forces outside Brazil pull against that rise. India's latest urea tender produced a lowest offer of $352.10 a tonne CFR for the east coast, about $40 below the August tender. China pushed back: India secured about 410,000 tonnes against an intended 1.7 million, and Chinese prilled urea sold at up to $340 FOB elsewhere (Australian Fertilizer Corporation, Oct 12 and Oct 19, 2026). North African FOB prices rose from about $480 to as high as $530 a tonne the following week. Another Indian tender is likely, and Chinese export policy sets the floor on prilled urea.
Brazil is the third force, and Sections 1 and 2 suggest it pushes upward if credit loosens. The table sets out what three NOLA levels by March would mean for retail urea. It assumes October's $220 retail-over-barge gap stays fixed. In practice retail tends to move less than the barge, so these figures overstate the retail move in both directions.
| NOLA urea by Mar 2027, $/st | Scenario | Implied retail urea, $/ton | $/lb N | Change at 150 lb N/acre vs Oct |
|---|---|---|---|---|
| 400 | Brazil stays out; India–China settle lower (about the Jul–Aug 2026 NOLA average) | 620* | 0.674* | −$8.48* |
| 460 | CBOT March 2027 futures, Oct 20 | 680* | 0.739* | +$1.30* |
| 520 | Brazil's deferred safrinha buying returns in Nov–Jan (illustrative) | 740* | 0.804* | +$11.09* |
*Crop Root Zone estimates, not forecasts. Implied retail = scenario barge + $220.13, the gap between DTN's Oct 5–9 retail urea ($672, DTN/Progressive Farmer, Oct 14, 2026) and the September NOLA average ($451.88, USDA AMS/Green Markets, retrieved Oct 21, 2026). Urea at 920 lb N per ton; 150 lb N/acre = 0.163 ton. The $400 level matches the July–August 2026 NOLA average of $399.66; the $520 level is illustrative only. Excludes application, stabilizers and dealer-to-dealer differences.
In our UAN analysis this week we found that retail passes about two-thirds of a barge move through within a month or two (Crop Root Zone, TRZ-0294, Oct 20, 2026). On that basis the per-acre swings above shrink to roughly −$6 and +$7. That range is small next to the difference between dealers. Even so, the risk runs mainly upward. The $460 futures level already assumes a seasonal rise, and the one large buyer that could lift it, Brazil, is also the one that has bought least so far.
Ground Truth: Brazil affects US prices differently by nutrient this winter. For urea, Brazil is the main upside risk to US spring prices, and its sign is whether Brazilian bids reach offers at $480 or more CFR before the end of November. We would price the spring urea tons a grower is certain to use before that test is settled. For potash, Brazil's weakness should reach the Corn Belt with a lag, so waiting is cheap and buying at $500-plus is premature. For MAP, the Brazil–NOLA spread is not the signal; sulfur and Chinese export policy are, and neither points to relief before spring.
What to watch, in order:
- CFR Brazil urea bids against offers. If deals clear at $480–$485 or higher, Brazil is pulling cargoes south. If bids stay at $450–$470, the Gulf keeps its supply.
- Brazil's October import figures, due in early November. October urea imports at or above September's 710,100 tonnes would confirm that the deferred safrinha buying has started.
- USDA's October Green Markets averages. An October NOLA urea average below $482 a tonne ($437.50 a short ton) would mean the Gulf market eased while Brazil held. Potash above $348.75 would mean the US is still firming against a softening Brazil.
- The next Indian urea tender and Chinese export allocations. A lower Indian price that China accepts would pull every urea price down, Brazil and NOLA alike, more than any change in the Brazil–Gulf spread.
References
- USDA Agricultural Marketing Service, Fertilizer Prices by Region (agtransport.usda.gov, dataset 8bgf-5mdv), monthly averages derived from weekly Green Markets reports; urea, potash and MAP, US Gulf NOLA and Corn Belt, Jan 2025–Sep 2026, retrieved Oct 21, 2026 — https://agtransport.usda.gov/d/8bgf-5mdv
- DTN/Progressive Farmer, Russ Quinn, "UAN32 Leads Fertilizer Prices Higher Again in First Week of October," Oct 14, 2026 (survey week Oct 5–9, 2026) — https://www.dtnpf.com/agriculture/web/ag/crops/article/2026/10/14/uan32-leads-fertilizer-prices-higher
- Portal do Agronegócio, "Fertilizantes: ureia sobe 3% e importações brasileiras caem 15,7%, aponta Itaú BBA," Oct 16, 2026 (Itaú BBA Consultoria Agro, Agro Mensal, October 2026) — https://www.portaldoagronegocio.com.br/agroindustria/adubos-e-fertilizantes/noticias/fertilizantes-ureia-sobe-3-e-importacoes-brasileiras-caem-15-7-aponta-itau-bba
- Australian Fertilizer Corporation, "Weekly Update – Global Fertiliser Markets – w/e 09.10.2026," media release, Oct 12, 2026 — https://ausfertcorp.com/wp-content/uploads/2026/10/afc-media-release-weekly-update-20261009.pdf
- Australian Fertilizer Corporation, "Weekly Update – Global Fertiliser Markets – w/e 16.10.2026," media release, Oct 19, 2026 — https://ausfertcorp.com/wp-content/uploads/2026/10/afc-media-release-weekly-update-20261016.pdf
- Farmnews, "Compra de ureia sobe em setembro, mas 2026 segue no menor patamar desde 2018," last updated Oct 16, 2026 (COMEX data) — https://farmnews.com.br/mercado/compra-de-ureia-sobe-em-setembro-mas-2026-segue-no-menor-patamar-desde-2018/
- Farmnews, "Importação de cloreto de potássio pelo Brasil volta a cair forte em agosto," last updated Sep 15, 2026 (COMEX data) — https://farmnews.com.br/mercado/importacao-de-cloreto-de-potassio-pelo-brasil-volta-a-cair-forte-em-agosto/
- Fertilizer Daily, Kim Clarksen, "Brazil fertilizer imports slump 30% in September as buyers pay the highest prices since 2022," Oct 1, 2026 (FarmNews analysis of COMEX data) — https://www.fertilizerdaily.com/20261001-brazil-fertilizer-imports-september-2026/
- Revista Cultivar, "Potássio recua quase 10% nos portos brasileiros," Sep 28, 2026 (StoneX market intelligence) — https://www.revistacultivar.com.br/noticias/potassio-recua-quase-10-nos-portos-brasileiros
- Argus Media, "Brazil fertilizer demand 2026-27" (podcast page), Sep 21, 2026 — https://www.argusmedia.com/en/news-and-insights/energy-and-commodity-podcasts/brazil-fertilizer-demand-2026-27
- Fertilizer Daily, Profercy Nitrogen Index report, "Urea price $453, September 2026," Sep 17, 2026 — https://www.fertilizerdaily.com/20260917-urea-price-453-september-2026-profercy-nitrogen-index/
- Farmbucks, Urea (US Gulf) Futures (CBOT UFV), contract-month quotes as of Oct 20, 2026 (delayed CME data) — https://farmbucks.com/futures/fertilizer/urea-us-gulf
- Fertilizer Daily, "MIAX certifies four physically settled NOLA fertilizer futures ahead of October 19 launch," Oct 4, 2026 — https://www.fertilizerdaily.com/20261004-miax-certifies-four-physically-settled-nola-fertilizer-futures-ahead-of-october-19-launch/
- S&P Global Commodity Insights, "Platts refines specifications of its granular MOP CFR Brazil assessment from Sept 15," subscriber note, Sep 15, 2026 — https://www.spglobal.com/energy/en/pricing-benchmarks/our-methodology/subscriber-notes/091526-platts-refines-specifications-of-its-granular-mop-cfr-brazil-assessment-from-sept-15
- Crop Root Zone, TRZ-0278, "US Urea Imports More Than Doubled in July. Ammonia Imports Hit Their Lowest July Since at Least 2019, and UAN Fell a Third. The Fall Gap Is in the Products That Go On This Fall.," Oct 14, 2026
- Crop Root Zone, TRZ-0294, "Retail UAN32 Sat $114 Over the NOLA Barge in September, the Narrowest Gap in Four Falls. Against the July Fill That Dealers Actually Bought, the October Markup Is $163, $37 Wider Than Last Year.," Oct 20, 2026
Disclosures
Crop Root Zone is an independent publication. Nothing here is investment advice. Market calls, where included, reflect the editors' own read and are not a recommendation to buy or sell any security.
Retail UAN32 Sat $114 Over the NOLA Barge in September, the Narrowest Gap in Four Falls. Against the July Fill That Dealers Actually Bought, the October Markup Is $163, $37 Wider Than Last Year.
USDA's Green Markets series puts the September NOLA UAN32 barge at $343 a short ton, up $36.75 in a month, while DTN's retail survey held at $457 and then rose $28 to $485 in early October. The narrow September gap was retail lagging a rising barge, not a thinner dealer margin. Measured against the July–August fill, the October markup is $163, against $126 last fall. Per pound of nitrogen, UAN32 costs 4.5 cents more than urea at the Gulf and the same at the farm, so the liquid premium is set at the barge, not at the dealer.
Retail UAN32 averaged $485 a ton in DTN's survey week of Oct 5–9. That is up $28, or 6.1%, from $457 a month earlier and up $19 from $466 a year ago, and it was the only significant move on DTN's board (DTN/Progressive Farmer, Oct 14, 2026). UAN28 rose $12 to $442. The wholesale side moved first. USDA's monthly regional series, derived from Green Markets weekly reports, put the NOLA UAN32 barge at an average $343 a short ton in September, up $36.75 from August's $306.25 (USDA AMS/Green Markets, retrieved Oct 20, 2026). In September, before retail moved, the farm price sat $114 over the barge. That is the narrowest September gap in the four years the USDA series covers. Earlier this month we found the opposite for anhydrous, where retail sits $483 over its contract (Crop Root Zone, TRZ-0282, Oct 15, 2026). Last week we showed that DAP's gap over its barge is the thinnest on the board (Crop Root Zone, TRZ-0286, Oct 16, 2026). This piece applies the same tests to UAN. It measures the gap, splits it into layers, tests it against the summer fill that dealers actually bought, and sets out what that means for a grower pricing spring liquid nitrogen.
1. The October board: three rising surveys, and a wide range by state
What's new: UAN32 rose in each of the last three DTN surveys, with most of the move in the week of Sep 21–25. Two USDA state reports dated Oct 16 show distributor asks in the same range as the national retail average, but they vary widely from dealer to dealer.
Evidence:
| Survey week, 2026 | UAN32, $/ton | Week-on-week | UAN28, $/ton | UAN32, $/lb N | Basis |
|---|---|---|---|---|---|
| Sep 7–11 | 457 | — | 430 | 0.71 | Delivered, retail |
| Sep 14–18 | 458 | +1 | 421 | 0.72 | Delivered, retail |
| Sep 21–25 | 479 | +21 | 423 | 0.74 | Delivered, retail |
| Sep 28–Oct 2 | 483 | +4 | 430 | 0.75 | Delivered, retail |
| Oct 5–9 | 485 | +2 | 442 | 0.76 | Delivered, retail |
Sources: DTN/Progressive Farmer, Sep 23, Sep 30, Oct 7 and Oct 14, 2026 (national averages; $/lb N as published by DTN, except Sep 7–11, which is a Crop Root Zone calculation at 640 lb N per ton).
The $21 step in the Sep 21–25 survey came in the same week that retail anhydrous jumped $32 (DTN/Progressive Farmer, Sep 30, 2026). The two moves look alike but have different causes. Anhydrous rose while its Tampa benchmark fell. UAN32 rose after its barge had already gained $36.75 on the monthly average.
| Report, Oct 16, 2026 | Product | Average, $/ton | Range, $/ton | $/lb N | Basis |
|---|---|---|---|---|---|
| Iowa Production Cost Report | UAN32 | 488.00 | 399–585 | 0.763 | Distributor ask, FOB |
| Illinois Production Cost Report | UAN32 | 540.00 | single quote | 0.844 | Distributor ask, FOB |
| Illinois Production Cost Report | UAN28 | 467.86 | 400–550 | 0.835 | Distributor ask, FOB |
| DTN national, Oct 5–9 | UAN32 | 485 | — | 0.758 | Delivered, retail |
| DTN national, Oct 5–9 | UAN28 | 442 | — | 0.789 | Delivered, retail |
Sources: USDA AMS, Iowa Production Cost Report (Bi-weekly) and Illinois Production Cost Report (Bi-weekly), both Oct 16, 2026; DTN/Progressive Farmer, Oct 14, 2026. $/lb N is a Crop Root Zone calculation at 640 lb N per ton for UAN32 and 560 for UAN28.
The Iowa average is $3 above DTN's national figure. The Iowa range is wide: $186 a ton separates the lowest and highest asks, or about 29 cents a pound of nitrogen. Iowa's average did not change from the prior report. Illinois carries one UAN32 quote, up $10, and should not be read as a market average. Its UAN28 asks, from several dealers, average $467.86. At 83.5 cents a pound of N, that is about 4.6 cents above DTN's national UAN28 figure.
Ground Truth: The national average says little about the price any one grower will be quoted for UAN. On the Iowa sheet the gap between the cheapest and dearest dealer is $186 a ton, almost seven times the month's national move. For a 150-pound sidedress program, the dealer chosen is worth more than the month in which the tons are bought.
2. The gap over the barge: $114, against $141–$152 in the last three Septembers
What's new: USDA's Fertilizer Prices by Region publishes monthly UAN averages for the US Gulf NOLA barge and the Corn Belt, among other regions, from January 2023. They are derived from Green Markets weekly reports and assume 32% nitrogen (USDA AMS/Green Markets, retrieved Oct 20, 2026). The latest month is September 2026. Set against DTN's second-week September survey, the series gives a retail-over-barge gap for each fall the data covers.
Evidence:
| September | Retail UAN32, $/ton | NOLA barge, $/st | Corn Belt, $/st | Retail minus NOLA | Corn Belt minus NOLA | Retail minus Corn Belt |
|---|---|---|---|---|---|---|
| 2023 | 389 | 247.84 | 297.12 | 141.16 | 49.28 | 91.88 |
| 2024 | 351 | 203.88 | 251.25 | 147.13 | 47.38 | 99.75 |
| 2025 | 482 | 330.00 | 381.25 | 152.00 | 51.25 | 100.75 |
| 2026 | 457 | 343.00 | 377.50 | 114.00 | 34.50 | 79.50 |
Sources: Retail — DTN/Progressive Farmer, Sep 18, 2024 (Sep 9–13, 2024; year-ago Sep 11–15, 2023), Oct 15, 2025 (month-ago Sep 8–12, 2025) and Oct 14, 2026 (month-ago Sep 7–11, 2026). Wholesale — USDA AMS, Fertilizer Prices by Region, monthly averages derived from Green Markets, retrieved Oct 20, 2026. Spreads in $/short ton are Crop Root Zone calculations. Retail is one delivered survey week; wholesale is a monthly average at a different point in the chain, so the spread is not a margin.
| Retail UAN32 minus NOLA barge, September | $/st | |
|---|---|---|
| 2023 | 141.16 | █████████░ |
| 2024 | 147.13 | ██████████ |
| 2025 | 152.00 | ██████████ |
| 2026 | 114.00 | ████████░░ |
Source: Crop Root Zone calculation from the table above. Bars scale $152 to ten blocks.
Both layers of the gap narrowed. We treat Corn Belt wholesale minus NOLA as upriver barge freight, terminal storage and the inland wholesaler's spread. We treat DTN retail minus Corn Belt wholesale as the retailer's layer: storage, delivery, credit and margin. Neither layer is published as such; these are our working definitions. The freight layer fell to $34.50, from $47–$51 in the three prior Septembers. The retail layer fell to $79.50, from $92–$101.
Costs did not fall. US average diesel was $6.179 a gallon in the week ending Oct 12, $2.514 above a year earlier, and Illinois River grain barge rates have been above their prior three-year average in every week of 2026 (USDA AMS, Oct 15, 2026). Those are grain rates, and UAN moves upriver in tank barges that USDA does not price. They show a tight river and expensive trucking all the same. Iowa farm diesel was $5.49 and Illinois $5.76 on Oct 16 (USDA AMS, Oct 16, 2026).
The more likely explanation is timing. Retail was flat from August to September, at $458 and then $457, while the barge average rose $36.75. Corn Belt wholesale rose $27.50 over the same months. The September gap narrowed because wholesale moved first. Retail then added $28 in the next four surveys. October retail of $485, set against the September barge, gives $142. That falls inside last fall's range.
Ground Truth: The $114 is a timing artifact, not a dealer giving up margin. If the October Green Markets average holds near September's $343, the October gap will come back at about $140. That is close to where it ran all of last winter, and it would make September the outlier. A grower who reads the September gap as a sign of thin retail pricing is reading a month in which the dealer had not yet repriced.
3. The fill test: retail tracks the barge at two-thirds, and the fill was cheap
What's new: Same-month gaps mislead when the barge is moving, because dealers sell from inventory bought earlier. For UAN the purchase that matters is the summer fill. CVR Partners said its UAN fill program was completed in early July (CVR Partners, Jul 29, 2026). CF Industries said strong participation in its July UAN fill built an order book that "extends into November," at an average price it put at "probably close to $300" (CF Industries, Aug 6, 2026). CF did not state the basis of that figure.
Evidence: The monthly record since June 2025 shows how the farm price follows the barge.
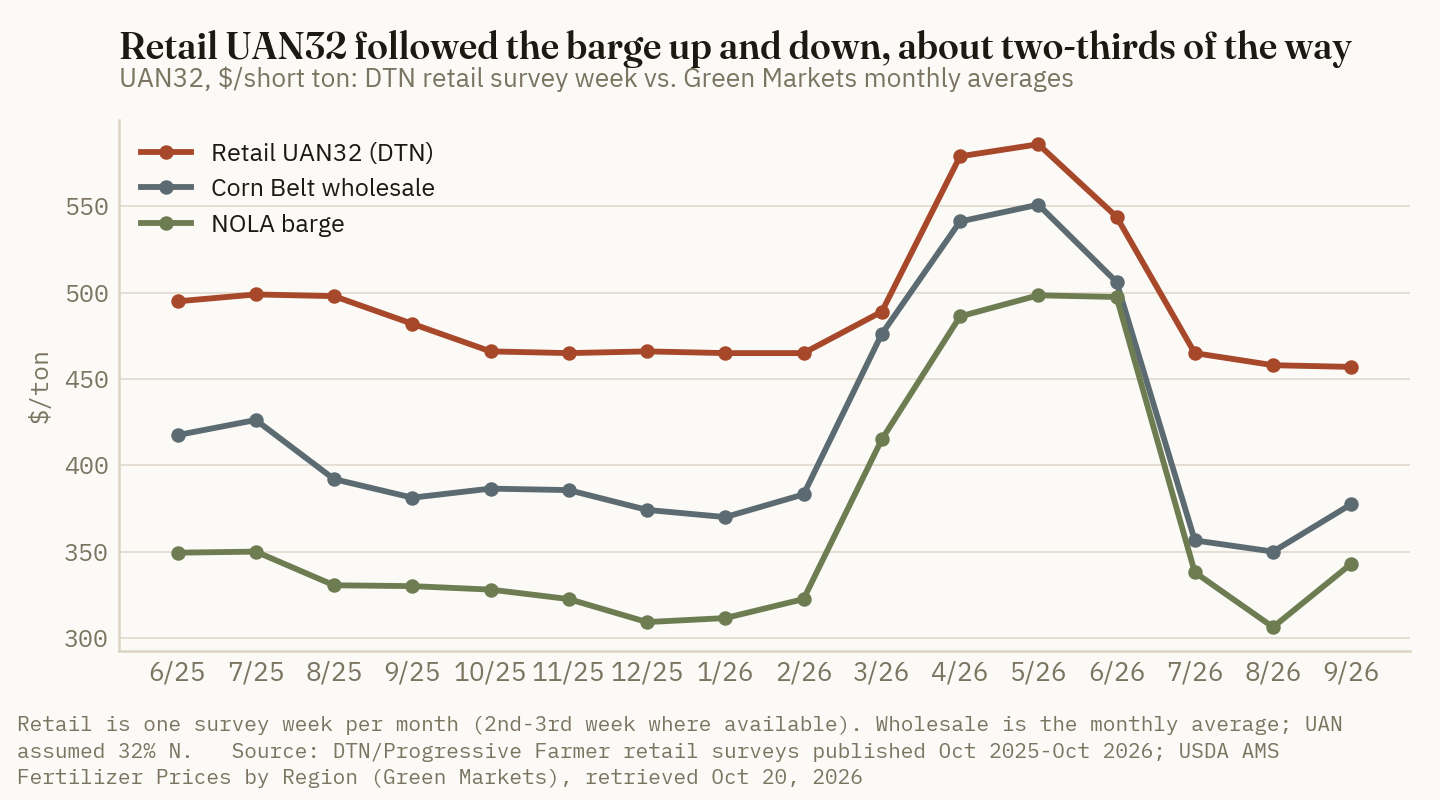
Sources: Retail — DTN/Progressive Farmer, Oct 15, 2025; Nov 12, 2025; Jan 21, Mar 18, Apr 22, Jun 24, Jul 22, Aug 12 and Oct 14, 2026 (one survey week per month, including month-ago and year-ago columns). Wholesale — USDA AMS/Green Markets, retrieved Oct 20, 2026.
From June 2025 to February 2026 the barge drifted between $309 and $350, and the retail gap held between $138 and $167.50. Then the spring spike compressed it. From February to May 2026 the barge rose $176, from $322.50 to $498.50, and retail rose $121, from $465 to $586. That is 69% of the barge move. The gap fell to $46.50 in June, when the barge average was still $497.50 and retail had already started down. From May to August the barge fell $192.25 and retail fell $128, or 67%. Retail began falling in June, before the barge monthly average did. Corn Belt wholesale fell $44.75 that month, so the inland market led the Gulf on the way down. The September-to-October step fits the same pattern. Retail rose $28 on a $36.75 barge gain, about 76%, one month later.
This is faster and fuller pass-through than we measured for DAP, where retail moved about 55 cents on the barge dollar with a lag of two to three months (Crop Root Zone, TRZ-0286, Oct 16, 2026).
The fill-cost comparison is the one that tells a grower what the dealer's margin looks like.
| October retail measured against… | 2023 | 2024 | 2025 | 2026 |
|---|---|---|---|---|
| July–August NOLA average, $/st | 216.08 | 204.13 | 340.25 | 322.13 |
| October retail UAN32, $/ton | 418 | 350 | 466 | 485 |
| Retail minus July–August NOLA | 201.92 | 145.88 | 125.75 | 162.88 |
| Retail minus July–August Corn Belt | 157.60 | 93.88 | 56.88 | 131.75 |
| Retail minus same-month NOLA | 158.00 | 125.00 | 138.00 | 142.00* |
Sources: Retail — DTN/Progressive Farmer, Oct 15, 2024 (Oct 7–11, 2024; year-ago Oct 9–13, 2023), Oct 15, 2025 (Oct 6–10, 2025) and Oct 14, 2026 (Oct 5–9, 2026). Wholesale — USDA AMS/Green Markets, retrieved Oct 20, 2026. *October retail minus the September barge, because USDA has not published October. All spreads $/short ton, Crop Root Zone calculations. Which fill window any one dealer used is not published.
$162.88/ton
October retail UAN32 over the July–August NOLA barge average that filled dealer tanks, against $125.75 a year earlier. (Crop Root Zone calculation from DTN/Progressive Farmer, Oct 14, 2026, and USDA AMS/Green Markets, retrieved Oct 20, 2026)
The two falls were filled in opposite markets. In 2025 the fill came near the summer high. The barge averaged $340.25 in July and August, the Corn Belt averaged $409.13, and October retail of $466 sat only $57 over Corn Belt fill. In 2026 the fill came right after the crash. The barge fell $159.50 from June to July. CF's "close to $300" and a July–August barge average of $322.13 are the cheapest UAN of the year. October retail sits $163 over that NOLA average and $132 over the Corn Belt average. On a fill basis, this fall's markup is $37 wider than last year's against NOLA and $75 wider against the Corn Belt. Only 2023 was wider, on either basis.
That is the reverse of DAP, where the October markup over summer fill has narrowed every fall since 2023 (Crop Root Zone, TRZ-0286, Oct 16, 2026). It is close to the anhydrous result, where October retail is last fall's markup on this summer's fill (Crop Root Zone, TRZ-0282, Oct 15, 2026). UAN is wider still, because UAN's fill price fell further.
Ground Truth: Dealers who took July fill UAN at around $300 to $320 at the Gulf are now selling at a retail price that tracks a $343 replacement barge. That is ordinary replacement-cost pricing, and it means the cheap UAN of 2026 has already been bought, in July, by the channel. No October quote will hand it back. The question worth asking a dealer is whether the tons quoted come from the fill book, which CF says runs into November, or from replacement product. Fill tons are the ones with room for a better price before the book runs out.
4. Per pound of nitrogen: the liquid premium is set at the Gulf
What's new: At NOLA in September, a pound of nitrogen cost 53.6 cents as UAN32 and 49.1 cents as urea. At retail the same month, it cost 71.4 cents as UAN32 and 71.5 cents as urea. UAN's 4.5-cent premium at the Gulf disappears by the time the product reaches the farm.
Evidence:
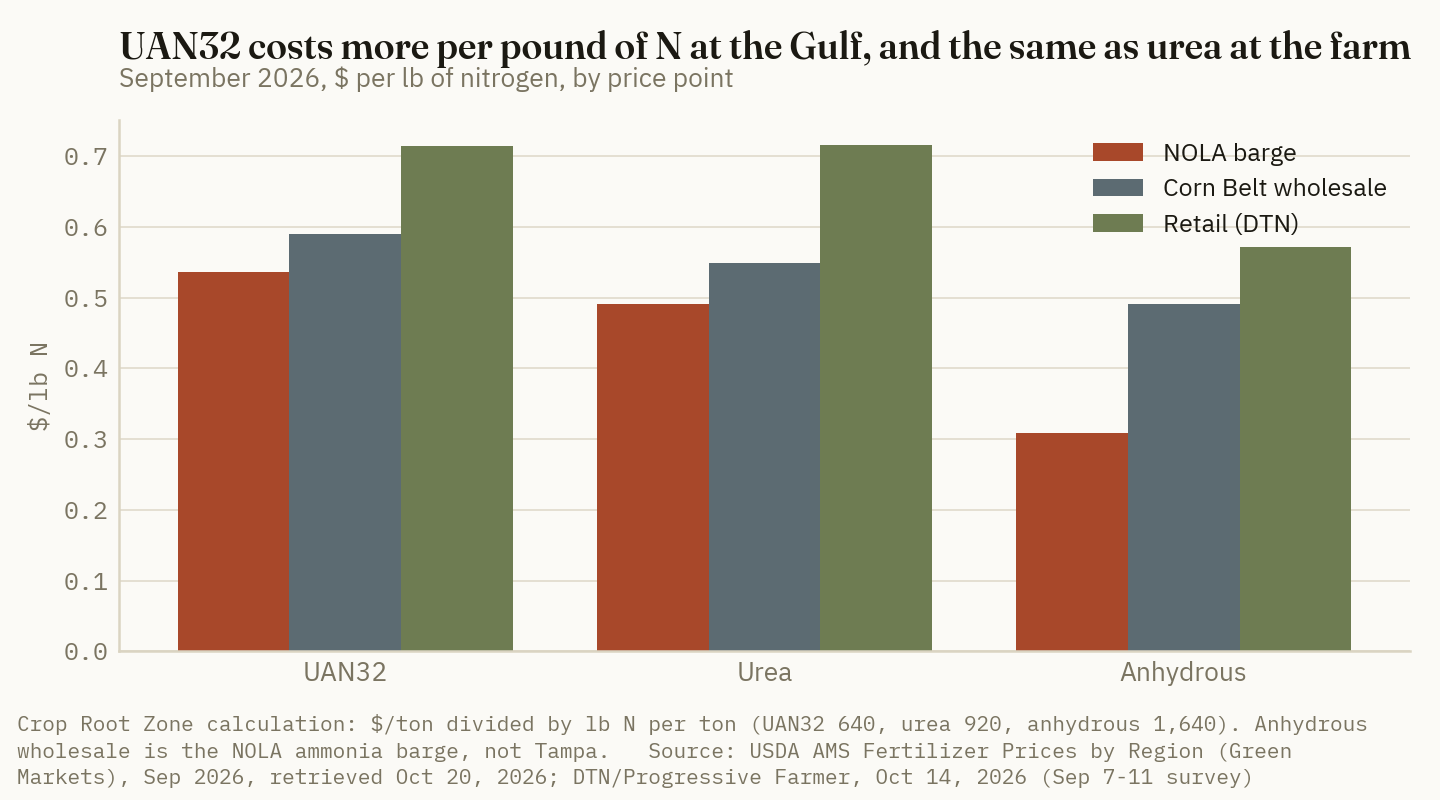
Over the three prior Octobers, the UAN premium at retail ran a little above the premium at the Gulf in two years. In 2025 the order reversed, and in 2026 the retail premium has disappeared.
| $/lb N | Oct 2023 | Oct 2024 | Oct 2025 | Sep 2026 |
|---|---|---|---|---|
| NOLA UAN32 | 0.406 | 0.352 | 0.513 | 0.536 |
| NOLA urea | 0.402 | 0.356 | 0.415 | 0.491 |
| UAN32 premium at NOLA | +0.004 | −0.004 | +0.098 | +0.045 |
| Retail UAN32 | 0.653 | 0.547 | 0.728 | 0.714 |
| Retail urea | 0.625 | 0.527 | 0.653 | 0.715 |
| UAN32 premium at retail | +0.028 | +0.020 | +0.075 | −0.001 |
Crop Root Zone calculation from USDA AMS/Green Markets monthly averages, retrieved Oct 20, 2026, and DTN/Progressive Farmer, Oct 15, 2024, Oct 15, 2025 and Oct 14, 2026 (October survey weeks; Sep 7–11, 2026 for the last column). $/ton ÷ lb N per ton: UAN32 640, urea 920. Premiums are differences of the rounded figures above.
Seen the other way, the retail layer per pound of nitrogen over the NOLA barge in September was 17.8 cents for UAN32, 22.4 cents for urea and 26.4 cents for anhydrous, measured against the NOLA ammonia barge. Over Corn Belt wholesale it was 12.4 cents for UAN32, 16.6 cents for urea and 8.1 cents for anhydrous. Anhydrous's low inland figure reflects a Corn Belt ammonia price that sits $300 a ton over NOLA. It does not mean a cheap retail layer (USDA AMS/Green Markets, retrieved Oct 20, 2026). By early October the retail order had reopened a little. UAN32 was 75.8 cents and urea 73.0 cents (DTN/Progressive Farmer, Oct 14, 2026), because UAN32 caught up with its September barge gain while urea retail fell $11 in a week (DTN/Progressive Farmer, Oct 7, 2026).
We do not have a published reason for the thin UAN layer. Two possibilities fit the data. Much UAN moves from terminal to farm in bulk tenders, with fewer handling steps than dry product. And retail UAN pricing may have been held back in the September survey by the lag described in Section 2. The October figures suggest the second explains part of it, but not all.
Ground Truth: For a grower choosing between UAN32 and urea, the price signal is mostly made at the Gulf. At the farm the two cost within 3 cents a pound of N of each other. At 150 pounds, that is under $4.50 an acre, less than the cost of an extra application pass or a stabilizer. On price alone the form choice is close to a wash this fall. It should be made on timing, application equipment and loss risk. If UAN's retail layer rebuilds toward urea's, UAN32 will rise at the farm without any move at the barge. Because of that, we would not count on UAN32 retail falling faster than urea's this winter.
5. Supply, a market getting harder to see, and the spring decision
What's new: UAN's import line is thin, two producers are running reduced or committed books, and the public wholesale price signal is narrowing.
Evidence: US UAN imports in July were 150,256 tonnes, down 33% on the year and 25% under the July average, and Russian UAN fell 70% (Crop Root Zone, TRZ-0278, Oct 14, 2026). CVR Partners, which sold its second-quarter UAN at an average realized gate price of $392 a ton, scheduled a six-week turnaround at East Dubuque from August and guided third-quarter ammonia utilization to 75–80%, against 99% in the second quarter (CVR Partners, Jul 29, 2026). The same release shows Corn Belt UAN averaging $534 in the second quarter, against $403 a year earlier. CF told investors it had prioritized urea production over UAN in the second quarter, which limited UAN availability (CF Industries, Aug 6, 2026).
The public benchmarks are also thinning. MIAX's physically settled NOLA fertilizer futures, for urea, MAP, DAP and potash, were set to begin trading on Oct 19. UAN is not among them (Fertilizer Daily, Oct 4, 2026). The front-month CME UAN FOB NOLA futures contract showed no trades and open interest of 30 contracts when we checked (TradingView, accessed Oct 20, 2026). S&P Global Platts said it would discontinue its weekly UAN FOB NOLA Cincinnati netback assessment after Oct 29, while keeping its FOB NOLA 32% and FCA Cincinnati assessments (S&P Global Platts, Aug 12, 2026). For a grower or retailer outside the subscription services, the USDA Green Markets monthly series is the best free read on the barge. It arrives several weeks after the month ends.
That matters for spring pricing because retail follows the barge closely. The scenarios below apply the two-thirds pass-through from Section 3 to a range of barge levels by late winter. They are estimates, not forecasts.
| NOLA UAN32 barge by Feb–Mar 2027 | Barge change from Sep, $/st | Implied retail UAN32, $/ton | $/lb N | Change at 150 lb N/acre |
|---|---|---|---|---|
| $300 (back to the fill level) | −43.00 | 456* | 0.713* | −$6.72* |
| $343 (flat) | 0.00 | 485* | 0.758* | $0.00* |
| $400 | +57.00 | 523* | 0.817* | +$8.91* |
| $498.50 (May 2026 repeat) | +155.50 | 589* | 0.920* | +$24.30* |
*Crop Root Zone estimates: $485 retail (DTN/Progressive Farmer, Oct 14, 2026) plus two-thirds of the barge change from September's $343 (USDA AMS/Green Markets, retrieved Oct 20, 2026). Per-acre values at 150 lb N, or 0.234 ton of UAN32. 150 lb N/acre is illustrative. Excludes application, stabilizers, prepay discounts and dealer-to-dealer differences.
Carrying cost runs about $16 a ton to pay for UAN32 in October rather than in March, at an illustrative 8% annual rate (Crop Root Zone estimate; use your own operating-line rate). That is $3.79 an acre at 150 pounds. Paying early breaks even if the barge rises about $24 by spring. It rose $36.75 from August to September. On the scenarios above, waiting saves at most about $7 an acre if the barge returns to the fill level, and costs about $24 if last spring repeats. Our October analysis of on-farm storage found that a 5,000-gallon tank needs a fall-to-spring gap above $83 a ton to pay (Crop Root Zone, TRZ-0264, Oct 8, 2026). Only the last scenario clears it.
Ground Truth: The spring UAN decision is lopsided. With imports a third lower, Russian supply largely gone and the cheap July fill already in the channel, the barge has more room to rise than to fall, and retail passes about two-thirds of any rise through within a month or two. Our read is to price the spring UAN32 tons that a grower is sure to use now, at a quote near the $485 national or $488 Iowa average, and to leave only the tons that depend on the season or a rate decision. The grower who waits saves a few dollars an acre if the barge eases. The one who waits into a repeat of last spring pays about $24 an acre more.
What to watch, in order:
- USDA's October Green Markets average. An October NOLA figure near $343 confirms the Section 2 reading and puts the same-month gap back near $140. A figure above $375 starts a retail step of about $20 within a month.
- The end of the fill books. CF said its UAN book runs into November. Once it runs out, dealers price more of their tons off spot replacement, and the fill-basis advantage is gone.
- DTN's November surveys and the next Iowa report. A narrower Iowa range, now $399–$585, with a lower top would be the first sign of dealers competing for spring tons.
- Third-quarter producer results. CVR's and CF's realized UAN prices and any comment on the winter fill will be the first producer read on winter UAN pricing, and arrive just as the Platts netback series ends.
References
- DTN/Progressive Farmer, Russ Quinn, "UAN32 Leads Fertilizer Prices Higher Again in First Week of October," Oct 14, 2026 (survey week Oct 5–9, 2026; month-ago Sep 7–11, 2026; year-ago Oct 6–10, 2025) — https://www.dtnpf.com/agriculture/web/ag/crops/article/2026/10/14/uan32-leads-fertilizer-prices-higher
- DTN/Progressive Farmer, Russ Quinn, "UAN32 Leads Fertilizer Prices Higher," Oct 7, 2026 (survey week Sep 28–Oct 2, 2026) — https://www.dtnpf.com/agriculture/web/ag/crops/article/2026/10/07/uan32-leads-fertilizer-prices-higher
- DTN/Progressive Farmer, Russ Quinn, "Anhydrous Leads Fertilizer Prices Higher, Up 25% From a Year Ago," Sep 30, 2026 (survey week Sep 21–25, 2026) — https://www.dtnpf.com/agriculture/web/ag/crops/article/2026/09/30/anhydrous-leads-fertilizer-prices-25
- DTN/Progressive Farmer, Russ Quinn, "Fertilizer Prices Rise for Six of Eight Major Fertilizers," Sep 23, 2026 (survey week Sep 14–18, 2026) — https://www.dtnpf.com/agriculture/web/ag/crops/article/2026/09/23/fertilizer-prices-rise-six-eight
- DTN/Progressive Farmer, Russ Quinn, retail fertilizer survey, Aug 12, 2026 (survey week Aug 3–7, 2026; month-ago Jul 6–10, 2026; year-ago Aug 4–8, 2025) — https://www.dtnpf.com/agriculture/web/AG/crops/article/2026/08/12/fertilizers-start-august-mixed-5-led
- DTN/Progressive Farmer, Russ Quinn, "Fertilizer Prices Continue Downward Trend," Jul 22, 2026 (survey week Jul 13–17, 2026; year-ago Jul 14–18, 2025) — https://www.dtnpf.com/agriculture/web/ag/crops/article/2026/07/22/fertilizer-prices-continue-downward
- DTN/Progressive Farmer, Russ Quinn, "Urea, UAN32 Leads Majority of Fertilizers' Prices Lower," Jun 24, 2026 (survey week Jun 15–19, 2026; month-ago May 18–22, 2026; year-ago Jun 16–20, 2025) — https://www.dtnpf.com/agriculture/web/ag/crops/article/2026/06/24/urea-uan32-leads-majority-prices
- DTN/Progressive Farmer, Russ Quinn, "6 Fertilizer Prices See Sizeable Moves Higher," Apr 22, 2026 (survey week Apr 13–17, 2026) — https://www.dtnpf.com/agriculture/web/ag/crops/article/2026/04/22/6-fertilizer-prices-see-sizeable
- DTN/Progressive Farmer, Russ Quinn, "All 8 Retail Fertilizer Prices Higher, With 4 Up Significantly," Mar 18, 2026 (survey week Mar 9–13, 2026; month-ago Feb 9–13, 2026) — https://www.dtnpf.com/agriculture/web/ag/crops/article/2026/03/18/8-retail-fertilizer-prices-higher-4
- DTN/Progressive Farmer, Russ Quinn, "Seven Fertilizers Show Lower Prices," Jan 21, 2026 (survey week Jan 12–16, 2026; month-ago Dec 15–19, 2025) — https://www.dtnpf.com/agriculture/web/ag/crops/article/2026/01/21/seven-fertilizers-show-lower-prices
- DTN/Progressive Farmer, Russ Quinn, "Anhydrous Again Leads Half of Retail Fertilizer Prices Higher," Nov 12, 2025 (survey week Nov 3–7, 2025) — https://www.dtnpf.com/agriculture/web/ag/crops/article/2025/11/12/anhydrous-leads-half-retail-prices
- DTN/Progressive Farmer, Russ Quinn, retail fertilizer survey, Oct 15, 2025 (survey week Oct 6–10, 2025; month-ago Sep 8–12, 2025) — https://www.dtnpf.com/agriculture/web/ag/crops/article/2025/10/15/urea-retail-price-5-anhydrous-dap
- DTN/Progressive Farmer, Russ Quinn, "Most Retail Fertilizer Prices Continue Lower," Oct 15, 2024 (survey week Oct 7–11, 2024; year-ago Oct 9–13, 2023) — https://www.dtnpf.com/agriculture/web/ag/crops/article/2024/10/15/retail-fertilizer-prices-continue
- DTN/Progressive Farmer, Russ Quinn, "3 Fertilizer Prices Down Significantly in Second Week of September," Sep 18, 2024 (survey week Sep 9–13, 2024; year-ago Sep 11–15, 2023) — https://www.dtnpf.com/agriculture/web/Ag/crops/article/2024/09/18/3-fertilizer-prices-significantly
- USDA Agricultural Marketing Service, Fertilizer Prices by Region (agtransport.usda.gov, dataset 8bgf-5mdv), monthly averages derived from weekly Green Markets reports with permission; UAN (32% N), urea and ammonia, US Gulf NOLA and Corn Belt series, Jan 2023–Sep 2026, retrieved Oct 20, 2026 — https://agtransport.usda.gov/d/8bgf-5mdv
- USDA AMS, Iowa Production Cost Report (Bi-weekly), Oct 16, 2026 — https://www.ams.usda.gov/mnreports/ams_2863.pdf
- USDA AMS, Illinois Production Cost Report (Bi-weekly), Oct 16, 2026 — https://www.ams.usda.gov/mnreports/ams_3195.pdf
- USDA AMS, Grain Transportation Report, Oct 15, 2026 (diesel week ending Oct 12; barge market notes) — https://www.ams.usda.gov/sites/default/files/media/GTR10152026.pdf
- CF Industries, Q2 2026 earnings conference call, Aug 6, 2026 (transcript via The Motley Fool) — https://www.fool.com/earnings/call-transcripts/2026/08/12/cf-industries-cf-q2-2026-earnings-call-transcript/
- CVR Partners, LP, "CVR Partners Reports Second Quarter 2026 Results," Jul 29, 2026 — https://s206.q4cdn.com/964924026/files/doc_financials/2026/q2/UAN-Q2-2026-Earnings-Release-NYSE.pdf
- Fertilizer Daily, "MIAX certifies four physically settled NOLA fertilizer futures ahead of October 19 launch," Oct 4, 2026 — https://www.fertilizerdaily.com/20261004-miax-certifies-four-physically-settled-nola-fertilizer-futures-ahead-of-october-19-launch/
- TradingView, UAN FOB NOLA Futures (CBOT: UNO1!, front month UNOV2026), accessed Oct 20, 2026 — https://in.tradingview.com/symbols/CBOT-UNO1!
- S&P Global Commodity Insights, "Platts to discontinue UAN FOB NOLA Cincinnati netback assessment effective Oct 30," subscriber note, Aug 12, 2026 — https://www.spglobal.com/energy/en/pricing-benchmarks/our-methodology/subscriber-notes/081226-platts-to-discontinue-uan-fob-nola-cincinnati-netback-assessment-effective-oct-30
- Crop Root Zone, TRZ-0282, "Retail Anhydrous Rose $39 in the Month the Tampa Contract Fell. At $977 It Sits $483 Over Wholesale, and Only Summer-Fill Cost Still Explains the Gap.," Oct 15, 2026
- Crop Root Zone, TRZ-0286, "Retail DAP Sits $131.50 Over the NOLA Barge, the Narrowest October Gap in Four Years. Measured Against Summer Fill, the Dealer's Markup Has Shrunk Three Falls Running.," Oct 16, 2026
- Crop Root Zone, TRZ-0278, "US Urea Imports More Than Doubled in July. Ammonia Imports Hit Their Lowest July Since at Least 2019, and UAN Fell a Third. The Fall Gap Is in the Products That Go On This Fall.," Oct 14, 2026
- Crop Root Zone, TRZ-0264, "A 5,000-Gallon UAN Tank Costs $67 a Ton a Year to Own. The Fall-to-Spring Price Gap Has to Top $83 to Pay for It, and Did in Three of the Last Seven Seasons. Add a Containment Dike and the Bar Passes $130.," Oct 8, 2026
Disclosures
Crop Root Zone is an independent publication. Nothing here is investment advice. Market calls, where included, reflect the editors' own read and are not a recommendation to buy or sell any security.
Runner Peanuts Brought $436 a Ton in Mid-October Against a $630 Reference Price. A Wiregrass Irrigated Acre Needs 2.6 Tons to Cover Full Cost, and Georgia Is Forecast at 2.03.
The 2025 reconciliation law raised the peanut reference price to $630 a ton and the national loan rate to $390, and USDA has implemented both. We set those against the 2026 market and the Alabama Extension Wiregrass budgets. At current prices an irrigated acre needs 2.4 to 2.6 tons to cover total specified cost, while Georgia is forecast at 2.03 tons. The projected $150-a-ton PLC payment is paid on base acres, not on this year's crop. Lime, gypsum and boron make up about 7% of irrigated operating cost.
Runner peanuts were bringing $436 a ton at the buying point in the week ending October 17. That is the national average for all grades, 21.8 cents a pound (USDA NASS, Oct 23, 2026) [6]. The price is $194 below the $630-a-ton effective reference price that Congress wrote into the 2025 reconciliation act and USDA has now applied to both the 2025 and 2026 crops (USDA FSA, Jul 10, 2026) [1]. It is also $30 below the $466.39 national posted price FSA has held since August [5]. The 2026 harvest is far from over. Georgia had dug 37% of its crop by October 18, against a 2021-2025 average of 46% (USDA NASS, Oct 19, 2026) [8]. USDA forecasts Georgia's yield at 4,050 pounds, or 2.03 tons an acre, on 660,000 harvested acres, down from 910,000 in 2025 (USDA NASS, Oct 9, 2026) [7]. This piece works out what a runner acre earns at those numbers, what the federal program adds and to whom, and where the land-grant budgets put the break-even.
1. The program numbers are settled, and they differ from what some growers were told
What's new: Public Law 119-21, the reconciliation act signed July 4, 2025, changed three peanut parameters. USDA's own notices now call it the Working Families Tax Cut Act. The statutory reference price went from $535 to $630 a ton. The effective-reference-price formula now uses 88% of the five-year Olympic average instead of 85%, still capped at 115% of the statutory price. Starting with the 2031 crop, statutory reference prices rise 0.5% a year, up to 113% of the 2025 level (farmdoc daily, Jul 15, 2025) [9]. The national marketing loan rate went from $355 to $390 a ton, beginning with the 2026 crop (USDA FSA, Jun 16, 2026) [4].
Evidence: We checked FSA's published tables to see what USDA actually implemented. The results are below.
| Peanut program parameter | 2025 crop | 2026 crop | Basis / status |
|---|---|---|---|
| Statutory reference price | $630 | $630 | $0.3150/lb |
| 88% of 5-yr Olympic average MYA | n/a | $453 | $0.2265/lb; 2020/21-2024/25 MYAs |
| 115% cap | n/a | $725 | $0.3623/lb |
| Effective reference price | $630 | $630 | Statutory price binds |
| National loan rate | $355 | $390 | $0.1775 / $0.1950 per lb |
| Runner loan rate, average-grade ton | n/a | $388.66 | Effective Aug 1, 2026 |
| Marketing-year average price | $470 (final) | $480 (projected) | $0.2350 F / $0.2400 P |
| PLC payment rate | $160 (final) | $150 (projected) | $0.0800 F / $0.0750 P per lb |
| Maximum PLC rate (ERP minus loan rate) | $275 | $240 | Rises as loan rate rises |
| Separate peanut payment limit, per entity | $155,000 | $155,000 | Up from $125,000; CPI-indexed |
Source: USDA FSA, 2026 ERP table, Jul 10, 2026 [1]; USDA FSA, projected 2026 PLC rates, Oct 9, 2026 [2]; USDA FSA, 2025 PLC rates, Sep 30, 2026 [3]; USDA FSA, 2026-crop peanut loan rates, Jun 16, 2026 [4]; Georgia Farm Bureau, Nov 27, 2025, for the payment limit [10]. $/ton converted at 2,000 lb. "F" = final, "P" = projected. The FSA ERP table shows only the 2026 calculation; 2025 cells marked n/a were not retrieved.
Three conflicts came up. First, a Georgia Farm Bureau summary of a UGA presentation describes the $630 reference price as starting "for the 2026 crop" [10]. FSA's 2025 PLC table carries $0.3150 as the 2025 effective reference price [3], and farmdoc's reading of the statute says the reference-price increases start with the 2025 crop [9]. The FSA table is what pays, so we treat $630 as applying to 2025 as well. Second, one extension slide deck says the effective-reference-price cap was cut to 113%. FSA's 2026 table still uses a 115% column [1]. The 113% figure belongs to the 2031 escalator, not to the cap. Third, Southeast AgNet's reported $160-a-ton 2025 payment [16] matches FSA's final rate exactly [3]. Its September 25 report of an "about $500 per ton" farm price [17] does not match NASS's weekly series, which has not printed a runner price above $456 this season [6].
The 88% formula does nothing for peanuts at today's prices. Eighty-eight percent of the Olympic average works out to $453 a ton. That is well under the $630 statutory price, so the statutory number binds. The formula would need peanut prices to average about $716 a ton for five years before it mattered.
Ground Truth: The loan-rate increase is the change growers should watch, because it costs them PLC money. Each dollar added to the loan rate takes a dollar off the maximum PLC rate. That maximum fell from $275 to $240 a ton between 2025 and 2026 [2][3]. With a $480 market, the cap does not bind. If the MYA falls below $390, it does. In that case the loan program, with loan deficiency payments when the posted price is below the loan rate, pays on actual production, and PLC stops at $240 a ton of base.
2. What the market is actually paying, and the PLC payment is not part of it
What's new: NASS's weekly survey of first buyers shows the runner price at $382 a ton in the week ending September 19, $434 to $456 since then, and $436 in the week ending October 17. All types together averaged 22.8 cents, or $456 a ton [6]. Spring contracts were low. In March, buying points offered $415 a ton for runners with no tonnage limit, and a runner pool carried a $400 floor. Virginia-type contracts were up to $425 (Southeast AgNet, Mar 16, 2026) [15]. UGA's January outlook had a $350-$475 range without a trade breakthrough and $500-$550 with one (UGA Extension, Feb 13, 2026) [14]. The harvest market has landed near the middle of the lower range.
Evidence:
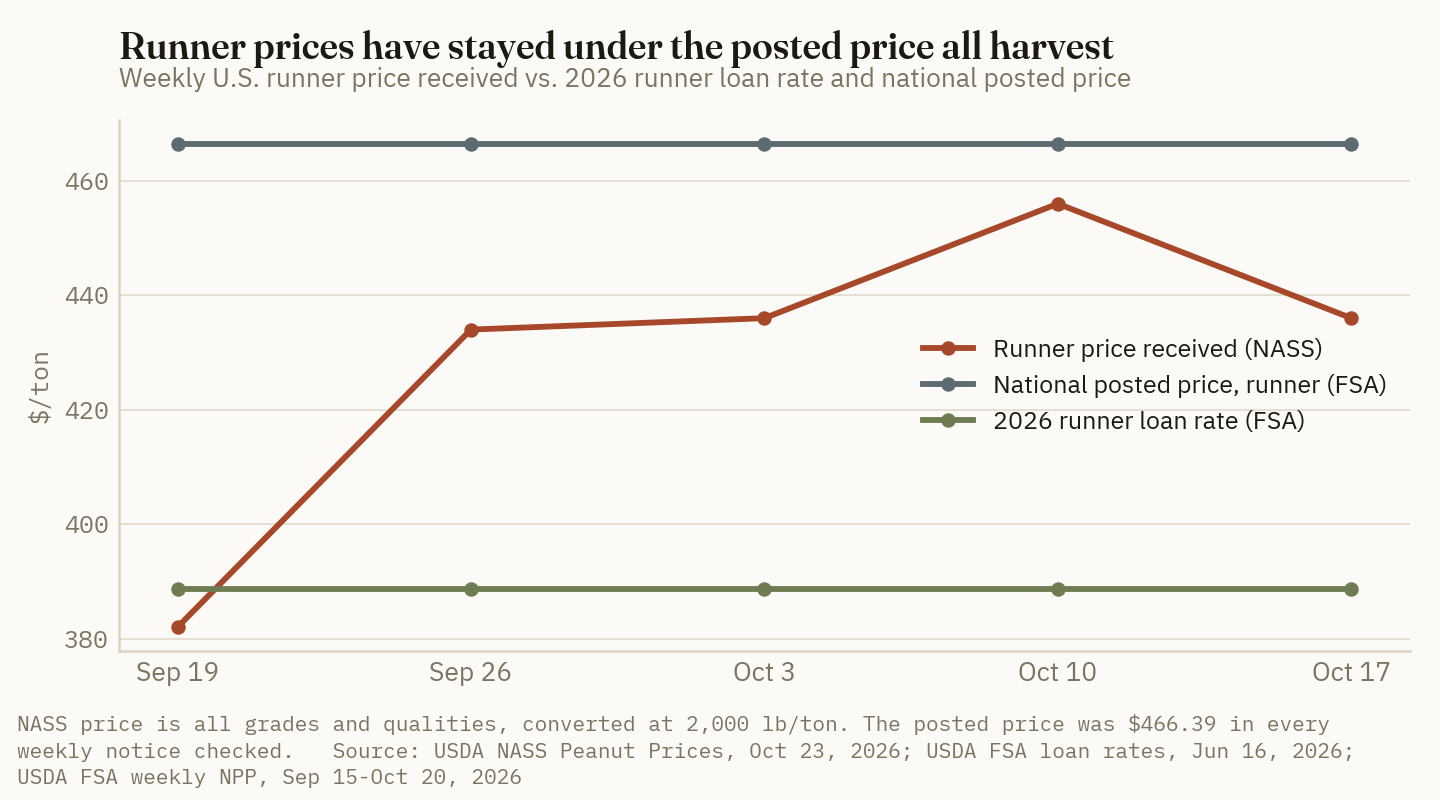
The national posted price has been $466.39 a ton in every weekly FSA notice we checked, from September 15 through October 20 [5]. That is exactly 120% of the $388.66 runner loan rate. Because the posted price is above the loan rate, there is no loan deficiency payment, and a grower who puts peanuts under loan repays at the loan rate plus interest. In practice the loan gives growers time to market the crop. It does not add to the price this fall.
The March contract story included one mistake worth correcting. One report added the projected PLC rate to the contract price and called the total "about $565 a ton" [15]. PLC is not paid per ton harvested. It is paid on 85% of a farm's peanut base acres times the farm's PLC payment yield, whatever is planted. Payments are also reduced by sequestration, reported at 5.7% (Southeast AgNet, Sep 10, 2026) [16]. The 2025 payment, issued this October, is a payment on base, not on the 2025 crop.
| PLC payment yield (lb/base acre) | 2025 crop, $0.080/lb (final) | 2026 crop, $0.075/lb (projected) |
|---|---|---|
| 3,000 | $192 | $180 |
| 3,500 | $224 | $210 |
| 4,000 | $257 | $240 |
Source: Crop Root Zone calculation. Rates from USDA FSA, Sep 30, 2026 and Oct 9, 2026 [3][2]. The 85% payment-acre factor and the 5.7% sequestration rate are from Southeast AgNet, Sep 10, 2026 [16]; we did not confirm the sequestration rate in an FSA notice. Basis: $ per base acre, after sequestration, before the $155,000 limit. Payment yields are illustrative. Individual farm PLC yields are on FSA records and were not available for this piece.
$150 a ton of base, not of crop
USDA's projected 2026 peanut PLC rate. It is paid on 85% of base acres at the farm's payment yield, whether or not that base is in peanuts this year. (USDA FSA, Oct 9, 2026)
3. What the land-grant budgets say a runner acre costs
What's new: We could not use the University of Georgia's 2026 enterprise budgets. On October 26, both UGA Agricultural and Applied Economics budget pages and the CAES peanut budget page failed with TLS certificate errors. We did not work around the errors. Instead we used the Alabama Cooperative Extension System's February 2026 peanut planning budgets. They are written for the same Wiregrass production region and use the same buying-point structure (Alabama Extension, Feb 2026) [11][12]. For Texas we used Texas A&M AgriLife's 2026 budget for sprinkler-irrigated runners in the Panhandle (Texas A&M AgriLife, 2026) [13].
Evidence: The Alabama irrigated budget assumes 2.50 tons, eight acre-inches of irrigation and seven fungicide applications. It totals $765.15 an acre in variable cost and $1,135.36 in total specified cost. The total includes $169 of machinery ownership, $140 of irrigation fixed cost and 8% overhead. It does not include land rent or land ownership cost [11]. The non-irrigated budget assumes 1.75 tons and totals $625.90 variable and $844.97 total [12]. The Texas Panhandle budget assumes 2.25 tons and $500 peanuts. It totals $926.85 variable and $1,180.28 total, including $125 cash rent, and publishes its own total-cost break-even of $524.57 a ton [13].
| Alabama irrigated runner, variable cost line | $/acre | |
|---|---|---|
| Seed (130 lb at $0.90) | 117.00 | ██████████ |
| Fungicides (7 applications) | 105.00 | █████████░ |
| Irrigation (8 acre-inches) | 96.00 | ████████░░ |
| Tractor/machinery, operating | 76.00 | ██████░░░░ |
| Drying, hauling, checkoff | 68.75 | ██████░░░░ |
| Labor | 67.48 | ██████░░░░ |
| Herbicides | 60.00 | █████░░░░░ |
| Fertility: lime, gypsum, boron, soil test | 52.73 | █████░░░░░ |
| Insecticides (in-furrow and foliar) | 35.00 | ███░░░░░░░ |
| Interest on operating capital | 31.19 | ███░░░░░░░ |
| Crop insurance | 30.00 | ███░░░░░░░ |
| Cover crop establishment | 30.00 | ███░░░░░░░ |
Source: Alabama Cooperative Extension System, ANR-2852, Peanut-Irrigated 2026 planning budget, revised Feb 2026 [11]. Basis: $/acre, 2.50 t/ac yield goal, no land rent. The line items add to $769.15. The budget prints a $765.15 total. We report the lines as published and use the budget's own total in the break-even work.
The fertility line is small. Alabama budgets no N, P or K for peanuts. The crop fixes its own nitrogen and is expected to use residual P and K from the rotation at medium soil-test levels. Fertility spending is a third of a ton of lime at $57.50 ($18.98), a third of a ton of gypsum at $75 ($24.75), $5 of boron and micronutrients, and a $4 soil test. All of it is custom-spread [11].
| Budget | Fertility $/acre | Share of variable cost | Share of total specified cost | Fertility products |
|---|---|---|---|---|
| Alabama irrigated (2.50 t) | 52.73 | 6.9% | 4.6% | Lime, gypsum, boron, soil test |
| Alabama non-irrigated (1.75 t) | 52.73 | 8.4% | 6.2% | Same program |
| Texas Panhandle irrigated (2.25 t) | 90.66 | 9.8% | 7.7% | 80 lb N, 50 lb P, custom application |
Source: Crop Root Zone calculation from Alabama Extension ANR-2852 irrigated and non-irrigated budgets, Feb 2026 [11][12], and Texas A&M AgriLife 2026 D1 peanut budget [13]. Basis: $/acre at each budget's yield goal.
Ground Truth: Cutting gypsum is the wrong way to save money on a $436 crop. The whole calcium-and-lime program costs about $44 an acre, roughly a tenth of a ton of peanuts. Gypsum supplies calcium to the developing pod, and calcium shortfalls show up as poor kernel fill and lower grade, which cost far more than $44 at the buying point. Savings in this budget are in seed (130 lb at $0.90 is the single largest line), in the number of fungicide trips, and in the eight acre-inches of irrigation. The fertility program is not where the money is.
4. Break-even yields: where Georgia's 2.03 tons lands
What's new: We recalculated each budget's break-even yield at three prices: this month's runner price ($436), the posted price ($466), and USDA's projected marketing-year average ($480). Costs that vary with tonnage were scaled to yield. That is $27.50 a ton for drying, hauling and checkoff in Alabama and $80 a ton for harvest, haul and drying in Texas. All other costs were held fixed per acre. These are our calculations, not figures published by the extension services, except where a break-even is printed on the budget.
Evidence:
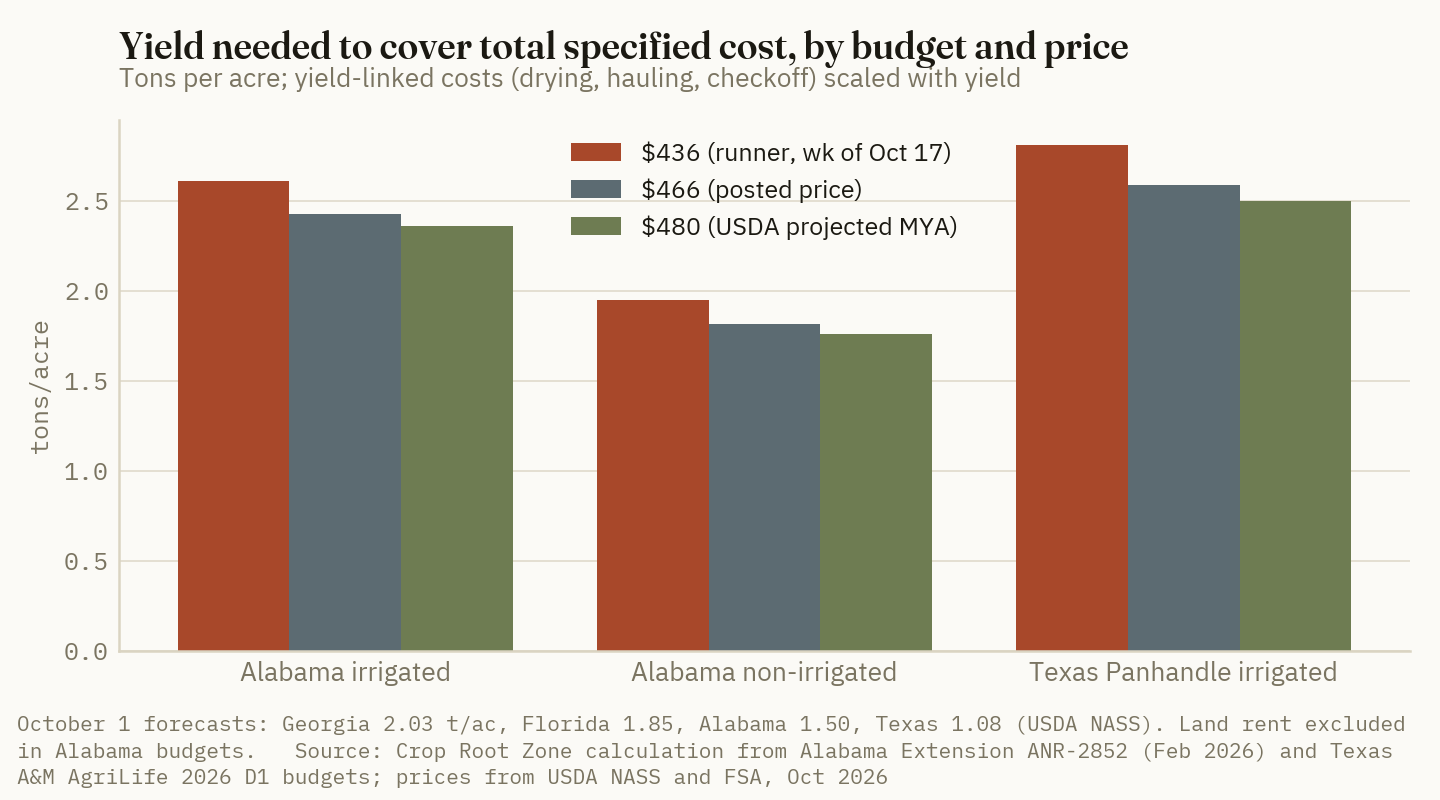
| Budget | Variable-cost break-even at $436 | Total-cost break-even at $436 | Total-cost break-even at $480 | Break-even price at budget yield goal (total cost) |
|---|---|---|---|---|
| Alabama irrigated | 1.70 t | 2.61 t | 2.36 t | $454/t at 2.50 t |
| Alabama non-irrigated | 1.41 t | 1.95 t | 1.76 t | $483/t at 1.75 t |
| Texas Panhandle irrigated | 2.10 t | 2.81 t | 2.50 t | $525/t at 2.25 t (published) |
Source: Crop Root Zone calculation from Alabama Extension ANR-2852, Feb 2026 [11][12], and Texas A&M AgriLife 2026 D1 [13]. Prices: USDA NASS, Oct 23, 2026 [6] and USDA FSA, Oct 9, 2026 [2]. Basis: tons of farmer-stock peanuts per acre. Alabama totals exclude land rent; Texas includes $125/ac cash rent.
The yields to compare against are USDA's October 1 forecasts. Georgia is at 4,050 lb (2.03 t), Florida 3,700 lb (1.85 t), Alabama 3,000 lb (1.50 t) and Texas 2,150 lb (1.08 t). Alabama's forecast has fallen 400 lb since 2025, and Texas has lost 340 lb (USDA NASS, Oct 9, 2026) [7]. Crop condition is middling. In Georgia, 50% of the crop was rated good or excellent and 12% poor or very poor. In Alabama, 20% was rated poor [8].
At Georgia's state-average 2.03 tons and $436, gross revenue is $883 an acre. The Alabama irrigated cost structure, with variable cost scaled to that yield, is $752. That leaves about $131 an acre over variable cost and about $239 short of total specified cost, before rent. On the non-irrigated cost structure the same yield covers total specified cost by about $30. Georgia's average combines irrigated and dryland fields, so the actual result for an irrigated farm depends on whether its yield beats the 2.03-ton average by something close to the 0.75-ton gap between the two Alabama budgets' yield goals. Alabama's 1.50-ton forecast is above the non-irrigated variable break-even of 1.41 tons and well below its 1.95-ton total-cost break-even. Texas at 1.08 tons is below every Texas Panhandle break-even on the chart. The Texas state average includes a large dryland share, and the Panhandle irrigated budget is not a good fit for that.
UGA's outlook puts the long-run record bluntly. Between 1995 and 2024, peanut revenue exceeded total production cost in only five years, and growers averaged a $55-an-acre loss [14]. This season fits that record unless something other than the cash price helps.
5. What closes the gap, and for whom
What's new: Three things sit between this crop and a loss on total cost. They are the cash market, the PLC payment on base, and yield above the budget assumption. Of the three, PLC is the only one that is already largely known.
Evidence: Use the Alabama irrigated acre at Georgia's average yield. It is about $239 short of total specified cost at $436 and about $150 short at $480. The PLC table in Section 2 shows that a farm with peanut base at a 3,500-lb payment yield collects about $210 per base acre on the projected 2026 rate. Whether that closes the gap depends on how much base a farm has compared with how many acres it plants. Georgia planted 915,000 acres of peanuts in 2025 and 670,000 in 2026 [7]. Base acres are a historical allocation and do not track either number. A grower who planted peanuts on cotton or corn base collects whatever that base's own program pays, not peanut PLC. A grower with peanut base who switched to cotton still collects the peanut payment. The reconciliation act's new base allocation, built from 2019-2023 plantings and capped at 30 million acres nationally, starts with the 2026 crop [10]. Growers should check what their FSA office has assigned before counting on it.
Ground Truth: Do not let the size of the PLC payment drive next year's peanut acreage. PLC pays on base whether or not the crop is planted, so it is the same check either way. The planting decision for 2027 should be made on the cash price against the budget, and right now the budget is losing at $436. Price is also the only number here likely to change. With 2026 production forecast at 5.11 billion pounds, down 28% from 7.10 billion in 2025 [7], prices for the 2027 crop have room to rise. That is a reason to wait for a better contract offer, not a reason to plant more acres now.
What to watch next: the weekly NASS price series as Georgia's harvest moves from 37% toward completion [6][8]; whether FSA moves the $466.39 posted price for the first time this season [5]; the November WASDE revision to the $480 projected marketing-year average, which sets the final 2026 PLC rate [2]; and the first 2027 contract offers, which will show whether shellers price the smaller crop in.
References
- USDA Farm Service Agency, "Table 2. 2026 Effective Reference Price Calculations," Jul 10, 2026. https://www.fsa.usda.gov/sites/default/files/2026-07/2026_ERP.pdf
- USDA Farm Service Agency, "Table 3. Projected 2026 Price Loss Coverage Payment Rates," Oct 9, 2026. https://www.fsa.usda.gov/sites/default/files/2026-10/2026_PLC.pdf
- USDA Farm Service Agency, "Table 3. 2025 Price Loss Coverage Payment Rates" (peanut MYA final), Sep 30, 2026. https://www.fsa.usda.gov/sites/default/files/2026-10/2025_PLC.pdf
- USDA Farm Service Agency / CCC, "USDA Announces Loan Rates for 2026-Crop Peanuts," Jun 16, 2026. https://www.fsa.usda.gov/sites/default/files/2026-06/USDA%20Announces%20Loan%20Rates%20for%202026-Crop%20Peanuts.pdf
- USDA Farm Service Agency, "Weekly National Posted Prices for Peanuts," Oct 20, 2026 (also weekly notices of Sep 15, Sep 22, Sep 29, Oct 6 and Oct 13, 2026). https://www.fsa.usda.gov/sites/default/files/2026-10/peanut102026.pdf
- USDA NASS, "Peanut Prices," released Oct 23, 2026 (weeks ending Sep 19-Oct 17, 2026). https://www.nass.usda.gov/Publications/Todays_Reports/reports/pnpr4326.pdf
- USDA NASS, "Crop Production," released Oct 9, 2026 (also Sep 11, 2026 edition). https://esmis.nal.usda.gov/sites/default/release-files/796101/crop1026.txt
- USDA NASS, "Crop Progress," released Oct 19, 2026. https://esmis.nal.usda.gov/sites/default/release-files/796110/prog4226.txt
- Schnitkey, G., N. Paulson, J. Coppess (University of Illinois) and C. Zulauf (Ohio State), "Impacts of the Commodity Title Changes Under the One Big Beautiful Bill Act (OBBBA) for Midwestern Farms in 2025," farmdoc daily (15):128, Jul 15, 2025. https://farmdocdaily.illinois.edu/2025/07/impacts-of-the-commodity-title-changes-under-the-one-big-beautiful-bill-act-obbba-for-midwestern-farms-in-2025.html
- Georgia Farm Bureau, "Details of cotton, peanut programs in OBBBA emerge," Nov 27, 2025. https://www.gfb.org/special-blog/post/details-of-cotton-peanut-programs-in-obbba-emerge
- Alabama Cooperative Extension System (Sawadgo, Runge, Wells), "Peanut - Irrigated Enterprise Planning Budget Summary, Alabama, 2026," ANR-2852, revised Feb 2026. https://www.aces.edu/wp-content/uploads/2025/09/ANR-2852_PeanutsIRR26_021826L.pdf
- Alabama Cooperative Extension System (Sawadgo, Runge, Wells), "Peanut - Enterprise Planning Budget Summary, Alabama, 2026" (non-irrigated), ANR-2852, revised Feb 2026. https://www.aces.edu/wp-content/uploads/2025/09/ANR-2852_Peanuts26_021826L.pdf
- Texas A&M AgriLife Extension (M. B. Day), "2026 Estimated Costs and Returns per Acre, Peanuts, Runner, Sprinkler Irrigated, Panhandle Extension District 1," 2026. https://agecoext.tamu.edu/wp-content/uploads/2026/01/2026D1Peanuts.pdf
- Liu, Y., "2026 Peanut Outlook and Market Situation," UGA Extension AP 130-4-05, Jan 23, 2026, revised Feb 13, 2026. https://fieldreport.caes.uga.edu/publications/AP130-4-05/2026-peanut-outlook/
- Southeast AgNet (T. Spearman), "Peanut Contracts Available For Crop to Be Planted," Mar 16, 2026. https://southeastagnet.com/2026/03/16/peanut-contracts-new-crop-runner-virginia-prices-plc-assistance/
- Southeast AgNet (T. Spearman), "Federal Peanut Program Updates," Sep 10, 2026. https://southeastagnet.com/2026/09/10/peanut-farmers-plc-payment-low-prices-farm-bill/
- Southeast AgNet (T. Spearman), "Peanut Digging and Processing Begins," Sep 25, 2026. https://southeastagnet.com/2026/09/25/peanut-harvest-prices-supply-acreage-usda/
Disclosures
Crop Root Zone is an independent publication. Nothing here is investment advice. Market calls, where included, reflect the editors' own read and are not a recommendation to buy or sell any security.
The 2027 Kansas Wheat Guarantee Is $274 an Acre at 75% on a 45-Bushel APH, 45% Above Last Year's Starting Point. The July Board Now Sits 4 Cents Under the 85% Price Trigger.
RMA set the 2027 hard red winter projected price at $8.11 with a 0.25 volatility factor, against $5.61 and 0.19 for the 2026 crop, which finished at a $6.28 harvest price. We work out the Revenue Protection guarantee for 35- to 55-bushel APHs at 70% to 85% coverage. We set it, net of an estimated premium built from 2026 Kansas rates, against five K-State wheat budgets repriced to October fertilizer. At 75% coverage, the guarantee covers cash costs plus rent once the APH reaches 35 to 47 bushels. Covering full cost, machinery included, takes an APH of 49 to 57. Basis can take about a tenth off the cash floor near the trigger. Below the trigger, a spring rescue application of nitrogen returns nothing.
The price that insures the 2027 hard red winter wheat crop was set two months ago, and the market has since fallen well below it. USDA's Risk Management Agency set the 2027 projected price for Kansas, Oklahoma and Texas winter wheat at $8.11 a bushel, with a volatility factor of 0.25. The figure is the average July 2027 Kansas City close from August 15 to September 14 (USDA RMA, Sep 17, 2026) [1]. July 2027 KC settled at $6.8525 on October 22, 15.5% below that level (USDA AMS, Oct 22, 2026) [5]. Our September pieces repriced K-State's wheat budgets and checked the 75% guarantee at K-State's own planning yields [10][11]. This piece answers the question growers are left with now that coverage is locked: what the guarantee is worth on an acre at their own APH and coverage level, what it costs, and where it does and does not cover cost.
1. The 2027 price, the 2026 outcome, and where the board went
What's new: The $8.11 is the highest Kansas winter wheat projected price in at least four years. Kansas was $7.34 for the 2024 crop, $5.90 for 2025 and $5.61 for 2026 [3][2]. The volatility factor rose from 0.19 to 0.25 [2][1], so the market expects wider price swings over the coming year, and that raises the premium rate.
Evidence:
| Southern Plains winter wheat | 2025 projected | 2025 harvest | 2026 projected | 2026 vol. factor | 2026 harvest | 2027 projected | 2027 vol. factor |
|---|---|---|---|---|---|---|---|
| Kansas | 5.90 | 5.37 | 5.61 | 0.19 | 6.28 | 8.11 | 0.25 |
| Oklahoma | — | 5.37 | 5.61 | 0.19 | 6.28 | 8.11 | 0.25 |
| Texas | — | 5.37 | 5.61 | 0.19 | 6.28 | 8.11 | 0.25 |
Source: USDA RMA, PM-26-056 attachment, Sep 17, 2026 [1]; PM-25-059 attachment, Sep 16, 2025 [2]; June 2025 and June 2026 harvest price discovery attachments (PM-26-037, Jul 1, 2026) [4][6]; FCSAmerica, citing RMA, for the 2025 Kansas projected price [3]. Basis: $/bu, conventional, KC HRW July futures. Prices for Oklahoma and Texas for 2025 were not retrieved. Nebraska, Colorado and South Dakota winter wheat also carry $8.11 for 2027, with volatility factors of 0.27. Montana and Wyoming are 0.28. Soft red winter states are $7.51 to $7.54 [1].
In 2025 and 2026 the policy behaved in opposite ways. In 2025 the harvest price, $5.37, ended 53 cents below the $5.90 projected price, so Revenue Protection paid on price as well as yield. In 2026 the harvest price ended 67 cents above the projected price, at $6.28 [6]. Revenue Protection uses the higher of the two prices to set the guarantee, so 2026 guarantees rose by about 12% at harvest. That mattered, because the 2026 crop failed in much of the Plains. Kansas harvested 34.0 bushels an acre on 5.9 million acres, for 200.6 million bushels. In 2025 it harvested 51.0 bushels and 346.8 million bushels. Oklahoma averaged 28.0 bushels (USDA NASS, Sep 30, 2026) [7].
The insurance figures show the size of the loss. RMA's Summary of Business file, posted October 17, shows 5.84 million Kansas wheat acres under RP for 2026. Farmers and the government together paid $181.7 million in premium on those acres, and indemnities so far total $272.7 million. That is a loss ratio of 1.50, or $46.73 paid per insured acre (USDA RMA, Summary of Business, Oct 17, 2026) [8]. Claims are still being settled, so the indemnity total may rise.
The board has since moved away from the 2027 price. July 2027 KC settled $8.0575 on September 15 [10] and $7.745 on September 25 [11]. On October 22 it closed at $6.8525. Kansas country elevators bid ordinary-protein HRW at $5.86 to $6.06 that day, 60 to 80 cents under December KC at $6.6575. A year earlier the bids were about $4.05 to $4.16 [5].
2. What the guarantee is worth, by APH and coverage
What's new: At the September 30 sales closing, each Kansas winter wheat policy was locked in at $8.11 times the chosen coverage times the grower's APH. The table puts dollar figures on that for the yields most Kansas operations insure. The guarantee can only go up from here, and it does so only if the June 2027 harvest price closes above $8.11.
Evidence:
| APH, bu/ac | 70% | 75% | 80% | 85% |
|---|---|---|---|---|
| 35 | 198.69 | 212.89 | 227.08 | 241.27 |
| 40 | 227.08 | 243.30 | 259.52 | 275.74 |
| 45 | 255.46 | 273.71 | 291.96 | 310.21 |
| 50 | 283.85 | 304.12 | 324.40 | 344.67 |
| 55 | 312.23 | 334.54 | 356.84 | 379.14 |
Source: Crop Root Zone calculation, APH × coverage × $8.11 (USDA RMA PM-26-056, Sep 17, 2026) [1]. Basis: $/acre, revenue guarantee before premium. For reference, Kansas averaged 43.0, 51.0 and 34.0 bu/ac in 2024, 2025 and 2026 [7]. An individual APH is a 4-to-10-year farm record and can differ widely from these averages.
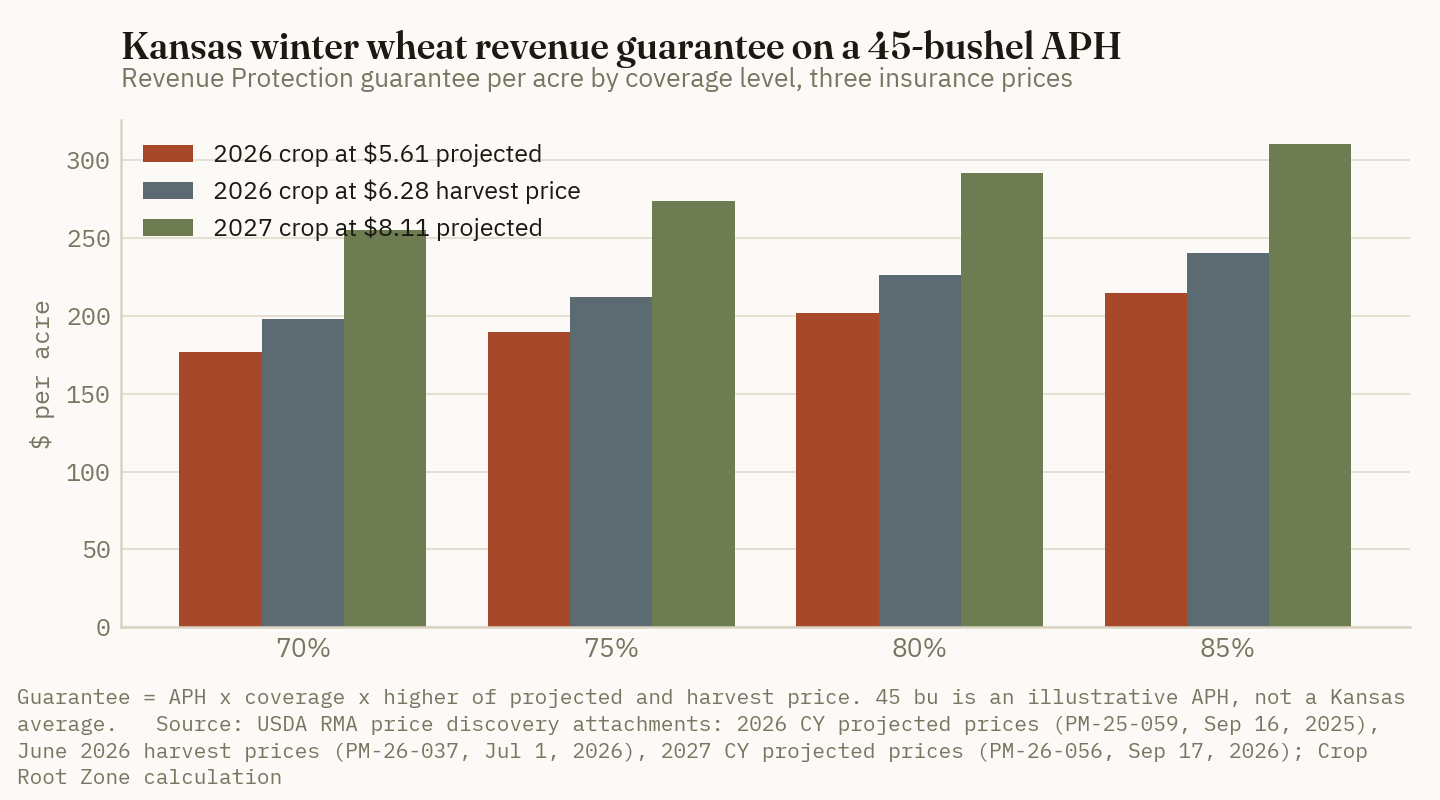
The change from last year is larger than the change in the price headline suggests. On a 45-bushel APH at 75%, the 2026 guarantee started at $189.34. The $6.28 harvest price raised it to $211.95. The 2027 guarantee starts at $273.71, which is $84 more than last year's starting point and $62 more than last year's final figure. Every 2027 guarantee is set at the higher price from the start, and the market does not need to rise to get it there.
There is a second figure growers should work out. RP pays when the bushels harvested, valued at the harvest price, come to less than the guarantee. Suppose the crop comes in exactly at APH. Then the policy pays only if the June harvest price ends below coverage × $8.11. Today's board shows how close each coverage level is to that point.
| Coverage | Price trigger at APH yield, $/bu | Cushion vs Jul 27 KC on Oct 22, ¢/bu | |
|---|---|---|---|
| 70% | 5.68 | 117.6 | ██████████ |
| 75% | 6.08 | 77.0 | ███████░░░ |
| 80% | 6.49 | 36.5 | ███░░░░░░░ |
| 85% | 6.89 | −4.1 (in the money) | ░░░░░░░░░░ |
Source: Crop Root Zone calculation from USDA RMA PM-26-056 [1] and the July 2027 KCBT settlement of $6.8525, USDA AMS Kansas Daily Grain Bids, Oct 22, 2026 [5]. Bars scale the cushion; 70% = 10. The harvest price is set in June 2027 and will differ from today's board.
4 cents
The amount by which July 2027 KC wheat ($6.8525 on October 22) sits below the 85% coverage price trigger ($6.89). An 85% policy would pay on price alone today, even if the crop came in at full APH. Kansas insured only about 28,000 acres at 85% in 2026. (Crop Root Zone calculation from USDA RMA, Sep 17, 2026, and USDA AMS, Oct 22, 2026)
3. What the coverage costs
What's new: RMA will not publish 2027 premiums by farm, and individual quotes depend on county, practice, unit structure and APH. RMA's 2026 Summary of Business does show what Kansas wheat growers actually paid, broken out by coverage level and unit structure [8]. We applied those 2026 farmer-paid shares of liability to 2027 liability. The resulting premiums are estimates, and they are probably low. The 2027 volatility factor is 0.25, against 0.19 in 2026, and a higher volatility factor raises the RP premium rate.
Evidence:
| Coverage, Kansas wheat RP | 2026 insured acres | Share of RP acres | Enterprise unit: farmer-paid, % of liability | Optional unit: farmer-paid, % of liability | 2027 EU premium, 45-bu APH, $/ac* | 2027 OU premium, 45-bu APH, $/ac* |
|---|---|---|---|---|---|---|
| 70% | 2,269,495 | 38.9% | 2.68% | 6.95% | 6.86 | 17.75 |
| 75% | 2,566,056 | 44.0% | 2.78% | 8.16% | 7.62 | 22.34 |
| 80% | 548,887 | 9.4% | 4.22% | 10.46% | 12.33 | 30.54 |
| 85% | 28,258 | 0.5% | 6.58% | 11.87% | 20.42 | 36.82 |
Source: USDA RMA, Summary of Business by state/county/crop/type/practice/unit, 2026 crop year, Kansas wheat, Revenue Protection, file dated Oct 17, 2026 [8]; Crop Root Zone calculation. Farmer-paid = total premium less subsidy, divided by liability. *Estimates: 2026 Kansas-average farmer-paid shares × 2027 liability (45 × coverage × $8.11). These are not quotes. The higher 2027 volatility factor makes them likely understated. Acres at 60–65% coverage make up the remaining 7%.
The table explains how Kansas buys coverage. Enterprise units roughly halve the cost of each coverage level compared with optional units, because their subsidy is higher, about 80% of premium at 70–75% coverage against 60–64% for optional units [8]. The cost rises sharply above 75%. On enterprise units, going from 75% to 80% raises the guarantee by $18.25 an acre on a 45-bushel APH and adds about $4.71 of premium. Going from 80% to 85% adds the same $18.25 of guarantee for about $8.09 more. In 2026, 83% of Kansas RP acres sat at 70% or 75%, and fewer than one acre in a hundred was at 85%.
Ground Truth: Kansas wheat growers have mostly bought insurance against crop failure, not against a price fall. At 70% and 75%, the coverage levels on 83% of insured acres, the board would have to drop another 77 cents to $1.18 before the policy paid on a full crop. That was a sound choice when the projected price was $5.61. At $8.11 the price protection was worth more, and the board has already fallen most of the way to the 80% trigger. Coverage cannot be changed until the 2028 crop. The lesson for next September is to check where the 80% and 85% triggers sit against the board before choosing coverage, not just to compare premiums. For 2027, the practical consequence comes in Section 5. Bushels sold forward up to the guaranteed bushels are backed by the $8.11 floor. Bushels sold beyond that are not.
4. Where the guarantee covers out-of-pocket cost and where it does not
What's new: K-State's November 2025 budgets are still the most recent Kansas wheat budgets, and AgManager has not yet posted a 2027 set [9]. We took five of them and repriced their fertilizer to DTN's October 12–16 retail survey: anhydrous $987 a ton, urea $674 and MAP $981 (DTN, Oct 21, 2026) [12]. That added $5.52 to $9.18 an acre in fertilizer. We then split each budget's cost three ways. The first is cash costs, meaning K-State's direct expenses less operator labor and less K-State's insurance line, which we replace with our own premium estimate. The second adds cash rent, the out-of-pocket position of a tenant. The third, total cost, adds operator labor and machinery capital recovery. For each, we found the APH at which the 2027 guarantee, net of the enterprise-unit premium, equals the cost.
Evidence:
| K-State budget (planning yield) | Cash costs, $/ac* | + rent, $/ac* | Total, $/ac* | APH to cover cash + rent: 70% | 75% | 80% | 85% | APH to cover total cost at 75% |
|---|---|---|---|---|---|---|---|---|
| South Central continuous (37) | 168.16 | 205.16 | 290.76 | 37.1 | 34.7 | 33.0 | 31.9 | 49.2 |
| South Central rotation (62) | 196.90 | 233.90 | 296.17 | 42.3 | 39.6 | 37.6 | 36.3 | 50.1 |
| North Central rotation (62) | 208.27 | 278.27 | 336.04 | 50.4 | 47.1 | 44.8 | 43.2 | 56.8 |
| Southwest wheat-fallow (54) | 178.33 | 250.33 | 324.62 | 45.3 | 42.3 | 40.3 | 38.9 | 54.9 |
| Northwest wheat-fallow (60) | 195.12 | 246.12 | 320.41 | 44.5 | 41.6 | 39.6 | 38.2 | 54.2 |
Source: Crop Root Zone calculation from K-State Department of Agricultural Economics, 2026 Farm Management Guide wheat cost-return budgets, Nov 1, 2025 [9]; DTN/Progressive Farmer retail survey Oct 12–16, 2026 [12]; USDA RMA PM-26-056 [1]; RMA Summary of Business 2026 Kansas wheat RP farmer-paid shares [8]. *Estimates. Costs exclude premium, which is netted from the guarantee. Fertilizer is repriced product by product at K-State's rates: anhydrous and MAP on the continuous and fallow budgets, urea and MAP on the rotation budgets. All other lines, including operating interest, are at K-State's figures. Wheat-fallow rent is K-State's charge per wheat acre.
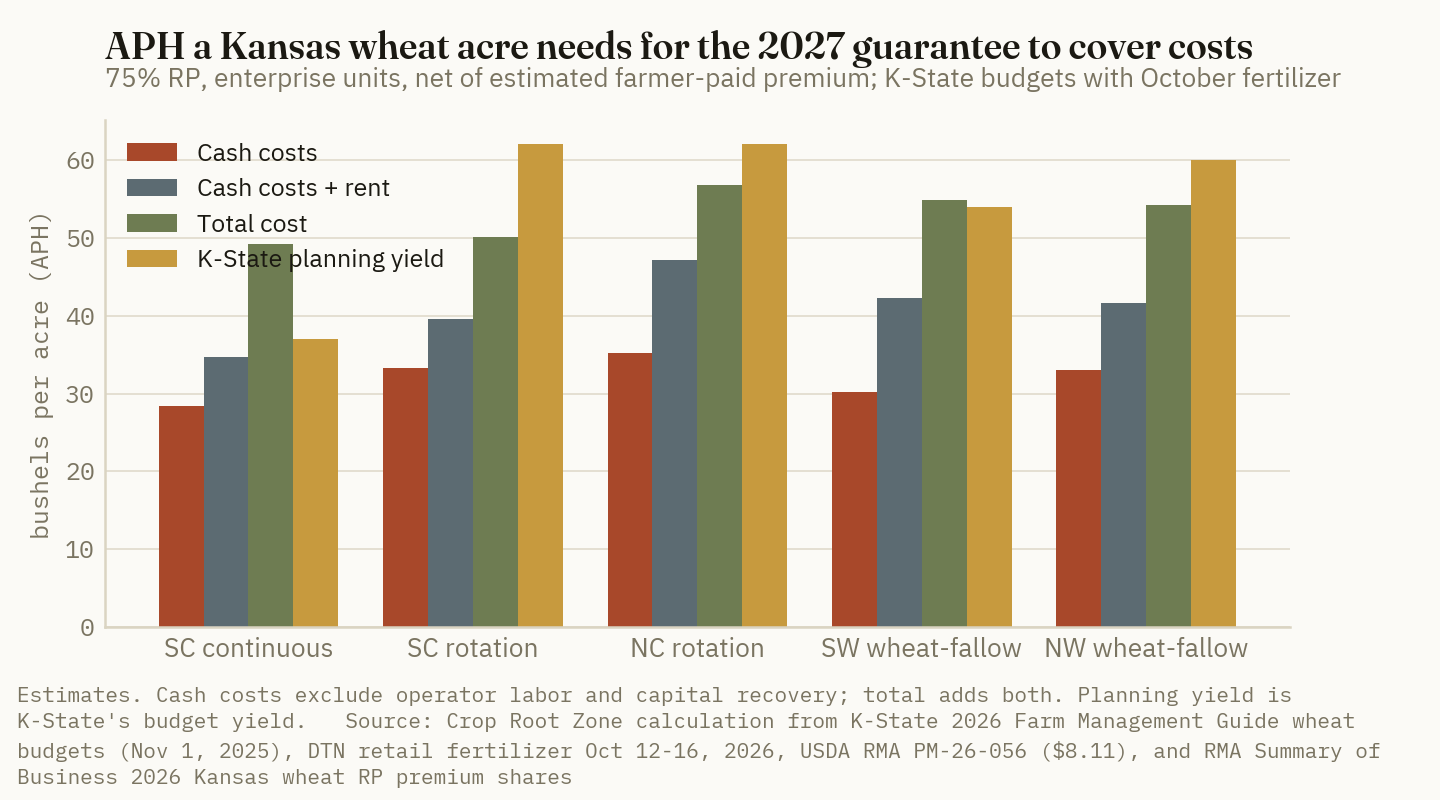
Three results stand out.
First, cash costs are covered almost everywhere. At 75% coverage, an APH of 28 to 35 bushels covers seed, fertilizer, chemicals, fuel, repairs, custom work and interest on all five budgets. Kansas has not averaged below 34 bushels in the three years shown [7]. An insured Kansas wheat acre with a normal yield history therefore has its operating costs covered in 2027, whatever the weather or the market does.
Second, rent is where coverage stops being certain. Adding cash rent raises the required APH to 35 to 47 bushels at 75%. South Central continuous wheat is the low end, at 34.7, because K-State's rent there is $37. North Central rotation is the high end, at 47.1, because rent there is $70. A North Central tenant with a 45-bushel APH is short of covering rent at 70% and 75% and only clears it at 80% or 85%. The guarantee does not cover rent automatically, and a tenant cannot assume it does.
Third, full cost is not covered at any coverage level for a typical Kansas APH. Paying for operator labor and machinery capital recovery as well takes an APH of 49 to 57 bushels at 75%. Kansas reached that range in only one of the last three years [7]. The insurance protects the year's cash flow. It does not pay for the machinery line.
5. What reduces the floor: basis, the APH itself, and spring nitrogen
What's new: The figures in Section 4 are revenue guarantees measured at futures prices. Three things decide whether a grower actually collects that amount.
Evidence:
Basis. The policy values bushels at the futures-based harvest price, but growers sell at cash. Consider the case where the crop finishes exactly at the guarantee, so the policy pays nothing. The grower still sells every bushel at basis under futures. At the October 22 board and a 70-cent basis, near the middle of the 60-to-80-cent range Kansas elevators bid that day [5], cash revenue at that point is about 10% below the guarantee. Taking that into account, a tenant at 75% needs an APH of about 39 bushels (South Central continuous) to 52 bushels (North Central rotation) to cover cash costs plus rent, rather than 35 to 47. These are our estimates. On a total loss the basis does not matter, because no bushels are sold and the indemnity is paid in full.
The APH. The 2026 crop goes into every Kansas grower's yield history at about 34 bushels on average, and lower on many farms [7]. The policy's Yield Adjustment lets the insured replace any actual yield below 60% of the county T-yield with 60% of the T-yield. The grower has to request it, and it does not happen automatically (farmdoc daily, Feb 9, 2016) [13]. FCSAmerica lists November 14, 2026 as the winter wheat production-history deadline [3]. On an 8-year record, every 10 bushels the substitution adds to one year raises the APH by 1.25 bushels. At 75% coverage and $8.11, that is about $7.60 an acre of guarantee, given up for each year where the substitution was available but not requested.
Spring nitrogen. This effect matters most for fertilizer decisions. Suppose a field is clearly heading for a yield below its trigger, which is 75% of APH at 75% coverage. Each extra bushel it produces adds one harvest price's worth to revenue to count and takes the same amount off the indemnity. The grower gains nothing from the bushel and pays the basis when selling it. Topdressing that field with extra urea at $0.73 a pound of N [12] loses money until yield is expected to rise above the trigger. On a field with a good stand, the same pound is worth its full agronomic value. The policy requires good farming practices, so this argument does not support leaving out a field's normal nitrogen program. It does argue against an extra rescue application in a dry March on a field the policy already covers.
Ground Truth: The 2027 guarantee changes what the wheat acre's risk is. With $8.11 fixed and the board at $6.85, an insured acre with a normal APH carries little cash-flow risk. Operating costs are covered at almost any APH Kansas growers carry, and for most tenants rent is covered too. The decisions still open are about bushels and nitrogen. Forward-sell up to the guaranteed bushels, coverage × APH, because the $8.11 floor backs those bushels whatever the market does, and sell nothing beyond them until the crop is made. Request the Yield Adjustment on the 2026 crop before November 14 wherever 2026 fell below 60% of T-yield. Decide spring topdress on the stand in March, measured against the field's trigger yield, not against the original yield goal. Nitrogen bought for a field that will finish below its trigger is effectively paid for by the policy, so it earns the grower nothing.
What to watch. The Kansas winter wheat production-history deadline is November 14 [3]. K-State's 2027 budgets, when posted, may replace the November 2025 cost lines used here [9]. The June 2027 harvest price discovery will set the price at which revenue to count is valued. Every 10-cent move in the July contract between now and then changes how far each coverage level sits from its price trigger, but it does not change the guarantee unless the contract finishes above $8.11.
References
- USDA Risk Management Agency, PM-26-056, "2026 Crop Year (CY) Common Crop Insurance Policy Harvest Prices and 2027 CY Common Crop Insurance Policy and Area Risk Protection Insurance Projected Prices and Volatility Factors," attachment: Projected Prices for the August 15, 2026 – September 14, 2026 Discovery Period, Sep 17, 2026 — https://www.rma.usda.gov/sites/default/files/2026-09/PM-26-056-attachment.pdf
- USDA Risk Management Agency, PM-25-059, "2025 CY Common Crop Insurance Policy Harvest Prices and 2026 CY ... Projected Prices and Volatility Factors," Sep 16, 2025, attachment: August 15 – September 14, 2025 Discovery Period — https://www.rma.usda.gov/sites/default/files/2026-05/August-15-September-14-Discovery-Attachment-2025.pdf
- FCSAmerica, Crop Insurance Price Guarantees (fall price discovery, Kansas winter wheat 2024–2026, citing USDA RMA; winter wheat production history due Nov 14, 2026), accessed Oct 23, 2026 — https://www.fcsamerica.com/insurance/resources/crop-insurance-prices
- USDA Risk Management Agency, Harvest Prices for the June 1, 2025 – June 30, 2025 Discovery Period (Kansas, Oklahoma and Texas winter wheat $5.37) — https://www.rma.usda.gov/sites/default/files/2025-07/2025%20June%20Discovery%20Period.pdf
- USDA AMS Livestock, Poultry and Grain Market News, Kansas Daily Grain Bids, Oct 22, 2026 (KCBT July 2027 wheat settlement 685.25¢; December 2026 665.75¢; HRW country and terminal elevator bids and year-ago prices) — https://www.ams.usda.gov/mnreports/ams_2886.pdf
- USDA Risk Management Agency, PM-26-037, "2026 Crop Year (CY) Common Crop Insurance Policy and Area Risk Protection Insurance Harvest Prices Announcement," Jul 1, 2026, attachment: June 1 – June 30, 2026 Discovery Period (Kansas, Oklahoma and Texas winter wheat $6.28) — https://www.rma.usda.gov/sites/default/files/2026-07/2026-June-Discovery-Period-Attachment_5.pdf
- USDA National Agricultural Statistics Service, Small Grains 2026 Summary, Sep 30, 2026 (Kansas winter wheat yield 43.0, 51.0 and 34.0 bu/ac for 2024–2026; 2026 production 200.6 million bu; Oklahoma 28.0 bu/ac) — https://esmis.nal.usda.gov/sites/default/release-files/796086/smgr0926.pdf
- USDA Risk Management Agency, Summary of Business, state/county/crop/type/practice/unit file, 2026 crop year (SOBSCCTPU26), file dated Oct 17, 2026; Kansas wheat, Revenue Protection, aggregated by coverage level and unit structure by Crop Root Zone — https://pubfs-rma.fpac.usda.gov/pub/Web_Data_Files/Summary_of_Business/state_county_crop/sobtpu_2026.zip
- K-State Department of Agricultural Economics (G. Ibendahl, D. O'Brien, S. Lancaster and co-authors), 2026 Farm Management Guides for Non-Irrigated Crops: Wheat (Continuous) and Wheat (Rotation) budgets for South Central KS, Wheat (Rotation) for North Central KS, Wheat (W-F) for Southwest and Northwest KS, all dated Nov 1, 2025; AgManager farm-budgets index checked Oct 23, 2026 — https://www.agmanager.info/farm-budgets/2026-farm-management-guides-non-irrigated-crops
- Crop Root Zone, TRZ-0210, "A Kansas Winter Wheat Acre Repriced to September Retail Costs $311 and Breaks Even at 41.7 Bushels...," Sep 18, 2026 (citing July 2027 KC settlement of $8.0575 on Sep 15, K-State, Sep 16, 2026).
- Crop Root Zone, TRZ-0235, "Kansas' 2027 Wheat Acre Pays in Rotation and Fallow, Not in Continuous Wheat...," Sep 28, 2026 (citing July 2027 KC settlement of $7.745 on Sep 25, USDA AMS).
- R. Quinn, "UAN32, UAN28, Anhydrous Lead Prices," DTN/Progressive Farmer, Oct 21, 2026 (retail survey Oct 12–16, 2026) — https://www.dtnpf.com/agriculture/web/ag/crops/article/2026/10/21/uan32-uan28-anhydrous-lead-prices
- G. Schnitkey, "Use of YA, YE, and TA in Determining Yield for Crop Insurance," farmdoc daily (6):25, University of Illinois, Feb 9, 2016 (corrected Feb 11, 2016: YA substitution factor is 60% of T-yield) — https://farmdocdaily.illinois.edu/?p=5163
Disclosures
Crop Root Zone is an independent publication. Nothing here is investment advice. Market calls, where included, reflect the editors' own read and are not a recommendation to buy or sell any security.
Corn Was 9.5 Cents of Every Dollar It Cost to Finish an Iowa Steer Sold in September. The Calf Was 68. A 50-Cent Corn Move Shifts a Feedlot Breakeven About $2.30/cwt; Feeder Cattle Have Moved the Equivalent of $4.49 Corn Since June.
Iowa State's September closeout puts corn at $320.57 of a $3,357 steer and the 550-lb calf at $2,274. On a pen of 800-lb steers placed this week at the $342.98 CME Feeder Index, we estimate a $243/cwt breakeven against a $228.71 projected April sale, a loss of about $215 a head. Corn would have to fall about $3.11 a bushel to close that gap. K-State projects losses on every steer closeout month from September through June except May, after August closeouts lost $489 a head. The feeder-to-fed ratio is 1.48 against a 1.24 average. USDA raised 2026/27 feed and residual to 6.0 billion bushels, but August placements were the lowest since 1996, and the corn at risk is days on feed, not head count.
Iowa State University's estimated returns for steer calves bought in November 2025 and sold in September 2026 put the corn bill at $320.57 a head. Total cost was $3,357.40 per 1,500-lb finished steer, so corn was 9.5% of it. The 550-lb calf cost $2,273.86, or 67.7% (Iowa State University, Estimated Returns to Finishing Steer Calves, Oct 2026) [2]. Those steers lost $28.30 a head after the manure credit. Steers bought as 850-lb yearlings in March and sold in the same month lost $489.96. Their corn bill was $263.00, or 6.9% of cost, and the feeder animal was 79.8% [3]. December corn settled at $4.63¼ on October 21 (Brownfield Ag News, Oct 21, 2026) [7]. At that price corn is not what decides whether a pen of cattle makes money. This piece prices a pen placed this week, works out what a 50-cent corn move does to it, and asks what a loss-making feedlot sector means for the 6.0 billion bushels of feed and residual use in USDA's corn balance sheet.
TRZ-0043 (Jul 28, 2026) [12] covered the summer corn rally and its pass-through to cow-calf producers. It is not repeated here. Since then fed cattle have fallen about $31/cwt from their second-quarter average, feeder cattle have come off their June record, and closeouts have turned sharply negative.
1. A pen placed this week: a $243 breakeven against a $229 sale
What's new: Live cattle and feeder futures rallied this week. December live cattle settled at $231.12 on October 21, up 95 cents, and November feeders at $348.82, up $2.52 [7]. The CME Feeder Index was reported at $342.98/cwt on October 22. Its record was $381.86 on June 26 (HerdAdvisor market briefing, Oct 22, 2026) [8]. In the week to October 18, negotiated live steers in the five-area market averaged $224.19 at 1,603 lb, and dressed steers $352.52 (USDA AMS, LM_CT150, Oct 19, 2026) [6].
Evidence: The budget below prices 100 head of 800-lb steers placed this week and fed to 1,500 lb for an April 2027 sale. Feeding cost of gain is K-State's projection for April steer closeouts. The sale price is K-State's April projection: April live cattle futures at $226.83 on October 16 plus a $1.88 basis (Kansas State University, Oct 20, 2026) [1]. Interest, death loss and days on feed are our assumptions.
| Pen of 800-lb steers, placed late Oct 2026 | $/head | Pen of 100 | Basis |
|---|---|---|---|
| Feeder steer, 8.0 cwt | 2,743.84* | 274,384* | CME Feeder Index, $342.98/cwt |
| Feeding cost of gain, 7.0 cwt | 745.85* | 74,585* | K-State projected FCOG, $106.55/cwt |
| … of which corn-equivalent feed | ~326* | ~32,600* | 69.3 bu at $4.70 (see note) |
| Interest, 7.5% for 180 days | 115.28* | 11,528* | On feeder plus half of feed |
| Death loss, 1.5% | 41.16* | 4,116* | Of feeder value |
| Total cost | 3,646.13* | 364,613* | |
| Breakeven, 1,500 lb | $243.08/cwt* | ||
| Projected April sale | $228.71/cwt | K-State, futures $226.83 + basis $1.88 | |
| Projected return | −215* | −21,548* |
Source: Kansas State University, Historical and Projected Kansas Feedlot Net Returns, Oct 20, 2026 [1]; HerdAdvisor market briefing, Oct 22, 2026 [8]; farmdoc daily, Jul 10, 2026 [5]. *Crop Root Zone estimates. Corn-equivalent feed applies farmdoc daily's coefficient (each $0.10/bu on corn adds $0.99/cwt to feeding cost of gain, which implies about 9.9 bu of corn-priced feed per cwt of gain) to USDA's $4.70 2026/27 season-average price [9]. Interest rate, 1.5% death loss and 180 days on feed are assumptions, not reported figures.
K-State's own projection for April steer closeouts is less severe: a loss of $60.19 a head on a $232.56 breakeven [1]. Most of the difference is the feeder price. K-State's April closeout uses a $329.14 feeder, and the index is now $342.98. On 8 cwt that is $111 a head, before interest. This week's feeder rally made the pen more expensive to fill, while the April futures price it will sell against moved less.
9.5¢
Share of each dollar of cost that went to corn for an Iowa steer calf sold in September 2026. The calf took 67.7¢. (Iowa State University, Estimated Returns to Finishing Steer Calves, Oct 2026)
2. Where the dollar goes: corn is a third of the gain and a tenth of the steer
What's new: Iowa State's model breaks the finished steer into its cost lines. It is a cash barometer with no hedging. Corn is priced from USDA's North Central Iowa bid, and modified distillers grains from USDA's Iowa ethanol-plant prices (Iowa State University, procedure, Jan 2024) [4].
Evidence: The table ranks each line for the September sale. The second column measures it against the cost of putting on gain, which is everything except the calf.
| Iowa steer calf, 550 → 1,500 lb, sold Sep 2026 | $/head | % of total cost | % of cost of gain | |
|---|---|---|---|---|
| Feeder calf, $413.43/cwt | 2,273.86 | 67.7 | — | ██████████ |
| Corn | 320.57 | 9.5 | 29.6 | █░░░░░░░░░ |
| Variable costs | 179.23 | 5.3 | 16.5 | █░░░░░░░░░ |
| Operating interest | 172.34 | 5.1 | 15.9 | █░░░░░░░░░ |
| Fixed costs | 99.56 | 3.0 | 9.2 | ░░░░░░░░░░ |
| Hay | 97.23 | 2.9 | 9.0 | ░░░░░░░░░░ |
| Modified distillers grains | 88.88 | 2.6 | 8.2 | ░░░░░░░░░░ |
| Death loss | 78.74 | 2.3 | 7.3 | ░░░░░░░░░░ |
| Supplement and mineral | 46.98 | 1.4 | 4.3 | ░░░░░░░░░░ |
| Total | 3,357.40 | 100.0 |
Source: Iowa State University Extension and Outreach, Estimated Returns to Finishing Steer Calves, Iowa, Oct 2026 update (purchase Nov 2025, sale Sep 2026) [2]. Percentages are Crop Root Zone calculations; bars are scaled to the calf at 67.7% of total cost. Cost of gain is total cost less the calf, $1,083.54.
Corn is the largest cost after the calf, but not by much. Operating interest, at $172.34, is 54% of the corn bill. That is what $2,274 calves held for 310 days cost to finance. Counting distillers grains, which are priced off corn, the corn-linked share rises to 37.8% of the cost of gain and 12.2% of the total. For the yearling, the corn bill is 34.3% of the cost of gain and 6.9% of the total, because a heavier feeder eats less corn per pound of finished steer [3].
The distillers line is worth noting. TRZ-0295 found Iowa distillers grains priced at 120% of corn per ton in mid-October (TRZ-0295, Oct 20, 2026) [13]. That is the opposite of the usual relationship, so the protein and energy a feedlot buys as distillers grains now costs more per ton than the corn it replaces. Corn's share of the ration cost will tend to rise as feeders substitute back toward corn.
On the K-State basis used in Section 1, corn-equivalent feed of about $326 a head is roughly 44% of a $745.85 feeding cost of gain, and 8.9% of total cost. That share is our estimate. The ranges are consistent: corn is 30% to 45% of the cost of gain and under a tenth of the cost of a finished steer.
3. What 50 cents of corn does, next to what cattle prices did
What's new: farmdoc daily's July sensitivity work gives each $0.10/bu on corn a $0.99/cwt effect on feeding cost of gain, and finds corn explains about two-thirds of its variation. Each 0.10 worsening in feed conversion adds $2.08/cwt (Langemeier, farmdoc daily, Jul 10, 2026) [5]. Cost of gain is driven mostly by corn. A finished steer's total cost is driven mostly by the calf.
Evidence: Applied to the pen in Section 1, a 50-cent move in corn changes cost by $34.65 a head and breakeven by $2.31/cwt. The last column converts each swing into the corn price move that would do the same damage per head.
| Per-head swing on the Section 1 pen | $/head | Breakeven, $/cwt | Equal to corn move, $/bu | |
|---|---|---|---|---|
| Feed conversion worse by 0.10 | 14.56* | 0.97* | 0.21* | ░░░░░░░░░░ |
| Corn ±$0.50/bu | 34.65* | 2.31* | 0.50 | █░░░░░░░░░ |
| Fed price ±$5/cwt (revenue) | 75.00* | 5.00 | 1.08* | ██░░░░░░░░ |
| Feeder ±$10/cwt, with interest and death loss | 84.16* | 5.61* | 1.21* | ██░░░░░░░░ |
| Feeder Index, Jun 26 record to now (−$38.88) | 311.04* | 20.74* | 4.49* | ███████░░░ |
| Fed steer, Q2 average to Oct 18 week (−$31.57) | 473.55* | 31.57 | 6.83* | ██████████ |
Source: farmdoc daily, Jul 10, 2026 (sensitivities) [5]; HerdAdvisor market briefing, Oct 22, 2026 (CME Feeder Index) [8]; USDA AMS LM_CT150, Oct 19, 2026 (five-area live steer, $224.19) [6]; WASDE-676, Oct 9, 2026 (Q2 2026 five-area steer average, $255.76) [9]. *Crop Root Zone calculations on an 800-lb feeder, 700 lb of gain and a 1,500-lb sale weight. Bars scaled to $6.83/bu.
The corn market moves 50 cents in a few weeks in a volatile year. Since June, the feeder market has moved the equivalent of $4.49 corn on each placement, and the fed market the equivalent of $6.83 on each finished steer. The two cattle moves partly offset each other for a feedlot that bought and sold in the same window. They do not offset for cattle bought in spring and sold this fall, which is why the August and September closeouts are so poor.
K-State's tables show the same thing from the other direction. For October steer closeouts it projects a $98.24/cwt feeding cost of gain against a breakeven cost of gain of $53.96 [1]. At $0.99 per dime, closing a $44.28 gap would take corn about $4.47 lower, at or below zero. Corn cannot rescue October closeouts. For April closeouts the gap is $8.30/cwt, equal to about 84 cents of corn [1]. Lower corn helps spring closeouts, but only at the margin.
Ground Truth: For a farmer-feeder deciding whether to sell corn or feed it, the useful number is the corn price at which a pen placed today breaks even. On our Section 1 budget the pen loses about $215 a head. That is the same as feeding corn worth about $3.11 a bushel less than the market price. At USDA's $4.70 season average, feeding values the corn at about $1.60 a bushel. Selling the corn and buying back the cattle risk separately, or placing fewer and lighter calves, beats putting the crop through the bunk at today's feeder price. The exception is a feeder who already owns the calves and has priced the fed side. For that operation the $2.31 per 50 cents is the only exposure left, and it is worth hedging.
4. The closeouts: losses at every horizon
What's new: K-State's October update, dated October 20 and using markets as of October 16, puts August survey closeouts at −$488.85 a head for steers and −$342.54 for heifers. September steer closeouts are projected at −$394.71 [1]. Kansas negotiated fed-cattle trades were not reported in September under USDA's confidentiality rules. K-State estimated Kansas prices from the prior-year relationship with Nebraska [1].
Evidence: K-State projects a loss on steers in every closeout month from September through June 2027 except May, when it projects a $21.26 gain. Heifers are negative in all ten months.
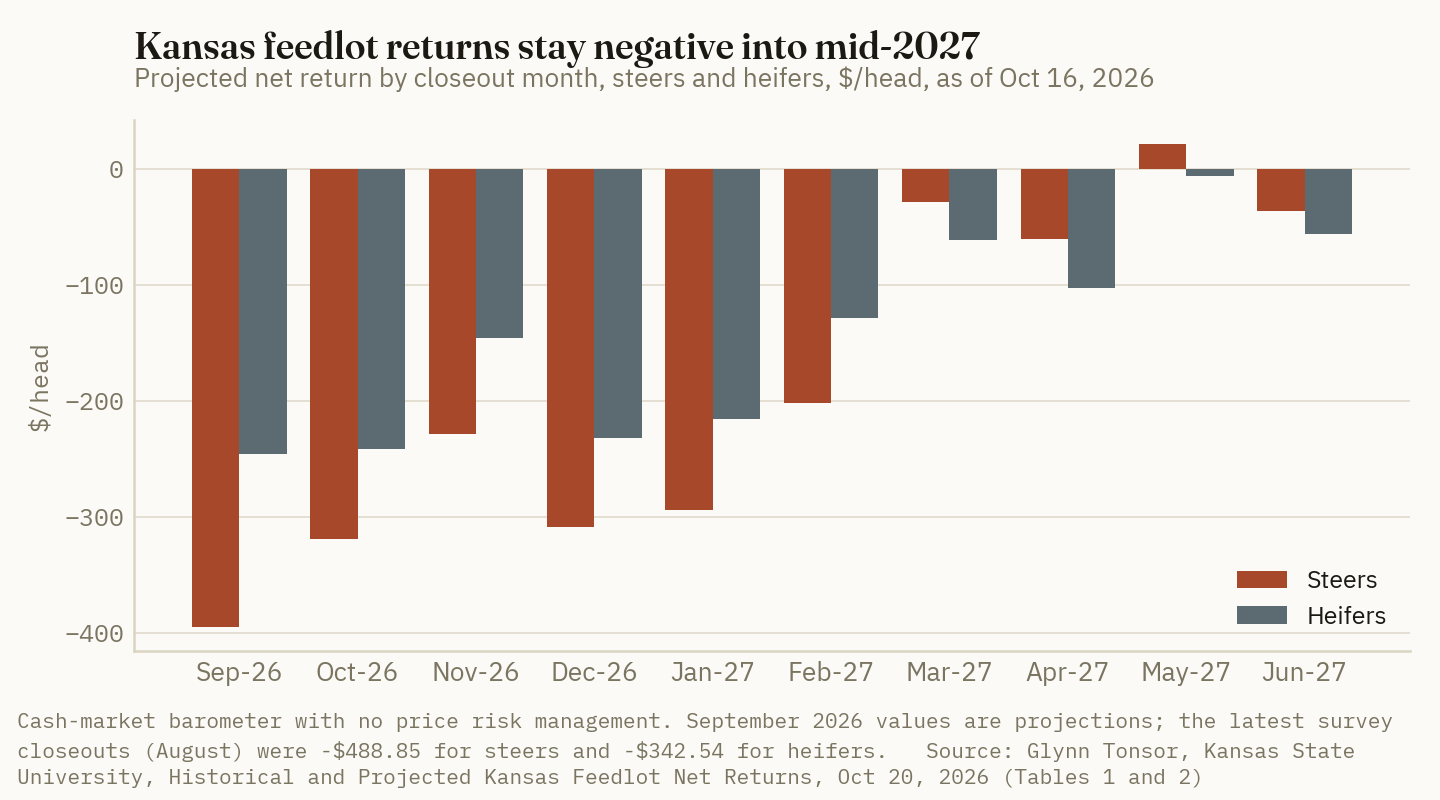
The breakeven columns show where the losses come from. For September steer closeouts, the feeder cost $367.40/cwt against a breakeven feeder price of $320.64. That is $46.76 too much for the calf. Feeding cost of gain was $94.86 against a breakeven of $40.62 [1]. The fed price, at $223.34, is $25.12 below the $248.46 breakeven. These cattle were bought in spring, when fed cattle were near $256 and feeders were heading for a record [9]. Iowa State's yearling series shows the same thing: a $357.62 feeder bought in March, sold at $219.96 in September, for a loss of $489.96 [3].
The feeder-to-fed price ratio puts the current position in context. farmdoc daily puts its average since January 2016 at 1.242. Months when the ratio ran more than one standard deviation above average averaged a $201 loss a head [5]. Today the CME Feeder Index against December live cattle is 1.48, and against this week's five-area cash it is 1.53 [6][7][8]. Feedlots are buying calves at a ratio that has historically meant losses, and this week's feeder rally raised it further. At OKC West on October 21, feeder steers sold $10 to $20 higher on the week, with 700- to 800-lb steers at $325 to $378 (USDA AMS, OKC West, Oct 21, 2026) [11].
Ground Truth: The losses come from expensive calves and a lower fed-cattle price, and corn cannot offset either. Feedlot losses this deep normally end when feedlots bid less for calves. That has not started: the feeder index rose this week. Until the ratio comes back toward 1.3, feedlots will lose money on each placement whatever the corn price, and the ones still placing are betting on a fed-cattle recovery to about the $238 USDA projects for 2027 [9]. The market sign to watch is not corn. It is whether the CME Feeder Index can hold above $340 while April fed cattle trade below $230.
5. What a loss-making feedlot means for corn demand
What's new: USDA raised 2026/27 corn feed and residual use by 50 million bushels to 6.0 billion in October. It is 119 million below the 2025/26 estimate of 6,119 million and 563 million above 2024/25. In the same report it lowered 2026 beef production to 24.802 billion pounds from 24.877 billion, citing lower expected steer and heifer slaughter and lighter carcass weights in the second half. It lowered 2027 production to 24.675 billion (WASDE-676, Oct 9, 2026) [9].
Evidence:
| U.S. corn, million bu | 2024/25 | 2025/26 est. | 2026/27 Sep | 2026/27 Oct |
|---|---|---|---|---|
| Production | 14,892 | 16,964 | 15,800 | 16,034 |
| Feed and residual | 5,437 | 6,119 | 5,950 | 6,000 |
| Ethanol and by-products | 5,437 | 5,547 | 5,600 | 5,650 |
| Exports | 2,873 | 3,429 | 3,275 | 3,300 |
| Ending stocks | 1,551 | 2,095 | 1,567 | 1,849 |
| Season-average price, $/bu | 4.24 | 4.16 | 4.80 | 4.70 |
Source: USDA World Agricultural Outlook Board, WASDE-676, Oct 9, 2026 [9].
The cattle side has two signals pointing different ways. On September 1, 11.163 million head were on feed in 1,000-plus-head lots, up 1% from a year ago. August placements were 1.617 million, down 9%, and the lowest August in a series that began in 1996. July placements were 1.422 million, down 11%. August marketings were 1.519 million, down 3% and also a series low for the month (USDA NASS, Cattle on Feed, Sep 18, 2026) [10]. The inventory is being held up by cattle staying on feed longer, not by more cattle coming in. The next Cattle on Feed report will cover September placements.
The corn that feedlots use is therefore set by days and pounds, not head count. We estimate the 11.2 million head on feed eat about 0.35 bushel of corn-equivalent feed per head per day. That assumes 3.5 lb of daily gain at the 9.9 bu per cwt implied by farmdoc's coefficient. It works out to about 1.2 to 1.5 billion bushels a year, roughly a fifth to a quarter of feed and residual. Part of it is distillers grains, which USDA counts under ethanol use rather than feed. These are Crop Root Zone estimates, not USDA figures. On that basis, each day cut from the average feeding period of the cattle now on feed removes about 3.9 million bushels of corn-equivalent demand. Ten days removes about 39 million bushels, close to the 50 million USDA added in October.
Ground Truth: The 50 million bushels USDA added to feed and residual in October is the number most exposed to feedlot losses, and it is exposed through weights, not placements. A feedlot losing $300 a head on fall closeouts has every reason to sell cattle on time or early rather than add weight that costs more than it brings. USDA has already lowered expected carcass weights. Placements are already at series lows, so they have little room to fall further. The corn demand that can still give way is the last few weeks of each feeding period. With a 16.0 billion bushel crop, much of the rise in feed and residual is the residual that rises with crop size, not cattle eating more. We would expect the January balance sheet to give back part of the October increase if five-area steer weights fall below the 1,603 lb reported this week. For a corn seller this means the feedlot share of corn demand is unlikely to grow before spring, and that cheaper corn will not change it.
References
- Tonsor, G., Historical and Projected Kansas Feedlot Net Returns, Kansas State University Department of Agricultural Economics, KSU-AgEcon-GTT-KFR-2026.10, Oct 20, 2026 (markets as of Oct 16, 2026; Focus on Feedlots closeouts for August 2026; Tables 1 and 2) — https://agmanager.info/sites/default/files/pdf/KSU%20Feedlot%20Returns%20%28Oct%202026%29.pdf
- Iowa State University Extension and Outreach, Estimated Returns to Finishing Steer Calves, Iowa, October 2026 update (file dated Oct 9, 2026; purchase Nov 2025, sale Sep 2026) — https://estimatedreturns.econ.iastate.edu/files/inline-files/finishing_steer_calves_pdf.pdf
- Iowa State University Extension and Outreach, Estimated Returns to Finishing Yearling Steers, Iowa, October 2026 update (purchase Mar 2026, sale Sep 2026) — https://estimatedreturns.econ.iastate.edu/files/inline-files/finishing_yearling_steers_pdf.pdf
- Schulz, L. L., Procedure for Estimating Returns: Finishing Steer Calves, Iowa State University, Jan 2024 — https://estimatedreturns.econ.iastate.edu/files/inline-files/finishing_steer_calves_procedure.pdf
- Langemeier, M., "Trends in Cattle Finishing Breakeven Prices and Net Returns," farmdoc daily (16):121, University of Illinois, Jul 10, 2026 (cost-of-gain sensitivities; feeder-to-fed ratio average 1.242 since Jan 2016) — https://farmdocdaily.illinois.edu/2026/07/trends-in-cattle-finishing-breakeven-prices-and-net-returns.html
- USDA AMS Livestock, Poultry and Grain Market News, 5 Area Weekly Weighted Average Direct Slaughter Cattle (LM_CT150), Oct 19, 2026 (week ending Oct 18, 2026) — https://www.ams.usda.gov/mnreports/ams_2477.pdf
- Brownfield Ag News, "Closing Grain and Livestock Futures: October 21, 2026" (December corn $4.63¼; December live cattle $231.12; November feeder cattle $348.82) — https://brownfieldagnews.com/news/closing-grain-and-livestock-futures-october-21-2026/
- HerdAdvisor, Market Briefing, Oct 22, 2026 (CME Feeder Cattle Index 342.98; record 381.86 on Jun 26, 2026) — https://www.herdadvisor.com/market-briefing
- USDA World Agricultural Outlook Board, World Agricultural Supply and Demand Estimates, WASDE-676, Oct 9, 2026 (U.S. corn supply and use; quarterly animal product production and prices) — https://www.usda.gov/oce/commodity/wasde/wasde1026.pdf
- USDA NASS, Cattle on Feed, released Sep 18, 2026 (inventory as of Sep 1, 2026) — https://esmis.nal.usda.gov/sites/default/release-files/796064/cofd0926.pdf
- USDA AMS / Oklahoma Department of Agriculture Market News, OKC West Livestock Auction, El Reno, OK, Oct 21, 2026 — https://www.ams.usda.gov/mnreports/ams_1281.pdf
- Crop Root Zone, TRZ-0043, "Corn's Biggest Customer Can't Say No: What a $0.54 Rally Does to a Feedlot That's Already Underwater," Jul 28, 2026.
- Crop Root Zone, TRZ-0295, "An Iowa Ethanol Plant Earns About $3.60 a Bushel Over Its Corn…," Oct 20, 2026.
Disclosures
Crop Root Zone is an independent publication. Nothing here is investment advice. Market calls, where included, reflect the editors' own read and are not a recommendation to buy or sell any security.
Red River Beet Growers Were Paid $43.85 a Ton for 2025. At North Dakota's 28-Ton 2026 Yield, Covering 2024-Level Costs Takes About $56. Fifty Pounds of Excess Nitrogen Costs About $95 an Acre.
American Crystal's forecast payment for the record 2025 crop is $43.85 a ton, down from $78. USDA now puts North Dakota's 2026 beet yield at 28.0 tons, 5.2 tons below last year, so covering FINBIN's 2024 cost of $1,563 an acre takes about $56 a ton. Midwest beet sugar for 2026-27 delivery was quoted at 44 to 48 cents a pound in July, 6 to 12 cents above the 2025 spot price. We estimate each cent is worth about $2.95 a ton to a grower, so the 2026 crop can close the gap. Nitrogen is the input to watch. NDSU's data show recoverable sugar falling as available N rises past 100 lb/acre. At the 2025 payment, 50 lb of excess N costs about $95 an acre in lost sugar and fertilizer, against $24 to $58 an acre for a full soil-tested fall rate.
American Crystal Sugar Company's growers delivered a record 13.3 million tons of sugarbeets in 2025 at 18.0% sugar, and the cooperative forecast a net payment of $43.85 a ton for that crop, down from $78.00 for the 2024 crop (American Crystal Sugar Company, Dec 8, 2025) [1]. For 2026, the Red River Valley's largest processor planted fewer acres. Its 2026 plan was 399,000 acres, against 407,000 in 2025 (Agweek, Apr 28, 2026) [2]. The crop then went through a summer drought. USDA's October 1 forecast puts North Dakota's yield at 28.0 tons an acre, 5.2 tons below 2025, and Minnesota's at 29.1, down 0.8 (USDA NASS, Oct 9, 2026) [3]. USDA expects 2026/27 U.S. beet sugar output of 4.742 million short tons, raw value, the lowest since 2019/20 (USDA ERS, Oct 16, 2026) [4]. With less sugar coming, the domestic market has firmed. Midwest beet sugar for 2026-27 delivery was quoted at 44 to 48 cents a pound FOB in July (Sosland Sweetener Report via CZ App, Jul 21, 2026) [5]. The 2026 crop will therefore be sold into a better market than the 2025 crop was, but it is a smaller crop. Nitrogen is the input decision most likely to show up in the grower's payment. In beets, nitrogen beyond the target rate costs the grower money in two ways: it lowers sugar content and it raises impurities (NDSU Extension, SF714, reviewed Feb 2023) [6]. Retail anhydrous is $977 a ton, or 60 cents a pound of N, ahead of fall application (DTN, Oct 14, 2026) [7].
This piece covers the payment and the sugar price behind it, the 2026 crop, the cost per ton a grower has to cover, and how to set the nitrogen rate for the 2027 crop this fall. Payment figures are public only for American Crystal. We could not find published 2025-crop payment figures for Minn-Dak Farmers Cooperative or Southern Minnesota Beet Sugar Cooperative, so their payments are not estimated here.
1. The payment fell 44% on a record crop, and next year's sugar is selling higher
What's new: American Crystal's forecast 2025-crop payment of $43.85 a ton is the lowest of the past three crops. The cooperative paid $83.18 for the 2023 crop and $78.00 for 2024 [1][2]. Agweek's April report gives the 2025 figure as $43.80 [2], a 5-cent difference from the cooperative's release. We use the cooperative's $43.85. Management cited "declining world sugar prices and excessive imports" [1], and the company's president said demand was down about 4% from its high two or three years earlier (Red River Farm Network, Dec 7, 2025) [8].
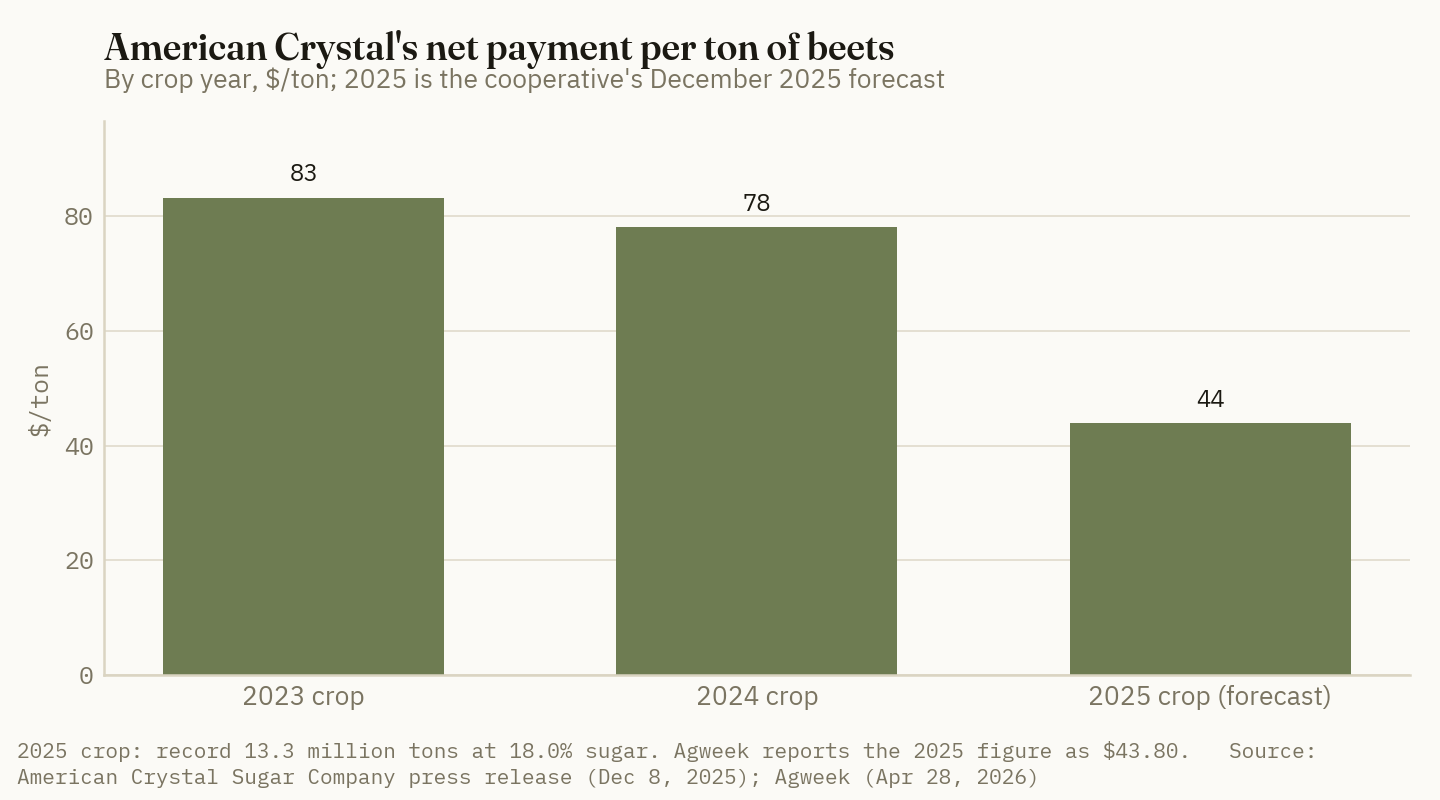
Evidence: Federal allocations show the same pressure on the two southern and eastern Minnesota cooperatives. In the fiscal 2026 reallocation, Southern Minnesota Beet Sugar's beet sugar marketing allocation was cut about 204,400 tons to 541,300 tons. Minn-Dak's was cut about 18,200 tons to 365,500. American Crystal's rose about 30,400 tons to 2.06 million (Red River Farm Network, Oct 1, 2026) [9]. The fiscal 2027 loan rate for refined beet sugar in Minnesota and eastern North Dakota is 32.63 cents a pound [9]. That rate is the floor under the domestic price.
The price table shows why the 2026 crop's sugar is worth more than the 2025 crop's was.
| U.S. sugar price | Period | ¢/lb | Basis |
|---|---|---|---|
| Midwest refined beet, spot | Aug 2025 | 35.75 | Bulk, FOB Midwest [11] |
| Midwest refined beet, spot | Sep 2025 | 38.00 | Bulk, FOB Midwest [10] |
| Midwest refined beet, spot | Jan–Apr 2026 avg. | 41.67 | Bulk, FOB Midwest [10] |
| Midwest bulk beet, 2026-27 delivery | Jun 3, 2026 | 44–47 | Forward, FOB; some trade at 42 [12] |
| Midwest bulk beet, 2026-27 delivery | Jul 21, 2026 | 44–48 | Forward, FOB [5] |
| Gulf/Southeast cane, 2026-27 delivery | Jul 21, 2026 | 50–53 | Forward, FOB [5] |
| ICE No. 16 domestic raw, front month | Jan–Apr 2026 avg. | 32.97 | Futures [10] |
| ICE No. 16 domestic raw, front month | Oct 20, 2026 | 42.00 | Futures, delayed continuous series [13] |
| ICE No. 11 world raw, Mar 2027 | Oct 16, 2026 | 20.85 | Futures settlement [14] |
| Refined beet loan rate, MN and eastern ND | FY2027 | 32.63 | Federal loan floor [9] |
Source: Terrain/American AgCredit, Oct 3, 2025 [11]; Southern Ag Today (LSU AgCenter), Jun 10, 2026 [10]; Sosland Sweetener Report via CZ App, Jun 3 and Jul 21, 2026 [12][5]; Investing.com, ICE US Sugar #16 continuous front-month historical data, accessed Oct 21, 2026 [13]; CZ App daily settlements, Oct 16, 2026 [14]; Red River Farm Network, Oct 1, 2026 [9]. The No. 16 series is thinly traded and published with a delay; read it as direction, not a settlement. Spot and forward beet quotes are not directly comparable.
Fourteen months ago, Midwest beet sugar traded at 35.75 cents spot. Forward sales for 2026-27 have been quoted at 44 to 48 cents. The domestic raw contract has risen about 9 cents from its January–April average. The U.S. price is now roughly 21 cents over the world raw price, and the program keeps that premium in place. USDA's October balance sheet is the reason for the rise. It forecasts 2026/27 U.S. sugar production at 8.768 million short tons, raw value, the lowest since 2019/20, and an ending stocks-to-use ratio of 14.9%, down from 17.8% for 2025/26 [4].
One number limits how far prices can rise. USDA also raised the 2026/27 stocks-to-use forecast by 1.4 points in October because domestic food use has been running slow. It has now cut deliveries for two straight months [4]. Mexico's 2026/27 export limit to the U.S. will be recalculated twice to target a 13.5% stocks-to-use ratio [4]. That mechanism lets in more Mexican sugar when the U.S. market tightens.
Ground Truth: The 2025-crop payment reflects sugar the cooperatives sold into a 36- to 38-cent spot market. The 2026 crop's sugar is being sold into a 44- to 48-cent forward market. As a rough estimate, a ton of beets yields about 295 lb of sugar at USDA's 14.74% extraction rate from slice, so each cent of net selling price is worth about $2.95 a ton to the grower. A 6- to 12-cent improvement is therefore worth roughly $18 to $35 a ton before any change in processing cost per ton. That is not a payment forecast. Cooperatives sell forward across seasons, and a smaller crop spreads factory costs over fewer tons. But the 2025 payment is the low end of the range for the 2026 crop, not its likely level.
2. The 2026 crop: fewer acres, lower tonnage, higher sugar content
What's new: USDA's October forecast puts the national 2026 sugarbeet yield at 30.8 tons an acre, down 0.7 from September and 2.4 below 2025. Production is forecast at 31.1 million tons, 11% below last year, from 1.009 million harvested acres [3]. The October cuts were biggest in Minnesota and North Dakota, each down 1.2 tons from the September 1 forecast [3][4].
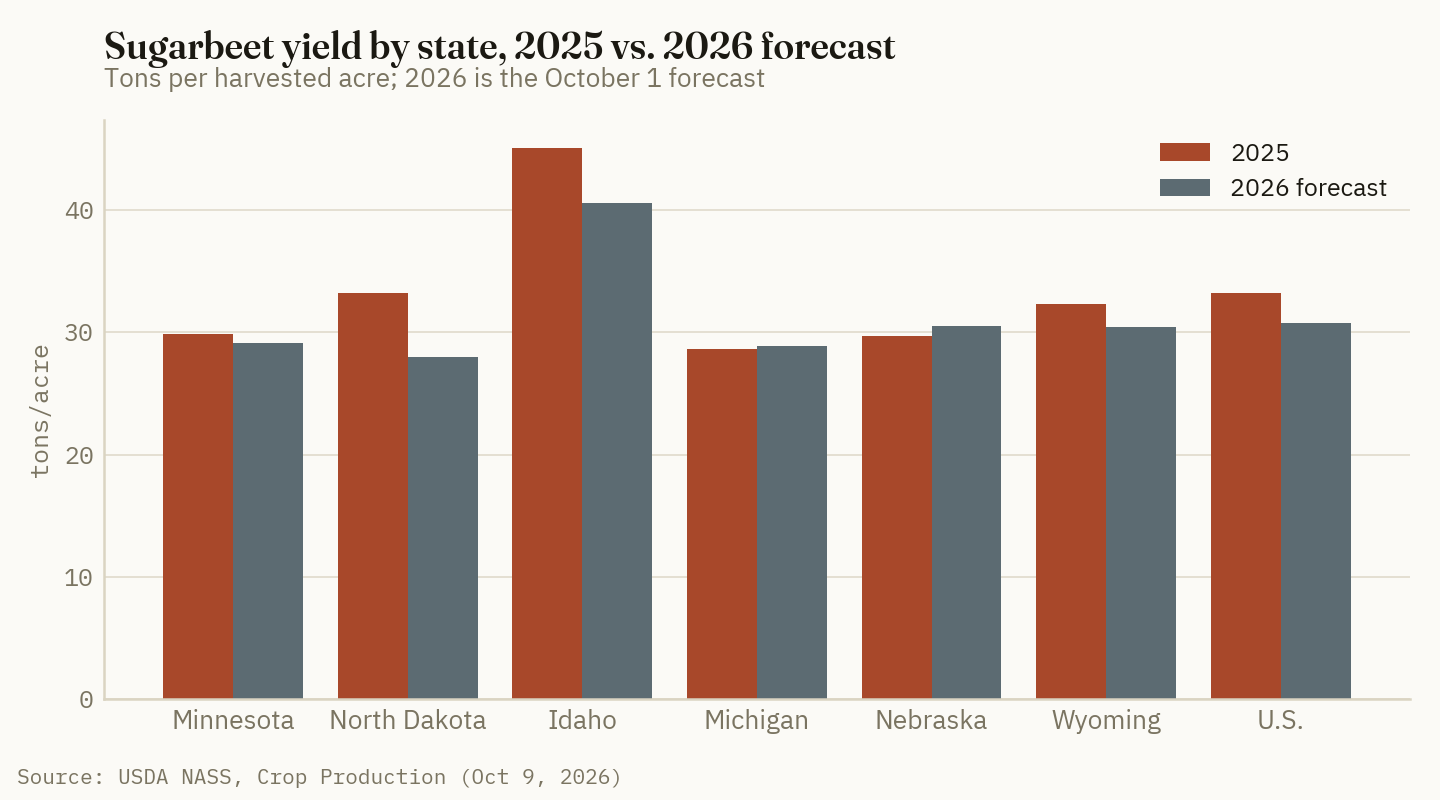
Evidence: Drought explains most of the decline. About 48% of U.S. sugarbeet production was in drought as of USDA's October 6 report, against 34% a year earlier [4]. Near Crookston, Minnesota, no rain fell from June 23 to August 8, and nearly 7 inches fell over the following two months. American Crystal's general agronomist told Agweek the crop is smaller because of the drought, which "really impacted the yield potential." One grower there reported about 24 tons an acre against a goal of 30 (Agweek, Oct 2, 2026) [16]. That is one farm, not a district average. American Crystal's stockpile harvest began at 10 p.m. on October 1 and stopped at noon the next day because temperatures in the low 60s were too warm for safe storage [16]. As of October 11, Minnesota was 35% harvested against a 37% five-year average, and North Dakota was 45% against 37% [4].
Sugar content is better news than tonnage. At the August 14 start of pre-pile, American Crystal reported early yield samples below the year before but sugar content above average for the date (Agweek, Aug 14, 2026) [15]. Southern Minnesota Beet Sugar was digging 25 to 28 tons an acre in late August at about 14% sugar. It projected an average of 33 tons or more by late October on more than 120,000 acres (Agweek, Sep 3, 2026) [17]. That is a co-op projection made early in the season. In its 2026/27 forecast, USDA uses a 10-year-average extraction rate of 14.79% [4], so its numbers do not yet reflect this year's sugar content.
| State | 2025 yield, t/a | 2026 Oct 1 forecast, t/a | Change, t/a | 2026 production, 1,000 t |
|---|---|---|---|---|
| Minnesota | 29.9 | 29.1 | −0.8 | 11,873 |
| North Dakota | 33.2 | 28.0 | −5.2 | 5,656 |
| Idaho | 45.1 | 40.6 | −4.5 | 6,090 |
| Michigan | 28.6 | 28.9 | +0.3 | 3,930 |
| Nebraska | 29.7 | 30.5 | +0.8 | 1,049 |
| Wyoming | 32.3 | 30.4 | −1.9 | 800 |
| United States | 33.2 | 30.8 | −2.4 | 31,136 |
Basis: tons of beets per harvested acre. Source: USDA NASS, Crop Production, Oct 9, 2026 [3].
Ground Truth: The yield loss falls unevenly, and a single Red River Valley payment does not offset it evenly. The cooperative announces one payment per ton, and each grower's own sugar and impurity results adjust it [6]; it does not adjust for what the grower lost in tonnage. A North Dakota grower who lost five tons an acre is paid on the same terms as a neighbor who lost one, and at 2025's payment those five tons were worth about $228 an acre. If the 2026 sugar content holds above average, that helps every grower's per-ton payment but does not replace lost tonnage. Growers in the hardest-hit districts should build their 2027 budgets on a tonnage figure below their own five-year average, not on the 2025 record.
3. What a ton has to pay: about $56 at North Dakota's 2026 yield
What's new: FINBIN data compiled from Minnesota and North Dakota farm records show sugarbeet direct expenses at a record $1,284 an acre in 2024 and overhead at $279, for a total of $1,563. Terrain's analyst estimated 2025 costs were "approaching $1,600" (Terrain/American AgCredit, Oct 3, 2025) [11]. That 2025 figure is a projection, not a FINBIN result. The University of Minnesota put the 2024 cost of production at $56.07 a ton, against an average price received of $73.32 (University of Minnesota, Minnesota Price and Cost Summary, 2025) [18].
Evidence: Estimates of the 2025 loss differ widely. Farm management analyst Kent Thiesse reported industry projections of $150 to $200 an acre for many Minnesota and North Dakota beet growers (Agweek, Dec 11, 2025) [19]. A University of Minnesota Extension article quotes a farm business management instructor putting the average loss near $500 an acre [20]. We could not open that article: the server returned 403 Forbidden, and the 2025 FINBIN report behind it was blocked by a bot check. We have seen the $500 figure only in search summaries, so it is unverified here. The table below uses FINBIN's 2024 total cost and holds it flat.
| Yield basis | Tons/acre | Revenue at $43.85/t | Break-even $/t at $1,563/acre | Gap to $43.85, $/t | Gap, ¢/lb sugar* |
|---|---|---|---|---|---|
| American Crystal 2025 average | 33.7 | $1,477.75 | 46.38 | −2.53 | 0.9* |
| North Dakota 2025 | 33.2 | $1,455.82 | 47.08 | −3.23 | 1.1* |
| Minnesota 2025 | 29.9 | $1,311.12 | 52.27 | −8.42 | 2.9* |
| Minnesota 2026 forecast | 29.1 | $1,276.04 | 53.71 | −9.86 | 3.3* |
| North Dakota 2026 forecast | 28.0 | $1,227.80 | 55.82 | −11.97 | 4.1* |
Source: yields from American Crystal via Agweek, Apr 28, 2026 [2] and USDA NASS, Oct 9, 2026 [3]; cost from FINBIN via Terrain, Oct 3, 2025 [11]; payment from American Crystal, Dec 8, 2025 [1]. Revenue and break-even are Crop Root Zone calculations that apply American Crystal's payment to state average yields as an illustration. Minnesota's state average includes Southern Minnesota Beet Sugar and Minn-Dak acres, which are paid on different terms. *Estimated net sugar price change needed, at about 295 lb of recoverable sugar per ton (USDA ERS 2025-crop extraction rate of 14.74% from slice [4]).
$55.82/ton
Payment needed to cover FINBIN's 2024 cost of $1,563 an acre at North Dakota's forecast 2026 yield of 28.0 tons an acre, $11.97 above the 2025-crop payment. (Crop Root Zone calculation from USDA NASS, Oct 9, 2026, and FINBIN via Terrain, Oct 3, 2025)
Lower tonnage raises the cost per ton. Most of the $1,563 is spent before the crop is harvested, so dividing it by 28 tons instead of 33 adds about $8.50 a ton to the break-even. On this arithmetic, the record 33.7-ton crop held American Crystal's average grower to a loss of about $85 an acre at the 2025 payment and 2024 costs. Growers with 28-ton yields will need a payment in the mid-$50s.
Ground Truth: Applying the Section 1 estimate to North Dakota's 28-ton yield, the 2026 payment needs a net sugar price about 4 cents a pound higher than the one behind the 2025 payment. The forward quotes in Section 1 are 6 to 12 cents higher. On those numbers the 2026 crop should come out near break-even or slightly better, not at a loss on the 2025 scale. Two things could change that: food demand that keeps slowing, and Mexican sugar entering under the 13.5% stocks-to-use target. A grower deciding 2027 acres and inputs this winter should budget at break-even, about $54 to $56 a ton on a below-average yield, and treat any improvement as upside. Our reading is that this is not the year to add cost to the beet acre in the hope of more tonnage.
4. Nitrogen: the rate that maximizes sugar is lower than the rate that maximizes tonnage
What's new: Fall fertilizer for 2027 beet ground is being priced and applied now. DTN's first-week-of-October survey had anhydrous at $977 a ton, or $0.60 a pound of N, up 20% from a year earlier, and urea at $672, or $0.73 a pound of N, up 12% [7]. NDSU's February 2026 crop budgets for the southern Red River Valley assumed nitrogen at $0.58 a pound (NDSU Extension, EC1660, Feb 2026) [22]. Fall N therefore costs a little more than growers budgeted in February.
Evidence: Red River Valley beet growers are paid on tons of recoverable sucrose, less impurities such as nitrate, amino-N and excess potassium. NDSU's guidance says excess N lowers sucrose percentage and raises nitrate and amino-N impurities [6]. The recommendation is not tied to a yield goal. The target is 100 lb of N an acre from soil nitrate in the top 2 feet plus fertilizer, or 130 lb when sampling to 4 feet. NDSU says recent studies with modern varieties confirmed those rates are enough for high yield and high sugar. It credits 40 lb of N after soybean, dry bean or other grain legumes, and advises against planting beets after alfalfa or sweet clover [6]. The University of Minnesota advises making the last N application before July 1, because excess N late in the season lowers sucrose and raises impurities (University of Minnesota Extension, Sugarbeet fertilizer guidelines) [21]. We could see that page only through search summaries because the Extension site returned 403 Forbidden to direct fetches.
NDSU's Table 1, adapted from a 1984 study that NDSU says recent work on modern varieties supports, shows how much sugar the extra N costs. The absolute sugar percentages are from older varieties; the size of the loss is what matters here. We priced the loss at the 2025-crop payment, which works out to about $0.149 a pound of recoverable sugar ($43.85 divided by about 295 lb a ton).
| Soil nitrate (0–2 ft) + fertilizer N, lb/a | Sugar, % | Recoverable sucrose, lb/a | Sucrose lost vs. 100 lb N | Value lost at $0.149/lb* | Extra N at $0.60/lb | Total cost, $/acre* |
|---|---|---|---|---|---|---|
| 100 | 14.4 | 6,040 | 0 | $0 | $0 | $0 |
| 150 | 13.2 | 5,600 | 440 | $65.40 | $30.00 | $95.40 |
| 200 | 13.1 | 5,440 | 600 | $89.18 | $60.00 | $149.18 |
| 300 | 12.6 | 5,110 | 930 | $138.24 | $120.00 | $258.24 |
Source: NDSU Extension SF714, Table 1 (adapted from Smith, 1984) [6]; N price from DTN, Oct 14, 2026 [7]; payment from American Crystal, Dec 8, 2025 [1]. *Crop Root Zone estimate: $0.1486 a pound of recoverable sucrose, equal to the $43.85 payment divided by about 295 lb a ton. At the 2024 payment of $78.00 the value of lost sucrose would be about 78% higher.
Fifty pounds over the target costs about $30 in fertilizer and about $65 in lost sugar at the 2025 payment, roughly $95 an acre in all. At a payment in the $60s the lost sugar alone would be close to $90. The soil test that sets the right rate costs far less. Fertilizer for a full soil-tested rate is a small line in the beet budget:
| Soil nitrate, 0–2 ft, lb/a | Fertilizer N to reach 100 lb | Anhydrous at $0.60/lb N | Urea at $0.73/lb N | Anhydrous cost |
|---|---|---|---|---|
| 20 | 80 | $48.00 | $58.40 | ██████████ |
| 40 | 60 | $36.00 | $43.80 | ████████░░ |
| 60 | 40 | $24.00 | $29.20 | █████░░░░░ |
| 80 | 20 | $12.00 | $14.60 | ███░░░░░░░ |
| 100 | 0 | $0.00 | $0.00 | ░░░░░░░░░░ |
Source: NDSU Extension SF714, Table 2 (100 lb N per 2-foot sample) [6]; DTN retail averages, first week of October 2026 [7]. Subtract 40 lb N after soybean or dry bean [6]. Dollar figures are Crop Root Zone calculations. Bars scaled to $48.
NDSU's guidance on timing and product applies directly to fall application. Fall anhydrous should not go on before October 1, and only when the 4-inch soil temperature between 6 and 8 a.m. is 50°F or lower. Subsurface-banded urea should wait at least another week, and broadcast urea two weeks. Fall N is not recommended on sandy loam or coarser soils, near river floodplains, or on high-water-table soils [6]. In spring, urea should not exceed 100 lb of N an acre or stands may suffer. NDSU discourages polymer-coated urea because N released late in the season can lower sugar content [6]. A beet crop also leaves N for the next crop: NDSU credits 80 lb an acre after green leaves at harvest, 30 after yellow-green and none after yellow [6].
Ground Truth: This fall's soil test should go deeper than usual. NDSU allows 2-foot sampling on fields with a good beet-quality history, but asks for 4 feet on fields new to beets or with recent low sugar [6]. Our read is that 2026 adds a third case. Most 2027 beet fields grew wheat this year. A dry June and July likely held down wheat yields and left nitrate unused, and nearly 7 inches of rain from August through September [16] may have moved it below 2 feet. A 2-foot core would miss that nitrate. The beet roots would find it late in the season, when it lowers sugar and raises impurities, the two things growers are paid on. On drought-affected fields headed to beets, pay for the 4-foot core, use the 130 lb target with the 65 lb minimum in the top 2 feet [6], and cut the fall rate to match. At current prices, every 10 lb of N you do not apply saves $6 an acre. The larger saving is in the sugar you would otherwise lose.
References
- American Crystal Sugar Company, "American Crystal Sugar Company shareholders harvest a record-breaking crop, face market challenges," press release, Fargo, ND, Dec 8, 2025 (2025 crop 13.3 million tons, 18.0% sugar; forecast net payment $43.85/ton; 2024 crop $78.00/ton) — https://www.crystalsugar.com/about-our-cooperative/news-media/news/american-crystal-sugar-company-shareholders-harvest-a-record-breaking-crop-face-market-challenges/
- Bailey, A., "Sugarbeet planting begins for American Crystal Sugar," Agweek, Apr 28, 2026 (2026 planned acres 399,000 vs 407,000 in 2025; 2025 yield 33.7 t/a; payments $43.80 for 2025, $78.00 for 2024, $83.18 for 2023) — https://www.agweek.com/news/sugarbeet/sugarbeet-planting-begins-for-american-crystal-sugar
- USDA National Agricultural Statistics Service, Crop Production, Oct 9, 2026 (sugarbeet area harvested, yield and production by state, 2025 and October 1, 2026 forecast) — https://esmis.nal.usda.gov/sites/default/release-files/796101/crop1026.txt
- Abadam, V., and Huang, J., Sugar and Sweeteners Outlook: October 2026, SSS-M-458, USDA Economic Research Service, Oct 16, 2026 (Tables 1–3: 2026/27 beet sugar 4.742 million STRV; total production 8.768 million STRV; stocks-to-use 14.9%; 2025-crop extraction 14.74%; harvest progress; drought share) — https://ers.usda.gov/media/29758/sss-m-458.pdf
- Sosland Publishing, Sweetener Report, "US Sugar Prices Gain on Tight Supply, Tariff Support," via CZ App, Jul 21, 2026 (2026-27 Midwest beet 44–48¢/lb FOB; Gulf/Southeast cane 50–53¢/lb) — https://www.czapp.com/analyst-insights/us-sugar-prices-gain-on-tight-supply-tariff-support-2/
- Franzen, D. W., Fertilizing Sugarbeet in North Dakota, SF714, NDSU Extension, reviewed Feb 2023 (Table 1, sugar content and recoverable sucrose vs available N; Table 2, 100 lb N/2 ft and 130 lb N/4 ft; Table 3, previous-crop credits; fall application timing; leaf-color N credits) — https://www.ndsu.edu/agriculture/sites/default/files/2023-02/sf714.pdf
- DTN/Progressive Farmer, "UAN32 Leads Fertilizer Prices Higher Again in First Week of October," Oct 14, 2026 (retail averages for Oct 5–9: anhydrous $977/ton, $0.60/lb N; urea $672/ton, $0.73/lb N) — https://www.dtnpf.com/agriculture/web/ag/crops/article/2026/10/14/uan32-leads-fertilizer-prices-higher
- Red River Farm Network, "American Crystal Warns of Lower Payments in 2026," Dec 7, 2025 — https://www.rrfn.com/2025/12/07/american-crystal-warns-of-lower-payments-in-2026/
- Red River Farm Network, "Sugar Loan Rates, Allocations Announced," Oct 1, 2026 (FY2027 refined beet loan rate 32.63¢/lb for Minnesota and eastern North Dakota; FY2026 cooperative allocation changes), reporting USDA FSA's Sep 30, 2026 announcement — https://www.rrfn.com/2026/10/01/sugar-loan-rates-allocations-announced/
- Deliberto, M. (LSU AgCenter), "Sugar Market Outlook," Southern Ag Today 6(24.3), Jun 10, 2026 (Midwest refined beet spot 38.00¢ Sep 2025, 41.67¢ Jan–Apr 2026 avg, 42.00¢ Apr 2026; No. 16 32.97¢ Jan–Apr 2026 avg) — https://southernagtoday.org/2026/06/10/sugar-market-outlook/
- Newton, J., "Big Supplies, Slowing Demand Roil Sugar Prices, Margins," Terrain (American AgCredit) Quarterly Outlook, Oct 3, 2025 (FINBIN sugarbeet direct expenses $1,284/acre and overhead $279/acre in 2024; 2025 cost projection approaching $1,600; Aug 2025 refined beet spot 35.75¢/lb) — https://www.terrainag.com/insights/big-supplies-slowing-demand-roil-sugar-prices-margins/
- Sosland Publishing, Sweetener Report, "US Sugar Prices Rise on Tariff Fears, Crop Risks," via CZ App, Jun 3, 2026 (2026-27 Midwest beet 44–47¢/lb FOB, some trade at 42¢) — https://www.czapp.com/analyst-insights/us-sugar-prices-rise-on-tariff-fears-crop-risks/
- Investing.com, "ICE US Sugar #16 Futures Historical Data" (SFSc1 continuous front month, delayed), accessed Oct 21, 2026 (42.00¢/lb Oct 20, 2026; 39.00¢ Sep 30) — https://www.investing.com/commodities/ice-us-sugar-16-c1-futures-historical-data
- CZ App, "Daily Market Price Updates and Commentary 16th October 2026" (ICE No. 11 March 2027 settlement 20.85¢/lb) — https://www.czapp.com/analyst-insights/daily-market-price-updates-and-commentary-16th-october-2026/
- Bailey, A., "American Crystal Sugar kicks off 2026 pre-pile harvest," Agweek, Aug 14, 2026 (398,000 acres; early samples below a year earlier, sugar above average) — https://www.agweek.com/news/sugarbeet/american-crystal-sugar-kicks-off-2026-pre-pile-harvest
- Bailey, A., "American Crystal Sugar's stockpile beet harvest begins as drought eases," Agweek, Oct 2, 2026 — https://www.agweek.com/news/sugarbeet/american-crystal-sugars-stockpile-beet-harvest-begins-as-drought-eases
- Agweek, "Sugarbeet root yield could be among the largest for SMBSC," Sep 3, 2026 — https://www.agweek.com/news/sugarbeet/sugarbeet-root-yield-could-be-among-the-largest-for-smbsc
- University of Minnesota Center for Farm Financial Management (FINPACK), Minnesota Price and Cost Summary, 2025 edition (sugar beets: price received $73.32/ton and cost of production $56.07/ton in 2024) — https://finpack.umn.edu/wp-content/uploads/MinnesotaPriceAndCostSummary2025.pdf
- Thiesse, K., "A closer look at how crop profitability reduced in 2025," Agweek, Dec 11, 2025 — https://www.agweek.com/opinion/a-closer-look-at-how-crop-profitability-reduced-in-2025
- University of Minnesota Extension, "Minnesota farm finances show resilience in 2025, but pressure points remain," 2026 (direct fetch returned 403 Forbidden; figure seen in search summaries only) — https://extension.umn.edu/ag-business-management-news/minnesota-farm-finances-show-resilience-2025
- University of Minnesota Extension, "Sugarbeet fertilizer guidelines" (direct fetch returned 403 Forbidden; content seen in search summaries only) — https://extension.umn.edu/nutrient-management/sugarbeet-fertilizer-guidelines
- Haugen, R., Projected 2026 Crop Budgets: South Valley North Dakota, EC1660, NDSU Extension, Feb 2026 (nitrogen priced at $0.58/lb) — https://www.ndsu.edu/agriculture/sites/default/files/2026-02/ec1660.pdf
Disclosures
Crop Root Zone is an independent publication. Nothing here is investment advice. Market calls, where included, reflect the editors' own read and are not a recommendation to buy or sell any security.
An Iowa Ethanol Plant Earns About $3.60 a Bushel Over Its Corn, 71 Cents More Than a Year Ago. Feed and Oil Return 48 Cents of Every Corn Dollar. The Plants Still Pay Only a Dime Over Iowa Elevators.
At mid-October USDA prices, the ethanol, distillers grains and corn oil from one bushel are worth $7.95 at an Iowa plant, and the plant pays $4.36 for the corn. Distillers grains are up 44% from a year ago and cost more per ton than corn. Co-products gained 58 cents a bushel while corn rose 46, so net corn cost per gallon fell. After energy and operating costs, we estimate the plant nets 55 to 65 cents a gallon, about three times the 2025 average. The margin rests on $3.50 gasoline, and ethanol stocks are 1.3 million barrels above a year ago. Little of it reaches the corn bid: plants pay 11 cents over country elevators in Iowa, 16 in Indiana, 27 in Illinois and nothing in Nebraska.
On Monday, October 19, Iowa ethanol plants bid an average of $4.36 a bushel for corn delivered, 31 cents under December futures at $4.67 (USDA AMS, National Daily Ethanol Report, Oct 20, 2026) [2]. In the week to October 16, the same plants sold ethanol at $1.95 to $2.05 a gallon, dried distillers grains at $180 to $215 a ton and distillers corn oil at 67 to 75 cents a pound (USDA AMS, National Weekly Ethanol Report, Oct 16, 2026) [1]. At standard plant yields those products are worth $7.95 for each bushel ground. The gross spread over corn is $3.60, up 71 cents from the same week a year ago. Corn is 46 cents higher than it was then. The plant made up all of that and more from feed and oil, before counting any gain on ethanol. The plants are not passing that margin on in their corn bids. In Iowa they pay 11 cents more than the average country elevator, almost exactly what they paid a year ago.
This piece works through the margin from the price reports, estimates what is left after operating costs, and compares the plant bid with the country bid in four states. TRZ-0291 covered the soybean crush (TRZ-0291, Oct 19, 2026) [16], and TRZ-0095 covered how the 45Z credit values corn practices (TRZ-0095, Aug 13, 2026) [18]. Neither is repeated here. The margins below are gross of any 45Z credit, which varies by plant.
1. The bushel at the plant: $7.95 of product against $4.36 of corn
What's new: Product prices at Iowa plants are well above a year ago on all three lines. Ethanol is 11% higher, distillers grains 44% higher and corn oil 28% higher. The plant's corn bid is up 12% [1][2].
Evidence: The table applies the University of Illinois representative-plant yields of 2.95 gallons of ethanol, 15.25 pounds of dried distillers grains and 0.95 pound of corn oil per bushel (farmdoc daily, Mar 4, 2026) [5] to Iowa prices from USDA's two ethanol reports. Year-ago prices are taken from the same reports' year-ago columns.
| Iowa plant, per bushel ground | Price, mid-Oct 2026 | Value $/bu | Price, mid-Oct 2025 | Value $/bu | Change $/bu |
|---|---|---|---|---|---|
| Ethanol, 2.95 gal | $1.99/gal | 5.87 | $1.79/gal | 5.28 | +0.59 |
| Dried distillers grains, 15.25 lb | $186.57/st | 1.42 | $129.47/st | 0.99 | +0.44 |
| Distillers corn oil, 0.95 lb | 69.34¢/lb | 0.66 | 54.22¢/lb | 0.52 | +0.14 |
| Product value | 7.95 | 6.78 | +1.17 | ||
| Corn, delivered plant bid | $4.36/bu | 4.36 | $3.90/bu | 3.90 | +0.46 |
| Gross spread over corn | 3.60 | 2.88 | +0.71 |
Basis: ethanol is the midpoint of Iowa FOB-plant rail ($1.975) and truck ($2.005) averages, with the year-ago figure from the truck series; distillers grains are the mean of Iowa East and Iowa West truck asks; corn oil is the mean of Iowa East and Iowa West asks; corn is the mean of Iowa East and Iowa West delivered plant bids on October 19 settlements. Source: USDA AMS, National Weekly Ethanol Report, Oct 16, 2026 [1]; USDA AMS, National Daily Ethanol Report, Oct 20, 2026 [2]; yields from farmdoc daily, Mar 4, 2026 [5]. Values, totals and changes are Crop Root Zone calculations; rows may not sum because of rounding.
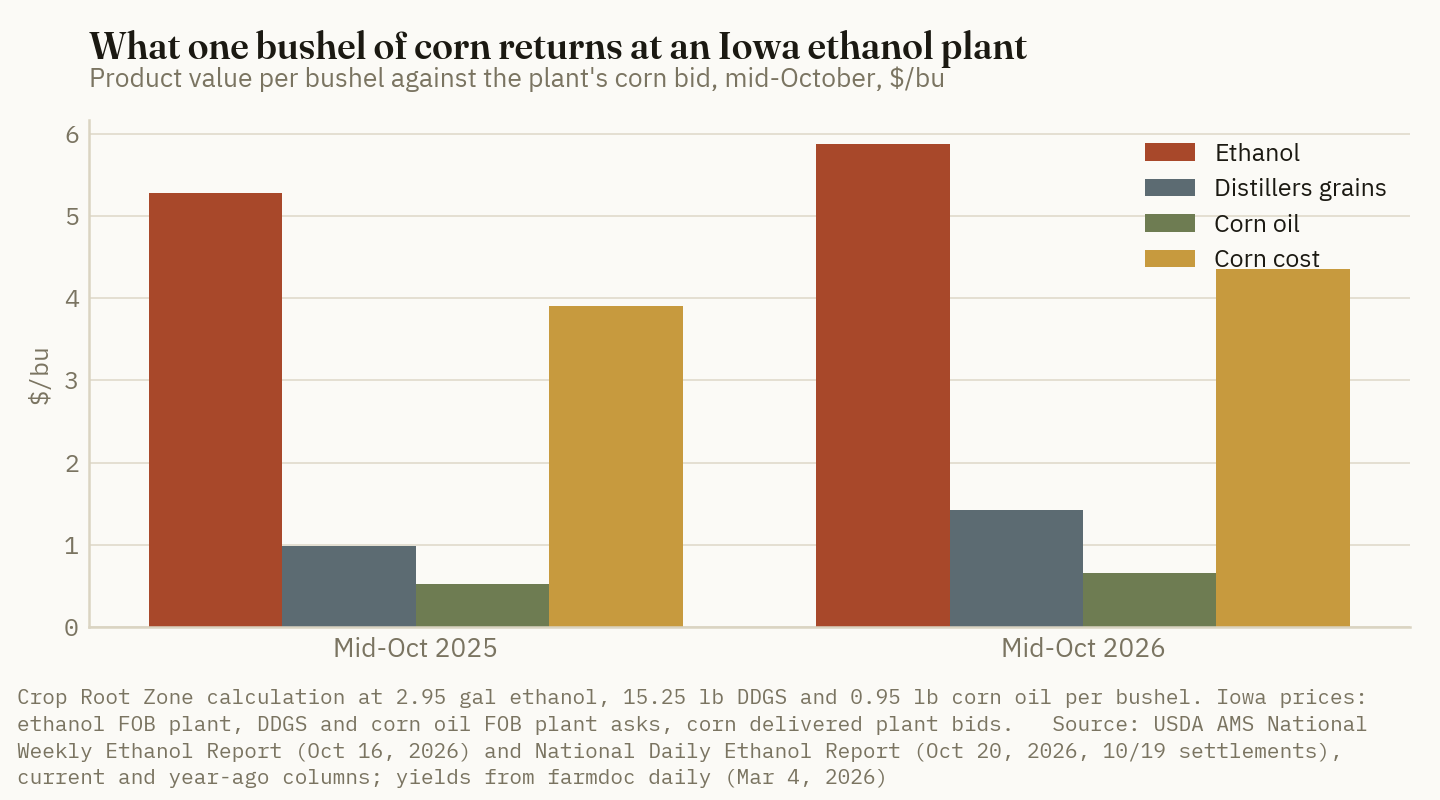
USDA's own measure points the same way. Its National Weekly Grain Co-Products Report uses lower yields: 2.85 gallons, 16.5 pounds of distillers grains and 0.6 pound of oil. On that basis it put Iowa's estimated processing value at $7.60 a bushel for October 5–9, against $6.60 a year earlier. Its margin over the average ethanol-plant corn input price of $4.73 was $2.87 (USDA AMS, National Weekly Grain Co-Products Report, Oct 13, 2026) [3]. That figure is $0.73 below ours for two reasons. December corn was 16 cents higher that week, and USDA uses a national corn input price rather than Iowa plant bids. On both yield sets, product value is up about a dollar a bushel from a year ago.
Yield assumptions also matter. Iowa State's CARD margin tool still models 2.80 gallons, 17 pounds of distillers grains and 0.7 pound of oil per bushel (CARD, accessed Oct 20, 2026) [6]. The Illinois model's 2.95 gallons reflects plants that have raised ethanol yield and extract more oil. At today's prices, the extra 0.15 gallon is worth about 30 cents a bushel. The 1.75 pounds of distillers grains it gives up are worth about 16 cents. A plant's own yields can therefore move the spread by more than a week of price changes.
2. Feed and oil paid for the corn increase
What's new: Distillers grains and corn oil now return 48% of what the plant pays for corn, up from 39% a year ago. Iowa distillers grains at $186.57 a ton cost more than corn on a per-ton basis. A $4.36 bushel works out to $155.57 a ton, so the feed is at 120% of corn's price. A year ago it was at 93% [1][2].
+$0.58 vs +$0.46
Year-on-year change in distillers grains and corn oil value per bushel at an Iowa plant, against the change in the plant's corn bid. Net of co-products, corn costs the plant 77 cents a gallon, down from 81 cents a year ago. (Crop Root Zone calculation from USDA AMS, Oct 16 and Oct 20, 2026)
Evidence: Distillers grains are firm everywhere, not just in Iowa. In the week to October 16, Midwest plant asks ran from $175 in Wisconsin to $220 in Kansas, and export points were higher still: New Orleans $242 to $257 and the Pacific Northwest $272 to $275 [1]. Export demand explains much of it. U.S. distillers grains exports rose 18% in August to 1.30 million metric tons, the most in any month since August 2015. Mexico, Indonesia and New Zealand were the largest buyers, and January–August exports reached 8.57 million tons, up 13% (RFD-TV, citing the Renewable Fuels Association, Oct 9, 2026) [10]. The soybean meal market, which competes with distillers grains for protein demand, has also firmed. December meal was $359.80 a ton on October 16, up $28.50 since August (TRZ-0291) [16].
Corn oil is the smaller line but the more policy-driven one. Iowa plants asked 68 to 70.67 cents a pound, against 54 cents a year ago [1]. Iowa crude soybean oil traded at 66.65 to 68.70 cents in the same week (USDA AMS, National Weekly Ag Energy Round-Up, Oct 16, 2026) [4]. Distillers corn oil, a renewable-diesel and biodiesel feedstock, is priced at or above soybean oil, which TRZ-0291 found is supported mainly by biofuel policy [16].
Ground Truth: The co-products have changed what the corn price does to the plant. A year ago, 61 cents of each corn dollar had to be recovered from ethanol. Today the figure is 52 cents. That makes the plant less sensitive to a corn rally than at any point in the last year and more sensitive to the feed market. If distillers grains fell back to 93% of corn's price per ton, the plant would lose about 32 cents a bushel. That is equal to an 11-cent drop in ethanol. Watch distillers grains export numbers and soybean meal with the same attention as ethanol.
3. From gross spread to plant margin: an estimated 55 to 65 cents a gallon
What's new: No public source publishes a current-month net margin for a representative plant. Iowa State's Ag Decision Maker spreadsheet could not be retrieved because the server returned a bot check. We have therefore applied the cost structure in farmdoc daily's representative plant to this week's prices [5].
Evidence: The cost stack below is a Crop Root Zone estimate. Its inputs are sourced, but the result is not a reported figure.
| Cost line, per bushel ground | $/bu | $/gal | Basis |
|---|---|---|---|
| Gross spread over corn (Section 1) | 3.60 | 1.22 | USDA AMS, Oct 16 and Oct 20 |
| Natural gas, 82.5 cu ft | −0.26* | −0.09* | NYMEX Nov at $3.058/MMBtu, 1,037 Btu/cu ft |
| Other variable costs | −0.59* | −0.20* | Midpoint of farmdoc's $0.17–0.22/gal |
| Denaturant | −0.19* | −0.06* | 2% of RBOB Nov at $3.19 |
| Marketing netbacks | −0.23* | −0.08* | $0.065/gal ethanol; $5/st distillers grains |
| Corn oil extraction | −0.06* | −0.02* | $0.06/lb |
| Operating margin | 2.27* | 0.77* | |
| Fixed costs | −0.44* | −0.15* | farmdoc 2018–2024 figure |
| Net margin | 1.83* | 0.62* | Range ~$0.55–0.65/gal |
Source: farmdoc daily, Mar 4, 2026 (yields and cost structure) [5]; USDA AMS, Oct 16 and Oct 20, 2026 (prices and futures settlements) [1][2]. *Crop Root Zone estimates. Natural gas is priced at NYMEX futures; delivered Midwest gas costs more, and each $1/MMBtu reduces the margin by about 9 cents a bushel (3 cents a gallon). The range covers farmdoc's other-cost band and a $1 natural gas adder. Excludes 45Z credits, cellulosic-ethanol revenue and RIN value retained by the plant.
Our estimate of about 62 cents a gallon is close to three times the $0.21 average net profit farmdoc daily calculated for 2025 [5]. On these numbers the plant would still break even with corn at about $6.18 a bushel. That is $1.82 over its current bid and about $1.50 above USDA's $4.70 season-average price forecast (WASDE-676, Oct 9, 2026) [11]. The plant's exposure is to ethanol, not corn. Each 10-cent move in the ethanol price changes the margin by 29.5 cents a bushel.
Ground Truth: A margin this wide in harvest month is unusual, and the plants will run hard to capture it. Weekly output dipped to 1.007 million barrels a day in late September, the usual window for fall downtime, and was back to 1.065 million by October 9 (EIA, accessed Oct 20, 2026) [7]. Expect plants to defer further downtime until the margin narrows. That supports the 5.65 billion bushels USDA assigns to ethanol for 2026/27, 50 million more than in September [11]. It does not mean the plants need to pay more for corn. Section 5 shows why.
4. Ethanol is cheap against gasoline, but it is not scarce
What's new: Ethanol has risen far less than gasoline over the past year. On October 14 ethanol was $2.236 a gallon FOB U.S. Gulf, 9.8% higher than a year earlier. Regular gasoline FOB Gulf was $3.532, 77.9% higher. Ethanol is now $1.30 a gallon under gasoline. A year ago it was 5 cents over. WTI crude was $94.68 a barrel. The report also notes that Middle East developments have raised tanker rates and insurance costs (U.S. Grains Council, Ethanol Market and Pricing Report, Oct 14, 2026) [9]. FOB Gulf ethanol is down from $2.285 on September 23 [19].
Evidence: A discount that large keeps blenders using every gallon they can and makes U.S. ethanol competitive overseas. Exports were 211.8 million gallons in August, a five-month high. Canada took 84.8 million gallons, and January–August exports were 1.62 billion gallons, up 12% [10]. The discount has not tightened the domestic market, however. EIA's weekly stocks were 23.94 million barrels on October 9, against 22.63 million a year earlier. That is 1.31 million barrels, or 5.8%, more. Production was 1.065 million barrels a day, against 1.074 million [7][8].
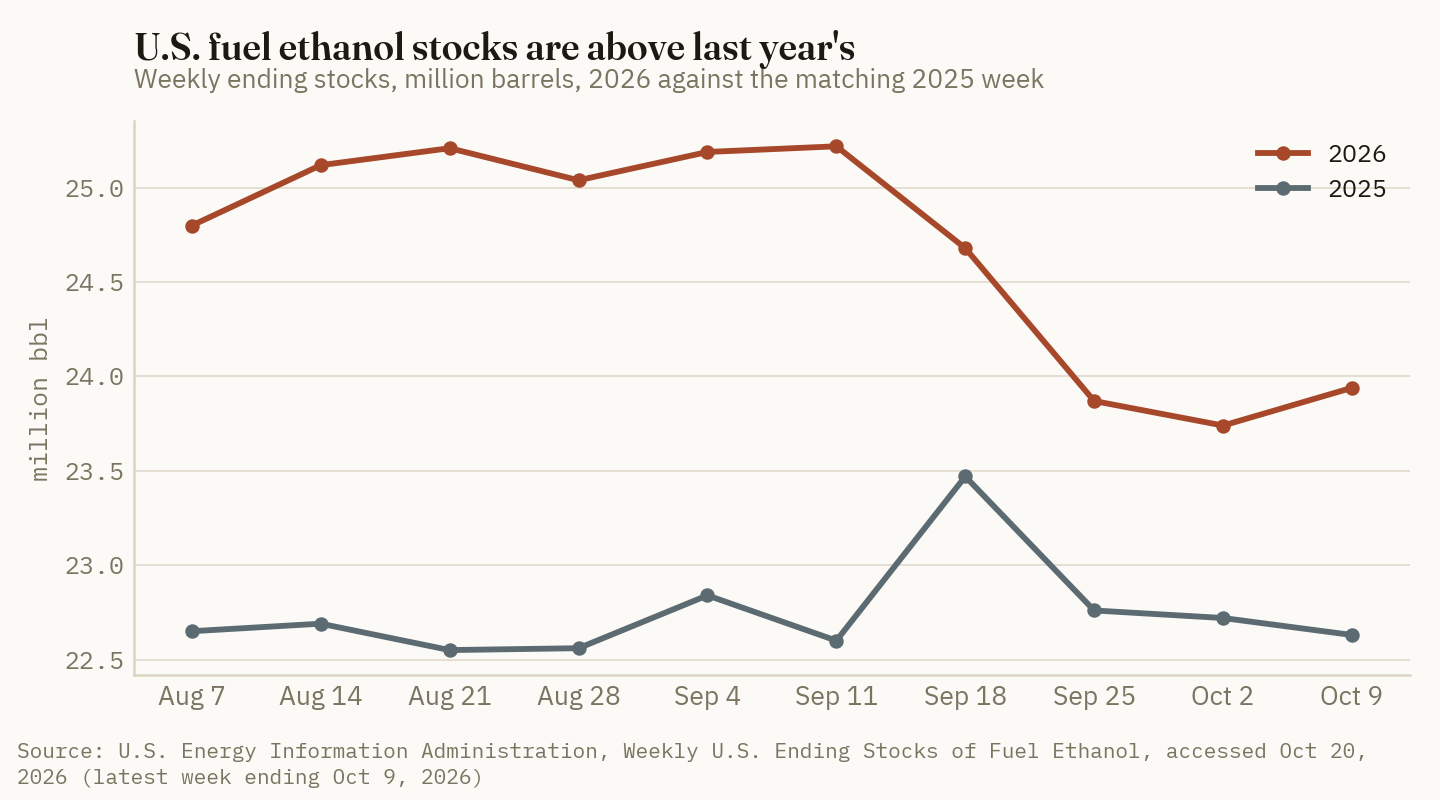
The surplus over last year peaked at 2.66 million barrels in the week of August 21. It narrowed to 1.02 million by October 2, after output dipped in late September, then widened again as production recovered [7][8]. EIA's next weekly report is due October 21 [8].
Ground Truth: The ethanol leg of this margin depends on gasoline, not on a shortage of ethanol. Supply is above last year, and plants are restarting at a 60-cent margin, so ethanol's price is held up by the gasoline price and the export pull. A drop in crude, from any easing of the Middle East disruption, would close the $1.30 discount from the gasoline side. The plants would lose margin even though the ethanol market itself has not changed. Every 10 cents off ethanol takes 29.5 cents off the bushel. A 30-cent fall, about a quarter of the current discount, would bring the estimated net margin down to about 32 cents a gallon. That is still profitable, but the plants would have no reason to pay up for corn.
5. The corn bid: a $1.80 cushion and a premium of about a dime
What's new: On October 19 ethanol plants bid more than the country-elevator average in three of four states with comparable USDA reports. The premium was 11 cents in Iowa, 16 cents in Indiana and 27 cents in Illinois. In Nebraska the plants bid the same as the country average. In Iowa the premium is the same as a year ago. In Illinois and Indiana it is 5 to 7 cents wider. In Nebraska it is 9 cents narrower [2][12][13][14][15].
Evidence:
| Oct 19, 2026, current delivery | Ethanol plant avg $/bu | Plant basis | Country avg $/bu | Plant premium | Year-ago premium | Worth at 181.2 bu/ac | |
|---|---|---|---|---|---|---|---|
| Illinois | 4.5929 | −8Z | 4.3260 | +0.27 | +0.21 | $48.37 | ██████████ |
| Indiana | 4.5311 | −14Z | 4.3666 | +0.16 | +0.09 | $29.80 | ██████░░░░ |
| Iowa | 4.3559 | −31Z | 4.2501 | +0.11 | +0.10 | $19.18 | ████░░░░░░ |
| Nebraska | 4.4294 | −24Z | 4.4311 | 0.00 | +0.09 | $0.00 | ░░░░░░░░░░ |
Basis: US No. 2 yellow corn, delivered by truck; Z = CBOT December 2026 corn, $4.67 on October 19. Source: USDA AMS, National Daily Ethanol Report, Oct 20, 2026 (October 19 settlements) [2]; USDA AMS Iowa Daily Cash Grain Bids [12], Illinois Grain Bids [13], Indiana Grain Bids [14] and Nebraska Daily Elevator Grain Bids [15], Oct 19, 2026. Iowa's plant figure is the mean of the Iowa East and West averages. Country averages are simple means of each report's regional country-elevator averages (Iowa 6 regions, Illinois 7, Indiana 7, Nebraska 7), and year-ago premiums use each report's year-ago columns. Per-acre values use USDA's October national yield of 181.2 bu/acre [11]. Bars scaled to 27 cents. All calculations are Crop Root Zone's.
The plant premium is small next to the plant's margin. Iowa plants could pay $1.82 more for corn before they lost money on the estimate in Section 3. They pay 11 cents over the country average. In mid-October 2025 the gross spread was 71 cents a bushel narrower, and the premium was a penny less. A wider margin has not produced a wider premium. In Illinois, plants bid 8 under December and Mississippi River barge-loading elevators bid at December flat. Illinois River elevators bid 22 to 36 under, and Chicago processors 0 to 2 under for current delivery [13]. An Illinois plant prices against the river and the processors, not against its own margin. Nebraska's northwest country average of $4.85, 18 over December, is the highest regional figure in the four reports [15]. Plant bids in Nebraska are level with the state average. On our read, local feeding demand sets the price there and the ethanol plants simply match it.
Delivery distance reduces the premium. This publication's haul arithmetic puts a marginal truck mile at 0.4 to 0.5 cents a bushel (TRZ-0256, Oct 5, 2026) [17]. On that basis, Iowa's 11-cent premium pays for roughly 21 to 27 extra miles, Indiana's 16 cents for 33 to 41, and Illinois' 27 cents for 53 to 67. A longer wait at the plant's dump pit than at the elevator reduces those distances further.
Supply is the reason plants bid so little over the elevator. USDA raised the 2026 crop by 234 million bushels in October to 16.0 billion, at 181.2 bushels an acre. It now projects 2026/27 ending stocks at 1.85 billion bushels, up 282 million [11]. With harvest at its peak, an ethanol plant can fill its grind from corn within trucking distance at a few cents over the elevator. It pays only enough to keep its usual suppliers.
Ground Truth: The ethanol margin goes to the plant, and the plant premium covers little more than the haul. A grower with corn to move should not expect this fall's wide crush margin to show up in a harvest-day plant bid. Use the plant premium only when it beats the extra miles at half a cent a mile. The better use of the plant is a deferred delivery slot. A plant earning 60 cents a gallon will keep grinding through the winter. Once farmer selling slows after harvest, it has to buy corn from growers who are no longer selling. That is when its bid has to move, and growers with storage are the only ones who can sell then. Ask the plant for a December-through-February delivery bid against March futures, and compare it with the elevator's carry. Do not hold unpriced corn waiting for the margin to show up in the plant's basis. Of the two risks in this piece, a drop in gasoline prices is the one that would hit the corn bid, and it would do so before a larger plant premium arrived.
References
- USDA AMS Livestock, Poultry and Grain Market News, National Weekly Ethanol Report, Oct 16, 2026 (report for Oct 12–16; ethanol, distillers corn oil, dried and wet distillers grains by state with year-ago averages; CBOT, NYMEX settlements as of Oct 15) — https://www.ams.usda.gov/mnreports/ams_3616.pdf
- USDA AMS Livestock, Poultry and Grain Market News, National Daily Ethanol Report, Oct 20, 2026 (US No. 2 yellow corn delivered to ethanol plants by state, with year-ago averages; settlements as of Oct 19: December corn 467.00¢, November natural gas $3.058, November RBOB $3.1914) — https://www.ams.usda.gov/mnreports/ams_3617.pdf
- USDA AMS Livestock, Poultry and Grain Market News, National Weekly Grain Co-Products Report, Oct 13, 2026 (week of Oct 5–9; corn estimated processing value, Iowa $7.60/bu, margin $2.87, year ago $6.60; ethanol-plant corn input $4.73; yields 2.85 gal, 16.5 lb, 0.6 lb) — https://www.ams.usda.gov/mnreports/ams_3618.pdf
- USDA AMS Livestock, Poultry and Grain Market News, National Weekly Ag Energy Round-Up, week ending Oct 16, 2026 (Iowa ethanol; Iowa crude soybean oil 66.65–68.70¢/lb) — https://www.ams.usda.gov/mnreports/lswagenergy.pdf
- Irwin, S., "Ethanol Production Profits in 2025," farmdoc daily (16):36, University of Illinois, Mar 4, 2026 (representative plant: 2.95 gal, 15.25 lb DDGS, 0.95 lb corn oil, 82.5 cu ft natural gas per bushel; $0.17–0.22/gal other variable costs; $0.15/gal fixed costs; 2025 average net profit $0.21/gal) — https://farmdocdaily.illinois.edu/2026/03/ethanol-production-profits-in-2025.html
- Center for Agricultural and Rural Development, Iowa State University, "Operating Margins" tool, accessed Oct 20, 2026 (representative Iowa plant assumptions: 2.80 gal, 17 lb DDGS, 0.7 lb corn oil per bushel) — https://www.card.iastate.edu/tools/operating-margins/
- U.S. Energy Information Administration, Weekly U.S. Oxygenate Plant Production of Fuel Ethanol, accessed Oct 20, 2026 (latest week ending Oct 9, 2026: 1,065 thousand b/d; Sep 25: 1,007; Aug 7: 1,117) — https://www.eia.gov/dnav/pet/hist/LeafHandler.ashx?n=PET&s=W_EPOOXE_YOP_NUS_MBBLD&f=W
- U.S. Energy Information Administration, Weekly U.S. Ending Stocks of Fuel Ethanol, accessed Oct 20, 2026 (Oct 9, 2026: 23,942 thousand barrels vs 22,628 for Oct 10, 2025; next release Oct 21) — https://www.eia.gov/dnav/pet/hist/LeafHandler.ashx?n=PET&s=W_EPOOXE_SAE_NUS_MBBL&f=W
- U.S. Grains Council (prices from World Perspectives, Inc.), Ethanol Market and Pricing Report, Oct 14, 2026 (ethanol FOB Gulf $2.236/gal, regular gasoline FOB Gulf $3.532/gal, with prior-year averages; WTI $94.68/bbl) — https://grains.org/wp-content/uploads/2026/10/Ethanol-Market-and-Pricing-Report-10142026.pdf
- St. James, T., "Ethanol and Distillers Grains Exports Strengthen in August," RFD-TV, Oct 9, 2026 (citing Renewable Fuels Association analysis of government trade data) — https://www.rfdtv.com/ethanol-and-distillers-grains-exports-strengthen-in-august
- USDA World Agricultural Outlook Board, World Agricultural Supply and Demand Estimates, WASDE-676, Oct 9, 2026 (U.S. corn supply and use: production 16,034 mil bu, yield 181.2 bu/acre, ethanol use 5,650 mil bu, ending stocks 1,849 mil bu, season-average price $4.70) — https://www.usda.gov/oce/commodity/wasde/wasde1026.pdf
- USDA AMS / Iowa Department of Agriculture Market News, Iowa Daily Cash Grain Bids, Oct 19, 2026 (final; state average corn $4.24, −43Z) — https://www.ams.usda.gov/mnreports/ams_2850.pdf
- USDA AMS / Illinois Department of Agriculture Market News, Illinois Grain Bids, Oct 19, 2026 (final; country elevator, processor and barge-loading corn bids) — https://www.ams.usda.gov/mnreports/ams_3192.pdf
- USDA AMS / Indiana Department of Agriculture Market News, Indiana Grain Bids, Oct 19, 2026 (final) — https://www.ams.usda.gov/mnreports/ams_3463.pdf
- USDA AMS / Nebraska Department of Agriculture Market News, Nebraska Daily Elevator Grain Bids, Oct 19, 2026 (final) — https://www.ams.usda.gov/mnreports/ams_3225.pdf
- Crop Root Zone, TRZ-0291, "A Crushed Soybean Is Worth $15.30, the Same as in August…," Oct 19, 2026.
- Crop Root Zone, TRZ-0256, "An Extra Mile to a Better Bid Costs 0.4 to 0.5 Cents a Bushel at $6.53 Diesel…," Oct 5, 2026.
- Crop Root Zone, TRZ-0095, "A Federal Tax Credit Now Decides Which Fertilizer Practices Have Value. Your Agronomy Has No Vote.," Aug 13, 2026.
- U.S. Grains Council (prices from World Perspectives, Inc.), Ethanol Market and Pricing Report, Sep 23, 2026 (ethanol FOB Gulf $2.285/gal) — https://grains.org/wp-content/uploads/2026/09/Ethanol-Market-and-Pricing-Report-09232026.pdf
Disclosures
Crop Root Zone is an independent publication. Nothing here is investment advice. Market calls, where included, reflect the editors' own read and are not a recommendation to buy or sell any security.
A Diesel Pivot Costs $16.58 to Pump an Acre-Inch at October's Record Farm Diesel. Controlled Electric Does It for $3.37 to $4.39, and Natural Gas for $2.91.
On the Nebraska Pumping Plant Performance Criteria, a 125-acre pivot lifting from 150 feet at 40 psi burns about $22,800 of diesel in an 11-inch season at $5.76 a gallon. The same water costs $4,600 to $9,200 on five 2026 public-power and co-op irrigation tariffs, $12,800 on propane and $4,000 on natural gas. Converting to electric pays back in about 2 to 5 years within a mile of three-phase at today's diesel, but at half a mile it needs diesel to average above $4.16 to pay back in five. A pumping-plant tune-up is worth about $3,200 a year on a diesel well and under $900 on electric.
On October 16 the USDA's Illinois survey put diesel for agricultural use at $5.76 a gallon, the highest in the series since reporting began in 2008. It had been $2.68 on January 9. The run-up started with the conflict with Iran at the end of February, eased to $3.79 in late June, and then climbed again (farmdoc daily, Oct 20, 2026) [1]. Iowa's farm diesel was quoted at $5.44 to $5.60 a month earlier (USDA AMS, Sep 18, 2026) [4]. For a Plains irrigator the gallon price is only half the question. The other half is how much water a gallon moves. The University of Nebraska answered that sixty years ago with the Nebraska Pumping Plant Performance Criteria (NPPPC), and Kansas State built its fuel-comparison method on the same numbers. This piece puts this fall's diesel, propane and natural gas prices and six 2026 electric irrigation tariffs into that method. It prices one typical Nebraska–Kansas well and season, then works out what converting a diesel well and testing a pumping plant are worth.
Earlier pieces covered nearby ground, and this one does not repeat them: diesel on Delta rice floods in July and August [19][20], co-op three-phase line costs for a grain-bin fan [18], and drip retrofits [21]. None priced a center pivot's energy by fuel.
1. The yardstick: how much fuel an acre-inch takes
What's new: Nothing in the method. That is its value. The NPPPC states how much work a well-designed, well-maintained pumping plant should get from each fuel, measured in water horsepower-hours (whp-h). The figures are 12.5 whp-h per gallon of diesel, 6.89 per gallon of propane, 61.7 per Mcf of natural gas (at 925 Btu per cubic foot) and 0.885 per kWh of electricity. The electric figure assumes a 75% efficient pump and an 88% efficient motor (Dorn, UNL Extension, 2007) [7]. Water work is acre-inches pumped times total head in feet, divided by 8.75. Total head is pumping lift plus discharge pressure times 2.31 feet per psi [7][8].
Evidence: Our reference well lifts from 150 feet and discharges at 40 psi, for 242 feet of total head. That takes 27.7 whp-h per acre-inch. These are Crop Root Zone assumptions, chosen to sit close to the extension examples. Nebraska's worked example uses 140 feet and 40 psi on 125 acres [9]. Kansas's uses 150 feet and 45 psi on 130 acres [8]. The pivot covers 125 acres. The season is 11 inches, or 1,375 acre-inches. An 800 gpm well runs about 778 hours to deliver it.
The criteria describe a good plant, not a typical one. In Nebraska's most recent statewide study of 130 farmer-owned plants, the average plant produced 77% of the work the criteria call for. Only about 15% met or beat them, so the average plant burns about 30% more fuel than it should (Dorn, CropWatch, Jun 19, 2009) [10]. We price every fuel at both levels.
| Fuel | NPPPC, whp-h per unit | Units per acre-inch at 100% | Units per acre-inch at 77% | Price used | $/acre-inch at 77% |
|---|---|---|---|---|---|
| Diesel (gal) | 12.5 | 2.22 | 2.88 | $5.76, Illinois ag diesel, Oct 16 | 16.58 |
| Propane (gal) | 6.89 | 4.02 | 5.22 | $1.783, Nebraska residential, Oct 19 | 9.31 |
| Natural gas (Mcf) | 61.7 | 0.449 | 0.583 | $4.99, Nebraska industrial, Jul 2026 | 2.91 |
| Electricity (kWh) | 0.885 | 31.3 | 40.7 | Tariff-dependent, Section 2 | 3.37–10.45 |
Source: NPPPC values from Dorn, UNL Extension, 2007 [7] and Rogers & Alam, K-State MF-2360, Aug 2006 [8]. Prices: USDA AMS Illinois agricultural diesel via farmdoc daily, Oct 20, 2026 [1]; EIA Heating Oil and Propane Update, week of Oct 19, 2026, excluding taxes [3]; EIA Nebraska industrial natural gas price, released Sep 30, 2026 [5]. Fuel use and $/acre-inch are Crop Root Zone calculations for 242 ft of total head.
Three caveats on the prices. First, Illinois is a proxy. AMS's Iowa survey, the closest Plains-side farm diesel print we found, was $5.50 on September 18 [4]. At $5.50 the diesel figure is $15.83. Second, residential propane overstates what a bulk irrigation buyer pays. Iowa's farm propane was $1.48 on September 18 [4], which would make propane $7.73 an acre-inch. Nebraska's wholesale price was $1.159 on October 19 [3]. Third, EIA's industrial gas price is the nearest public series to an irrigation gas account. A local distribution contract can carry customer and delivery charges that it does not capture. Kansas's July industrial price was $5.16 [6], close to Nebraska's.
K-State's comparison table turns these into a diesel-equivalent price. One gallon of diesel does the work of 1.81 gallons of propane, 14.12 kWh, or 0.203 Mcf of gas [8]. At this month's prices, propane is the same as diesel at $3.23 a gallon and natural gas the same as diesel at $1.01. Diesel itself is at $5.76.
2. Electric is a two-part bill, and the horsepower charge is half of it
What's new: Electricity is the only fuel whose price depends on the size of the motor. Nebraska public power districts and Kansas co-ops charge a fixed annual fee per horsepower or per kilowatt, then an energy rate. They discount both if the utility can switch the pump off at peak.
Evidence: We priced the reference well's 75 hp motor, which needs about 65 brake horsepower at a 75% efficient pump, on six schedules in force for 2026.
| Utility, schedule | Fixed charge | Energy charge | Load control | Season cost | $/acre-inch | |
|---|---|---|---|---|---|---|
| Southern PPD (NE), Anytime Plus Sunday | $26.25/hp | 5.71¢ first 400 kWh/hp; 3.69¢ above | Up to 12 hr/day Mon–Sat, 6 hr Sun, 72 hr/week | $4,637 | 3.37 | ██░░░░░░░░ |
| NPPD (NE), Anytime Control | $41.50/kW | 6.32¢ | Any weekday, up to 5 consecutive hr, 10 am–10 pm | $6,029 | 4.39 | ███░░░░░░░ |
| Southern PPD (NE), Two Day Plus Sunday | $43.00/hp | 7.35¢ first 400 kWh/hp; 5.33¢ above | As above, on assigned days | $6,810 | 4.95 | ███░░░░░░░ |
| Victory Electric (KS), Irrigation I-17 | $30/hp (min $250) | 12.64¢ first 600 kWh/hp; 10.64¢ above | None | $9,097 | 6.62 | ████░░░░░░ |
| NPPD (NE), No Control | $52.50/kW | 10.88¢ | None | $9,240 | 6.72 | ████░░░░░░ |
| Loup River PPD (NE), Loup Irrigation Service | $90/hp | 15.50¢ first 50 kWh/hp; 13.50¢ above | None; year-round service | $14,371 | 10.45 | ██████░░░░ |
Basis: 75 hp nameplate motor; NPPD kW estimated at 60.2 kW (75 hp at 93% motor efficiency); 55,900 kWh for 1,375 acre-inches at 77% of NPPPC. Production- and energy-cost adjustment riders are excluded. Bars scale to the diesel season ($22,795 = ten blocks). Source: Southern PPD schedules IRR-A and IRR-2, issued Jan 1, 2026 [11][12]; NPPD rates as summarized by UNL Center for Agricultural Profitability, updated Apr 2, 2026 (only the No Control rate is labeled 2026 there; the others carry no year) [13]; Loup River PPD Rate Schedule LIS, effective Jan 16, 2026 [14]; Victory Electric Cooperative Schedule I-17, effective Apr 1, 2017 and posted as current [15]. Season costs are Crop Root Zone calculations.
The fixed charge is 41% to 47% of the season bill on the controlled and Loup schedules. That has two effects. In a wet year, electric's cost per acre-inch rises because the horsepower charge is spread over less water. On Southern's anytime schedule it goes from $3.37 at 11 inches to $6.26 at 4 inches. Diesel stays at $16.58 an inch however much is pumped. Even so, electric is cheaper than $5.76 diesel above roughly 1.1 inches a season on that schedule. Second, on a horsepower-billed schedule an oversized motor costs money every year whether it runs or not. Southern bills from the demand meter after the first season [11]. Loup and Victory bill from the nameplate [14][15].
Control is what buys the discount, and the rules differ. Southern PPD can interrupt for up to 12 hours a day, Monday through Saturday, six on Sunday, and 72 hours a week at most [11]. NPPD's anytime program can cut a pump for up to five consecutive hours on any weekday. Over 2017–2025 NPPD announced 128 control events and actually controlled 66, an average of 18.3 a season [13].
Ground Truth: The cheapest electric rate is cheap only if the well can afford to be shut off. Our reference well puts out 6.4 gpm an acre. Running around the clock it can apply about 2.4 gross inches a week. On Southern's anytime schedule the worst-case 72 hours of control cuts that to about 1.4 inches. That is below peak corn use in a hot July week, using the common agronomic rule of thumb of about 0.3 inch a day. NPPD's five-hour cap takes far less, and NPPD's own history shows that only about half of announced control days end in actual control. So the rate choice is a well-capacity decision, not a price decision. Anytime control saves $2,200 to $3,200 a year over the same utility's two-day or no-control service on this well. On a well near 6 to 7 gpm an acre, a schedule that can take 72 hours a week puts that saving at risk in one week of heat. A five-hour-cap schedule does not. Work out the well's weekly gross inches under the worst-case control hours before you sign the interruptible agreement.
3. The season bill: diesel is now the most expensive way to lift water by a wide margin
What's new: At October's diesel price, the same 1,375 acre-inches cost about $22,800 on diesel. That is $182 an acre, against $37 to $74 an acre on five of the six electric schedules and $32 on natural gas.
Evidence:
| Fuel or tariff (77% of NPPPC) | Season cost, 125 acres, 11 in. | $/acre | |
|---|---|---|---|
| Diesel at $5.76 | 22,795 | 182 | ██████████ |
| Electric, Loup River LIS | 14,371 | 115 | ██████░░░░ |
| Propane at $1.783 | 12,802 | 102 | ██████░░░░ |
| Diesel at $2.84 (2009–2025 average) | 11,239 | 90 | █████░░░░░ |
| Electric, NPPD No Control | 9,240 | 74 | ████░░░░░░ |
| Electric, Victory Electric KS | 9,097 | 73 | ████░░░░░░ |
| Electric, Southern PPD Two Day | 6,810 | 54 | ███░░░░░░░ |
| Electric, NPPD Anytime Control | 6,029 | 48 | ███░░░░░░░ |
| Electric, Southern PPD Anytime | 4,637 | 37 | ██░░░░░░░░ |
| Natural gas at $4.99/Mcf | 4,001 | 32 | ██░░░░░░░░ |
Source: Crop Root Zone calculations on NPPPC [7][8]; fuel prices as in Section 1 [1][3][5]; 2009–2025 average ag diesel price from farmdoc daily, Oct 20, 2026 [1]; tariffs as in Section 2 [11]–[15]. Diesel excludes engine oil and maintenance; electric excludes PCA/ECA riders.
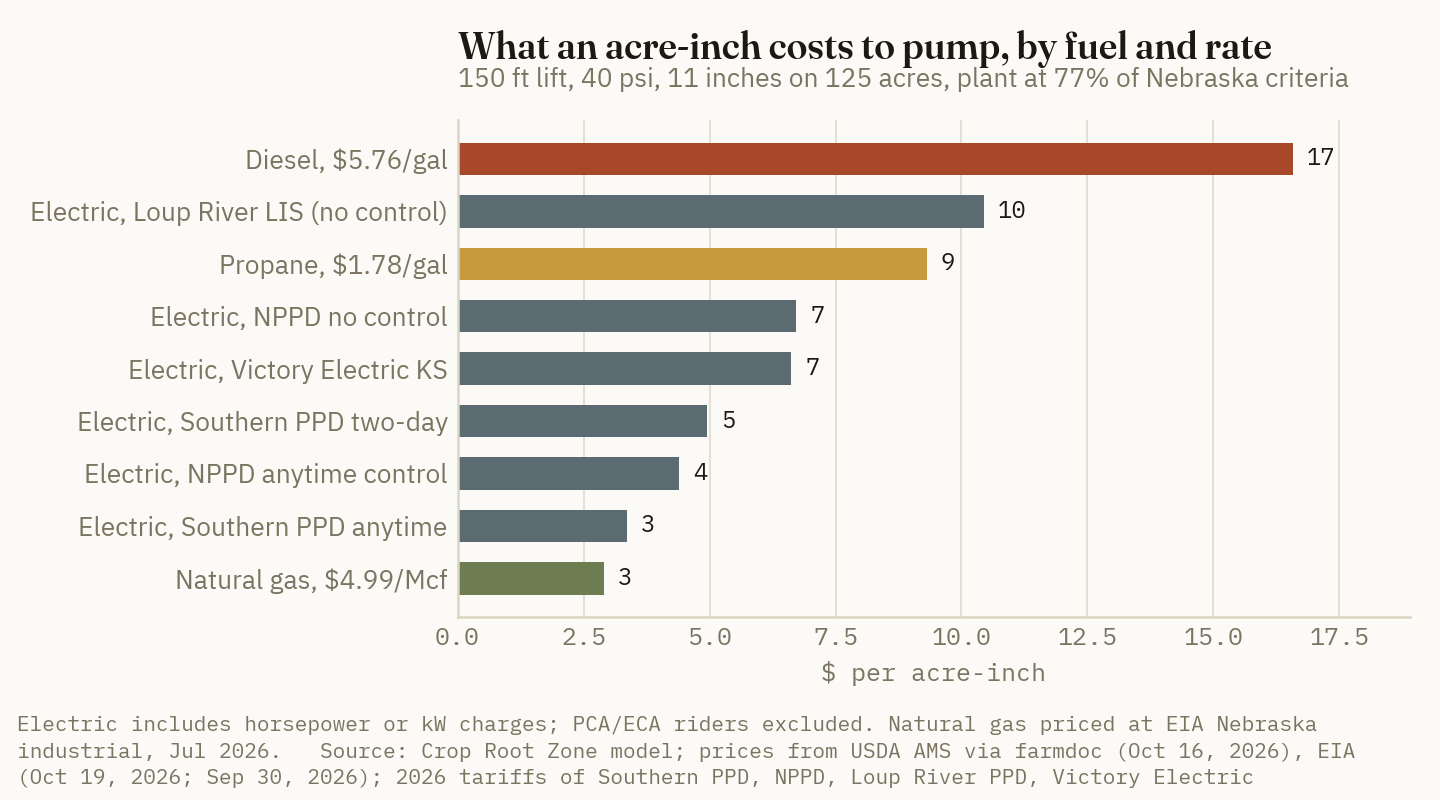
$16.58
Cost to pump one acre-inch from 150 feet at 40 psi with diesel at $5.76, at the 77% efficiency of the average Nebraska pumping plant. That is about five times controlled electric. (Crop Root Zone model on USDA AMS via farmdoc daily, Oct 20, 2026, and NPPPC)
What changed in 2026 is diesel. The electric schedules in our table are fixed for the year, apart from cost-adjustment riders. At the $2.84 average farm diesel price for 2009 to 2025 [1], the diesel season would have cost $11,239, still 1.9 to 2.4 times as much as controlled electric. At the Midwest pump, on-highway diesel was $6.352 on October 19, against $3.606 in the same week of 2025 (EIA, Oct 19, 2026) [2]. Farmdoc projects the 2026 average for agricultural diesel at $4.30 if current levels hold [1]. At that price this season costs $17,016.
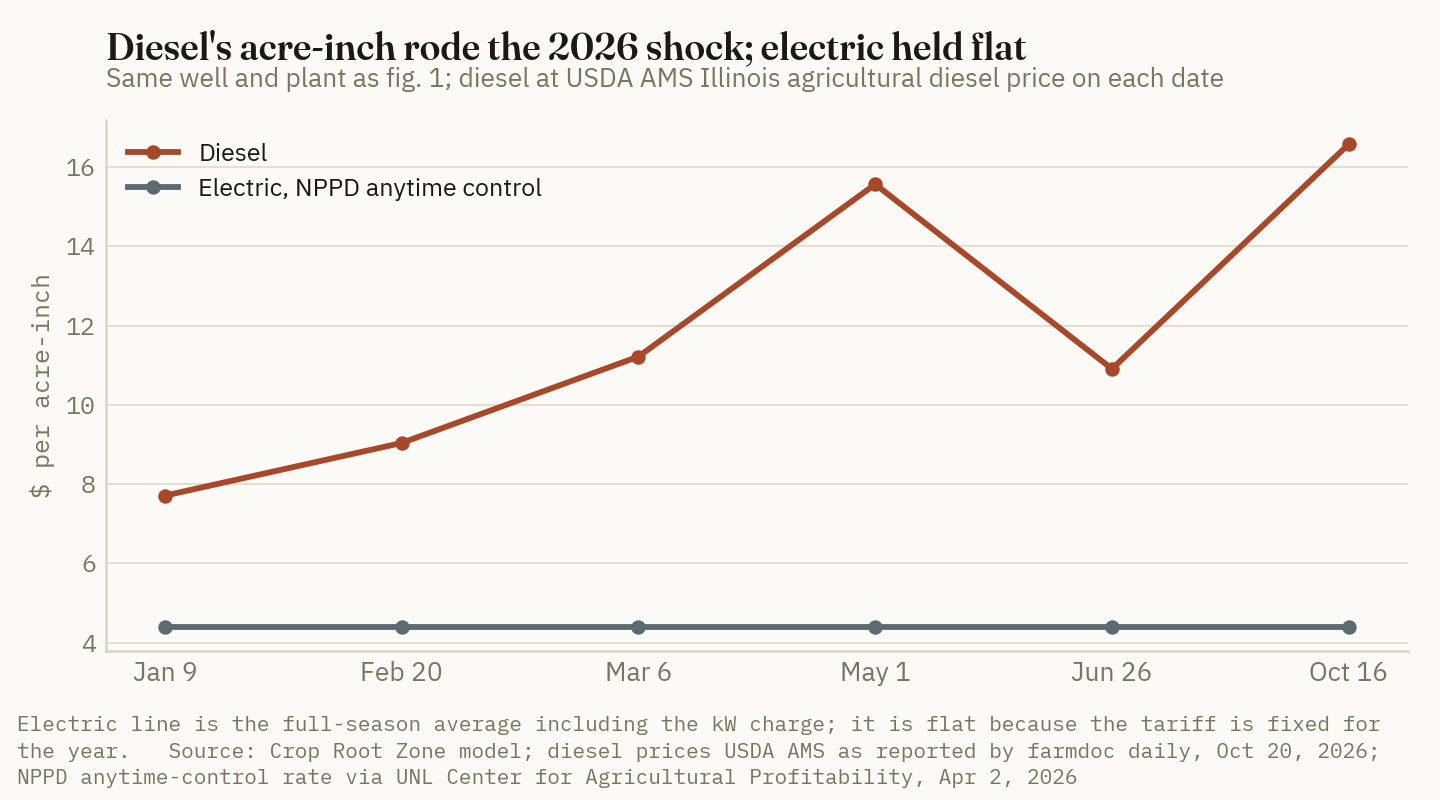
Propane is the fuel growers are now asking about. RFD-TV reported on October 14 that the Propane Education and Research Council is hearing more interest in propane irrigation engines because of diesel prices. Some farmers quoted propane near $1 a gallon [16]. That price is a grower's anecdote, not a market print. At Iowa's $1.48 farm price, propane costs $7.73 an acre-inch, less than half of diesel. That gap is big enough to make a propane engine swap a live question on wells with no gas line and no nearby three-phase. We did not find a public 2026 price for a propane irrigation engine, so we do not estimate its payback.
4. Converting a diesel well to electric: the line decides it, and the diesel average decides the payback
What's new: The extension method has not changed since K-State published it. Compare the annual energy saving with the annualized extra capital. In K-State's 2006 example, electric saved $4,218 a year. The extra $8,500 investment, with $25,000 of it to bring in three-phase power, cost $2,242 a year over five years at 10% (Rogers & Alam, K-State MF-2360, Aug 2006) [8]. Both sides of that sum are larger now.
Evidence: We priced the capital from public figures where they exist and labeled the rest as estimates. Published co-op rules put three-phase line at $9.00 to $16.71 a foot [18]. One 75 hp vertical hollow-shaft motor lists at $5,629 (MROSupply, accessed Oct 26, 2026) [17]. We carry up to $15,700 for premium-efficiency units and dealer pricing. That is an estimate: a second distributor's listing that would have confirmed it returned an access block, and we did not get around it. Panel, starter, wiring and installation are a further $5,000 to $10,000 on our estimate. Savings are against the NPPD anytime schedule. The low payback in each range pairs the low capital with Southern's anytime rate. The high pairs the high capital with NPPD no-control.
| Distance to three-phase | Capital (low–high) | Payback at $5.76 diesel | at $4.30 (2026 avg. projection) | at $2.84 (2009–2025 avg.) |
|---|---|---|---|---|
| 0.25 mile | $22,500–$47,800 | 2.1 yr (1.2–3.5) | 3.2 yr (1.8–6.1) | 6.7 yr (3.4–23.9) |
| 0.5 mile | $34,400–$69,900 | 3.1 yr (1.9–5.2) | 4.7 yr (2.8–9.0) | 10.0 yr (5.2–35.0) |
| 1 mile | $58,100–$114,000 | 5.1 yr (3.2–8.4) | 7.8 yr (4.7–14.7) | 16.5 yr (8.8–57.0) |
Basis: simple payback on midpoint capital; annual saving is diesel season cost at 77% of NPPPC less the NPPD Anytime Control season cost ($6,029). Source: line cost per foot from Crop Root Zone TRZ-0300, Oct 21, 2026 [18]; motor list price MROSupply, accessed Oct 26, 2026 [17]; diesel prices farmdoc daily, Oct 20, 2026 [1]; tariffs [11]–[15]. Upper motor price and installation are Crop Root Zone estimates. Engine oil, overhauls and the diesel unit's resale value are not credited, so the figures lean against electric.
Two utility details push the estimate one way or the other. Victory Electric requires a variable-frequency drive on motors over 25 hp unless it approves otherwise [15]. For a 75 hp motor that is real money, and it belongs at the top of the capital range. Line cost is also site-specific. Short runs carry the fixed cost of transformers and service, so a 200-foot job can work out to about four times the per-foot rate of a long one [18]. The per-foot range is a planning number, not a bid. Convert the payback to a break-even diesel price and the picture is plain. To pay back in five years at midpoint capital, conversion needs diesel to average about $3.30 at a quarter mile, $4.16 at a half mile and $5.87 at a mile.
Ground Truth: October's $5.76 makes every conversion look like a two-to-five-year payback, and that is the wrong number to finance on. Diesel was $2.68 in January and $3.79 in June. What pays back a $50,000 line is the average over the next decade. Our read is that conversion within half a mile of three-phase is sound even at farmdoc's $4.30 projection for 2026. At a mile it only works if you believe 2026 prices are the new floor. Get the co-op's written estimate this winter while crews are free. Commit at a half mile or less. At a mile, wait for a second season of prices, or share the line with a neighbor's well. Nodak-style refund clauses [18] make the second hookup pay part of the first.
5. The pumping-plant test is worth ten times more on a diesel well
What's new: The cheapest fix is the one most growers skip. Nebraska's testing found that 58% of plants could benefit from adjustment, and field adjustments alone cut energy cost by 14% on average from the first test results [10]. The method needs only records a grower already keeps: a water-meter total, pumping lift, pressure at the discharge head, and fuel used. The steps are to compute water work, divide by fuel used, and compare with the criteria [7].
Evidence: A 14% saving is the same share on every fuel. In dollars it is not.
| Reference well, 11-inch season | Season energy cost | Value of 14% saving per year | Repair budget at 3-yr payback |
|---|---|---|---|
| Diesel at $5.76 | $22,795 | $3,191 | $9,600 |
| Diesel at $4.30 | $17,016 | $2,382 | $7,100 |
| Propane at $1.783 | $12,802 | $1,792 | $5,400 |
| Electric, NPPD No Control | $9,240 | $851 | $2,600 |
| Natural gas at $4.99 | $4,001 | $560 | $1,700 |
| Electric, NPPD Anytime Control | $6,029 | $495 | $1,500 |
| Electric, Southern PPD Anytime | $4,637 | $289 | $870 |
Source: average savings from adjustment, Dorn, CropWatch, Jun 19, 2009 [10]; costs from Sections 1–3. Electric savings apply only to kWh at the marginal energy rate. A lower measured demand could also cut the horsepower charge on Southern's demand-metered schedules [11], which is not counted. Repair budgets are Crop Root Zone calculations, rounded.
We found no published 2026 price for a pumping-plant test in Nebraska or Kansas, so we do not quote one. Ask the irrigation dealer or the local natural resources district for one. Whatever the price, the table shows where the test pays. Tom Dorn's worked example is a diesel pivot at 140 feet and 40 psi running at 84% of the criteria. It wasted 571 gallons in a season. At 2007's $2.20 diesel that was $1,256 [7]. The same 571 gallons cost $3,289 at October's price. The test hasn't changed. The fuel has.
Ground Truth: Put the diesel wells first in the winter test queue and the controlled-electric wells last. On a diesel well at this fall's price, a test that finds even an average problem justifies a bowl rebuild or impeller adjustment of up to about $9,600 on a three-year payback. On an anytime-control electric well the same finding justifies about $870, which may not cover the pump puller's trip. A grower deciding between testing a diesel well and converting it should test first: a well running at 77% of criteria wastes about 23% of its energy on any fuel, so the conversion math should start from the repaired plant's numbers.
References
- Schnitkey, G., N. Paulson, J. Baltz, C. Zulauf and B. Zwilling, "Diesel Fuel Price Impact on Fuel, Oil and Per-Acre Machinery Costs," farmdoc daily (16):190, University of Illinois, Oct 20, 2026 (USDA AMS Illinois agricultural diesel price series). https://farmdocdaily.illinois.edu/2026/10/diesel-fuel-price-impact-on-fuel-oil-and-per-acre-machinery-costs.html
- U.S. Energy Information Administration, Gasoline and Diesel Fuel Update and Midwest (PADD 2) No. 2 diesel retail price weekly series, week of Oct 19, 2026. https://www.eia.gov/petroleum/gasdiesel/ ; https://www.eia.gov/dnav/pet/hist/LeafHandler.ashx?n=PET&s=EMD_EPD2D_PTE_R20_DPG&f=W
- U.S. Energy Information Administration, Heating Oil and Propane Update, residential and wholesale propane prices, week of Oct 19, 2026. https://www.eia.gov/petroleum/heatingoilpropane/
- USDA AMS Livestock, Poultry and Grain Market News, Iowa Production Cost Report (Bi-Weekly), week ending Sep 18, 2026. https://mymarketnews.ams.usda.gov/viewReport/2863
- U.S. Energy Information Administration, Nebraska Natural Gas Industrial Price (monthly), released Sep 30, 2026. https://www.eia.gov/dnav/ng/hist/n3035ne3m.htm
- U.S. Energy Information Administration, Kansas Natural Gas Industrial Price (monthly), released Sep 30, 2026. https://www.eia.gov/dnav/ng/hist/n3035ks3m.htm
- Dorn, T.W., "Using Your Records to Locate Inefficient Pumping Plants," University of Nebraska–Lincoln Extension in Lancaster County, Central Plains Irrigation Conference proceedings, 2007. https://www.k-state.edu/irrigate/oow/p07/Dorn07.pdf (retrieved from the mirror at mail.irrigationtoolbox.com, as the K-State address now redirects)
- Rogers, D.H. and M. Alam, Comparing Irrigation Energy Costs, MF-2360 rev., Kansas State University Research and Extension, Aug 2006. https://bookstore.ksre.ksu.edu/download/comparing-irrigation-energy-costs_MF2360
- Kranz, B., D. Martin, C.D. Yonts, S. Irmak, S. van Donk and T. Dorn, "Comparing Fuel Sources for Irrigation," CropWatch, University of Nebraska–Lincoln, Apr 20, 2007. https://cropwatch.unl.edu/comparing-fuel-sources-irrigation
- Dorn, T., "Is Your Pumping Plant Doing All It Can?," CropWatch, University of Nebraska–Lincoln, Jun 19, 2009. https://cropwatch.unl.edu/your-pumping-plant-doing-all-it-can
- Southern Public Power District, Retail Rate Schedule IRR-A, Irrigation Service – Anytime Plus Sunday, issued Jan 1, 2026. https://southernpd.com/wp-content/uploads/IRR-A-IRRIGATION-SERVICE-ANYTIME-PLUS-SUNDAY-2.pdf
- Southern Public Power District, Retail Rate Schedule IRR-2, Irrigation Service – Two Day Plus Sunday, issued Jan 1, 2026. https://southernpd.com/wp-content/uploads/IRR-2-IRRIGATION-SERVICE-TWO-DAY-PLUS-SUNDAY-2.pdf
- Stockton, M., "Four Nebraska Public Power District (NPPD) Irrigation Electricity Purchase Options," UNL Center for Agricultural Profitability, first published Aug 13, 2025, updated Apr 2, 2026. https://cap.unl.edu/news/four-nebraska-public-power-district-nppd-irrigation-electricity-purchase-options
- Loup River Public Power District, Rate Schedule LIS, Loup Irrigation Service, approved Dec 23, 2025, effective with bills rendered on and after Jan 16, 2026. https://loup.com/wp-content/uploads/LIS_26.pdf
- The Victory Electric Cooperative Assn., Inc., Schedule I-17, Irrigation Service, effective Apr 1, 2017 (posted 2025). https://victoryelectric.net/sites/default/files/2025-04/irrigation.pdf
- RFD-TV, "High Diesel Prices Push Farmers to Explore Propane Alternatives," Oct 14, 2026. https://www.rfdtv.com/high-diesel-prices-push-farmers-to-explore-propane-alternatives
- MROSupply, Teco-Westinghouse VH0754 75 hp 1800 rpm 230/460 V vertical hollow-shaft motor, product listing, accessed Oct 26, 2026. https://www.mrosupply.com/products/5051291/
- Crop Root Zone, TRZ-0300, "Co-op Three-Phase Lines Run $9 to $17 a Foot. A 50 HP Fan's Converter Costs $13,000 to $21,000 Over 15 Years, So the Line Loses Past About Half a Mile.," Oct 21, 2026.
- Crop Root Zone, TRZ-0059, "The July Diesel Spike Added $21 an Acre to a Rice Flood — and Nobody Sent a Bill," Jul 31, 2026.
- Crop Root Zone, TRZ-0070, "The $5 Diesel Column Was the Stress Test. On August 4 It Became the Base Case.," Aug 5, 2026.
- Crop Root Zone, TRZ-0004, "What a Drip-Line Retrofit Actually Costs — and When It Pays," Jul 18, 2026.
Disclosures
Crop Root Zone is an independent publication. Nothing here is investment advice. Market calls, where included, reflect the editors' own read and are not a recommendation to buy or sell any security.
DEF Ran 1.7% to 8.5% of Diesel Burn in Nebraska Tests, or $0.68 to $18 an Engine Hour. Where a Farm Buys It Moves That Bill More Than Urea Does: A $100-a-Ton Urea Move Adds About 15 Cents a Gallon.
Bulk co-op DEF was posted at $1.99 a gallon this fall, truck-stop pumps at $4.60 to $4.90, and 2.5-gallon jugs at $3.60 to $7.60. OECD tests run in Nebraska show SCR-only engines burning about 8.5 gallons of DEF per 100 of diesel, against 1.7 to 5.8 for the tested Deere tractors. On a corn-soybean rotation that is $0.12 to $1.89 an acre. A heated bulk station pays only above about 725 to 1,215 gallons a year, and for most farms shelf life, not price, decides how big the tank should be.
Farm diesel averaged $5.49 a gallon in Iowa and $5.76 in Illinois in the week ending October 16 (USDA AMS, Oct 16, 2026) [1][2]. The Illinois figure is the highest in the series [23]. DEF gets less attention than the diesel it travels with. Yet every Tier 4 Final tractor, combine and truck with selective catalytic reduction (SCR) burns it, and it is made from the same molecule that goes on the corn ground. Retail urea was $674 a ton in the second week of October, 13% above a year ago (DTN, Oct 21, 2026) [13]. This piece prices DEF on the farm this fall. Section 1 sets out what it costs in each package. Section 2 measures how much urea's price passes into DEF. Section 3 uses tractor test data to show how much DEF an engine burns. Section 4 prices DEF per engine hour and per acre. Section 5 asks when a bulk tank pays and what storage requires.
1. A $2 product in bulk, a $4 to $8 product in a jug
What's new: DEF sells at very different prices depending on the package. Meadowland Farmers Coop in Lamberton, Minnesota, posts bulk DEF at $1.99 a gallon cash. Its dyed farm diesel is $5.67 to $5.70 (Meadowland Farmers Coop, accessed Oct 23, 2026) [3]. Central Ohio Farmers Co-op lists DEF at $2.599, without a unit or date, beside off-highway diesel at $5.659 (accessed Oct 23, 2026) [4]. At Pilot Flying J truck stops, posted DEF prices across the first 25 of 876 listed locations ran from $3.049 to $4.899. The most common prices were $4.599 and $4.899. The Altoona, Iowa location posted $4.799 (Pilot Flying J, accessed Oct 23, 2026) [5].
Evidence: Package prices from public listings, converted to dollars per gallon:
| Channel | Listed price | $/gal | Basis | |
|---|---|---|---|---|
| Bulk, co-op cash | $1.99/gal | 1.99 | Posted, Lamberton, Minn. [3] | ███░░░░░░░ |
| Bulk, co-op | $2.599 | 2.60 | Posted, central Ohio; unit and date not stated [4] | ███░░░░░░░ |
| 330-gal tote, delivered | $1,040 to $1,095 | 3.15 to 3.32* | Online listing, search-indexed, undated [7] | ████░░░░░░ |
| 2.5-gal jug, store brand | $8.99 to $9.99 | 3.60 to 4.00 | Farm-store listing, search-indexed [6] | █████░░░░░ |
| Truck-stop pump | $4.599 to $4.899 | 4.60 to 4.90 | Most common posted prices [5] | ██████░░░░ |
| 2.5-gal jug, premium | $15.99 to $18.99 | 6.40 to 7.60 | Farm-store listing, search-indexed [6] | ██████████ |
Source: Meadowland Farmers Coop and Central Ohio Farmers Co-op price pages, Pilot Flying J fuel-price page, all accessed Oct 23, 2026 [3][4][5]; Tractor Supply and Walmart listing text as indexed by search, accessed Oct 23, 2026 [6][7]. *The tote figure is a single online listing whose page returned a bot check to our fetch. We read the price from search-indexed text. It is undated and includes the tote. Bars scale $/gal; premium jug = 10.
The two co-op prices are posted cash prices, not survey averages. The farm-store and online prices come from listing text indexed by search, because the retailers' pages did not load to our fetch. We found no public, dated index of farm DEF prices. The weekly retail DEF surveys that do exist are sold by subscription. Treat each row as a real quote at one point of sale.
A 2013 Cummins bulletin said DEF "typically costs a third less than diesel" [20]. In bulk this fall it costs about 64% less than farm diesel. In a premium jug it costs about 40% more.
2. How much of urea's price reaches DEF
What's new: The urea in a gallon of DEF is worth about 65 cents at today's Gulf price. CBOT Urea (US Gulf) futures for October 2026 stood at $436.75 a short ton on October 22 (Farmbucks, Oct 22, 2026) [11]. Trading Economics' urea benchmark was $442.50, up 17% from a year earlier. It had traded above $700 in March and April, during the Strait of Hormuz disruption (Trading Economics, Oct 22, 2026) [12].
Evidence: DEF is 32.5% urea and 67.5% deionized water by mass, at a typical density of 1,089.7 kg per cubic meter (Valvoline, product sheet) [21]. That is about 9.09 pounds per gallon, including 2.96 pounds of urea. One short ton of urea makes about 680 gallons of DEF. A $100-a-ton change in urea therefore changes the urea cost in a gallon by 14.8 cents. A $100-a-metric-ton change moves it by 13.4 cents (Crop Root Zone calculation).
15 cents a gallon
What a $100-a-short-ton move in urea does to the urea cost of a gallon of DEF. The spread between bulk co-op DEF and a premium jug is $5.61 a gallon, about 38 times as large. (Crop Root Zone calculation from Valvoline DEF specification, Pilot Flying J and co-op posted prices, Oct 23, 2026)
The record shows how the cost passes through:
| Episode | Urea move | Implied change in urea cost, ¢/gal | Observed DEF move | Pass-through |
|---|---|---|---|---|
| 2021, US Gulf urea, Jan to Dec | about +$469/mt (about $300 to $769.50) | +63 | Argus Dallas bulk: 60.5¢ to $1.59, +98.5¢ | ~156%* |
| Feb 27 to Mar 13, 2026, Egypt FOB urea | +$230/mt ($482.50 to $712.50) | +31 | US bulk: +15 to 20¢ in early April | ~50 to 65%* |
| Same 2026 shock, retail | as above | +31 | Pilot pump held at $4.299 to $4.599 through mid-March, with no move above 10¢ | ~0% in first weeks |
Source: FreightWaves, Dec 7, 2021 [9]; FreightWaves, Mar 20, 2026 [8]; Mansfield Energy, citing Argus, Apr 16, 2026 [10]. *Crop Root Zone calculation. Pass-through is the observed DEF change divided by the change in urea cost per gallon. The 2021 urea start point is "just over $300/mt" as reported.
The two episodes point the same way. Bulk DEF follows urea with a lag, and in a large, sustained rally it can move by more than the urea it contains. In 2021 it did. Argus's Suzie Skipper explained the lag in March. US DEF pricing starts from urea liquor, sold at a premium to the New Orleans urea price. That premium is usually negotiated once a year, and contract DEF prices generally reset monthly [8]. Pump and jug prices lag further. Pilot's posted DEF was $4.299 to $4.599 in March [8]. The most common posted prices are now $4.599 and $4.899 [5], about 30 cents higher on a urea cost that has since fallen back to the mid-$400s per ton [11][12].
The urea in a gallon is worth about 65 cents at the Gulf futures price. At DTN's $674 retail urea price it would be worth about a dollar [13]. On the co-op's $1.99 bulk price, that leaves about $1.35 for automotive-grade purification, deionized water, handling, freight and margin. At a $4.80 pump it leaves about $4.15. Most of what a farm pays for packaged DEF is the package.
Ground Truth: Fertilizer buyers watch the urea market as a matter of course, but the urea market barely touches what a farm pays for DEF. A $100 swing in Gulf urea changes DEF by about 15 cents a gallon over a month or two. Moving from jugs to bulk saves $2 to $5.60 a gallon at once. Do not time DEF purchases off the urea market. Choose the channel first. Then, if a bulk contract is open in a quiet urea month, as now with Gulf futures holding between $437 and $458 a ton through March 2027 [11], fill the tank to a level it can use within its shelf life.
3. How much DEF an engine burns
What's new: OECD tractor test reports for tests run at the Nebraska Tractor Test Laboratory now record DEF consumption beside diesel. The one-hour maximum-power PTO test is run the same way on every tractor, so it allows a clean comparison across engine designs.
Evidence:
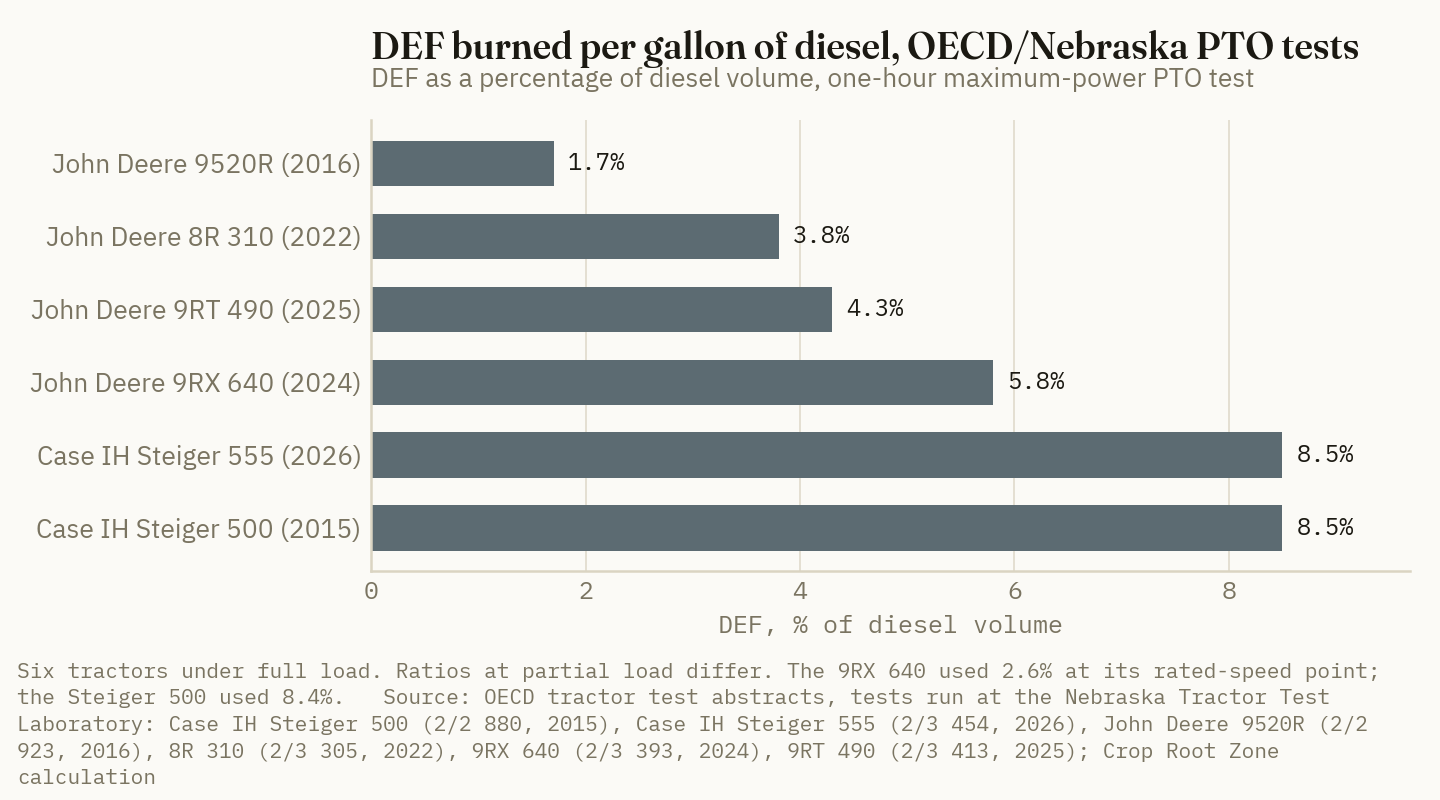
| Tractor (OECD approval) | Max PTO power, kW | Diesel, gal/hr | DEF, gal/hr | DEF, % of diesel |
|---|---|---|---|---|
| John Deere 9520R (2/2 923, 2016) | 273.9 | 19.84 | 0.34 | 1.7 |
| John Deere 8R 310 (2/3 305, 2022) | 237.4 | 15.51 | 0.59 | 3.8 |
| John Deere 9RT 490 (2/3 413, 2025) | 268.7 | 19.69 | 0.84 | 4.3 |
| John Deere 9RX 640, 15.0 L (2/3 393, 2024) | 268.9 | 19.93 | 1.15 | 5.8 |
| Case IH Steiger 500 (2/2 880, 2015) | 378.2 | 27.22 | 2.32 | 8.5 |
| Case IH Steiger 555 (2/3 454, 2026) | 401.4 | 28.31 | 2.40 | 8.5 |
Source: OECD abstracts of tractor performance tests conducted at NTTL (USA) [14][15][16][17][18][19]; liters per hour converted at 3.785 L/gal by Crop Root Zone. One-hour test at maximum PTO power.
The spread follows engine design. In the two Steiger abstracts DEF holds at about 8.4% to 8.5% of diesel at every PTO test point. In the Steiger 500, for example, it was 8.5% at maximum power and 8.4% at rated speed [14]. That steady ratio is what an engine that relies on SCR alone for NOx control would show. The Deere ratios are lower and change with load. The 9RX 640 burned 5.8% at maximum power but 2.6% at its rated-speed point [18]. That is consistent with exhaust gas recirculation doing part of the NOx work. Manufacturer guidance brackets the same range. Cummins told Tier 4 Final users to expect DEF use of 3% to 5% of fuel [20], and Valvoline's DEF sheet says about 2% to 3% [21].
These are full-load numbers. In the field, average load is lower, and for EGR-equipped engines the DEF ratio falls with it. NTTL and OECD do not test combines. For per-acre costs we therefore use 4% for EGR-plus-SCR engines and 8.5% for SCR-only engines, and we label both as estimates.
4. DEF per engine hour and per acre
What's new: We priced an hour at full load for each tested tractor, using Iowa's $5.49 farm diesel [1] and five DEF channels from Section 1.
Evidence:
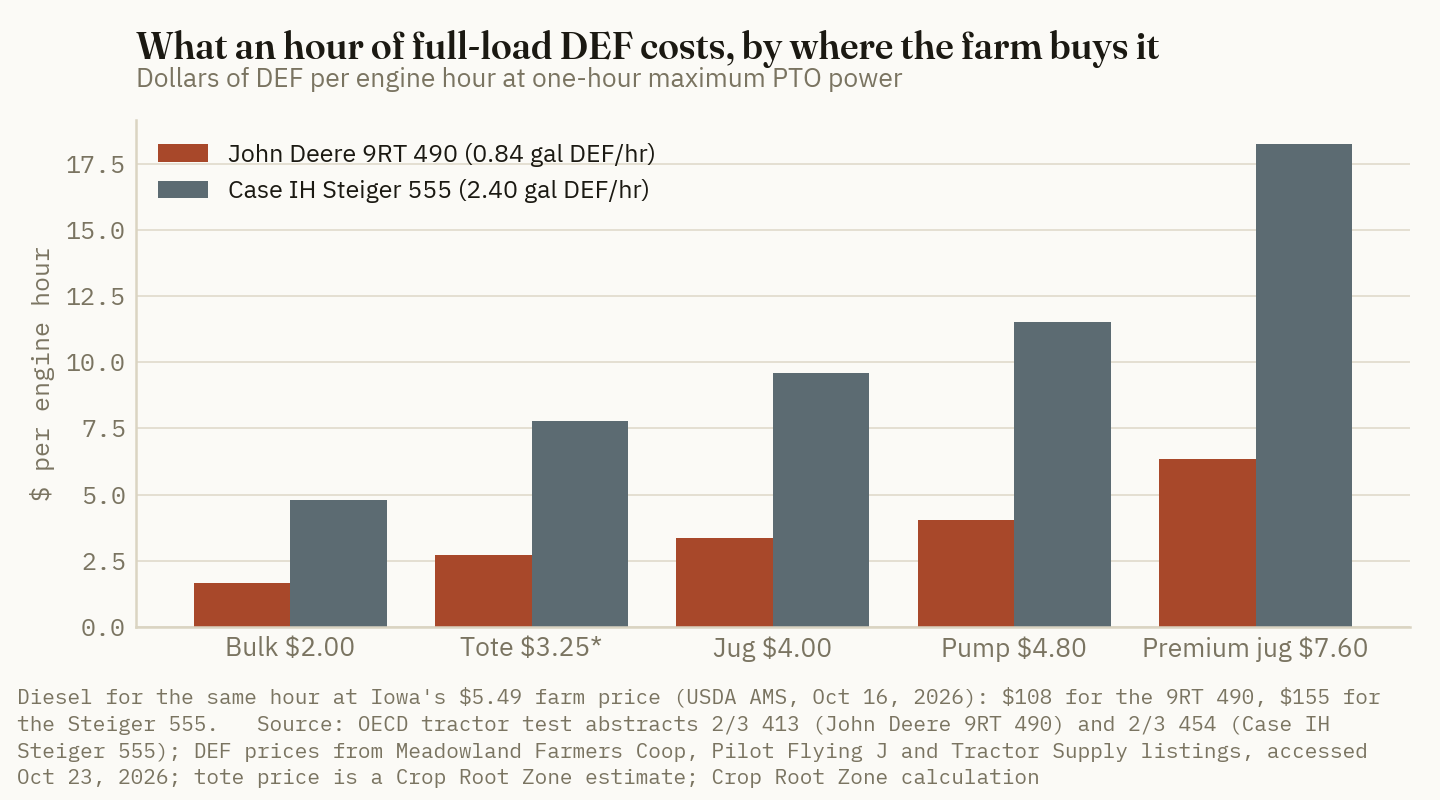
DEF's share of the combined diesel and DEF bill for an hour runs from 0.6% (9520R, bulk DEF) to 10.5% (Steiger 555, premium jugs). For the Steiger 555 at full load, diesel costs $155.43 an hour. DEF costs $4.80 in bulk and $18.25 from premium jugs. The $13.45 difference is almost 9% of the diesel cost for the same hour.
Per acre, we combine field-operation fuel rates with the two DEF ratios. The chisel and combine rates are from farmdoc daily's October 20 machinery-cost update [23]. The other operations are moderate-draft-soil averages from Purdue's NCR-202 table [24]. That table predates Tier 4 machines, so treat those rows as estimates.
| Operation | Diesel, gal/ac | Diesel, $/ac at $5.49 | DEF gal/ac at 4%* | DEF gal/ac at 8.5%* | DEF $/ac, 8.5%, bulk $2.00* | DEF $/ac, 8.5%, jug $4.00* |
|---|---|---|---|---|---|---|
| Chisel plow | 0.70 | 3.84 | 0.028 | 0.060 | 0.12 | 0.24 |
| Field cultivate | 0.60 | 3.29 | 0.024 | 0.051 | 0.10 | 0.20 |
| Apply NH3, no-till ground | 1.05 | 5.76 | 0.042 | 0.089 | 0.18 | 0.36 |
| Plant | 0.50 | 2.75 | 0.020 | 0.043 | 0.09 | 0.17 |
| Spray | 0.15 | 0.82 | 0.006 | 0.013 | 0.03 | 0.05 |
| Combine corn | 1.07 | 5.87 | 0.043 | 0.091 | 0.18 | 0.36 |
| Combine soybeans | 0.70 | 3.84 | 0.028 | 0.060 | 0.12 | 0.24 |
| No-till corn on soybeans (NH3, plant, 2 sprays, combine) | 2.92 | 16.03 | 0.117 | 0.248 | 0.50 | 0.99 |
| No-till soybeans (plant, 2 sprays, combine) | 1.50 | 8.24 | 0.060 | 0.128 | 0.26 | 0.51 |
Source: farmdoc daily, Oct 20, 2026 (chisel, combine) [23]; Purdue NCR-202, Table 1, moderate-draft soils (other operations) [24]; USDA AMS Iowa farm diesel, Oct 16, 2026 [1]; DEF ratios from Section 3 [14][15][16][17][18][19]. *Crop Root Zone estimates. Rates are field operations only, with no allowance for road travel. Penn State Extension puts a typical no-till corn-soybean farm under 3 gallons of diesel an acre [25], consistent with the 1.5 to 2.9 here.
DEF is a small cost per acre. It is $0.23 to $0.50 an acre of corn in bulk across the two ratios, and $0.89 to $1.89 from premium jugs. Corn's diesel is $16. The cost becomes noticeable when the jug premium is multiplied across a whole farm. A 3,000-acre corn-soybean farm running SCR-only engines burns about 560 gallons of DEF a year on our estimate. Buying it in premium jugs instead of bulk costs about $3,200 more a year.
5. When a bulk tank pays, and how big it should be
What's new: Farm-scale DEF storage now ranges from a $710 tote pump to a $17,000 heated cube. Fill-Rite's 120-volt DEF tote pump kit lists at $710 (Fill-Rite, search-indexed listing) [29]. NTO Tank lists a 1,000-gallon DEF mini-bulk tank with a 9-gpm pump, meter and 20-foot hose at $3,800, FOB, with no heater (NTO Tank, accessed Oct 23, 2026) [26]. National Petroleum lists Tecalemit's insulated, heated Northern mini-bulk system at $9,296.25 to $16,670 across 500 to 3,000 gallons (accessed Oct 23, 2026) [27]. Westech lists a heated Blue1 1,320-gallon cube station at $16,719.30 (accessed Oct 23, 2026) [28].
Evidence: We annualized each option over its life at the 7.12% average farm operating-loan rate (Federal Reserve Bank of Chicago, Aug 2026) [30]. We then divided by the per-gallon saving over jugs ($4.00) or a delivered tote ($3.25), assuming bulk refills at $2.00.
| Setup | Installed cost, $ | Annual cost, $/yr* | Pays vs jugs, gal/yr* | Pays vs totes, gal/yr* | Acres, SCR-only* | Acres, EGR+SCR* |
|---|---|---|---|---|---|---|
| Tote pump kit on delivered totes | 710 | 199 | 265 (totes vs jugs) | — | 1,410 | 3,000 |
| 1,000-gal mini-bulk, unheated, in a heated shop | 5,300* | 686 | 343 | 549 | 1,830 | 3,880 |
| Heated outdoor package, small end | 11,300* | 1,450 | 725 | 1,160 | 3,860 | 8,200 |
| Heated 1,320-gal cube station | 19,700* | 2,429 | 1,215 | 1,944 | 6,470 | 13,740 |
Source: Fill-Rite [29]; NTO Tank [26]; National Petroleum/Tecalemit [27]; Westech/Blue1 [28]; Federal Reserve Bank of Chicago [30]. *Crop Root Zone estimates. Installed costs add an estimated $1,500 (mini-bulk), $2,000 (heated package) and $3,000 (cube) for freight, pad and electrical to list price. The pump kit is annualized over 5 years with $25 a year of upkeep. The tanks are annualized over 15 years with $100 to $250 a year for filters and power. Acres use the corn-soybean rotation averages from Section 4: 0.188 gal/ac at 8.5% and 0.088 gal/ac at 4%. The acre columns compare against jugs, except the tote row.
Three results stand out. A tote with a pump is the cheapest step and pays against jugs at about 265 gallons a year. A small mini-bulk tank set inside a shop that is already heated pays at about 340 gallons, roughly 1,800 acres of SCR-only rotation. The heated outdoor packages, which are what a farm without a heated shop needs north of the frost line, need 725 to 1,215 gallons a year. At the tested Deere ratios that is 8,000 to 14,000 acres. A farm's trucks, loaders and sprayers with SCR draw from the same tank, so count every SCR engine before ruling a tank out.
Storage, not price, sets the limit. DEF freezes at 12°F (−11°C) and expands about 7% as it freezes (Valvoline) [21]. Freezing does not damage the fluid, but it can damage pumps and fittings. Bridgeview's bulk-system manual calls for a heated location or a winterized tank below 12°F, and it warns never to add antifreeze (Bridgeview, Jun 22, 2015) [22]. Heat shortens shelf life:
| Constant storage temperature | Shelf life, months | |
|---|---|---|
| 50°F (10°C) | 36 | ██████████ |
| 77°F (25°C) | 18 | █████░░░░░ |
| 86°F (30°C) | 12 | ███░░░░░░░ |
| 95°F (35°C) | 6 | ██░░░░░░░░ |
| 104°F (40°C) | 2 | █░░░░░░░░░ |
Source: Bridgeview Manufacturing, DEF Basic Bulk System owner's manual, Jun 22, 2015, which counts shelf life from the batch date on the delivery receipt [22]. Cummins gives about one year between 12°F and 86°F [20]. Valvoline gives two years under 77°F and one year at 81 to 90°F [21]. Bars scale months; 50°F = 10.
Contamination is the other storage risk. DEF corrodes copper, brass, mild steel and galvanized materials. Valvoline specifies high-density polyethylene and stainless steel [21]. Any brass fitting or galvanized nipple left over from a fuel installation contaminates the fluid, and the dispenser filter will not catch dissolved metal. Bridgeview's manual also says to keep the tank closed and to flush about 5 gallons through the system after every fill [22].
Ground Truth: Size the DEF tank to the gallons used in a year, not to the delivery truck. A tank filled to 800 gallons on a farm using 300 a year still holds about 500 gallons at the end of a 12-month shelf life if the shop runs warm in summer. Most farms below about 2,000 SCR-only acres should buy delivered totes and a pump, kept indoors. A mini-bulk tank of 400 to 500 gallons makes sense once the farm's whole SCR fleet uses a tankful a year and the shop is heated. Only above about 1,000 gallons a year does a heated outdoor station beat simply buying smaller lots. Before buying any tank, ask the co-op its minimum bulk drop. A minimum larger than a year's use rules out bulk regardless of the price.
References
- USDA AMS Livestock, Poultry and Grain Market News, Iowa Production Cost Report (Bi-Weekly), week ending Oct 16, 2026 (No. 2 Diesel (Farm) ask $5.40–$5.56, average $5.49, F.O.B.) — https://www.ams.usda.gov/mnreports/ams_2863.pdf
- USDA AMS Livestock, Poultry and Grain Market News, Illinois Production Cost Report (Bi-weekly), week ending Oct 16, 2026 (No. 2 Diesel (Farm) ask $5.39–$6.01, average $5.76, F.O.B.) — https://www.ams.usda.gov/mnreports/ams_3195.pdf
- Meadowland Farmers Coop (Lamberton, Minn.), Energy price page (bulk DEF $1.99/gal cash; Cenex Ruby Fieldmaster diesel $5.67–$5.70), page undated, accessed Oct 23, 2026 — https://meadowlandfarmerscoop.com/energy/
- Central Ohio Farmers Co-op, Fuel Prices page (DEF $2.599; off-highway diesel 5.659; units and date not shown; delayed Barchart feed), accessed Oct 23, 2026 — https://www.centralohfarm.com/fuel-prices
- Pilot Flying J, Fuel Prices table (DEF column; first 25 of 876 locations; no timestamp shown), accessed Oct 23, 2026 — https://pilotcompany.com/fuel-prices
- Tractor Supply Co., Traveller DEF 2.5 gal. ($8.99–$9.99), Traveller Premium DEF 2.5 gal. ($15.99), PEAK BlueDEF 2.5 gal. ($18.99), listing text as indexed by search; the retailer's pages did not load to our fetch, accessed Oct 23, 2026 — https://www.tractorsupply.com/tsc/catalog/diesel-exhaust-fluids
- Walmart.com, PEAK Blue DEF Diesel Exhaust Fluid Tote, 330 gal ($1,040.00 to $1,095.00), listing text as indexed by search; the page returned a bot check to our fetch, accessed Oct 23, 2026 — https://www.walmart.com/ip/PEAK-Blue-DEF-Diesel-Exhaust-Fluid-Tote-330-gal/148969686
- John Kingston, "DEF pump prices, so far, hold steady despite Middle East turmoil," FreightWaves, Mar 20, 2026 — https://www.freightwaves.com/news/def-pump-prices-so-far-hold-steady-despite-middle-east-turmoil
- John Kingston, "Raw component costs send diesel exhaust fluid prices soaring," FreightWaves, Dec 7, 2021 — https://www.freightwaves.com/news/raw-component-costs-send-diesel-exhaust-fluid-prices-soaring
- Cassia Paz, "Urea Volatility Pushes DEF Prices Higher as Global Supply Tightens," Mansfield Energy, Apr 16, 2026 — https://mansfield.energy/2026/04/16/urea-volatility-pushes-def-prices-higher-as-global-supply-tightens/
- Farmbucks, Urea (US Gulf) Futures (CBOT UFV), contract chain as of Oct 22, 2026 (Oct 2026 $436.75/short ton) — https://farmbucks.com/futures/fertilizer/urea-us-gulf
- Trading Economics, Urea commodity page, Oct 22, 2026 ($442.50/t; +17.14% year over year) — https://tradingeconomics.com/commodity/urea
- Russ Quinn, DTN Retail Fertilizer Trends, "UAN32, UAN28, Anhydrous Lead Prices," Oct 21, 2026 (urea $674/ton, second week of October) — https://www.dtnpf.com/agriculture/web/ag/crops/article/2026/10/21/uan32-uan28-anhydrous-lead-prices
- OECD, Abstract of Agricultural and Forestry Tractor Performance Test, Approval No. 2/2 880, Case IH Steiger 500, NTTL, approved Mar 6, 2015 — https://webfs.oecd.org/TADWEB/agriculture/data/tractor/2015/WebA2880_a_0.pdf
- OECD Code 2 Abstract, Approval No. 2/3 454, Case IH Steiger 555 / New Holland T9.615, NTTL, 2026 (University of Bologna OECD-certified tractor mirror) — https://site.unibo.it/trattori-certificati-ocse/en/year-2026/case-ih-steiger-555/case-ih-steiger-555-abstract/@@download/file/Abstract%202.43-2025.pdf
- OECD, Abstract of Tractor Performance Test, Approval No. 2/2 923, John Deere 9520R, NTTL, 2016 — https://webfs.oecd.org/TADWEB/agriculture/data/tractor/2016/WebA2_2923_a_0.pdf
- OECD Code 2 Abstract, Approval No. 2/3 305, John Deere 8R 310, NTTL, 2022 (University of Bologna mirror) — https://site.unibo.it/trattori-certificati-ocse/en/year-2022/john-deere-8r-310/2-20-2022-abstract.pdf/@@download/file/2.20-2022%20Abstract.pdf
- OECD Code 2 Abstract, Approval No. 2/3 393, John Deere 9RX 640 (15.0L engine), NTTL, 2024 (University of Bologna mirror) — https://site.unibo.it/trattori-certificati-ocse/en/year-2024/john-deere-9rx-640-15-0l-engine/2-44-2023-abstract.pdf/@@download/file/2.44-2023%20Abstract.pdf
- OECD Code 2 Abstract, Approval No. 2/3 413, John Deere 9RT 490, NTTL, 2025 (University of Bologna mirror) — https://site.unibo.it/trattori-certificati-ocse/en/year-2025/john-deere-9rt-490/2-3-2025-abstract.pdf/@@download/file/2.3-2025%20Abstract.pdf
- Cummins Inc., "Diesel Exhaust Fluid (DEF) for Tier 4 Final/Stage IV Engines with SCR," Bulletin 4087312, Sep 2013 — https://www.cummins.com/sites/default/files/2018-07/4087312.pdf
- Valvoline (Ashland Consumer Markets), Air Shield DEF Diesel Exhaust Fluid, Product Information sheet, version 1332/02, undated — https://go.lupinsys.com/valvoline/harms/public/materials/2c0667d4b4bef33af910ffe7cefa1962-published/attachments_api/decf5cdfdb3e255055f092730c87726f/search_api/Adblue___Diesel_Exhaust_Fluid-PI_Sheet.pdf
- Bridgeview Manufacturing Inc., DEF Basic Bulk System Owner's Manual, last updated Jun 22, 2015 — https://cdn.bridgeviewmanufacturing.com/wp-content/uploads/2020/09/DEF-Basic-Bulk-System-Manual.pdf
- Gary Schnitkey, Nick Paulson, Jim Baltz, Carl Zulauf and Bradley Zwilling, "Diesel Fuel Price Impact on Fuel & Oil and Per-Acre Machinery Costs," farmdoc daily, Oct 20, 2026 — https://farmdocdaily.illinois.edu/2026/10/diesel-fuel-price-impact-on-fuel-oil-and-per-acre-machinery-costs.html
- Donald R. Griffith and Samuel D. Parsons, "Energy Requirements for Various Tillage-Planting Systems," NCR-202, Purdue University Cooperative Extension Service, Table 1, undated web edition — https://www.extension.purdue.edu/extmedia/NCR/NCR-202-W.html
- Andrew Frankenfield, Dwane Miller and Zachary Curtis, "How Bad Is $6 Diesel for the Farmer?," Penn State Extension, Mar 31, 2026 — https://extension.psu.edu/how-bad-is-6-diesel-for-the-farmer
- NTO Tank, 1000 Gallon DEF Mini Bulk Dispensing Tank ($3,800; 120V pump, digital meter, 20 ft hose; FOB Mississippi), accessed Oct 23, 2026 — https://www.ntotank.com/1000gallon-def-diesel-exhaust-fluid-mini-bulk-dispensing-tank-x8787562
- National Petroleum Equipment, Tecalemit Northern DEF Mini Bulk Storage and Dispensing System ($9,296.25–$16,670.00; 500–3,000 gal; insulated, cabinet heater), accessed Oct 23, 2026 — https://nationalpetroleum.net/store/manufacturers/tecalemit/tecalemit-northern-def-mini-bulk-storage-and-dispensing-system/
- Westech Equipment, DEF Tanks listings (Blue1 1320g Cube Bulk Dispense Station, 400W heater, $16,719.30), accessed Oct 23, 2026 — https://westechequipment.com/categories/def-equipment/def-tanks
- Fill-Rite, DF120CMN520 120V DEF tote pump package ($710.00), listing text as indexed by search, accessed Oct 23, 2026 — https://www.fillrite.com/df120cmn520
- Federal Reserve Bank of Chicago, AgLetter, Aug 2026 (second-quarter 2026 survey; farm operating loans 7.12%) — https://www.chicagofed.org/publications/agletter/2025-2029/august-2026
Disclosures
Crop Root Zone is an independent publication. Nothing here is investment advice. Market calls, where included, reflect the editors' own read and are not a recommendation to buy or sell any security.
Iowa Propane Asks Spanned 37 Cents a Gallon in September, and Tank Rent Runs $0 to $225 a Year. An Owned 1,000-Gallon Tank Pays From About 2,400 to 3,700 Gallons If Shopping Saves 18 Cents. A 30,000-Gallon Transport Tank Needs 33,000 to 58,000.
Iowa wholesale propane rose 19 cents in two weeks to $1.190 on October 19, 68% above a year ago, while the residential price rose 7 cents. The rent on a leased tank is the small part of the deal. The large part is that state law lets only the tank's owner fill it. Owning pays when local suppliers' prices are far apart or when the tank can take a transport load. It does not change what a farm pays in a shortage unless the tank is big enough to wait one out.
Iowa wholesale propane was $1.190 a gallon in the week of October 19. That is 19 cents above the $1.000 of October 5 and 68% above the $0.707 of a year earlier. The Iowa residential price rose only 7.1 cents over the same two weeks, to $1.704, and is 12% above a year ago (EIA, Oct 21, 2026) [1][2]. Retail is behind wholesale while dryers are running, and a farm's next delivery will be priced against the higher wholesale cost. Our October 19 piece, TRZ-0292, priced the fuel per point of moisture [21]. This piece takes up the tank that fuel goes into. Should a farm own its propane tank or lease it from its supplier? The answer turns less on the rent than on what the lease prevents. Section 1 sets out this fall's prices. Section 2 prices a lease and an owned tank. Section 3 finds the break-even volume. Section 4 separates contracting from ownership, and Section 5 covers what happens when supply runs short.
1. Fall 2026: wholesale is moving, retail is lagging
What's new: EIA's October 21 release shows wholesale propane up 16 to 20 cents a gallon across the Midwest states in two weeks. Residential prices rose 7 to 12 cents [1][2]. The state data come from the State Heating Oil and Propane Program, which runs from October through March.
Evidence:
| State | Residential, Oct 19, $/gal | YoY | Wholesale, Oct 19, $/gal | YoY | Residential minus wholesale, ¢/gal | |
|---|---|---|---|---|---|---|
| Iowa | 1.704 | +12% | 1.190 | +68% | 51 | ████░░░░░░ |
| Nebraska | 1.783 | +12% | 1.159 | +71% | 62 | █████░░░░░ |
| Wisconsin | 1.940 | +12% | 1.256 | +65% | 68 | █████░░░░░ |
| Illinois | 1.943 | +12% | 1.173 | +62% | 77 | ██████░░░░ |
| Minnesota | 2.014 | +12% | 1.228 | +63% | 79 | ██████░░░░ |
| Midwest (PADD 2) | 2.156 | +12% | 1.217 | +64% | 94 | ███████░░░ |
| Indiana | 2.559 | +15% | 1.230 | +57% | 133 | ██████████ |
Source: U.S. EIA, Weekly Heating Oil and Propane Prices, residential and wholesale propane excluding taxes, weeks of Oct 19, 2026 and Oct 20, 2025, released Oct 21, 2026 [1][2]. Residential is delivered to homes, not farm bulk. Year-over-year changes compare the week of Oct 20, 2025. Bars scale the residential-minus-wholesale spread; Indiana = 10.
The farm price sits below the residential price. USDA's bi-weekly Iowa survey put distributor propane asks at $1.30 to $1.67 a gallon, averaging $1.48, in the week ending September 18 (USDA AMS, Sep 18, 2026) [4]. That was the latest edition we could retrieve. The 37-cent spread among Iowa distributors is the most useful number in this piece. It measures how much a buyer who is free to choose a supplier can gain, and the lease is what takes that freedom away.
The gap between residential and wholesale prices in Iowa is narrower than usual. It averaged 57 cents in October 2026, against 78 cents in October 2025 and 93 cents in October 2022 (Crop Root Zone calculation on EIA weekly series) [3]. A narrow retail margin during a wholesale rally usually means retail prices have not caught up yet. Prices on deliveries now being booked are more likely to rise than to fall.
2. What a lease costs, and what it actually sells
What's new: US suppliers rarely publish farm tank rents. Two public schedules give the range. Midwest Energy & Communications, a Michigan cooperative, charges $18.75 a month ($225 a year) to rent its tank if a customer takes no delivery for two years. It also charges the same capped price per gallon whether the customer owns the tank or rents it from the co-op (MEC, accessed Oct 22, 2026) [10]. Superior Propane's July 2026 lease disclosures list a 1,000-gallon tank at C$199 a year over a five-year term. They add a C$299 installation fee and a C$250 removal fee, and a C$500 termination fee in the first three years (Superior Propane, Jul 2026) [9]. At about 0.70 US dollars to the Canadian dollar in early October [11], that is roughly US$140 a year in rent and about US$1,080 over five years. Superior says the fee depends on how much propane the customer takes. Many farm suppliers set tanks for high-volume drying customers at no rent.
Evidence: The rent is small. The real terms of the lease are elsewhere. Iowa law bars anyone except the owner, or someone the owner authorizes, from filling a marked propane container larger than 20 pounds. Each violation is a simple misdemeanor. The only exception lets the owner, when it cannot supply its own lessee, name another supplier to fill the tank (Iowa Code §101.13, 2024) [12]. A propane-industry attorney wrote in 2023 that "most, if not all, states" have similar laws (LP Gas, Aug 31, 2023) [13]. A lessee can still contract and prepay, but only with the lessor. CHS's Cenex describes the trade the same way: owning gives flexibility in choosing a supplier, and leasing avoids the up-front cost (Cenex, May 12, 2016) [22].
| Option, 1,000 gal | Up-front, $ | Annual cost, $/yr | Basis |
|---|---|---|---|
| Lease, no-rent drying account | 0 | 0 | Common where volume is high; not a published schedule |
| Lease, Superior Propane schedule | ~210 | ~140 | C$299 install, C$199/yr rent at 0.70 US$/C$ [9][11] |
| Lease, MEC low-use rent | 0 | 225 | $18.75 a month after two years without a delivery [10] |
| Own, above-ground, new | 6,475* | 662* | $4,475 list + ~$2,000 install; 25 yr at 7.12% + $100 upkeep |
| Own, 30,000 gal, installed | 120,000 to 180,000* | 11,920 to 17,130* | 25 yr at 7.12% + $1,000 upkeep + $513 fill interest |
Source: Kleen-Rite, Quality Steel 1,000-gallon above-ground ASME tank listing, $4,475 sale price (MSRP $7,000), customer pickup only, accessed Oct 22, 2026 [5]; Superior Propane, Lease Disclosures, Jul 2026 [9]; MEC propane price and fee page, accessed Oct 22, 2026 [10]; Agweek, Jul 21, 2014 [7]; Federal Reserve Bank of Chicago, Aug 2026 [23]. *Crop Root Zone estimates. Installation for the 1,000-gallon tank covers freight, the pad, setting, regulator and piping; the listing recommends a 5 by 18 foot, 6-inch pad. The 30,000-gallon range starts from Agweek's 2014 figure of about $80,000 for the tank plus about $40,000 to install. The $513 is interest on a 24,000-gallon summer fill at $1.20 held three months.
The tank prices come from few sources, and we say so. The 1,000-gallon price is one retailer's listing. The same seller lists an underground 1,000-gallon tank at $4,700 [6]. We found no new-tank list price for the common 1,990/2,000-gallon size from a seller we could verify. For 30,000-gallon tanks, the newest installed cost in public reporting is from 2014. Agweek then put a 30,000-gallon tank at about $80,000 plus about $40,000 to install, and a 60,000-gallon tank at about $160,000 installed. A Minnesota tank maker was quoting late-October delivery on tanks ordered in July [7]. Used tanks hold their value. A 1973 Beaird tank of 29,995 gallons, sold by Watertown, South Dakota's municipal utility on April 28, 2026, closed at $89,100 including the buyer's premium, without its stand and before removal and resetting (Purple Wave, Apr 28, 2026) [8]. If a 53-year-old tank brings that much, $120,000 installed is a floor for a new one, not a midpoint. We model $150,000.
Ground Truth: The rent is not what a lease costs. The lease costs a farm its choice of supplier, and that choice is worth as much as local suppliers' prices differ. Before buying a tank, get written quotes for this season's drying gallons from two suppliers that do not own your tank. If they come in within 5 cents of the lessor, the lease is cheap, and $6,500 of steel buys an option you will rarely use. If they come in 15 cents or more lower, the steel pays for itself in one season.
3. How many gallons make ownership pay
What's new: We set each owned tank's annual cost against the rent it replaces and the price advantage it earns. For an owned 1,000-gallon tank, the advantage is the freedom to shop, and we use the Iowa spread as the guide. Five cents is a quiet local market. Ten cents is a typical gap. Eighteen cents is the distance between the September 18 average ask and the lowest ask [4]. For a 30,000-gallon tank, the advantage is buying a full transport load near the terminal price instead of smaller truckload drops. We test 15, 25 and 40 cents. Those are estimates bounded by Iowa's current 51-cent spread between residential and wholesale prices. A transport buyer still pays freight and some supplier margin, so it captures part of that spread, not all of it.
Evidence:
| Owned tank vs leased alternative | Net annual cost of owning, $* | Pays from, gal/yr, at 5¢* | at 10¢* | at 18¢* | at 25¢* | at 40¢* |
|---|---|---|---|---|---|---|
| 1,000 gal vs lease at $0 rent | 662 | 13,200 | 6,600 | 3,700 | — | — |
| 1,000 gal vs lease at ~$140 rent | 522 | 10,400 | 5,200 | 2,900 | — | — |
| 1,000 gal vs lease at $225 rent | 437 | 8,700 | 4,400 | 2,400 | — | — |
| 30,000 gal ($150k*) vs six leased 1,000s at $0 | 14,520 | — | — | — | 58,100 | 36,300 |
| 30,000 gal ($150k*) vs six leased 1,000s at $225 each | 13,170 | — | — | — | 52,700 | 32,900 |
| 30,000 gal at $120k vs six at $0 | 11,920 | — | — | — | 47,700 | 29,800 |
| 30,000 gal at $180k* vs six at $0 | 17,130 | — | — | — | 68,500 | 42,800 |
Source: Crop Root Zone model from Section 2 costs [5][7][9][10][23] and the USDA AMS Iowa ask range [4]. *All values are estimates. Price advantages are scenarios, not farm quotes. At 15 cents, the $150,000 tank needs about 88,000 to 97,000 gallons a year. Six 1,000-gallon tanks is the alternative an elevator manager described to Agweek in 2014, when farmers with four such tanks wanted six [7].
2,400 to 3,700 gallons
The yearly volume at which an owned 1,000-gallon tank pays for itself, if shopping captures the 18-cent gap between Iowa's average and lowest September propane asks. At NDSU's rule of thumb of 0.02 gallon per bushel per point, that is roughly 15,000 to 23,000 bushels dried eight points. (Crop Root Zone estimate from USDA AMS, Sep 18, 2026, and Kleen-Rite listing, Oct 22, 2026)
The two tank sizes answer different questions. An owned 1,000-gallon tank is a cheap option. It costs about $440 to $660 a year more than a lease, and it pays at fairly small volumes once any real price difference shows up. The risk is small: if local prices turn out to be close, the farm loses a few hundred dollars a year. A 30,000-gallon tank is a different kind of decision. At our central $150,000 estimate it needs about 33,000 to 58,000 gallons a year at 25 to 40 cents of advantage. Using NDSU's 0.02 gallons per bushel per point [21], that is roughly 200,000 to 360,000 bushels dried eight points. Below about 25 cents of real transport advantage, the big tank does not pay at any volume a single farm dryer is likely to burn.
4. Contracting is a separate decision from owning
What's new: Owners and lessees can both contract ahead. MEC's summer pre-buy program sold gallons at $1.879, 10 cents under its capped price of $1.979, with a 500 to 1,000-gallon limit. The capped price applied to MEC-owned and customer-owned tanks alike [10]. Iowa's own price history shows what that kind of discount is up against.
Evidence: We took Iowa's weekly residential series back to 1990 and measured, for each heating season, how far the price rose from the third October survey week to the winter peak (EIA, weekly series, downloaded Oct 22, 2026) [3].
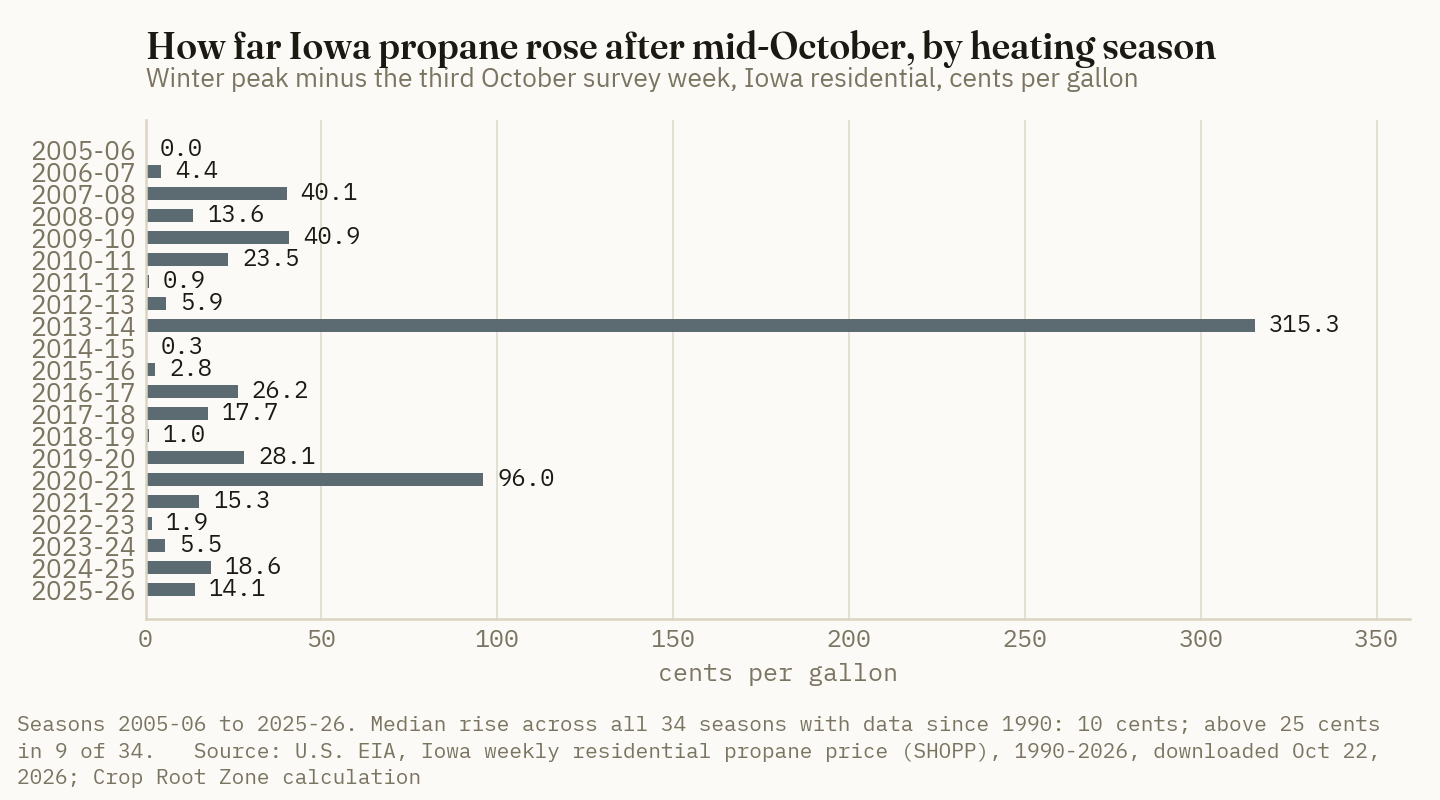
Across 34 seasons with data, the median rise was 10 cents and the mean was 25 cents. The rise exceeded 25 cents in 9 seasons. The mean is high because of two events. In 2013-14 the Iowa price went from $1.556 in mid-October to $4.709 on January 27, 2014. In 2020-21 it rose 96 cents to a February 2021 peak [3].
Ground Truth: A contract protects against the price going up. A tank protects against the supplier, and it matters only when local prices differ. In most years a fall contract wins by about the size of the pre-buy discount. Once in a decade or so it wins by dollars. Neither result depends on who owns the tank. A farm that buys its own 1,000-gallon tank so it can shop the spot market every fall has given up the contract to gain the shopping. Over Iowa's history that is a poor trade. Own the tank and still contract, with whichever supplier wins the bid.
5. When supply runs short: the 2013-14 test and the Gygr-Gas case
What's new: The 2013-14 shortage started with crop drying. Testifying to the Senate in May 2014, the Energy Department described an "unusually late and larger than normal" use of propane to dry a large, wet corn crop. That use drained upper Midwest terminals before a cold winter, while the Cochin pipeline was offline for part of November and December (DOE testimony, May 1, 2014) [17]. Midwest residential propane went from $2.08 on December 2, 2013 to $4.20 on January 27, 2014. Conway propane traded a record $2.97 a gallon above Mont Belvieu [17]. Midwest inventories fell 12.8 million barrels from mid-October to early January, against a five-year average draw of 7.3 million (EIA, Jan 23, 2014) [18].
Evidence: Shortages fall hardest on customers without a supplier relationship. In January 2014, Lakes Gas in Minnesota stopped taking new customers, commercial accounts such as corn dryers in particular, to protect supply for existing ones. It also limited some deliveries to 200 to 250 gallons instead of filling 500-gallon tanks (Kanabec County Times, Jan 9, 2014) [19]. Elsewhere in Minnesota, dealers turned away new buyers and gave existing customers partial fills (CBS Minnesota, Jan 27, 2014) [20]. A lease carries the opposite risk. In December 2022, Missouri's governor had to sign an executive order suspending the state's owner-only fill rule for Gygr-Gas tanks after the Boonville supplier stopped delivering. The company had served customers in 42 counties, and its customers had no other way to get their tanks filled (News Tribune, Dec 16, 2022; ABC17, Dec 29, 2022) [14][15].
Storage determines how long a farm can wait. The table shows hours of dryer run time for each storage setup, before any delivery.
| On-farm storage | Usable gallons, 80% to 20% full* | Hours at 160 gal/hr* | |
|---|---|---|---|
| One 1,000-gal tank | 600 | 3.8 | ░░░░░░░░░░ |
| Four 1,000-gal tanks | 2,400 | 15 | █░░░░░░░░░ |
| Six 1,000-gal tanks | 3,600 | 23 | ██░░░░░░░░ |
| One 30,000-gal tank | 18,000 | 113 | ██████████ |
Source: Crop Root Zone estimate. *Assumes a 1,000-bushel-an-hour dryer removing eight points at 0.02 gallon per bushel per point [21]. Tanks are filled to 80% and reordered at 20%. Agweek reported a 7,000-bushel-an-hour dryer using about 10,000 gallons a day [7]. Bars scale hours; 30,000 gal = 10.
A single 1,000-gallon tank cannot carry a large dryer through one shift. A farm with a bank of small tanks depends on the bobtail truck arriving every day. A 30,000-gallon tank gives four to five days of continuous drying, and that cushion is what a farm needs when terminals are short. Setbacks matter too. Minnesota's fire code, following NFPA 58, requires 25 feet from buildings and property lines for above-ground tanks of 501 to 2,000 gallons. A single tank of 501 to 1,200 gallons may sit at 10 feet if no other propane tank is within 25 feet. Tanks of 2,001 to 30,000 gallons need 50 feet, and tanks above 30,000 gallons need 75 (Minnesota State Fire Marshal, accessed Oct 22, 2026) [16]. A 30,001-gallon tank needs half again the clearance of a 30,000. Several small tanks are measured by their combined capacity [16], so a bank of six 1,000s still needs 50 feet.
Ground Truth: Size the tank either small enough to keep a supplier relationship or big enough not to need one. A leased tank on a drying contract makes a farm an existing customer, which in 2014 was the customer dealers kept serving. A 30,000-gallon tank filled before harvest carries the farm through a supply break with four or five days of reserve. The weak middle is a farm with a few owned 1,000-gallon tanks, buying on the spot market and changing suppliers each fall. In a tight year that farm is a new commercial account to every dealer, and in 2014 dealers were turning those accounts away. A farm that owns small tanks for the price advantage should keep one supplier under contract each fall.
References
- U.S. Energy Information Administration, Weekly Heating Oil and Propane Prices, Residential Propane (dollars per gallon, excluding taxes), weeks of Oct 5, 12 and 19, 2026, released Oct 21, 2026 — https://www.eia.gov/dnav/pet/pet_pri_wfr_a_epllpa_prs_dpgal_w.htm
- U.S. Energy Information Administration, Weekly Heating Oil and Propane Prices, Wholesale Propane (dollars per gallon, excluding taxes), weeks of Oct 5, 12 and 19, 2026, released Oct 21, 2026 — https://www.eia.gov/dnav/pet/pet_pri_wfr_a_epllpa_pwr_dpgal_w.htm
- U.S. Energy Information Administration, weekly residential and wholesale propane price series for Iowa, Minnesota, Illinois, Nebraska, Wisconsin, Indiana and PADD 2 (residential from Oct 1990; wholesale from Oct 2013), downloaded Oct 22, 2026 — https://www.eia.gov/dnav/pet/hist/LeafHandler.ashx?n=PET&s=W_EPLLPA_PRS_SIA_DPG&f=W
- USDA AMS Livestock, Poultry and Grain Market News, Iowa Production Cost Report (Bi-Weekly), week ending Sep 18, 2026 (propane ask $1.30–$1.67, average $1.48, F.O.B.) — https://ams-prod.azureedge.us/mnreports/ams_2863.pdf
- Kleen-Rite Corp., Quality Steel 1000 Gallon Above Ground Propane Tank (PST1000AG) listing, $4,475 sale price, MSRP $7,000, customer pickup only, accessed Oct 22, 2026 — https://www.kleen-ritecorp.com/p-37889-1000-gallon-above-ground-propane-tank.aspx
- Kleen-Rite Corp., Quality Steel 1000 Gallon Underground Propane Tank (PST1000UG) listing, $4,700 sale price, MSRP $7,750, accessed Oct 22, 2026 — https://www.kleen-ritecorp.com/p-37890-1000-gallon-underground-propane-tank.aspx
- Agweek, "Fall propane shortage prompts increased tank storage," Jul 21, 2014 — https://www.agweek.com/news/fall-propane-shortage-prompts-increased-tank-storage
- Purple Wave, April 28, 2026 Government Auction, item EV5702, 1973 Beaird propane tank, 29,995 gallons, Watertown Municipal Utilities (S.D.), sold $89,100 including 10% buyer's premium, stand not included; the page is script-rendered and did not return item text to our fetch, so figures are taken from the search-indexed listing text, accessed Oct 22, 2026 — https://www.purplewave.com/auction/260428/item/EV5702
- Superior Propane, Lease Disclosures, July 2026 (Canadian dollars; 1000 USWG tank annual Equipment Rental Fee $199, Installation Fee $299, Equipment Removal Fee $250, Termination Fee $500/$250) — https://www.superiorpropane.com/-/media/lease-pdf/superior-propane_lease-disclosures_jul-2026_en.ashx
- Midwest Energy & Communications (Cassopolis, Mich.), Propane Prices and fees page (capped price $1.979, pre-buy $1.879, low-use tank rental $18.75/month), accessed Oct 22, 2026 — https://teammidwest.com/propane/propane-prices
- Exchange-Rates.org, Canadian Dollar to US Dollar exchange rate history, Oct 2, 2026 (1 CAD = 0.70193 USD) — https://www.exchange-rates.org/exchange-rate-history/cad-usd-2026-10-02
- Iowa Code 2024, §101.13, Liquefied petroleum gas containers — https://www.legis.iowa.gov/docs/code/2024/101.13.pdf
- John V. McCoy, "Steps to take when competitors fill your leased tanks," LP Gas, Aug 31, 2023 — https://www.lpgasmagazine.com/?p=72050
- Ryan Pivoney, "State permits propane providers to fill Gygr-Gas tanks," News Tribune (Jefferson City), Dec 16, 2022 — https://www.newstribune.com/news/2022/dec/16/state-permits-propane-providers-to-fill-gygr-gas/
- ABC17 News, "Governor extends order to help Gygr-Gas customers," Dec 29, 2022 — https://abc17news.com/?p=1075318
- Minnesota Department of Public Safety, State Fire Marshal, "LP Gas" fire code information (NFPA 58 Table 6.4.1.1 and §6.4.1.3 separation distances), accessed Oct 22, 2026 — https://dps.mn.gov/divisions/sfm/fire-code/fire-code-information-topic/lp-gas
- Melanie Kenderdine, U.S. Department of Energy, statement before the Senate Committee on Energy and Natural Resources, "Short on Gas: A look into the propane shortages this winter," May 1, 2014 — https://www.energy.senate.gov/services/files/6CA464D7-5478-411A-8065-3D5C132CC914 (the Senate link returned 403; text read from the copy linked at https://www.energy.gov/congressional/articles/senate-energy-and-natural-resources-committee-may-1-2014)
- U.S. Energy Information Administration, Today in Energy, "Midwest propane markets tighten further on cold weather," Jan 23, 2014 (corrected Mar 28, 2014) — https://www.eia.gov/TODAYINENERGY/detail.php?id=14711
- Kirsten Faurie, "Propane shortage persists, prices spike," Kanabec County Times, Jan 9, 2014 — https://www.moraminn.com/news/propane-shortage-persists-prices-spike/article_0c74341d-033a-5ab7-867d-4e954a390894.html
- CBS Minnesota (WCCO), "Steps being taken to help ease propane shortage," Jan 27, 2014 — https://www.cbsnews.com/minnesota/news/steps-being-taken-to-help-ease-propane-shortage
- Crop Root Zone, TRZ-0292, "A Point of Moisture Costs 2.8 Cents a Bushel to Remove in a Mixed-Flow Dryer at Iowa's October Propane...," Oct 19, 2026 (NDSU rule of 0.02 gallon of propane per bushel per point of moisture).
- Andy Ernst, CHS/Cenex, "Owning versus leasing propane tanks," May 12, 2016 — https://cenex.com/expert-advice-and-insights/owning-versus-leasing-propane-tanks
- Federal Reserve Bank of Chicago, AgLetter, Aug 2026 (second-quarter 2026 survey; farm operating loans 7.12%) — https://www.chicagofed.org/publications/agletter/2025-2029/august-2026
Disclosures
Crop Root Zone is an independent publication. Nothing here is investment advice. Market calls, where included, reflect the editors' own read and are not a recommendation to buy or sell any security.
Co-op Three-Phase Lines Run $9 to $17 a Foot. A 50 HP Fan's Converter Costs $13,000 to $21,000 Over 15 Years, So the Line Loses Past About Half a Mile.
Published co-op rules put a new three-phase line at $9.00 to $16.71 a foot, about $47,500 to $88,000 a mile. A rotary or digital converter for a 50 hp dryer fan, installed and run 15 years, costs $12,900 to $21,300 on our model. The converter wins beyond roughly 0.15 to 0.6 miles. Its losses run $335 to $617 a year. An engine-driven fan costs about $10,000 a year more to run. The real limit on a converter is how many amps the single-phase line can carry.
On April 13, a South Dakota business owner wrote to his electric cooperative about getting three-phase service to a parcel in Hanson County. Central Electric Cooperative had estimated his contribution in aid of construction at $302,500 to extend about 6 miles of three-phase line. The neighboring Southeastern Electric Cooperative put the cost at $7,650 to extend about 200 feet (SD PUC Docket EL26-010, Exhibit C, Apr 13, 2026) [1]. That letter is not about a grain dryer. But it shows the problem every farm faces when a bigger dryer or bin fan needs three-phase power and the yard has only single-phase: the cost is set mostly by distance. This piece prices the three options at this month's tariffs and list prices: run the line, convert on the farm, or burn fuel. It then works out where each one stops paying.
Two earlier pieces priced the fuel and power once the grain system runs: the dryer's cost per point of moisture on October 19 [20] and the electricity to cool a bin on October 2 [21]. Neither is repeated here. This piece prices getting the power to the motor.
1. What the cooperative charges for the wire
What's new: Co-op line-extension rules are published but not uniform. Some charge a flat rate per foot. Others charge the estimated job cost less an allowance, or price each job separately. Nodak Electric Cooperative in North Dakota charges $9.00 a foot for three-phase line beyond the first 600 feet. That is three times its $3.00 single-phase rate, and Nodak says both equal 100% of its average cost per foot. A new three-phase primary account must also sign a $2,400 a year minimum for five years (Nodak Electric Policy Bulletin 402, rev. Mar 1, 2016, filed with ND PSC Apr 16, 2021) [2].
Evidence: The rules that matter to a grain farm are in the fine print.
| Cooperative (state) | Three-phase line charge to member | Allowance or free footage | Ongoing commitment | Rule date |
|---|---|---|---|---|
| Nodak Electric (ND) | $9.00/ft beyond 600 ft; boring and tree clearing at cost | 600 ft | $2,400/yr minimum for 5 years | Rev. Mar 1, 2016 |
| MiEnergy (IA/MN) | Estimated cost of conversion or upgrade, less allowance | $3,000 | None stated; co-op pays transformer and meter on an upgrade | Feb 2021 |
| Central Electric (SD) | $302,500 estimate for about 6 miles ≈ $9.55/ft* | Not stated | Not stated | Letter dated Apr 13, 2026 |
| Southeastern Electric (SD) | $7,650 estimate for about 200 ft ≈ $38/ft* | Not stated | Not stated | Letter dated Apr 13, 2026 |
| Salt River Electric (KY), benchmark | $16.71/ft three-phase overhead vs $7.72/ft single-phase | Average cost for 300–1,000 ft runs | Not stated | Eff. Feb 9, 2022; since cancelled |
Basis: member's nonrefundable payment before construction, overhead line unless noted. Source: Nodak Electric [2]; MiEnergy Cooperative Policy 502, Feb 2021 [3]; SD PUC EL26-010 Exhibit C, Apr 13, 2026 [1]; Salt River Electric, KY PSC tariff sheet 59, eff. Feb 9, 2022 [4]. *Crop Root Zone division of one customer's quoted estimate by stated distance. Not a published rate.
Four details change the math. First, Nodak treats a change from single-phase to three-phase as a new line extension, charged on the new plant needed to convert [2]. A farm with single-phase poles at the road is not exempt. Second, MiEnergy figures the estimate from the previous year's average construction cost per foot for each type of extension, plus right-of-way costs. It does not print that cost in the policy, so the member learns the price only from a written estimate [3]. Third, Nodak's rule has a refund clause. If a new customer connects to the line within five years, the charge is shared out on a prorated basis and the share is refunded to the farm that paid first [2]. Fourth, the 200-foot Southeastern estimate works out to about $38 a foot. Short runs carry the fixed cost of the transformer bank and service, so the per-foot rates above are a floor, not a quote.
$302,500
One South Dakota co-op's estimated member payment for about 6 miles of three-phase line in April 2026, about $50,400 a mile. A neighboring co-op 200 feet away quoted $7,650. (SD PUC Docket EL26-010, Exhibit C, Apr 13, 2026)
Prices can also be negotiated. Penn State Extension describes a farmer installing a grain system with a 30 hp fan on each bin. His utility offered three-phase service with no up-front charge, but on commercial rates. He chose instead to pay $3,500 for the installation and keep residential rates (Penn State Extension, updated Apr 13, 2026) [5]. The same publication says three-phase motors cost 20 to 50% less than comparable single-phase motors and cause little or no voltage flicker at start-up [5].
2. What a converter costs, and what it cannot do
What's new: A rotary phase converter uses an idler motor to produce the third phase from single-phase power. A 2026 list from Phoenix Phase Converters, a vendor, prices its standard rotary units at $5,340 for 40 hp and $8,635 for 60 hp, and its digital units at $7,644 for 40 hp and $10,689 for 60 hp (Phoenix Phase Converters, Feb 20, 2026, and catalog accessed Oct 21, 2026) [6][7]. Its sizing rule for hard-starting loads such as grain dryers is to go one size up from the motor. Its example installation runs a 50 hp dryer on a 60 hp converter [8].
Evidence:
| Converter for one fan | Rotary, standard | Digital | Installation (vendor range) | Max single-phase input current* |
|---|---|---|---|---|
| 30 hp fan → 40 hp unit | $5,340 | $7,644 | $1,200–$5,000 | about 180 A |
| 50 hp fan → 60 hp unit | $8,635 | $10,689 | $1,200–$5,000 | about 300 A |
| Two 50 hp fans at once → 100 hp unit | $13,034 | not listed | $2,500–$5,000+ | about 590 A |
Basis: vendor list price, 230 V single-phase in, 230 V three-phase out, freight and tax excluded. Source: Phoenix Phase Converters pricing guide, Feb 20, 2026 [6], and catalog pages 4–5, accessed Oct 21, 2026 [7]; installation ranges are the vendor's "standard" to "complex" estimates [6]. *Crop Root Zone estimate: three-phase motor current at about 0.85 power factor and 93% motor efficiency, times the 2.5-to-1 single-phase-to-three-phase current ratio that Michigan State says the National Electrical Code uses for converter circuits [9].
The last column matters more than the price. Michigan State's agricultural engineers note that two wires feed the converter and three leave it. With no losses the single-phase current would be 1.73 times the three-phase current. With converter losses, the code sizes it at about 2.5 times (Michigan State University, Electrical Tech Note 322, 2004/2010) [9]. A 50 hp fan on a converter needs a single-phase service in the 400 A class. Two 50 hp fans running together need more than most rural single-phase transformers and lines are built to carry. The converter itself is available; the co-op may not approve the load. One Kentucky co-op's tariff required written approval before any single-phase motor of 10 hp or larger was installed (Nolin RECC tariff sheet 21, eff. May 1, 2000) [11]. Rules like it are why a converter project should start with a call to the co-op's engineering staff, not with an order to the vendor.
The cheapest converter will not work here. Phase-A-Matic's sizing guide says static converters will not run pumps, blowers or fans, and that a wye-wound motor on a static converter produces about two-thirds of its rated horsepower (Phase-A-Matic, Form STN, 2022) [10]. Michigan State puts static-converter output at 60 to 80% of motor rating [9]. For a dryer or aeration fan, the choice is rotary or digital.
We looked for a public price on a single-phase-input variable-frequency drive rated for a 50 hp motor and did not find one. One dealer's listings of a solid-state converter brand returned a 403 error to our fetch. The digital units above are the solid-state option we could price.
3. What each option costs to run
What's new: The operating gap between converter and line is small. The gap between electric and engine is not. We price a 50 hp fan running 800 hours a year, our assumption for a fall drying season. At 93% motor efficiency (also assumed) it draws about 40 kW and uses about 32,100 kWh a year.
Evidence: Three published schedules show the range of what three-phase service costs a farm. Otter Tail Power's South Dakota farm schedule charges the same 8.397 cents per kWh on single-phase and three-phase. The only difference is the facilities charge: $10.75 a month for three-phase against $6.45 for single-phase, or $51.60 a year more (Otter Tail Power, SD Farm Service 9.03, eff. Apr 1, 2026) [12]. First Electric Cooperative's June 2026 schedule charges 12.86 cents per kWh on single-phase. Its three-phase general service for 51–150 kVA charges 6.25 cents plus $15.47 per kW of summer demand and $12.36 of winter demand (First Electric Cooperative, condensed rate schedule, Jun 2026) [13]. Nodak's 2026 irrigation schedule shows the riskier structure. It passes through its wholesale supplier's seasonal peaks at $15.66 per kW a month for six months if the load runs during the December-to-April peak, and $94.08 per kW for a load running at the June-to-October peak. Members can avoid these charges by joining load management (Nodak Electric Policy 501.2b, eff. Apr 1, 2026) [14].
Converter losses are the efficiency penalty. The only figures we found are the vendor's: total losses "usually under 10%" and about 5% of energy used, plus about $200 a year of idle draw for a 20 hp unit [6]. We found no independent measurement. Using 5 to 10% and 8.4 to 13 cents per kWh, a 50 hp fan's converter costs $335 to $617 a year in losses and idle draw. That is our estimate.
The engine is the expensive option to run. Iowa State's rule of thumb for a diesel engine's year-round average fuel use is 0.044 gallons per hour per maximum PTO horsepower (Iowa State University, AgDM A3-29, Mar 2026) [15]. Iowa State also adds 15% for lubrication [15]. We size the engine for a 50 hp fan at 62 hp, an assumption. At Illinois' $5.76 farm diesel (USDA AMS, Oct 16, 2026) [16], it costs about $18.22 an hour. The electric motor costs $3.37 to $5.21 an hour. The fuel rule is a year-round average that includes light-load hours, so a fan running near full load will burn more.
| Running one 50 hp fan 800 hours | $/year | |
|---|---|---|
| Diesel engine drive, 62 hp, $5.76 diesel* | 14,573 | ██████████ |
| Single-phase, 12.86¢ rate, plus 5–10% converter loss (First Electric)* | 4,011–4,202 | ███░░░░░░░ |
| Three-phase demand rate, Oct and Nov billing (First Electric)* | 3,212 | ██░░░░░░░░ |
| Three-phase farm rate, no demand charge (Otter Tail SD)* | 2,746 | ██░░░░░░░░ |
| Add-on: Nodak-type seasonal peak charge if the fan runs at the winter peak* | +3,769 | ███░░░░░░░ |
Basis: 40.1 kW, 32,086 kWh a year; energy and demand charges only, excluding customer charges the farm already pays. Source: Otter Tail Power, Apr 1, 2026 [12]; First Electric Cooperative, Jun 2026 [13]; Nodak Electric, Apr 1, 2026 [14]; Iowa State AgDM A3-29, Mar 2026 [15]; USDA AMS, Oct 16, 2026 [16]; Phoenix Phase Converters, Feb 20, 2026 [6]. *Crop Root Zone calculation. First Electric is an Arkansas co-op, used here only to show how a demand schedule works. Its single-phase row splits the season half at the summer rate and half at the winter tail-block rate.
The engine costs about $10,400 to $11,800 a year more than the electric options at 800 hours. That premium alone would pay for a half-mile of line at Nodak's rate in under two years. The demand charge is also smaller than its reputation for a fan that runs only in October and November. The risk is timing. A dryer still running in December on a Nodak-type schedule, outside load management, can add almost as much as the year's energy bill.
4. The break-even by distance and horsepower
What's new: We set the line's one-time charge against the converter's full 15-year cost: hardware, installation, and losses discounted at 7%. The lifetime and discount rate are our assumptions. On that basis, the converter path for one 50 hp fan costs $12,884 to $21,310. The low case is the rotary unit, basic installation, 5% loss and 8.4-cent power. The high case is the digital unit, complex installation, 10% loss and 13-cent power.
Evidence:
| Fan load | Converter path, 15 years* | Break-even distance, Nodak $9.00/ft beyond 600 ft* | Central Electric-implied $9.55/ft* | Salt River $16.71/ft* |
|---|---|---|---|---|
| One 30 hp fan | $9,100–$16,700 | 0.31–0.47 mi | 0.18–0.33 mi | 0.10–0.19 mi |
| One 50 hp fan | $12,900–$21,300 | 0.38–0.56 mi | 0.26–0.42 mi | 0.15–0.24 mi |
| Two 50 hp fans at once (100 hp) | $18,500–$27,500 | 0.50–0.69 mi | 0.37–0.54 mi | 0.21–0.31 mi |
Basis: converter cheaper beyond the distance shown, line cheaper inside it. Source: Crop Root Zone model, Oct 21, 2026, on [1][2][4][6][7][12][13]. *Model output. Assumes 800 fan hours a year, 15-year life, 7% discount rate, and losses of 5 to 10%. Line cost excludes transformer, service and right-of-way work, which favors the line. It also excludes Nodak's five-year minimum bill, which favors the converter, and any single-phase service upgrade the converter needs, which favors the line. We did not price either. The 100 hp row assumes the co-op will serve about 600 A of single-phase load, which most will not.
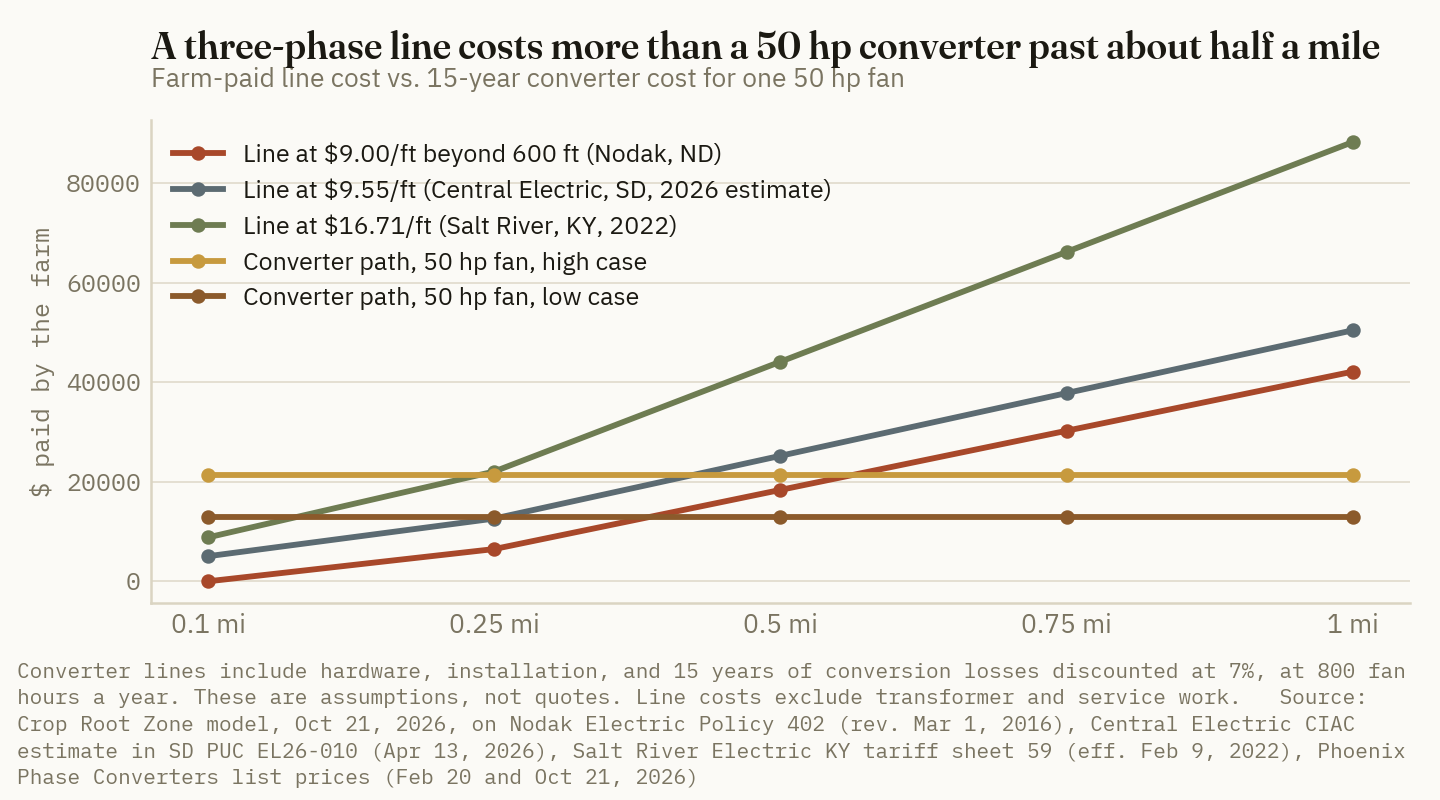
The answer is short. At the per-foot rates published in the Upper Midwest, a single fan of 30 to 50 hp justifies a three-phase line only if the line is within about a third to a half mile. Under a higher-cost tariff like Salt River's, it is a quarter mile or less. Beyond those distances, a converter is cheaper. At a mile, it saves about $21,000 to $75,000, depending on the tariff.
The break-even moves with run-hours, but not much. Doubling the fan hours to 1,600 a year adds about $135 to $420 a year of losses. At Nodak's rate, that moves the break-even out by about 150 to 420 feet. That is our sensitivity estimate. The variable that moves it most is horsepower. Distance aside, a second big fan pushes the single-phase supply past what the converter route can deliver.
Ground Truth: The per-foot price is the wrong number to watch. The amps are the right one. On single-phase, the converter route is cheapest for a farm adding one 30 to 50 hp fan more than about half a mile from three-phase, and the losses barely move that answer. But the converter route does not scale. A second large fan, a bigger dryer, or a grain leg running at the same time pushes the single-phase draw past what most rural co-op transformers carry. At that point the farm pays for three-phase anyway, and it has also paid for the converter. A farm planning to grow past roughly 50 to 60 hp of three-phase load at once should price the line now. It should also ask for Nodak-style shared-cost language, which would refund part of the charge if a neighbor connects later.
5. REAP, and what to ask the co-op before signing
What's new: USDA issued a final rule for the Rural Energy for America Program with a comment period. The press release is dated October 2, 2026. It says projects must now be fully built and operating before the farm applies, with documented output, savings and costs (USDA release via RFD-TV, Oct 2, 2026) [18]. A secondary summary of the rule (91 FR 62600) says it took effect October 16. It reports that grants are capped at 25% of project cost and $250,000 for energy-efficiency projects, with 12 months of energy data before and after installation required (ASUENE, Oct 2026) [19]. We could not confirm those terms in the Federal Register itself because its site returned a bot check, which we did not bypass. Under the old terms, a Minnesota grain farmer received $58,000 toward a $145,000 dryer, 40% (Agweek, Nov 11, 2024) [17].
Evidence: REAP pays for energy-efficiency improvements such as a more efficient dryer. It is not a line-extension program. A farm replacing an old dryer should model REAP's share against the dryer, not the wire. If the 25% cap holds, it covers less than it did in 2024. The new requirement to build first means the farm carries the full cost for at least a year before it can apply.
Questions to settle with the co-op before choosing a power source:
- Written estimate, not a rate sheet. MiEnergy prices from the prior year's average cost per foot [3]. Central Electric's 6-mile estimate came out at about $9.55 a foot [1]. Only the written number counts.
- Conversion versus new line. Ask whether an existing single-phase route can be rebuilt to three-phase and how the co-op charges for it. Nodak treats it as a new extension on the new plant only [2].
- Minimum bills and shared-cost refunds. Ask for the five-year minimum and whether later connections refund part of the payment [2].
- Seasonal demand exposure. Ask whether the three-phase schedule passes through winter or summer peak demand, and what load management costs [14]. Summer aeration and December drying are where the bill risk sits.
- Single-phase capacity. If the plan is a converter, get the co-op's maximum single-phase motor or converter load in writing before buying [11].
The arithmetic leaves a few things out. We did not price the service-entrance and transformer upgrade a 400 A single-phase converter installation may need. MiEnergy pays the transformer and meter on an upgrade, but other co-ops may not [3]. We did not price a propane engine drive, for lack of a published fuel-rate rule for spark-ignition stationary engines on this load. Nor did we find a public price for a stationary diesel power unit. AgWeb's article on three-phase alternatives returned a 403 error. So did one Minnesota co-op's rate book and USDA Rural Development's REAP program page. Figures from those sources are not used here.
References
- South Dakota Public Utilities Commission, Docket EL26-010, Exhibit C, letter to Central Electric Cooperative regarding three-phase service in Hanson County, Apr 13, 2026 — https://puc.sd.gov/commission/dockets/electric/2026/el26-010/ExhC041426.pdf
- Nodak Electric Cooperative, Policy Bulletin No. 402, "New Line Extensions," revised Mar 1, 2016, filed in North Dakota PSC Case PU-20-356 (Exhibit Nodak 7), Apr 16, 2021 — https://www.psc.nd.gov/webdocs/case/20-0356/051-010.pdf
- MiEnergy Cooperative, Policy 502, "New Service Extension Policy," February 2021 (board approved Jan 26, 2021) — https://mienergy.coop/sites/default/files/pdf/502%20-%20New%20Service%20Extension%20Policy%20-%20%202021%20CC.pdf
- Salt River Electric Cooperative Corp., Kentucky PSC No. 12, Sheet No. 59, "Prices for Line Extensions," effective Feb 9, 2022 (cancelled tariff page) — https://psc.ky.gov/tariffs/electric/Salt%20River%20Electric%20Coop.%20Corp/Cancelled%20Tariff%20Pages/2024/Overhead-Underground%20Cost%20Differential/05-05.pdf
- Daniel Ciolkosz, Penn State Extension, "Switch to Three-Phase Electricity if Available," updated Apr 13, 2026 — https://extension.psu.edu/switch-to-three-phase-electricity-if-available
- Phoenix Phase Converters, "How Much Does a Phase Converter Cost? 2026 Pricing Guide," Feb 20, 2026 (vendor) — https://phoenixphaseconverters.com/blogs/news/how-much-does-a-phase-converter-cost-complete-pricing-guide
- Phoenix Phase Converters, online catalog, pages 4 and 5, accessed Oct 21, 2026 (vendor) — https://phoenixphaseconverters.com/collections/our-converters?page=4 and https://phoenixphaseconverters.com/collections/our-converters?page=5
- Phoenix Phase Converters, "Phase Converters for Farming: How to Power 3-Phase Equipment on Rural Property," Mar 2, 2026 (vendor) — https://phoenixphaseconverters.com/blogs/news/phase-converters-for-farming-how-to-power-3-phase-equipment-on-rural-property
- Michigan State University, Biosystems & Agricultural Engineering, Electrical Tech Note 322, "Phase Converters," 2004, 2010 — https://www.maec.msu.edu/download_file/view/160/303
- Phase-A-Matic, Inc., Form STN, "Guidelines for Sizing Phase-A-Matic Static Phase Converters," 2022 — https://www.penntoolco.com/content/phase-a-matic-stn-guidelines-for-sizing-phase-a-matic-static-phase-converters.pdf
- Nolin RECC, Kentucky PSC No. 10, Schedule 1 Rules and Regulations, Sheet No. 21, effective May 1, 2000 (cancelled tariff page) — https://psc.ky.gov/tariffs/electric/Nolin%20RECC/Cancelled%20Tariff%20Pages/2024/Schedule%201%20-%20Residential,%20Farm,%20Non-Farm,%20Trailers%20and%20Mobile%20Homes/09-02.pdf
- Otter Tail Power Company, South Dakota Electric Rate Schedule Section 9.03, "Farm Service," effective with bills on and after Apr 1, 2026 (SD PUC Docket EL25-022) — https://www.otpco.com/media/1wudrlw5/sd_0903.pdf
- First Electric Cooperative, "Condensed Rate Schedule," updated June 2026 — https://www.firstelectric.coop/pdfs/Condensed%20Rate%20Schedule%20%20April%202026.pdf
- Nodak Electric Cooperative, Policy Bulletin No. 501.2b, "Commercial/Industrial – Distribution Delivery – Irrigation," revised Mar 13, 2026, effective Apr 1, 2026 — https://www.nodakelectric.com/sites/default/files/Rates/2026%20Rates/501.2b%20Commercial%20Industrial%20Distribution%20Delivery%20Irrigation.pdf
- Iowa State University Extension and Outreach, Ag Decision Maker File A3-29, "Estimating Farm Machinery Costs" (PM 710), revised Mar 2026 — https://www.extension.iastate.edu/agdm/crops/pdf/a3-29.pdf
- USDA Agricultural Marketing Service, Illinois Production Cost Report (Bi-weekly), report 3195, week ending Oct 16, 2026 — https://www.ams.usda.gov/mnreports/ams_3195.pdf
- Michael Johnson, Agweek, "Efficient grain drying has exploded thanks to rural energy funding," Nov 11, 2024 — https://www.agweek.com/news/policy/efficient-grain-drying-has-exploded-thanks-to-rural-energy-funding
- RFD-TV, "USDA Issues Final Rule for Rural Energy for America Program With Comment Period Before Application Opens," relaying USDA Rural Development release of Oct 2, 2026 — https://www.rfdtv.com/usda-issues-final-rule-for-rural-energy-for-america-program-with-comment-period-before-application-opens
- ASUENE, "USDA REAP Final Rule 2026: New Eligibility Rules and Application Requirements," Oct 2026, summarizing 91 FR 62600 (Federal Register Doc. 2026-20178, Oct 1, 2026) — https://asuene.com/us/blog/usda-reap-final-rule-2026-new-eligibility-rules-and-application-requirements
- Crop Root Zone, TRZ-0292, "A Point of Moisture Costs 2.8 Cents a Bushel to Remove in a Mixed-Flow Dryer at Iowa's October Propane and 4.1 Cents in an Old Cross-Flow. Natural Air Costs 4.4, and Five Elevator Schedules Charge 4.5 to 7 Cents Once Shrink Is Counted.," Oct 19, 2026.
- Crop Root Zone, TRZ-0252, "Cooling a 30,000-Bushel Corn Bin This Fall Takes About $146 of Electricity. A Point of Shrink Below 15% Costs $1,600, and a Musty Load Costs $3,000.," Oct 2, 2026.
Disclosures
Crop Root Zone is an independent publication. Nothing here is investment advice. Market calls, where included, reflect the editors' own read and are not a recommendation to buy or sell any security.
A Five-Pound Copper Build Needs Two Bushels of 2027 Spring Wheat a Year. A Foliar Quart Needs 1.8, Every Year. In 115 Prairie Trials, Soils Under 0.4 ppm Responded 87% of the Time.
At a farm-store bag price, 5 lb of copper as copper sulfate costs $60 an acre spread: 8.6 bushels of December 2027 Minneapolis wheat in year one, about 2 a year over five. It pays on sandy, low-organic-matter, high-pH or peat ground under the provincial and state thresholds, if it is worked in. Canola and corn on mineral soils are not the target.
Copper is the one micronutrient where a single fall pass can last a decade. It is also the one most growers in wheat country never test for. Alberta's provincial agronomists estimated in 1999 that about three million acres of the province, roughly 15% of its cultivated land, were significantly copper deficient, and that another three million or more could be deficient for wheat under high-fertility management (Alberta Agriculture, Sep 1999) [1]. Across 115 spring wheat trials in the Prairie Provinces, soils testing below 0.4 ppm DTPA-extractable copper produced a grain yield response 87% of the time, and the response averaged 47% (Karamanos et al. 2003, as summarized by The Fertilizer Institute, Jan 2024) [8]. North Dakota's work confines the yield response to sandy loams and loamy sands under 2% organic matter (NDSU, accessed Oct 26, 2026) [2]. Minnesota confines it to peat (University of Minnesota, 1997) [4]. December 2027 Minneapolis spring wheat settled at $7.0475 on Friday (USDA AMS, Oct 23, 2026) [10]. At that price, and at the farm-store bag price we found, a 5-pound broadcast build of copper sulfate needs 8.6 bushels to pay in its first year and about 2 bushels a year over five. A quart of foliar copper chelate needs 1.8 bushels and has to be bought again every season. This piece sets out which fields clear those numbers.
1. Where copper is short: the soils, and the thresholds
What's new: Nothing in the agronomy is new. Most of the North American trial record is 20 to 40 years old. What changes is where it applies. Every jurisdiction in the region reads the same DTPA soil test, applies a different threshold, and limits the recommendation to a narrow set of soils.
Evidence: The three soil conditions recur in every source. Texture: deep sandy and light loamy soils are much more likely to be deficient [1]. Organic matter: copper binds more tightly to organic matter than any other micronutrient does, and deficiency is common on peats, mucks and soils over 8% organic matter [8]. pH: Alberta puts the drop in availability between pH 7 and pH 8 at about a hundredfold [1]. North Dakota's most common responsive soil was eroded Arvilla, a calcic, sandy series [2]. Manitoba's soil fertility specialist documented a winter wheat field on sandy, low-organic-matter, high-pH soil at 0.36 ppm DTPA copper that tissue-tested at 3 ppm, against a sufficiency range of 5 to 25 ppm (Manitoba Agriculture, undated) [5].
| Jurisdiction | Soil the guidance covers | DTPA Cu interpretation | Rate guidance | Basis date |
|---|---|---|---|---|
| Alberta | Mineral, 0–6 in. | Under 0.4 ppm deficient; 0.4–0.6 marginal; 0.6–1.0 deficient in some instances; over 1.0 usually adequate | 2.5–10 lb Cu as copper sulfate, broadcast and incorporated; foliar 0.1–0.3 lb Cu | Sep 1999 |
| Saskatchewan | Mineral | Cereal critical level raised from 0.2 to 0.4 ppm | (as Alberta) | Change made after 1985–88, as reported by Alberta |
| North Dakota | Sandy loam to loamy sand, under 2% organic matter | No number in the current chapter; under 0.4 ppm flagged 4 of 10 sites where copper cut head blight | 5 lb Cu as copper sulfate preplant, or Cu-EDTA at 1 qt/acre near V4 | 2008 trials; chapter accessed Oct 2026 |
| Minnesota | Organic (peat) only | 0–2.5 ppm apply; 2.6–5.0 trial only; over 5.0 none | 6–12 lb Cu broadcast and incorporated, or 0.3 lb Cu foliar; none on mineral soils | 1997 |
| Manitoba | Sandy, low organic matter, high pH | Case field at 0.36 ppm; tissue 3 ppm low against 5–25 sufficient | 3.5+ lb Cu as copper sulfate, broadcast and incorporated; foliar at stem elongation | Undated; cites 2004 trials |
Sources: Alberta Agriculture, Agdex 532-3, Sep 1999 [1]; NDSU, "Copper Nutrition in North Dakota Crops," accessed Oct 26, 2026 [2]; Franzen et al., 2008 [3]; Rehm and Schmitt, University of Minnesota FS-6790-A, 1997 [4]; Heard, Manitoba Agriculture, undated [5]; The Fertilizer Institute, Jan 2024 [8]. DTPA-extractable copper, 0–6 inch sample unless stated.
Two points in the table matter more than the thresholds. On peat, Minnesota does not start recommending copper until the soil test is under 2.5 ppm, more than six times Alberta's mineral-soil line. A peat number and a mineral-soil number cannot be read off the same scale. Second, the sources disagree on how far to trust the test at all. Minnesota, writing about peat, calls the soil test a much better predictor than tissue analysis [4]. Alberta, writing about mineral soils after twelve years of work, says there is a low probability of a correct diagnosis from the DTPA number alone, and asks for sampling to 12 to 24 inches. A topsoil reading of 0.5 ppm that stays at 0.4 down the profile is far more likely to respond than one that climbs to 2.8 ppm at depth [1]. Tissue tests diagnose a crop that is already short. Minnesota's boot-stage wheat leaf ranges are under 3.0 ppm deficient, 3.0 to 5.0 low and 5.0 to 20.0 sufficient [4]. A 2006 Prairie review found the youngest leaves a better guide than whole shoots [7].
2. What the trials found when copper was short
What's new: The size of the response is not in question where deficiency is real. What is in question is how often a field is deficient, and how much of a field.
Evidence:
87%
Share of 115 Prairie spring wheat trials on soils under 0.4 ppm DTPA copper that gave a grain yield response. The average response was 47%. Between 0.4 and 0.8 ppm it averaged 10%. (Karamanos et al. 2003, via The Fertilizer Institute, Jan 2024)
The Alberta and Manitoba plot data show the same pattern at field scale.
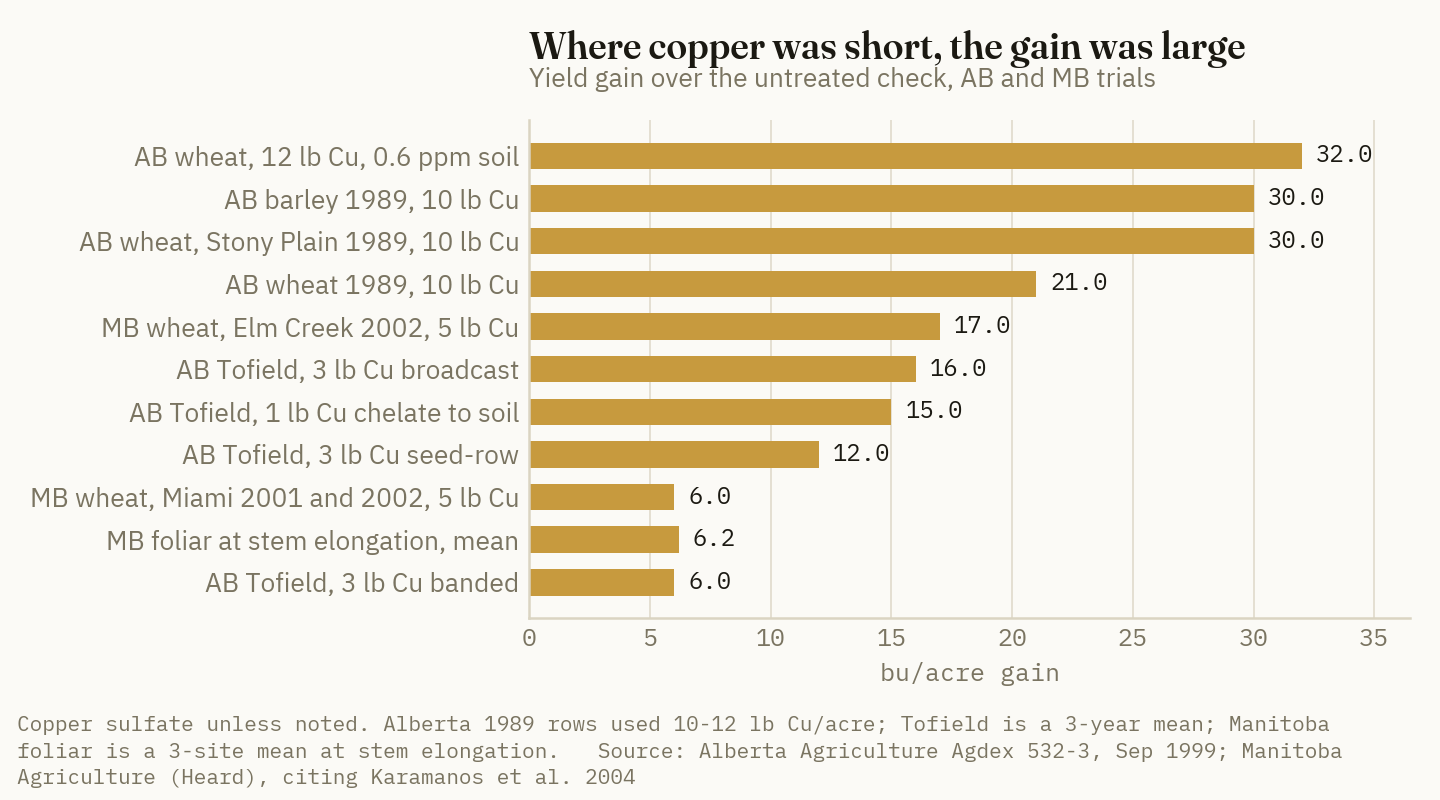
Park wheat on a 0.6 ppm Alberta soil, which is marginal on the province's own table, went from 19 to 51 bushels with 12 lb of copper as copper sulfate [1]. Klages barley went from 62 to 92 bushels with 10 lb [1]. Near Tofield, Alberta, a three-year average put 3 lb of broadcast copper as sulfate at 60 bushels against a 44-bushel check. One pound of Cu-EDTA sprayed on the soil gave 59, seed-row sulfate 56 and banded sulfate 50 [1]. In Manitoba, broadcast and incorporated copper sulfate at 5 lb of copper added 17, 6 and 6 bushels at Elm Creek and Miami in 2001 and 2002. Foliar copper at stem elongation, the best single timing, averaged 32.2 bushels against a 26.0-bushel check across the same three site-years [5]. Alberta lists quality losses alongside yield: shrivelled kernels, ergot, low bushel weights and protein above 18%. At Stony Plain, copper cut ergot bodies from 11 to 2 per square yard as yield went from 13 to 43 bushels [1].
The North Dakota record is narrower. Copper trials on 17 spring wheat and three durum sites from 1998 to 2000 produced yield increases only on low-organic-matter sandy soils [2][3]. The disease signal was mixed. Head blight incidence fell at four of nine infected sites and rose at one, and severity fell at four (Franzen, McMullen and Mosset, 2008) [3]. NDSU adds that the head-disease reduction was smaller than a labelled fungicide delivers [2]. Copper does not replace a head-blight fungicide.
Placement and source matter as much as rate. A Saskatchewan study across five sites and three years ranked foliar copper at Feekes 6 or 10 first, broadcast and incorporated copper sulfate second, and broadcast sulfate left on the surface behind both. Broadcast copper oxysulfate was ineffective, especially unincorporated, and seed-placed sulfate and oxysulfate were also ineffective (Flaten, Karamanos and Walley, 2003) [6]. A 2006 review of Prairie work found granular rates under about 1.8 lb of copper an acre ineffective in the first year, and copper oxide weaker than other sources [7].
Ground Truth: The 0.6 ppm Alberta site is the one to remember. It sits in the province's "marginal" band and produced the largest gain in the record we read. The Prairie average of 10% between 0.4 and 0.8 ppm [8] is an average of fields that did nothing and fields like this one. On a farm, that band calls for a strip, not a decision. Alberta's own method is a 20-foot strip of 10 lb of copper run diagonally across the field, then read off two wheat or barley crops [1]. On a 160-acre quarter that strip covers about 1.7 acres, or roughly $180 of copper sulfate at the co-op bag price by our arithmetic, and it answers the question the soil test cannot.
3. What a pound of copper costs, and where the markup is
What's new: Copper metal and industrial copper sulfate are both near their highs. The larger cost on the farm is the channel the copper comes through, not the metal.
Evidence: LME copper was quoted at 655.0 cents a pound, $14,441 a metric ton, on October 21 (Reporte Minero, Oct 21, 2026) [11]. The U.S. industrial copper sulfate benchmark reached $3,119 a metric ton in September, up from $2,594 in September 2025, a 20% rise (IMARC Group, accessed Oct 26, 2026) [12]. At 25% copper [8], that prices a pound of copper in industrial sulfate at $5.66, about 86% of the metal price. We ran the same exercise for zinc in September [19]. Farm-store bags tell a different story.
| Source | Basis | Package price | $/lb of Cu | |
|---|---|---|---|---|
| Copper metal | LME, Oct 21, 2026 | $14,441/t | 6.55 | █░░░░░░░░░ |
| Copper sulfate (25% Cu) | U.S. industrial benchmark, Sep 2026 | $3,119/MT | 5.66 | █░░░░░░░░░ |
| Copper sulfate pentahydrate | 50-lb bag, farm co-op list price | $132.77 | 10.62 | ██░░░░░░░░ |
| Copper sulfate fine crystals | 50-lb bag, online, before $39 hazmat fee | $176.39 | 14.11 | ██░░░░░░░░ |
| Same, with hazmat fee | 50-lb bag, online | $215.39 | 17.23 | ███░░░░░░░ |
| Copper sulfate small granule | 50-lb bag, online, before $33 hazmat fee | $209.75 | 16.78 | ███░░░░░░░ |
| Cu-EDTA chelate, 7.5% Cu | 2.5-gal jug, online | $128.41 | 65.22* | ██████████ |
| Copper oxysulfate, granular | No public price obtained | — | — |
Sources: Reporte Minero, Oct 21, 2026 [11]; IMARC Group, accessed Oct 26, 2026 [12]; Michigan Milk Producers Association product page, accessed Oct 26, 2026 [13]; Custom Hydro Nutrients listings [14][15]; Hydrobuilder listing for MicroSource 7.5% EDTA copper [16]. Bag prices exclude freight unless stated. *Assumes 10.5 lb a gallon, the weight on Kugler's 7.5% Copper EDTA label [17]; the listed product's own density was not available. The Custom Hydro and Hydrobuilder prices are as indexed by search on Oct 26, 2026; both pages returned HTTP 429 when we tried to open them, and the Chem One fine-crystal listing was shown as sold out.
The spread runs from $5.66 to $17.23 a pound of copper for the same compound. The chelate costs 4 to 12 times as much per pound of copper as sulfate does. It is meant to be used at a fraction of the rate. Alberta puts soil-applied chelate at about 10% of the sulfate rate, with a much shorter residual [1]. Copper sulfate also has handling costs that do not appear in the price. Alberta calls it "highly corrosive" to metal, says it tends to take on moisture and blend poorly, and recommends stainless steel and plastic equipment [1]. Granular oxysulfates blend better but dissolve poorly [1], and the Saskatchewan work found them ineffective as a broadcast [6]. We found no public price for oxysulfate. Its low price per pound of copper in a blend does not help if the copper does not reach the crop.
Ground Truth: A 20% rise in industrial copper sulfate over the past year adds about $1 a pound of copper, or $5 to a 5-pound build. Buying by the 50-pound bag instead of through a retailer's bulk blend adds $5 to $12 a pound, or $25 to $58 an acre. The metal market is not the cost a grower controls. The way the copper is bought is. A retailer that can impregnate or blend fine copper sulfate into a fall phosphate or potash pass removes both the bag markup and the separate trip. Ask for a quote on that before buying a pallet of bags.
4. The break-even, and how long a build lasts
What's new: A broadcast build is a capital purchase, and the trial record says it lasts. Alberta's 1999 conclusion is that one application of granular copper can last for up to 10 years or more. It cites Australian work in which 2.5 to 10 lb of copper as sulfate stayed effective for at least 10 to 15 years [1]. Minnesota says soil-applied copper lasts many years, and that annual applications are unnecessary once the soil test is high [4]. Foliar copper has to be reapplied every year a cereal is grown on deficient land [1]. The one-year break-even therefore overstates the cost of a build by a factor of four to seven.
Evidence: We priced the programs against December 2027 Minneapolis spring wheat at $7.0475, the October 23 settle, before basis [10]. Spreading is Iowa State's 2024 survey average for custom dry bulk application, $7.25 an acre [18]. Amortization uses 6% interest, which is our assumption.
| Program | lb Cu/acre | Product $/acre | Applied $/acre | Break-even, year 1 (bu) | Over 5 yr (bu/yr) | Over 10 yr (bu/yr) |
|---|---|---|---|---|---|---|
| Copper sulfate, industrial price* | 5 | 28.30 | 35.55 | 5.0 | 1.2 | 0.7 |
| Copper sulfate, co-op bag | 3.5 | 37.18 | 44.43 | 6.3 | 1.5 | 0.9 |
| Copper sulfate, co-op bag | 5 | 53.11 | 60.36 | 8.6 | 2.0 | 1.2 |
| Copper sulfate, online bag with hazmat fee | 5 | 86.16 | 93.41 | 13.3 | 3.1 | 1.8 |
| Copper sulfate, co-op bag | 10 | 106.22 | 113.47 | 16.1 | 3.8 | 2.2 |
| Cu-EDTA 7.5%, 1 qt foliar, tank-mixed | 0.20 | 12.84 | 12.84 | 1.8 | 1.8 | 1.8 |
| Copper sulfate, 0.25 lb Cu foliar, tank-mixed | 0.25 | 2.66 | 2.66 | 0.4 | 0.4 | 0.4 |
Source: Crop Root Zone calculation. Prices from [12][13][14][16]; rates from Alberta [1], Manitoba [5], North Dakota [2] and the 2006 Prairie review, which gives foliar rates of 0.18 to 0.25 lb Cu an acre [7]; chelate copper content from the Kugler label [17]; spreading from Iowa State via AgWeb [18]; wheat price from USDA AMS [10]. *The industrial price is a bulk chemical benchmark, not a farm quote; a bulk retail blend should fall between it and the bag price. Foliar rows assume no extra pass. Break-evens are before basis; a 60-cent basis, our assumption, raises each by about 9%. At the December 2026 settle of $6.415 [10], the co-op 5-lb build needs 9.4 bushels in year one.
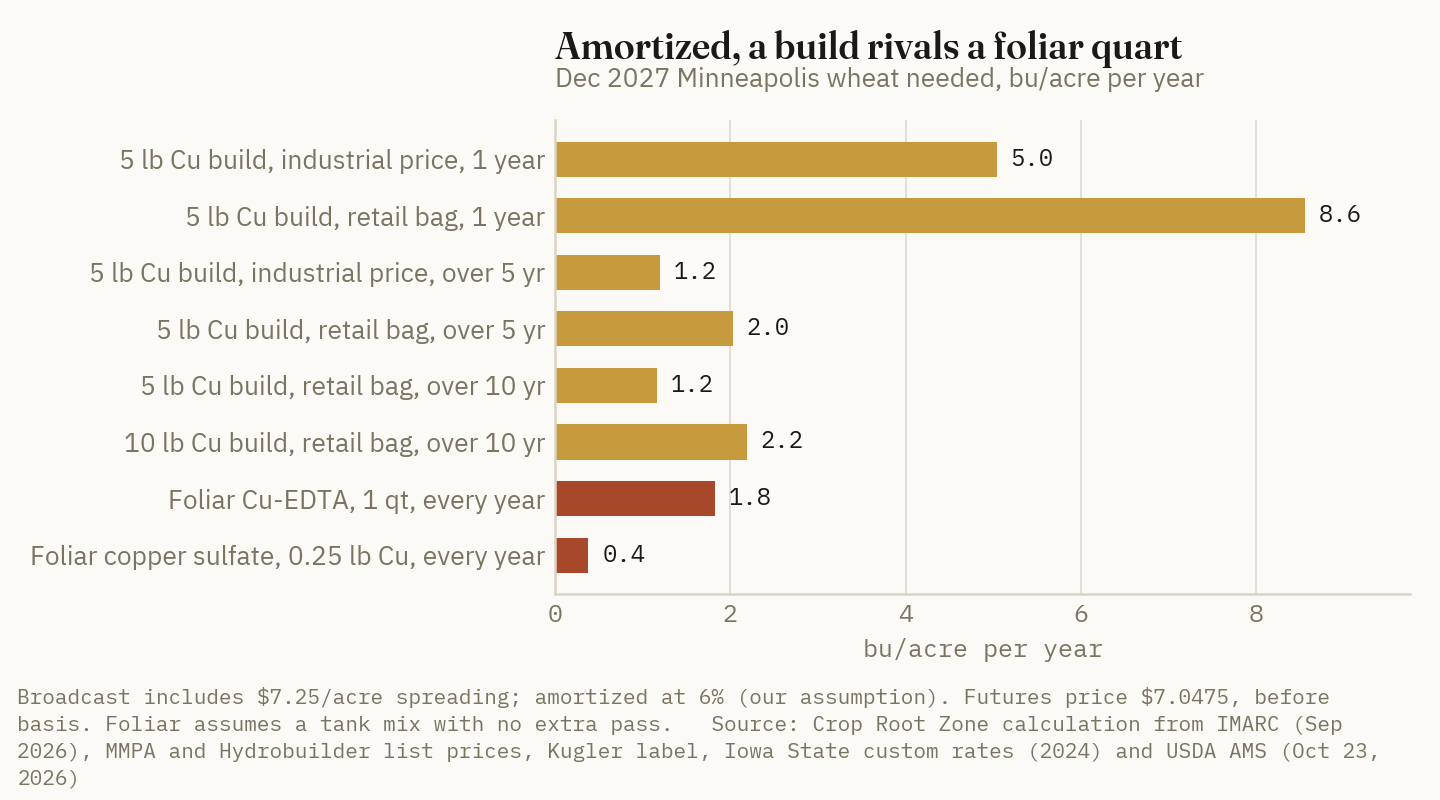
Set those numbers against the response record. On soils under 0.4 ppm, a 47% average response on a crop that would otherwise yield 40 bushels is about 19 bushels, which covers even the 10-lb build in its first year. Between 0.4 and 0.8 ppm, a 10% gain on 50 bushels is 5 bushels. That does not cover a retail 5-lb build in year one. It covers it two to four times over in each year of a five-year life, if the gain repeats. The trial record we read gives the first-year response well and the later-year response poorly. Saskatchewan measured residual effects at only one site, in the second year [6].
The Karamanos analysis behind the 115 trials found that the share of soils under 0.4 ppm where copper paid ranged from 19% to 77%, depending on wheat price and required return, and that a profitable response was very rare at higher soil test levels [8]. We were not able to read the paper itself, so we do not know whether it counted a residual. If it did not, the one-year test judges a five-to-ten-year asset on one crop.
Ground Truth: A grower choosing between a build and a foliar program is choosing how long the field stays in small grains. Undiscounted, a $60 co-op-bag build equals the cost of 4.7 years of foliar quarts at $12.84. At the industrial-price bulk floor of $36 it equals 2.8 years. On ground that grows wheat, durum or barley in at least two years of every four for the next decade, the build is cheaper, and fall is the time to apply it. Alberta notes that fall application allows deeper, more thorough incorporation than spring [1]. The foliar quart is the better buy in three cases: the field is in its first year of a lease, the deficiency is patchy across the field, or there will be no tillage pass to work the copper in.
5. What a build does not do: no-till, canola and corn, and the seed row
What's new: Four limits appear in the same sources that recommend the build.
Evidence:
It needs tillage. Copper does not move in soil [1][4]. Saskatchewan found incorporation critical to the residual value of broadcast copper sulfate and oxysulfate [6], and the 2006 review found unincorporated broadcast granules less effective than incorporated or foliar copper [7]. Alberta adds that soil-applied copper may not work in a dry first season, because it stays in the dry surface layer, and it tells minimum- and zero-till growers on deficient land to consider thorough cultivation to mix it in [1]. On a direct-seeded field, the build's economics depend on a tillage pass the grower does not otherwise make, and the foliar line in the table is the realistic one.
It is a wheat, barley and flax input, not a canola or corn input. Alberta's response ranking puts wheat, flax and canary seed high, barley medium to high, oats and corn medium, and canola, rye and forage grasses low. Its sensitivity order is winter wheat, spring wheat, flax, barley, oats, peas, triticale, then rye [1]. Alberta also reports that canola has neither shown deficiency symptoms nor responded to copper on soils very deficient for wheat or barley [1]. The Fertilizer Institute's table puts canola among the least responsive crops and corn in the middle group [8]. Minnesota does not recommend copper on mineral soils at all, because a yield response there has not been measured [4]. For corn, Minnesota's ear-leaf tissue thresholds at silking (under 2.0 ppm deficient, 2.0 to 5.0 low) [4] are the diagnostic. Copper should go into a corn program only on a low tissue reading, not as insurance. In a canola-wheat rotation, a build applied ahead of canola costs the same and, on the residual record above, should still be there for the wheat.
It is not a seed treatment. Manitoba's soil fertility specialist warned that seed-placed copper sulfate can injure the seed at more than 1 lb of copper an acre (Western Producer, Apr 28, 2005) [9]. Saskatchewan found seed-placed sulfate and oxysulfate ineffective [6]. The Tofield seed-row result in section 2 is the exception in the record, not the rule [1]. The Fertilizer Institute notes that high copper rates banded near the seed raise the risk of root injury [8].
It cannot be undone. Minnesota's caution is that annual applications should stay well under 40 lb of copper an acre, because toxicity is difficult to correct [4]. A one-time 5- to 10-lb build is far below that. Repeating one every year because the soil test was never rerun is how a field gets there.
| Situation | Our read |
|---|---|
| Wheat, durum or barley; sandy, under 2% organic matter or calcareous; DTPA under 0.4 ppm; tilled | Fall broadcast 3.5–5 lb Cu as copper sulfate, incorporated. Bulk blend if available |
| Same soils, 0.4–0.8 ppm, or a history of ergot, melanosis or head bending | Diagonal 10-lb strip this fall; read it over two cereal crops before treating the field |
| Same soils, direct-seeded with no tillage planned | Foliar copper at stem elongation in each cereal year; tank-mix to avoid a pass |
| Peat or muck in Minnesota or Manitoba, DTPA under 2.5 ppm | 6–12 lb Cu broadcast and incorporated, per Minnesota |
| Canola, or corn on Upper Midwest mineral soils | No copper without a low tissue test |
| Any soil over 1.0 ppm DTPA mineral, or over 5.0 ppm on peat | Nothing |
Source: Crop Root Zone decision rule, drawing on [1][2][4][5][6][7][8]. The 0.8 ppm line is ours, taken from the Prairie trial bands [8]; no province publishes it.
Ground Truth: Copper is mostly a mapping problem. North Dakota calls copper on its sandy, low-organic-matter soils a site-specific exercise because those soils are spotty [2]. Alberta says up to half of a variable field averaging 1 ppm could still be deficient [1]. A field-average soil test and a whole-field rate both put copper where it is not needed and miss the knolls where it is. The cheapest copper program in the region is a 5-lb rate on the eroded sandy zones only. Those zones are often 15% to 30% of a field, which is our estimate, not a measured figure. That cuts the per-acre cost of the build to roughly $9 to $18 at the co-op bag price. The soil test sampling to make that map is worth more than any price negotiation on the copper.
References
- Solberg, E.; Evans, I.; Penny, D., "Copper Deficiency: Diagnosis and Correction," Agri-Facts Agdex 532-3, Alberta Agriculture, Food and Rural Development, Sep 1999 — https://www1.agriculture.alberta.ca/$department/deptdocs.nsf/all/agdex3476/$file/532-3.pdf
- North Dakota State University, "Copper Nutrition in North Dakota Crops," chapter 24 of the NDSU soil fertility e-book (PDF generated Mar 16, 2026), accessed Oct 26, 2026 — https://www.ndsu.edu/agriculture/sites/default/files/ebook/Franzen/Chp_24.html
- Franzen, D.W.; McMullen, M.V.; Mosset, D.S., "Spring Wheat and Durum Yield and Disease Responses to Copper Fertilization of Mineral Soils," Agronomy Journal 100(2):371–375, 2008 (abstract figures as returned by search index; the publisher page returned HTTP 403 and the NDSU-hosted copy did not resolve on Oct 26, 2026) — https://doi.org/10.2134/agronj2007.0100
- Rehm, G.; Schmitt, M., "Copper for Crop Production," FS-6790-A, Minnesota Extension Service, University of Minnesota, 1997 (read from the University Digital Conservancy; the current Extension web page returned HTTP 403 on Oct 26, 2026) — https://conservancy.umn.edu/server/api/core/bitstreams/5e0dee7c-a57d-4e48-ac1f-84eb27255c9a/content
- Heard, J., "Copper Deficiency in Wheat," Manitoba Agriculture, undated, citing Karamanos, R.E.; Pomarenski, Q.; Goh, T.B.; Flore, N., Canadian Journal of Plant Science 84:47–56, 2004 — https://gov.mb.ca/agriculture/crops/seasonal-reports/pubs/copper-deficiency-in-wheat.pdf
- Flaten, P.L.; Karamanos, R.E.; Walley, F.L., "Copper Fertilization of Wheat on Soils with Marginal Copper Levels," Soils and Crops Workshop, University of Saskatchewan, 2003 (abstract) — https://harvest.usask.ca/items/5f07fd5f-b7c1-4ea9-9df6-244444376e09/full
- Malhi, S.S.; Karamanos, R., poster 155-8, 18th World Congress of Soil Science, Jul 15, 2006 (abstract) — https://crops.confex.com/crops/wc2006/techprogram/P11245.HTM
- The Fertilizer Institute, "Copper," Essential Elements fact sheet originally developed by the International Plant Nutrition Institute, posted Jan 2024 (source of our summary of Karamanos et al., Canadian Journal of Soil Science 83:213–221, 2003, which we did not read) — https://www.tfi.org/wp-content/uploads/2024/01/tfi-copper.pdf
- Bell, I., "Winter Wheat Crop Needs Copper," The Western Producer, Apr 28, 2005 — https://www.producer.com/news/winter-wheat-crop-needs-copper/
- USDA AMS Livestock, Poultry and Grain Market News and Minnesota Department of Agriculture, Minneapolis Daily Grain Report, Oct 23, 2026 (final) — https://www.ams.usda.gov/mnreports/ams_3046.pdf
- Reporte Minero, LME copper price report, Oct 21, 2026 — https://www.reporteminero.cl/noticia/noticias/2026/10/precio-cobre-retroceso-diario-bolsa-londres-655-centavos-dolar
- IMARC Group, "Copper Sulphate Prices, Trend, Chart … Report 2026 Edition" (USA, $3,119/MT in Sep 2026; $2,594/MT in Sep 2025), accessed Oct 26, 2026 — https://www.imarcgroup.com/copper-sulphate-pricing-report
- Michigan Milk Producers Association, "Copper Sulfate," item 1131, 50-lb bag of 99% copper sulfate pentahydrate, $132.77, accessed Oct 26, 2026 — https://www.mimilk.com/product/copper-sulfate/
- Custom Hydro Nutrients, "Chem One Copper Sulfate Fine Crystals 25% Cu 50 lb," $176.39 plus $39 UPS hazmat fee, listed as sold out; as indexed by search, Oct 26, 2026 — https://customhydronutrients.com/Copper-Sulfate-fertilizer-50-lb-CHEM-ONE-FINES_p_23081.html
- Custom Hydro Nutrients, "Copper Sulfate fertilizer 50 lb. (Small Granule)," $209.75 plus $33 hazmat fee; as indexed by search, Oct 26, 2026 — https://customhydronutrients.com/Copper-Sulfate-fertilizer-50-lb-SMALL-GRANULE_p_24224.html
- Hydrobuilder, "MicroSource EDTA Chelated Copper 7.5%, 2.5 Gallons," sale price $128.41; as indexed by search, Oct 26, 2026 — https://hydrobuilder.com/products/microsource-edta-chelated-copper-7-5-2-5-gallons
- Kugler Company, "7.5% Copper EDTA" product label (7.5% Cu; 10.5 lb per gallon) — https://www.kuglercompany.com/images/tech_sheets/2014/75copperedta.pdf
- AgWeb, "Iowa State Releases 2024 Custom Farming Rate Data" (dry bulk fertilizer application, $7.25 an acre average; as summarized by search index, the page returned HTTP 403 on Oct 26, 2026) — https://www.agweb.com/news/business/farmland/iowa-state-releases-2024-custom-farming-rate-data
- Crop Root Zone, TRZ-0149, "Zinc Hit a Four-Year High in a Market Running a 120,000-Tonne Surplus. The Metal in a Pound of Zinc Sulfate Now Costs 88% of What the Whole Product Used To.," Sep 1, 2026.
Disclosures
Crop Root Zone is an independent publication. Nothing here is investment advice. Market calls, where included, reflect the editors' own read and are not a recommendation to buy or sell any security.
KTS Prices Potash at $1.12 to $1.69 a Pound Once Its Sulfur Is Credited, Against 42 Cents in Muriate. A 4-Gallon Corn Starter Has to Return 2 to 4 Bushels to Pay.
The last public KTS price is Green Markets' $715 a ton FOB in the Eastern Corn Belt, from May 2025, so we model KTS at $715 to $1,000. Against October 2026 potash and Oklahoma ATS, the same potash and sulfur cost $1.60 to $2.90 an acre more in a 3-quart pop-up, $8.60 to $15.50 more in a 4-gallon 2x2 starter and $21 to $39 more in a 10-gallon band. Both programs deliver the same sulfur, so only the placement of the potassium can pay that premium. We found no university trial that has measured a placement benefit for KTS.
Potassium thiosulfate is a clear liquid that delivers potassium and sulfur in the same pass that places the seed. Tessenderlo Kerley's application guide gives the grade as 0-0-25-17S at 12.2 pounds a gallon. That is 3.05 pounds of K2O and 2.07 pounds of sulfur per gallon, or 500 pounds of K2O and 340 pounds of S in each 164-gallon ton (Tessenderlo Kerley, rev. Aug 2015) [11]. The same nutrients are cheap in dry form this fall. DTN's retail potash averaged $503 a ton in the second week of October, 3% above a year ago (DTN, Oct 21, 2026) [1]. Oklahoma distributors asked $415 for ATS on October 16 (USDA AMS, Oct 16, 2026) [3]. Earlier pieces priced ammonium sulfate, ATS and polyhalite against each other [25][26]. This one asks a narrower question. What does KTS charge for its potash and sulfur compared with muriate plus a sulfur source? What yield gain would cover the difference? Section 1 assembles the prices, Section 2 splits the KTS price between its two nutrients, Section 3 reviews the trials, Section 4 sets the break-even yields, and Section 5 covers the cases where the premium could pay.
1. The price inputs: dry potash and sulfur are public, KTS mostly is not
What's new: Potash and sulfur-source prices for October 2026 are well documented. KTS prices are not. USDA's state production cost reports and DTN's weekly survey do not carry a KTS line. Neither does the one co-op price list we found that posts ATS and AMS. The latest KTS price visible without a subscription is a Green Markets headline from May 2, 2025: "The potassium thiosulfate market was unchanged at $715/st" in the Eastern Corn Belt [8]. On January 17, 2025, the same service had it at $675/st FOB [7]. An April 10, 2026 Green Markets item says California KTS offers rose $8 a short ton, but the price level is behind the paywall [9]. Retail list prices exist only for small jugs. They do not tell us what a farm pays for bulk product, so we do not use them.
Evidence: To compare the sources, we take out each one's nitrogen at local liquid or dry N prices, as TRZ-0290 did [25]. ATS is 12-0-0-26S, so a ton has 240 pounds of N and 520 of S. Ammonium sulfate is 21-0-0-24S, with 420 pounds of N and 480 of S. ATS nitrogen is credited at the panel's UAN28 price per pound of N, and ammonium sulfate nitrogen at the urea price.
| Product and panel | Date | $/ton | Nutrient basis | Net $/lb nutrient | Basis |
|---|---|---|---|---|---|
| Potash, DTN national retail | Oct 12–16, 2026 | 503 | 1,200 lb K2O | 0.419 K2O | Delivered, retail |
| Potash, Illinois white 0-0-62 | Oct 16, 2026 | 515.00 | 1,240 lb K2O | 0.415 K2O | Distributor ask, FOB |
| Potash, Oklahoma | Oct 16, 2026 | 501.18 | 1,200 lb K2O | 0.418 K2O | Distributor ask, FOB |
| Potash, Bartlett Co-op | Oct 9, 2026 | 515.00 | 1,200 lb K2O | 0.429 K2O | Posted co-op price |
| Potash, Pacific Northwest | Oct 16, 2026 | 690.00 | 1,200 lb K2O | 0.575 K2O | Distributor ask, FOB |
| ATS, Oklahoma | Oct 16, 2026 | 415.00 | 520 lb S, net of N | 0.452 S | Distributor ask, FOB |
| ATS, Bartlett Co-op | Oct 9, 2026 | 370.00 | 520 lb S, net of N | 0.365 S | Posted co-op price |
| AMS, Oklahoma | Oct 16, 2026 | 553.00 | 480 lb S, net of N | 0.545 S | Distributor ask, FOB |
| AMS, Bartlett Co-op | Oct 9, 2026 | 575.00 | 480 lb S, net of N | 0.603 S | Posted co-op price |
| KTS, Eastern Corn Belt | May 2, 2025 | 715 | 500 lb K2O + 340 lb S | see Section 2 | FOB, Green Markets |
| KTS, 2026 retail | Oct 2026 | 850–1,000* | 500 lb K2O + 340 lb S | see Section 2 | Delivered, retail* |
Source: DTN/Progressive Farmer, Oct 21, 2026 [1]; USDA AMS Production Cost Reports for Illinois, Oklahoma and the Pacific Northwest, Oct 16, 2026 [2][3][4]; Bartlett Co-op fertilizer price list, prices dated Oct 9, 2026 [6]; Green Markets, May 2, 2025 [8]. Nitrogen credits: Oklahoma UAN28 $420.10 and urea $638.08 (USDA AMS, Oct 16, 2026) [3]; Bartlett UAN28 $420.00 and urea $625.00 [6]. Crop Root Zone calculations. *Estimate: no public 2026 KTS price level exists. We take the 2025 FOB print as a floor. Our $850 and $1,000 scenarios add freight, the retail margin and 2026's price increases. For scale, ATS went from Green Markets' $285 to $320 FOB in the Eastern Corn Belt in February 2025 [10] to $370 to $415 at retail this October.
Oklahoma's ATS sulfur, at 45.2 cents a pound net of nitrogen, matches the figure in TRZ-0290 [25]. The Bartlett list gives a lower figure, 36.5 cents. Ammonium sulfate costs 54 to 60 cents. The potash is the more consistent number: all four Midwest and Plains readings fall between 41.5 and 42.9 cents a pound of K2O. Western panels pay 55 to 58 cents, as the Inter-Mountain West's $662.50 shows (USDA AMS, Sep 29, 2026) [5].
2. What a pound of K2O and a pound of S cost inside KTS
What's new: KTS sells as one product, so its price has to be split between the two nutrients. There are two ways to split it. One credits the sulfur at the price of the cheapest liquid sulfur, ATS, and treats the rest as the price of the potash. The other credits the potash at the price of muriate and treats the rest as the price of the sulfur. Each method gives the KTS buyer the benefit of the doubt on one nutrient.
Evidence: At the May 2025 FOB price of $715, crediting 340 pounds of S at Oklahoma's 45.2 cents leaves $561 for 500 pounds of K2O, or $1.12 a pound. That is 2.7 times DTN's retail muriate. At our $850 and $1,000 retail scenarios, the potash costs $1.39 and $1.69 a pound. The other split gives the same picture. Crediting the K2O at 41.9 cents leaves the sulfur in KTS at $1.49, $1.88 and $2.32 a pound at $715, $850 and $1,000. Oklahoma ATS delivers sulfur for 45.2 cents.
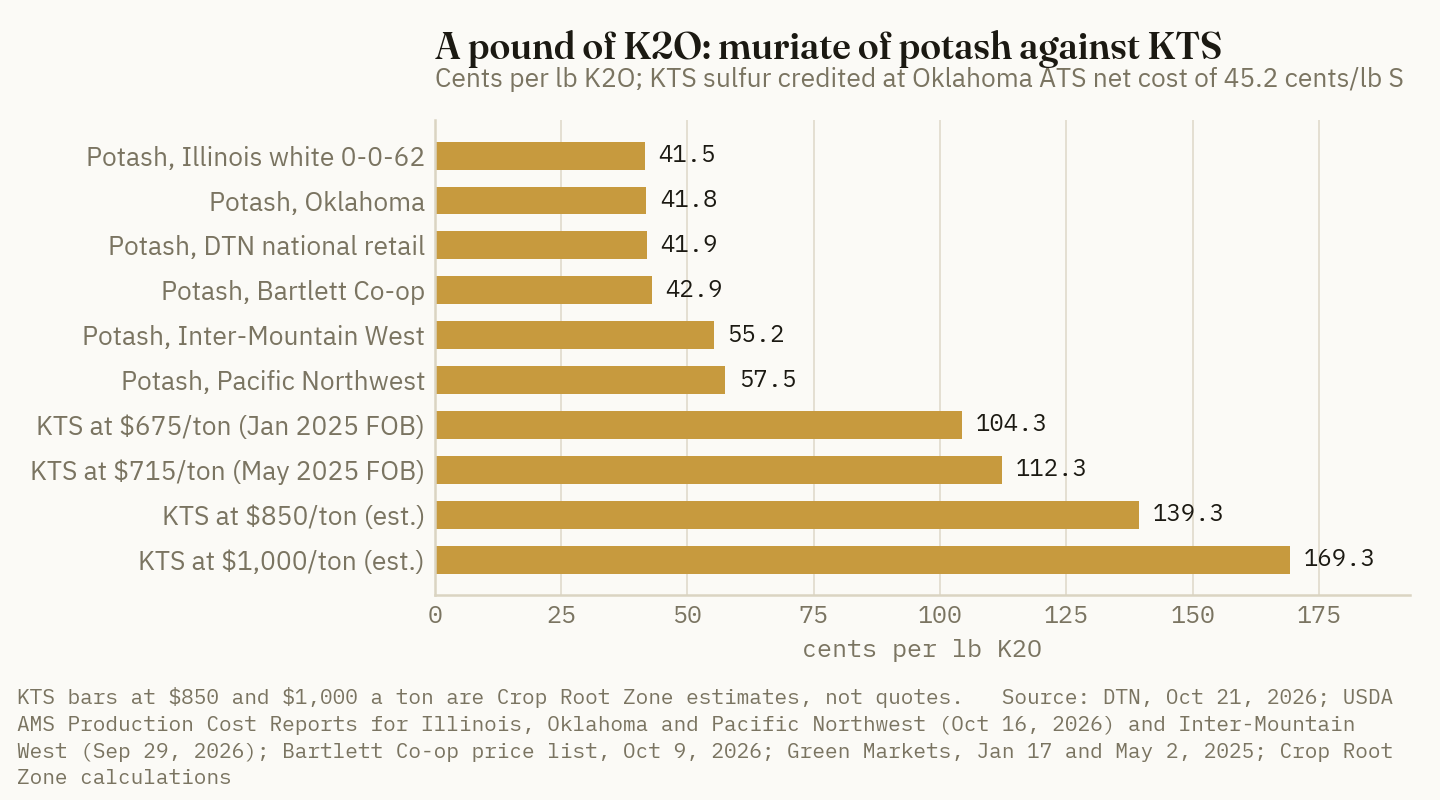
Another way to see the gap is to buy the same nutrients separately. A ton of KTS supplies 500 pounds of K2O and 340 of S. Buying 500 pounds of K2O as DTN retail muriate and 340 pounds of S as ATS costs $334 to $363, depending on whether Bartlett or Oklahoma supplies the ATS. Using ammonium sulfate for the S raises that to $395 to $415. Before freight, the KTS ton at $715 costs about twice as much.
$1.12 a pound of K2O
The potash in KTS at Green Markets' last public $715-a-ton print, after its sulfur is credited at Oklahoma's October ATS cost. DTN's October retail muriate is 41.9 cents. (Crop Root Zone calculation from Green Markets, May 2, 2025; USDA AMS, Oct 16, 2026; DTN, Oct 21, 2026)
The comparison gives the KTS nitrogen-free sulfur no extra value, and that is fair for corn. A corn planter that carries KTS normally also carries 10-34-0 or UAN. The ATS route supplies 240 pounds of N per ton along with the sulfur, and that N goes to use, so we credit it. If a grower has no use for the extra N, as with soybeans, the gross ATS price of 79.8 cents a pound of S is the right comparison. At that price the KTS ton's alternative cost rises to about $481, and the gap at $715 narrows to $234.
3. What the trials say: injury limits, small starter effects, no KTS yield data
What's new: We looked for university trials that compare KTS with an equal amount of potash and sulfur from dry or ATS sources. We found none for corn, soybeans or potatoes. What exists falls into three groups. There are salt-injury and seed-placement limits. There are general starter-response trials. And there are a few small KTS treatments that showed no yield difference.
Evidence:
| Study | Crop, placement | What was measured | Result |
|---|---|---|---|
| SDSU decision aid (Gelderman, 2007) | 13 crops, seed-placed | 219 crop × fertilizer studies; stand loss per lb | Corn guideline: 17 lb/a of 0-0-60 with the seed; soybean: none. KCl and N among the least safe |
| Univ. of Minnesota greenhouse (Kaiser, 2013) | Corn, seed-placed | Emergence and plant mass | ATS alone: "no rate could be safely applied"; KTS "did not appear to have the same effect as ATS"; use low-end rates |
| UW-Madison (Laboski, 2015) | Corn, in-furrow | Rule of thumb | No more than 10 lb/a N + K2O in-furrow on any soil |
| NDSU Carrington (Endres and Ostlie, 2013) | Corn, in-furrow, 1 gal/a KTS | Stand, yield | 42,166 vs 39,177 plants/a; 84.8 vs 84.9 bu/a; neither significant (LSD 8.0 bu) |
| Purdue (Camberato and Nielsen, 2023) | Corn, 55 trials 2014–2022 | 2x2 and pop-up N starter | 2x2: about 7 bu/a when it responded, less than half the time; pop-up: 1 gain and 2 losses |
| Iowa State strip trials (Sawyer et al., 2009) | Corn, broadcast S | Sulfur response | 6 of 11 sites responded; average +9 bu/a (5–13) |
Source: Gelderman, 2007 [12]; Kaiser, Apr 15, 2013 [13]; Laboski, Apr 21, 2015 [14]; Endres and Ostlie, 2013 [16]; Camberato and Nielsen, Jan 13, 2023 [15]; Sawyer, Barker and Lang, Mar 22, 2010 [17].
In-furrow. At the label's pop-up rate of 2 to 4 quarts an acre on 30-inch corn [11], KTS adds 1.5 to 3.1 pounds of K2O. That is well inside Wisconsin's 10-pound N + K2O limit [14]. Salt is not the only risk, though. Thiosulfate adds its own. In Minnesota's greenhouse work, Kaiser found no safe rate for ATS alone. Low ATS rates showed up in plant mass even when emergence looked normal. KTS was gentler, but he still advised the low end of the range [13]. Purdue says ammonium thiosulfate should never be placed with the seed [15]. The label itself rules out KTS on legume or small-seeded crops. It also rules out pop-up use when soil moisture is limited or when soil EC is above 1.0 [11]. The only field data we found, NDSU's 2013 dryland trial at 1 gallon in-furrow, showed a slightly higher stand and the same yield as the check. Drought limited yields across the whole trial [16].
Corn starters in general. Purdue's 55 trials are the best guide to what any starter returns. A 2x2 band of 23 to 50 pounds of N gained about 7 bushels when it responded, and it responded less than half the time. Pop-up placement almost never paid [15]. Those were nitrogen starters, so the results set a ceiling on what a planter band can do, not a measure of KTS.
Soybeans. Soybeans are among the crops most sensitive to seed-placed salt, and SDSU's guideline puts no potash with soybean seed [12]. KTS is therefore a 2x2 or banded product on soybeans, never an in-furrow one. Minnesota's 2022–2025 timing study adds a point in KTS's favor. Applying 80 pounds or more of K2O as spring muriate just before soybeans cost about 1 bushel compared with a fall application, and it roughly doubled chloride in the leaf tissue (UMN Extension, May 14, 2026) [18]. KTS contains no chloride. But a 10-gallon KTS band supplies only 30 pounds of K2O, so it cannot replace a full spring potash rate. Michigan State tested 1 gallon of foliar KTS at R1 in 2014 and found no yield gain at any location, according to the search-indexed text of its extension article [21].
Potatoes. Potatoes are where KTS is most firmly established. NDSU's potato guide, written with Minnesota's Carl Rosen, lists ammonium or potassium thiosulfate as a preferred liquid sulfur source at 15 to 25 pounds of S an acre. It must be placed in a band separated from the seed piece or applied through fertigation, and the guide says thiosulfate "should never come in contact with the seed piece." It also notes that muriate has a high salt index, and that in-season potassium lowers specific gravity more than preplant potassium (Goettl et al., 2021) [19]. Potato potassium needs run up to 400 pounds of K2O. At 3 pounds a gallon, KTS is a supplement on potatoes, not the main potassium source. Tessenderlo Kerley reports a University of Idaho comparison in which 25 pounds of K through KTS out-yielded eight times as much through KCl. It also reports a 44% gain on a Washington grower's field [20]. The company sells KTS, the page gives no yield figures for the Idaho trial, and we could not find the Idaho report. We treat both as unverified.
Ground Truth: Sulfur responses are real. Iowa State found them at more than half its sites, worth 9 bushels on average. But they cannot justify KTS, because ATS in the UAN tank delivers the same sulfur for 45 cents a pound instead of $1.49 or more. The only thing a KTS program buys that the dry-plus-ATS program does not is potassium placed close to the row, without chloride. On soils that test adequate in K, the trials give no reason to expect a response to that. A grower looking at a KTS starter quote should ask a narrower question than "does starter pay?" The question is what the in-row potassium adds that broadcast muriate and ATS do not.
4. The break-even: bushels a KTS program has to add
What's new: We priced three common KTS programs against the same pounds of K2O and S bought as DTN retail muriate and Oklahoma ATS. The programs are a 3-quart corn pop-up, a 4-gallon 2x2 starter and a 10-gallon sidedress or surface band. We then divided the extra cost by October 22 grain prices. December corn closed at $4.605 and November soybeans at $12.53 (Brownfield, Oct 22, 2026) [22]. Iowa's average cash bids were $4.17 for corn and $11.83 for soybeans (USDA AMS, Oct 22, 2026) [23].
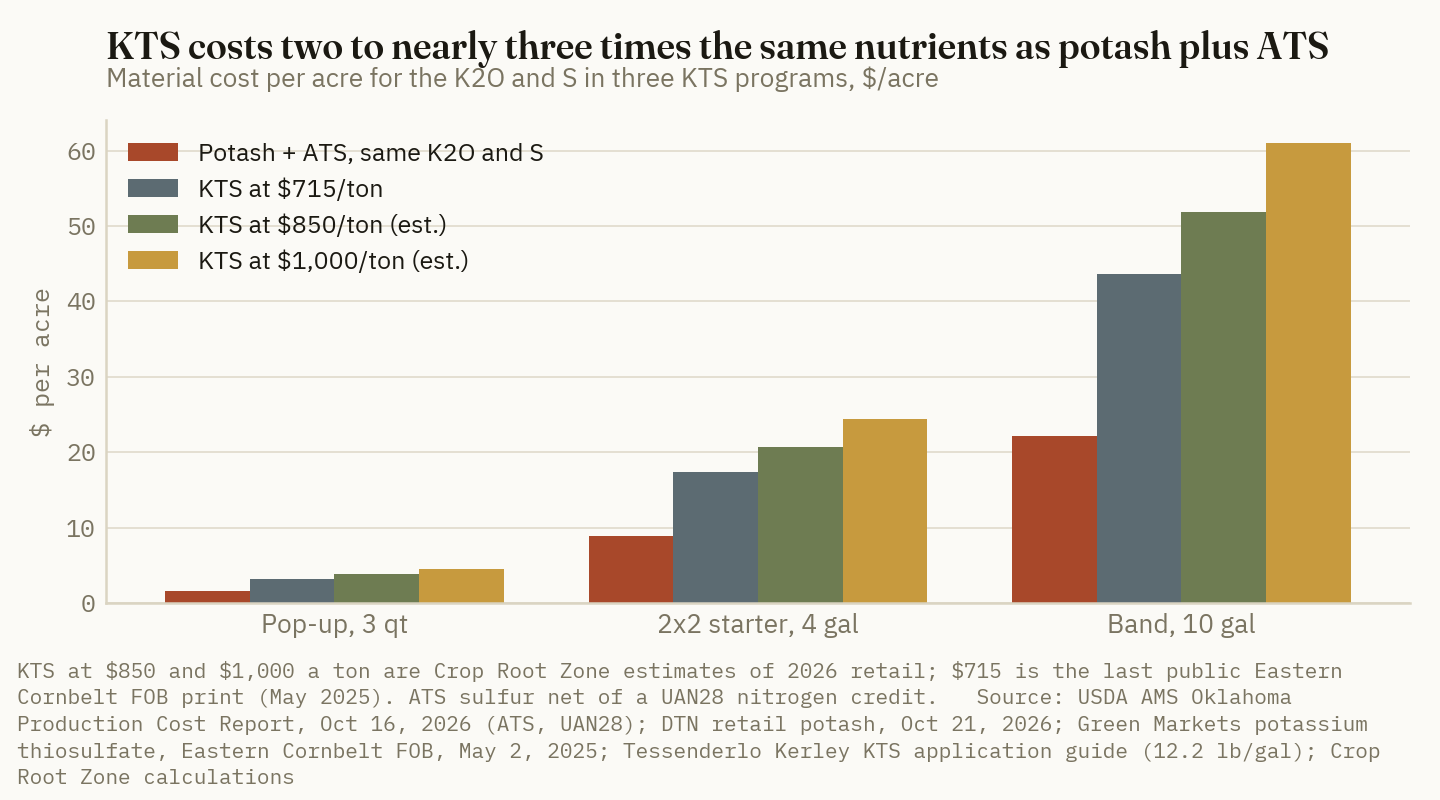
Evidence:
| Program, KTS price | KTS $/acre | Extra cost vs potash + ATS, $/acre | Corn bu at $4.17 cash | Corn bu at $4.605 Dec | Soy bu at $11.83 cash | Soy bu at $12.53 Nov | Corn bu, cash |
|---|---|---|---|---|---|---|---|
| Pop-up 3 qt, $715 | 3.27 | 1.61 | 0.39 | 0.35 | — | — | ░░░░░░░░░░ |
| Pop-up 3 qt, $850* | 3.89 | 2.23 | 0.53 | 0.48 | — | — | █░░░░░░░░░ |
| Pop-up 3 qt, $1,000* | 4.57 | 2.91 | 0.70 | 0.63 | — | — | █░░░░░░░░░ |
| 2x2 4 gal, $715 | 17.44 | 8.58 | 2.06 | 1.86 | 0.73 | 0.68 | ██░░░░░░░░ |
| 2x2 4 gal, $850* | 20.73 | 11.87 | 2.85 | 2.58 | 1.00 | 0.95 | ███░░░░░░░ |
| 2x2 4 gal, $1,000* | 24.39 | 15.53 | 3.72 | 3.37 | 1.31 | 1.24 | ████░░░░░░ |
| Band 10 gal, $715 | 43.60 | 21.44 | 5.14 | 4.66 | 1.81 | 1.71 | ██████░░░░ |
| Band 10 gal, $850* | 51.83 | 29.67 | 7.12 | 6.44 | 2.51 | 2.37 | ████████░░ |
| Band 10 gal, $1,000* | 60.98 | 38.82 | 9.31 | 8.43 | 3.28 | 3.10 | ██████████ |
Source: Crop Root Zone calculations from DTN, Oct 21, 2026 [1]; USDA AMS Oklahoma, Oct 16, 2026 [3]; Green Markets, May 2, 2025 [8]; Tessenderlo Kerley guide [11]; Brownfield, Oct 22, 2026 [22]; USDA AMS Iowa Daily Cash Grain Bids, Oct 22, 2026 [23]. *KTS price is a Crop Root Zone estimate. Material cost only. Both programs are assumed to ride on passes the farm already makes: the KTS on the planter or sidedress rig, the muriate in a fall broadcast and the ATS in the UAN. Using Bartlett ATS, or ammonium sulfate in place of ATS, moves the extra cost on a 4-gallon starter between $1.26 lower and $0.71 higher. Soybean pop-up is left blank because the label rules out KTS on legume seed [11]. Bars scale the cash corn bushels; 9.31 = 10.
For corn, the 4-gallon starter is the program that matters. It has to return about 2 to 4 bushels an acre more than broadcast muriate plus ATS. Purdue's 2x2 nitrogen starters gained about 7 bushels when they responded, and they responded less than half the time [15]. A KTS-only band has no nitrogen effect to call on. And the potassium effect it would need has never been isolated in a public trial. The 10-gallon band needs 5 to 9 bushels of corn or 2 to 3 bushels of soybeans. That is the same order as a full sulfur response, but the ATS route gets that response anyway. The pop-up costs less than a bushel. It is a cheap bet, but it delivers 2 pounds of K2O, which is nothing in nutritional terms, and the trials show stand risk and no yield gain.
5. Where the premium can pay, and what to check before booking
What's new: Under some conditions the KTS premium shrinks or disappears. The largest is a trip saved. Iowa State's 2025 custom rate survey put liquid fertilizer spraying at about $9 an acre (Strip-Till Farmer, Apr 21, 2025) [24]. On a farm that would otherwise spray ATS or broadcast potash in a separate pass just for this crop, a planter-mounted KTS starter at $715 costs about the same as the separate pass, and at $1,000 it is still about $6.50 an acre more. Western growers pay 55 to 58 cents for muriate [4][5], so their potash credit runs about 15 cents a pound higher than the Midwest's. That lowers the gap by about $1.90 an acre on a 4-gallon starter, which is not enough to change the answer.
Evidence: Three operating points from the label narrow the uses further [11]. KTS blends with 10-34-0 in any ratio, and the guide gives a 6-21-6-4S starter recipe: 1,235 pounds of 10-34-0, 480 of KTS and 285 of water per ton. Mixed with UAN, it forms potassium nitrate crystals in cold weather unless water at least equal to the KTS or UAN weight is added. It decomposes below pH 6, so it cannot go into acidified blends, and the label advises against using it on soils with pH below 6.0. Each of these affects whether KTS actually rides on a pass the farm already makes, and that is the condition the economics depend on.
Ground Truth: KTS pays in three situations. In potatoes, specialty crops and other chloride-sensitive crops, the absence of chloride has a price and a 2x2 or fertigation band is the normal way to apply nutrients. In a corn starter, it pays when the KTS removes a field pass and does not merely add product to one. On soybeans, it may pay where the alternative is a heavy spring dose of muriate, though no trial has yet tested that use. In a standard Corn Belt program that already broadcasts muriate and puts ATS in the UAN, a 4-gallon KTS starter is paying 2 to 4 bushels for potassium the crop already has. Ask the dealer for KTS priced per pound of K2O after the sulfur is credited at their own ATS price. If the answer is under about 80 cents, the 2x2 starter's break-even falls below 1.5 bushels and is worth a strip trial. If it is above a dollar, the premium has to come from a saved pass.
The decisive input is still unpublished: what KTS costs at retail this fall. The 2025 Green Markets prints are the last public price levels. The April 2026 item shows prices moving but not where they stood [9]. Until a state cost report or a dealer list publishes a KTS line, each grower's own quote is the only current number. Convert that quote to a price per pound of K2O, as in the Ground Truth above, before booking.
References
- DTN/Progressive Farmer, "DTN Retail Fertilizer Trends: UAN32, UAN28, Anhydrous Lead Prices," Oct 21, 2026 (potash $503/ton, week of Oct 12–16, 2026; UAN28 $0.79/lb N) — https://www.dtnpf.com/agriculture/web/ag/crops/article/2026/10/21/uan32-uan28-anhydrous-lead-prices
- USDA AMS Livestock, Poultry and Grain Market News, Illinois Production Cost Report (Bi-weekly), Oct 16, 2026 (Potash, White 0-0-62, ask $480–$550, average $515.00, FOB) — https://www.ams.usda.gov/mnreports/ams_3195.pdf
- USDA AMS Livestock, Poultry and Grain Market News, Oklahoma Production Cost Report (Bi-Weekly), Oct 16, 2026 (ATS $370–$450, avg $415.00; ammonium sulfate avg $553.00; potash avg $501.18; UAN28 avg $420.10; urea avg $638.08; FOB) — https://ams-prod.azureedge.us/mnreports/ams_3621.pdf
- USDA AMS Livestock, Poultry and Grain Market News, Pacific Northwest Production Cost Report (Bi-Weekly), Oct 16, 2026 (Potash, Red 0-0-60, avg $690.00, FOB) — https://ams-prod.azureedge.us/mnreports/ams_3657.pdf
- USDA AMS Livestock, Poultry and Grain Market News, Inter-Mountain West Production Cost Report (Monthly), Sep 29, 2026, week ending Oct 2, 2026 (Potash, Red 0-0-60, avg $662.50, FOB) — https://ams-prod.azureedge.us/mnreports/ams_3883.pdf
- Bartlett Co-op, Fertilizer Prices (urea $625, potash $515, AMS $575, UAN28 $420, ATS $370 per ton; prices dated Oct 9, 2026), accessed Oct 23, 2026 — https://bartlettco-op.com/index.php/our-products/current-prices/fertilizer-prices?view=fronttable&id=2
- Green Markets (Bloomberg), "Potassium Thiosulfate," Jan 17, 2025, public headline only: Eastern Cornbelt market "remained at $675/st FOB" — https://fertilizerpricing.com/potassium-thiosulfate-175/
- Green Markets (Bloomberg), "Potassium Thiosulfate," May 2, 2025, public headline only: Eastern Cornbelt market "unchanged at $715/st" — https://fertilizerpricing.com/potassium-thiosulfate-190/
- Green Markets (Bloomberg), "Potassium Thiosulfate," Apr 10, 2026, public headline only: California offers "up $8/st"; price level behind paywall — https://fertilizerpricing.com/potassium-thiosulfate-213/
- Green Markets (Bloomberg), "Ammonium Thiosulfate," Feb 21, 2025, public headline only: Eastern Cornbelt "pegged at $285-$320/st" — https://fertilizerpricing.com/ammonium-thiosulfate-392/
- Tessenderlo Kerley, Inc., KTS 0-0-25-17S Application Guide, revised Aug 2015 (12.2 lb/gal, 164 gal/ton; 3 lb K2O and 2.1 lb S per gallon; corn pop-up 2–4 qt/a; 2x2 1–4 gal/a; no seed contact on legumes; starter blend recipes; precautions) — https://assets.greenbook.net/KTS-AppGuide-V9-Pages.pdf
- Ron Gelderman, "Fertilizer Placement with Seed — A Decision Aid," Proceedings of the North Central Extension-Industry Soil Fertility Conference, Vol. 23, Des Moines, Nov 14–15, 2007 — https://northcentralfertility.com/proceedings/?action=download&item=3983
- Daniel Kaiser, University of Minnesota, "How Much Starter Can I Use on My Corn?," No-Till Farmer, Apr 15, 2013 — https://www.no-tillfarmer.com/articles/2105-how-much-starter-can-i-use-on-my-corn
- Carrie Laboski, UW-Madison Integrated Pest and Crop Management, "Safe rates of seed placed starter fertilizer," Apr 21, 2015 — https://ipcm.wisc.edu/blog/2015/04/safe-rates-of-seed-placed-starter-fertilizer
- Jim Camberato and Bob Nielsen, Purdue University, "Corn Response to Starter Fertilizer in Indiana," Pest&Crop Newsletter, Jan 13, 2023 — https://extension.entm.purdue.edu/newsletters/pestandcrop/article/corn-response-to-starter-fertilizer-in-indiana-2/
- Greg Endres and Mike Ostlie, NDSU Carrington Research Extension Center, "Corn response to in-furrow fertilizer and growth regulators, Carrington, 2013" — https://www.ag.ndsu.edu/carringtonrec/archive/documents/agronomyrd/docs2013/corn13-if-reptab.pdf
- John Sawyer, Daniel Barker and Brian Lang, Iowa State University, "Summary of Sulfur Strip Trials Conducted in Central and Northeast Iowa, Preliminary 2009 Results," Mar 22, 2010 — https://www.agronext.iastate.edu/soilfertility/info/2009SulfurStripTrialPrelReport.pdf
- University of Minnesota Extension Crop News, "Does spring application of potash impact soybean yield?," May 14, 2026 — https://blog-crop-news.extension.umn.edu/2026/05/does-spring-application-of-potash.html
- Brady Goettl, Andrew Robinson, David Franzen and Carl Rosen, "Fertilizing Potato in North Dakota," NDSU Extension SF715, revised Jan 2021 — https://www.ndsu.edu/agriculture/extension/publications/fertilizing-potato-north-dakota
- Victoria Marsh, Tessenderlo Kerley, "KTS — Your Potassium Source Matters, Let's Talk Potatoes," undated manufacturer blog, accessed Oct 23, 2026 — https://www.tessenderlokerley.com/north-america/blogs/kts-your-potassium-source-matters
- Michigan State University Extension, "Foliar fertilizer applications to soybeans are rarely profitable" (2014 potassium thiosulfate R1 trials at four locations); the page returned no text to our fetch, so details are taken from the search-indexed article text, accessed Oct 23, 2026 — https://www.canr.msu.edu/news/foliar_fertilizer_applications_to_soybeans_are_rarely_profitable
- Brownfield Ag News, "Closing Grain and Livestock Futures: October 22, 2026" (Dec corn $4.60½; Nov soybeans $12.53) — https://brownfieldagnews.com/news/closing-grain-and-livestock-futures-october-22-2026/
- USDA AMS / Iowa Department of Agriculture, Iowa Daily Cash Grain Bids, Oct 22, 2026 (state average corn $4.17, soybeans $11.83) — https://www.ams.usda.gov/mnreports/ams_2850.pdf
- Noah Newman, "Custom strip-till rates increase slightly according to 2025 Iowa State survey," Strip-Till Farmer, Apr 21, 2025 (liquid fertilizer spraying about $9/acre) — https://www.striptillfarmer.com/articles/5986-custom-strip-till-rates-increase-slightly-according-to-2025-iowa-state-survey
- Crop Root Zone, TRZ-0290, "Ammonium Sulfate Runs $538 to $813 a Ton Across Five USDA Panels This October. Take Out the Nitrogen and Its Sulfur Costs 52 to 65 Cents a Pound, and Oklahoma's ATS Line Delivers It for 45," Oct 19, 2026.
- Crop Root Zone, TRZ-0177, "Polyhalite Carries Four Nutrients and Is Rated on One. That Tells You What It Actually Is.," Sep 9, 2026.
Disclosures
Crop Root Zone is an independent publication. Nothing here is investment advice. Market calls, where included, reflect the editors' own read and are not a recommendation to buy or sell any security.
A Dry Ton of Biochar at North Carolina's $160-a-Yard Average Has to Return 208 Bushels of Corn. Temperate Field Trials Average a 0.2% Yield Response, and the Nutrients and Lime in a Ton Are Worth About $10.
North Carolina's September 2026 supplier survey puts delivered woody biochar at $66 to $250 a cubic yard, or $396 to $1,500 a dry ton at USDA-ARS's 6.0 yards per ton. At a 4-ton rate that is $1,653 to $6,069 an acre spread, or 46 to 167 bushels of extra corn every year for ten years at $4.70. The largest meta-analysis of field trials finds a 0.2% response in temperate climates. Carbon credits mostly pay the producer. Only the cheapest supply with full NRCS cost share brings the hurdle near a yield gain the trials can show.
North Carolina's Division of Soil and Water Conservation asked biochar suppliers what they charge, and in September 2026 it published the answers. Of eleven suppliers contacted, nine quoted. The seven woody biochars landed in two bands: $66 to $83 a cubic yard delivered, and $200 to $250, with nobody in between. The division recommended a $160-a-yard cost list rate, the mean of all seven (NC Division of Soil and Water Conservation, Sep 2026) [1]. USDA-ARS's conversion for woody biochar is 6.0 cubic yards per dry ton [1]. At the $160 average, a dry ton costs $960 delivered, and about $977 spread. At USDA's October season-average corn price of $4.70 a bushel (USDA WASDE-676, Oct 9, 2026) [10], that ton has to return 208 bushels of corn over its life, or 81 bushels of soybeans at $12.00, before it breaks even, by our calculation. This piece works through what biochar costs, what rate a grower would apply, what yield response would pay for it, what the meta-analyses and North American field trials actually show, and whether nutrients, lime, carbon credits or cost share close the gap. Our earlier piece on biochar's two sales pitches (TRZ-0017, Jul 18, 2026) [21] set out the arguments. This one puts numbers on the break-even.
1. What a ton costs delivered
What's new: The North Carolina survey is the most current public price sheet for bulk agricultural biochar we found. It also explains why per-ton quotes are hard to compare. Biochar holds water. The division's delivery tickets from a western North Carolina producer showed about 2.5 cubic yards per ton as delivered, while ARS's dried analysis of the same material showed 6.0 yards per dry ton [1]. By our arithmetic, one dry ton arrives as about 2.4 tons of wet product. Wakefield Biochar's agricultural-grade specification sheet lists moisture of 50% to 60% at the time of analysis (Wakefield Biochar, PS-1006, Aug 2026) [13]. A "$200 a ton" quote and a "$200 a yard" quote are not close to the same price.
Evidence:
| Supplier, NC survey | Product | As quoted | $/cu yd delivered | $/dry ton | Basis |
|---|---|---|---|---|---|
| 1 | Woody biomass | $200/ton W&C; $225/ton E | 66–75 | 396–450* | Delivered |
| 2 | Forest residue | $300–$500/bone-dry ton | 50–84 | 300–504* | Delivered |
| 3 | Mill residual | $200/ton delivered | 82.50 | 495* | Delivered |
| 4 | Storm-debris hardwood | $200/cu yd + $6 per loaded mile | 200+ | 1,200+* | Plus freight |
| 5 | Certified forest wood | $200–$250/cu yd | 200–250 | 1,200–1,500* | Delivered |
| 6 | Virgin hardwood | $210/cu yd + freight | 210–229 | 1,260–1,374* | FOB plus freight; 104-yd minimum |
| 7 | Riparian hardwood | $200–$300/cu yd by distance | 200–300 | 1,200–1,800* | Delivered, four distance bands |
| Division's proposed rate | Biochar, bulk | Mean of seven woody suppliers | 160 | 960* | Delivered |
| NC bagged quote | 3 cu ft bag | $50 per bag | 450 | 2,700* | Small areas only |
Source: NC Division of Soil and Water Conservation, "Biochar Soil Carbon Amendment: Moving the Cost List to a Cubic Yard Basis," Technical Review Committee presentation, Sep 2026 [1]. The division's chart of the seven woody suppliers puts them at $66, $67, $83, $200, $225, $229 and $250 a yard. *Crop Root Zone conversion at 6.0 cubic yards per dry ton, the USDA-ARS Coastal Plains Research Center factor for cellulosic biochar cited in [1]. Swine-manure biochar ($300/ton FOB, $101–$134/cu yd) is excluded; ARS puts manure biochar at 3.0 yards per dry ton.
The division could not explain the split. It noted that the largest biochar plant in the United States, with more than 200,000 metric tons of annual capacity, delivers into North Carolina at $200 to $250 a yard, the same band as two small storm-debris producers, so scale does not explain it. It listed product grade, market positioning and moisture as possible causes and confirmed none [1]. A University of Nebraska–Lincoln team wrote in September that commercial biochar costs "can still exceed $1,000 per ton" (Fossum et al., UNL CropWatch, Sep 1, 2026) [3]. That is consistent with the upper band.
The rate. North Carolina's planning example is 4 dry tons an acre, or 24 cubic yards [1]. That sits near the top of the useful range. The largest field meta-analysis found that rates above 10 tonnes a hectare, about 4.5 short tons an acre, added no further yield, at least in the short term (Ye et al., Soil Use and Management, 2020) [5]. We use 4 dry tons as the base case. The North Carolina cost-share draft requires a site-specific plan, soil tests before and one year after application, and a lab analysis of the biochar before it goes on (NC Soil and Water Conservation Commission, agenda item 9A, Sep 2026) [2].
2. What a ton has to return
What's new: At October prices, no plausible yield response pays for biochar at the division's average price within a decade. The cheapest band changes the arithmetic, but not enough on its own.
Evidence: We add spreading at Iowa's 2026 custom rate for loading and spreading solid manure, $7.20 an as-delivered ton (Iowa State University Extension, Mar 2026) [12], or about $17 a dry ton at 2.4 wet tons per dry ton. That is our estimate. No custom-rate survey we found lists biochar.
208 bushels of corn
What one dry ton of woody biochar at North Carolina's $160-a-yard average has to return, delivered and spread, at USDA's $4.70 season-average price. At the low band's $66 a yard it is 88 bushels; at $250, 323. (Crop Root Zone calculation from NC Division of Soil and Water Conservation, Sep 2026; USDA WASDE-676, Oct 9, 2026)
| Price band, $/cu yd | $/dry ton, spread | Corn, bu per dry ton | Soybeans, bu per dry ton | $/acre at 4 dry tons | Corn, bu/acre per year, 10 yr at 5% | Share of 181.2 bu yield |
|---|---|---|---|---|---|---|
| 66, low band | 413* | 88* | 34* | 1,653* | 45.6* | 25%* |
| 83, low band | 515* | 110* | 43* | 2,061* | 56.8* | 31%* |
| 160, NC mean | 977* | 208* | 81* | 3,909* | 107.7* | 59%* |
| 200, upper band | 1,217* | 259* | 101* | 4,869* | 134.2* | 74%* |
| 250, upper band | 1,517* | 323* | 126* | 6,069* | 167.2* | 92%* |
Source: Crop Root Zone calculation. Prices from [1]; spreading from Iowa State University Extension FM 1698, Mar 2026 [12]; corn $4.70/bu, soybeans $12.00/bu and corn yield 181.2 bu/acre from USDA WASDE-676, Oct 9, 2026 [10]. *Calculated. The annual column spreads the per-acre cost over ten equal annual returns discounted at 5%, an annuity factor of 7.72; 5% is our assumption for a grower's cost of capital.
Stretch the horizon and the hurdle falls, but not far. Over 20 years at 5%, the per-acre requirement at the North Carolina mean is 66.7 bushels of corn a year, 37% of USDA's October national yield. At the $66 low band it is 28.2 bushels, 16%. In soybeans at $12.00, the ten-year requirement is 42.2 bushels a year at the mean, 79% of USDA's 53.1-bushel national yield, and 17.8 bushels at the low band [10].
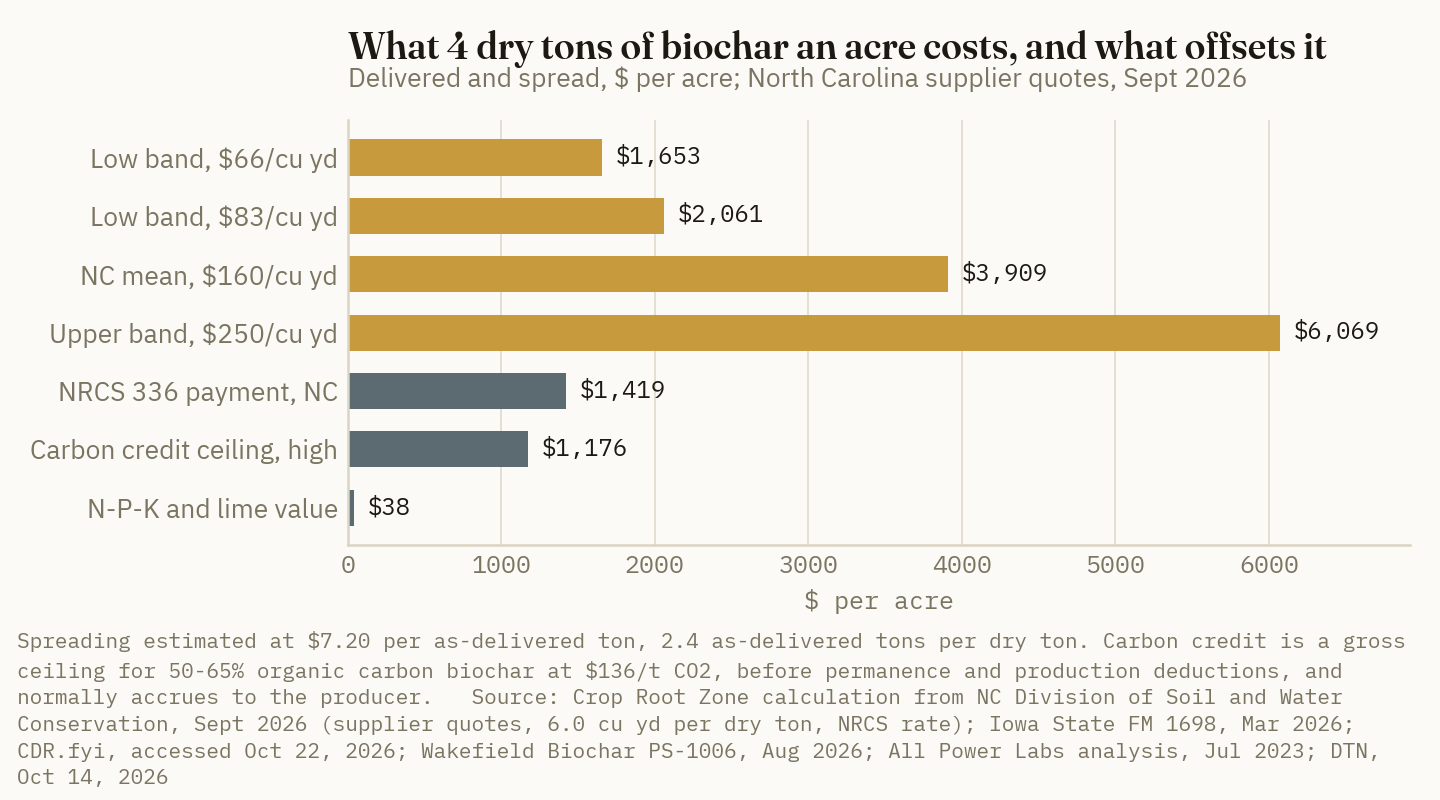
Ground Truth: The price band matters more than any agronomic variable in this calculation. The gap between North Carolina's $66 and $250 quotes is worth 122 bushels of corn a year per acre over ten years, more than the whole response any temperate trial has shown. A grower pricing biochar should get every quote in dollars per dry ton, with the moisture at delivery written on the ticket. If a supplier will not state it, assume the wet-ton price is less than half the cost of the dry ton actually delivered.
3. What the yield trials show
What's new: The most recent North American work adds to an old pattern. UNL's September 2026 report on three Nebraska corn trials found no significant yield effect from biochar at any site. Corn in the check plots made 170, 208 and 162 bushels an acre, at rates of 31 tons an acre of redcedar biochar at two sites and 8 tons an acre at the third [3].
Evidence:
| Study | Design | Yield result |
|---|---|---|
| Ye et al., 2020, meta-analysis | 264 field observations, 64 locations, 24 countries; rates ≤20 t/ha; first-year yields | Continental and humid-temperate climates vs. fertilized control: +0.2% (95% CI −3.1% to +3.8%, n = 51). Tropical and subtropical: +14.8% (n = 127). Biochar alone, no fertilizer: no increase. Rates above 10 t/ha: no added yield |
| Jeffery et al., 2017, meta-analysis | Global, pot and field | No average yield effect in temperate latitudes; about 25% average increase in the tropics, through liming and fertilization |
| UNL, Nebraska, 2022–2025 | Redcedar biochar 31 t/acre (two sites); 8 t/acre (Lincoln) | No significant corn yield effect at any of three sites |
| UNL, Nebraska, 2020–2022 | Wood biochar 2.81–22.5 t/acre, once; corn-soybean | No yield increase at sandy or sloping sites; drought prevented harvest at the semi-arid site |
| Michigan and Ohio, 2020–2022 | Biochar applied fall 2020, three locations | Corn unaffected in 2021; soybean yield up at one of three locations in 2022 |
| Iowa State/USDA-ARS, Boone County, 2008–2012 | Hardwood biochar 9.8 and 18.4 Mg/ha (4.4 and 8.2 t/acre*), stover-harvest trial | +1.7 Mg/ha (27 bu/acre*) averaged on plots with no stover removed; no effect where 50% or 90% of stover was removed |
| Iowa State, APSIM model, 2018 | Calibrated on 11 years of central Iowa data; 0–90 Mg/ha | Modeled corn yield change −2.6% to +0.6% |
Sources: Ye et al., Soil Use and Management 36:2–18, 2020 [5]; Jeffery et al., Environmental Research Letters 12:053001, Apr 25, 2017 [6]; Fossum et al., UNL CropWatch, Sep 1, 2026 [3]; Blanco et al., UNL CropWatch, Sep 10, 2024 [4]; Silva-Pumarada et al., Crop, Forage & Turfgrass Management, Aug 2, 2023, summary only [7]; Rogovska et al., ASA-CSSA-SSSA annual meeting abstract, 2015 [8]; Aller et al., Field Crops Research 227:30–40, 2018, abstract [9]. *Crop Root Zone conversion: 1 Mg/ha = 0.446 short tons/acre; 62.77 kg/ha = 1 bu/acre of corn. We read the Iowa field result as a conference abstract; the 2016 journal version may differ.
Ye and colleagues' paper is the most useful single number for a Corn Belt buyer, because it separates a fertilized control from an unfertilized one. A fertilized control is how a commercial field is farmed. Against it, the temperate response was 0.2%, or about 0.4 bushel on a 181-bushel crop [5][10]. The top of the confidence interval, 3.8%, is about 6.9 bushels. The authors note that woody feedstocks made up 76% of the temperate observations, and that temperate soils have usually received heavy fertilizer and sit closer to their yield potential [5]. That is the situation on most Midwest acres. The same paper found a 31% gain over three or more years in studies that tracked yields after a single application [5]. We did not find that multi-year result broken out by climate in the sections of the paper we read, so we do not apply it to Corn Belt ground.
The best Iowa number is the Boone County result. If the 27-bushel gain on the no-removal plots held every year for five years, it would return about $636 an acre at $4.70, undiscounted. The cheapest North Carolina band would put 4.4 dry tons an acre on for about $1,807 spread, by our calculation. On that most favorable reading, five years of the best Corn Belt response we found pays back about 35% of the cheapest biochar's cost.
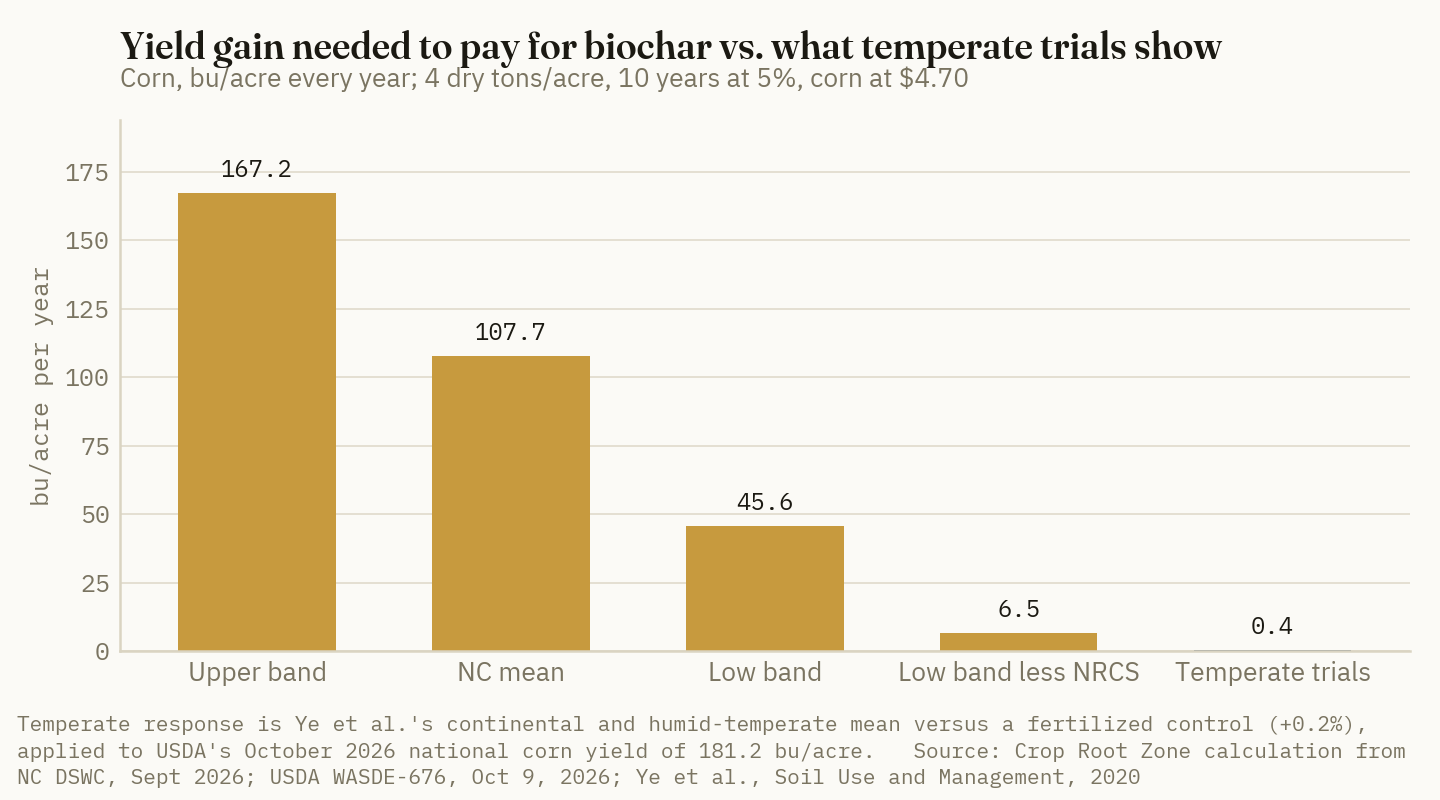
| Scenario, 4 dry tons/acre, 10 yr at 5% | Corn needed, bu/acre/yr | |
|---|---|---|
| Upper band, $250/cu yd | 167.2* | ██████████ |
| NC mean, $160/cu yd | 107.7* | ██████░░░░ |
| Low band, $66/cu yd | 45.6* | ███░░░░░░░ |
| Low band less NRCS payment | 6.5* | ░░░░░░░░░░ |
| Temperate trials, upper CI | 6.9* | ░░░░░░░░░░ |
| Temperate trials, mean | 0.4* | ░░░░░░░░░░ |
Source: Crop Root Zone calculation from [1], [5], [10], [12]. *Calculated. The NRCS payment is the $1,418.71-an-acre rate cited in [1]. Trial rows apply Ye et al.'s temperate mean (+0.2%) and upper confidence limit (+3.8%) to 181.2 bu/acre. Bars scale bushels, 167.2 = 10 blocks; rows under 8.4 bushels round to zero blocks.
Ground Truth: The trials say biochar on fertilized Corn Belt ground behaves like a soil-structure purchase, not a yield purchase. The soil effects UNL measured were real: bulk density down 20% to 50%, surface soil moisture up 20% to 40% at 18 months at one irrigated site, and microbial biomass up 44% to 60% [3]. None of them showed up as bushels in the trials we found. A grower who buys biochar should budget it the way TRZ-0297 told readers to budget compost, as land improvement on a specific problem field, and should not book a yield increase to pay for it. The plausible exceptions are the ones the meta-analyses point to: acid, sandy, low-organic-matter ground that is not already near its yield potential.
4. The nutrients and lime in a ton
What's new: Woody biochar is mostly carbon, and the carbon is what makes it last. The same property means it carries little fertilizer.
Evidence: One published U.S. lab analysis of a high-temperature wood-chip biochar shows 0.53% total nitrogen, 309 mg/kg of phosphorus, 4,151 mg/kg of potassium and a liming value of 8.1% calcium carbonate equivalent (All Power Labs, biochar specification, tested Jul 2023) [14]. A Minnesota Pollution Control Agency compilation of published biochar analyses gives median total phosphorus of 0.0618% and median total potassium of 0.181%, with ranges up to 1.086% P and 1.367% K (MPCA Minnesota Stormwater Manual, accessed Oct 22, 2026) [15]. We price P2O5 at 72.9 cents a pound and K2O at 41.8 cents from DTN's retail averages for October 5–9 (DTN/Progressive Farmer, Oct 14, 2026) [11], and lime at 2.72 cents a pound of effective calcium carbonate (TRZ-0257, Oct 5, 2026) [19], following the method of TRZ-0297 [20].
| Per dry ton | Wood-chip biochar, Jul 2023 | MPCA median | MPCA maximum |
|---|---|---|---|
| Total N, lb | 10.6, credited at 0 | not used | not used |
| P2O5, lb | 1.4* | 2.8* | 49.8* |
| K2O, lb | 10.0* | 4.4* | 32.9* |
| Lime, lb CaCO3 equivalent | 162* | not reported | not reported |
| P2O5 value, $ | 1.03* | 2.07* | 36.30* |
| K2O value, $ | 4.18* | 1.82* | 13.78* |
| Lime value, $ | 4.41* | not reported | not reported |
| Total, $ per dry ton | 9.62* | 3.89* | 50.08* |
Source: Crop Root Zone calculation from All Power Labs [14]; MPCA [15]; DTN/Progressive Farmer, Oct 14, 2026 [11]; TRZ-0257 [19]. *Calculated: elemental P × 2.291 and K × 1.205 to oxide; per 2,000 lb dry. Phosphate and potash at full fertilizer value, an upper bound. We credit no nitrogen; how much biochar nitrogen becomes plant-available is disputed in the literature, and microbial tie-up can push it negative. The MPCA maximums are most likely manure-based biochars.
At about $10 a dry ton, the fertilizer and lime in the wood-chip example are 1% of the North Carolina average price and 2.4% of the cheapest quote. At 4 tons an acre that is about $38. Biochar from manure carries far more phosphorus, but ARS's 3.0 yards per dry ton for manure biochar [1] and North Carolina's rule requiring a nutrient management plan for any manure-derived amendment [2] make it a different purchase. Wakefield's agricultural grade lists 30% to 45% ash on a dry basis and its premium grade 3% to 10% [13]. Ash is where the potassium, calcium and lime value sit, so ask for the ash and liming figures on the certificate of analysis, not just the carbon.
5. Do carbon credits or cost share change the math?
What's new: Biochar is the cheapest durable carbon-removal credit on the market. Puro.earth's CORC Biochar Price Index stood at €124.02 for September 2026, up 6.64% year to date (Puro.earth, accessed Oct 22, 2026) [16]. That is about $142 at the September 21 euro rate (Poundsterling Live, Sep 21, 2026) [17]. CDR.fyi's weighted average of publicly disclosed biochar removal prices is $136 a tonne of CO2 (CDR.fyi, accessed Oct 22, 2026) [18]. The NRCS payment for Practice 336 in North Carolina is $1,418.71 an acre [1].
Evidence: One tonne of carbon stored is 3.67 tonnes of CO2. Wakefield's agricultural grade at 50% to 65% organic carbon therefore holds at most 1.83 to 2.38 tonnes of CO2 per dry tonne. Its premium grade at 85% to 95% holds 3.12 to 3.48 [13]. Registries credit less than that: they discount for the share of carbon expected to decay and subtract production emissions. So the figures below are a gross ceiling.
| Per acre, 4 dry short tons | Low band, $66/cu yd | NC mean, $160/cu yd |
|---|---|---|
| Delivered and spread cost | 1,653* | 3,909* |
| Less NRCS 336 payment, $1,418.71 | 234* | 2,490* |
| Corn needed per year, 10 yr at 5%, after NRCS | 6.5 bu* | 68.6 bu* |
| Carbon credit ceiling, ag grade, at $136/t CO2 | 905–1,176* | 905–1,176* |
| Less credit ceiling only, no NRCS | 477–748* | 2,733–3,004* |
| Corn needed per year, 10 yr at 5%, after credit only | 13.1–20.6 bu* | 75.3–82.8 bu* |
| N-P-K and lime value, wood-chip example | 38* | 38* |
Source: Crop Root Zone calculation from [1], [10], [11], [12], [13], [14], [18]. *Calculated. Credit ceiling is organic carbon × 44/12 × $136, converted to short tons; actual credited tonnes are lower. Whether an NRCS payment and a credit sale can be combined on the same material is a contract question we could not resolve from public documents.
Two limits apply to the credit line. First, the credit is generated at the pyrolysis plant and sold by the producer. The CDR.fyi supplier leaderboard lists producers by tonnes delivered, among them Wakefield Biochar at 62,589 tonnes and Pacific Biochar at 46,375 [18]. A grower who buys credited biochar cannot sell the same tonne of removal again. Any credit value reaches the farm only as a lower delivered price or a written revenue share. Second, the price is per tonne of CO2, not per ton of biochar or per acre, and the market has been volatile, as TRZ-0017 reported [21].
Cost share is the larger lever. On the low band, the NRCS rate covers 86% of the per-acre cost by our calculation, and the remaining $234 needs 6.5 bushels of corn a year over ten years, or 2.5 bushels of soybeans. That is the only scenario in this piece where the hurdle falls inside the range of yield responses the temperate trials allow. It still sits at the very top of Ye's confidence interval, not at its middle. At the division's $160 average, the same payment leaves $2,490 an acre to recover.
Ground Truth: The cost share does more for biochar's economics than the carbon market does, and that cuts both ways. North Carolina's own presentation warns that in a thin market a cost-share rate "can become a price floor" [1]. Its recommended $120-a-yard payment is 182% of the cheapest supplier's delivered price. If the low band is credited material already subsidized by a carbon sale, which is our hypothesis and not something the division confirmed, then the cheap biochar has already been paid for twice. Our advice is narrow. Biochar is a reasonable purchase on a field with a documented soil problem it can address, at a low-band dry-ton price, with the NRCS or state payment in hand and a one-year follow-up soil test, which North Carolina's draft already requires [2]. It is not a yield investment on productive Corn Belt ground at $160 a yard. The 2026 data give no reason to budget it as one.
References
- North Carolina Division of Soil and Water Conservation, "Biochar Soil Carbon Amendment: Moving the Cost List to a Cubic Yard Basis," NC Agriculture Cost Share Program Technical Review Committee presentation, Sep 2026 (nine supplier quotes; seven woody suppliers $66–$250/cu yd delivered, mean $159, median $200; proposed $160/cu yd rate, $120 at 75% cost share; USDA-ARS Coastal Plains factor 6.0 cu yd per dry ton cellulosic, 3.0 manure; delivery tickets about 2.5 cu yd per ton; 4 ton/acre example = 24 cu yd; NRCS rate $1,418.71/acre) — https://www.ncagr.gov/divisions/soil-water-conservation/Soil%20%26%20Water%20-%20Biochar%20Presentation%20TRC%209.3.2026/download
- North Carolina Soil and Water Conservation Commission, agenda item 9A, Attachment 9, "Biochar – Soil Carbon Amendment" draft policy and proposed FY2027 cost list, Sep 2026 (soil tests before and one year after; NCDA&CS analysis of biochar; nutrient management plan for manure-derived amendments; payment on actual quantity applied) — https://www.ncagr.gov/divisions/soil-water-conservation/agenda-item-9A-Biochar-09-2026/download
- Fossum, B.; Balboa, G.; Malakar, A.; Koehler-Cole, K.; Kaiser, M., "Breaking Even on Biochar: Expanding Biochar Adoption in Nebraska," University of Nebraska–Lincoln CropWatch, Sep 1, 2026 (commercial biochar "can still exceed $1,000 per ton"; three corn trials, no significant biochar yield effect; 31 and 8 tons/acre) — https://cropwatch.unl.edu/breaking-even-biochar-expanding-biochar-adoption-nebraska/
- Blanco, H.; Creech, C.; Easterly, A.; Drijber, R.; Jeske, E.S., "Nebraska Field Experiments Investigate Biochar Impact to Soil Health and Crop Yields," University of Nebraska–Lincoln CropWatch, Sep 10, 2024 — https://cropwatch.unl.edu/2024/nebraska-field-experiments-investigate-biochar-impact-soil-health-and-crop-yields
- Ye, L.; Camps-Arbestain, M.; Shen, Q.; Lehmann, J.; Singh, B.; Sabir, M., "Biochar effects on crop yields with and without fertilizer: A meta-analysis of field studies using separate controls," Soil Use and Management 36:2–18, 2020 (author copy) — https://www.css.cornell.edu/faculty/lehmann/publ/SoilUseManage%2036,%202-18%202020%20Ye.pdf
- Jeffery, S.; Abalos, D.; Prodana, M.; Bastos, A.C.; van Groenigen, J.W.; Hungate, B.A.; Verheijen, F., "Biochar boosts tropical but not temperate crop yields," Environmental Research Letters 12(5):053001, Apr 25, 2017 (abstract) — https://doi.org/10.1088/1748-9326/aa67bd
- Silva-Pumarada, G.; Shrestha, R.K.; Chiavegato, M.; Mercer, K.; Agyei, B.K.; Singh, M.P.; Lindsey, L.E., "Effect of biochar application on corn and soybean yield in Michigan and Ohio," Crop, Forage & Turfgrass Management 9(2), Aug 2, 2023 (core ideas as indexed; full text not read) — https://doi.org/10.1002/cft2.20245
- Rogovska, N.; Banik, C.; Laird, D.A.; Tomer, M.D.; Karlen, D.L., "Corn and Soil Response to Biochar Application and Stover Harvest," ASA-CSSA-SSSA International Annual Meetings, Minneapolis, 2015, poster 515 abstract — https://scisoc.confex.com/crops/2015am/webprogram/Paper93975.html
- Aller, D.; Archontoulis, S.V.; Zhang, W.; Sawadgo, W.; Laird, D.; Moore, K.J., "Long term biochar effects on corn yield, soil quality and profitability in the US Midwest," Field Crops Research 227:30–40, 2018 (abstract via Iowa State staff paper listing; the Iowa State repository page returned HTTP 403 on Oct 22, 2026) — https://ideas.repec.org/p/isu/genstf/201810010700001687.html
- USDA World Agricultural Outlook Board, World Agricultural Supply and Demand Estimates, WASDE-676, Oct 9, 2026 (2026/27 corn season-average farm price $4.70/bu, yield 181.2 bu/acre; soybeans $12.00/bu, yield 53.1 bu/acre) — https://www.usda.gov/oce/commodity/wasde/wasde1026.pdf
- DTN/Progressive Farmer, "UAN32 Leads Fertilizer Prices Higher Again in First Week of October," Oct 14, 2026 (retail averages for Oct 5–9: anhydrous $977, urea $672, DAP $934, potash $502 per ton) — https://www.dtnpf.com/agriculture/web/ag/crops/article/2026/10/14/uan32-leads-fertilizer-prices-higher
- Johanns, A.; Hart, C., "2026 Iowa Farm Custom Rate Survey," Iowa State University Extension and Outreach FM 1698, Mar 2026 (loading and spreading solid manure $7.20/ton) — https://www.extension.iastate.edu/agdm/crops/pdf/a3-10.pdf
- Wakefield Biochar, "Wakefield Biochar AG Agricultural Grade Biochar," Product Specification Sheet PS-1006 Rev. A, file dated Aug 25, 2026 (organic carbon 50–65% dry; moisture 50–60%; ash 30–45%; total N 0.3–0.7%), with premium-grade sheet PS-1001 (organic carbon 85–95%; ash 3–10%) as indexed by search — https://rrstage.wakefieldbiochar.com/wp-content/uploads/2026/08/PS-1006-Biochar-AG-Product-Specification.pdf
- All Power Labs, "Biochar Specs," wood-chip biochar lab analysis, tested Jul 2023 (N 0.53%, P 309 mg/kg, K 4,151 mg/kg, liming value 8.1% CaCO3, ash 2.3%) — https://www.allpowerlabs.com/product-overview/biochar-specs
- Minnesota Pollution Control Agency, Minnesota Stormwater Manual, "Chemical and physical properties of biochar," accessed Oct 22, 2026 (literature ranges and medians for total P and K) — https://stormwater.pca.state.mn.us/chemical_and_physical_properties_of_biochar
- Puro.earth, "Carbon Removal Index Price," CORC Biochar Price Index (CORCCHAR), September 2026 value €124.02, accessed Oct 22, 2026 — https://puro.earth/carbon-removal-index-price
- Poundsterling Live, "U.S. Dollar-Euro History: 2026," Sep 21, 2026 mid-rate 0.8712 EUR per USD — https://www.poundsterlinglive.com/history/USD-EUR-2026
- CDR.fyi, market dashboard, weighted average price per tonne by method from publicly disclosed prices (biochar $136/t) and supplier tonnes delivered, accessed Oct 22, 2026 — https://www.cdr.fyi/
- Crop Root Zone, TRZ-0257, "Ag Lime Costs 2.7 Cents a Pound of Effective Neutralizing Material, Delivered and Spread. Pelletized Lime Costs 11 to 21. In Six Iowa Trials, 200 Pounds an Acre Moved pH by a Tenth," Oct 5, 2026.
- Crop Root Zone, TRZ-0297, "A Ton of Yard-Waste Compost Carries $20 of Fertilizer at October Prices. A Crop Can Use About $10 of It the First Year, and Bulk Compost Sells for $20 to $40 a Ton," Oct 20, 2026.
- Crop Root Zone, TRZ-0017, "Biochar's Two Pitches: Better Soil, or a Carbon Check — and Why Neither Pencils Yet for Row Crops," Jul 18, 2026.
Disclosures
Crop Root Zone is an independent publication. Nothing here is investment advice. Market calls, where included, reflect the editors' own read and are not a recommendation to buy or sell any security.
A 500 mL Bottle of Nano Urea Holds 20 Grams of Nitrogen. The 45 kg Bag It Claims to Replace Holds 20.7 Kilograms, and at India's Own Price That Nitrogen Costs $54 a Pound
IFFCO's 4% liquid nano urea carries about 1/1,000th of the nitrogen in the bag it was sold to replace, and its 20% successor about 1/200th. Priced at ₹225 a bottle, that works out to $54 and $11 a pound of N, against 73 cents for urea at October U.S. retail. Punjab Agricultural University measured 13% to 21.6% yield losses when half the soil N was swapped for sprays. A 2026 review of 194 papers found the workable cut is 20% to 25%, and a 21-site Indian trial found a plain 5% urea spray did the same job. No North American registration or retail price turned up in our search.
India's largest fertilizer cooperative sold 116.2 million half-litre bottles of liquid nano urea between its 2021 launch and November 30, 2025, according to a Rajya Sabha reply reported by PSU Watch (PSU Watch, Dec 16, 2025) [10]. At launch, the Indian Farmers Fertiliser Cooperative (IFFCO) said each bottle "will replace at least one bag" of conventional urea and carried 40,000 ppm of nitrogen (Agriculture Post, Jun 1, 2021) [1]. That is 4% nitrogen, or about 20 grams in a 500 mL bottle. A 45 kg bag of 46% urea holds 20.7 kilograms. Two University of Copenhagen scientists wrote in Plant and Soil that the claim would imply a nitrogen-use-efficiency gain of more than 1,000 times, and called the product "poorly described" with "no scientifically proven effects" (Frank and Husted, Plant and Soil, 2024) [2]. They also called its price excessively high given the doubts about its effect (Down To Earth, Aug 22, 2023) [3]. This piece puts the nitrogen in the bottle next to the nitrogen in the bag, prices both in North American terms, sets the claim against the field trials, and asks what a product like this would have to return on a U.S. corn acre.
1. What is in the bottle
What's new: The original product is not the only one. In April 2024 India's agriculture ministry notified IFFCO Nano Urea Plus at 16% N by weight, which it equated to 20% N by volume, at ₹225 a 500 mL bottle (Indian Cooperative, Apr 18, 2024) [4]. That is five times the nitrogen of the 2021 formula in the same bottle.
Evidence: The arithmetic needs nothing beyond the labels. We use 20 grams for the original bottle, the figure Frank and Husted used [2] and the one that follows from IFFCO's 40,000 ppm [1]. For Plus, 20% weight-by-volume in 500 mL is 100 grams.
| Per unit as sold | Nitrogen, grams | Nitrogen, lb | Bags of urea N per unit of N | Basis |
|---|---|---|---|---|
| 45 kg bag of urea, 46-0-0 | 20,700* | 45.6* | 1 | Granular, soil-applied |
| Nano Urea (liquid), 500 mL, 4% N | 20 | 0.044* | 1,035* | Foliar spray, 2021 formula |
| Nano Urea Plus (liquid), 500 mL, 20% N w/v | 100* | 0.22* | 207* | Foliar spray, 2024 notification |
| 5% urea solution, 125 litres | 2,875* | 6.3* | 7.2* | Foliar spray, the comparison treatment in a 21-site trial |
Sources: IFFCO launch claims via Agriculture Post, Jun 1, 2021 [1]; Frank and Husted, Plant and Soil, 2024 [2]; Indian Cooperative, Apr 18, 2024 [4]; Tripathi, Kumar and Venkatesh, Scientific Reports, Jan 28, 2025 [7]; TNAU, Jun 18, 2022 [11]. *Crop Root Zone calculation. The last row assumes the 125 litres of water per acre that Tamil Nadu Agricultural University recommends for one bottle of nano urea [11]; the Scientific Reports abstract does not state its spray volume.
The last row matters. It is the treatment Indian wheat researchers used as a check against nano urea, and at the same spray volume it carries about 144 times the nitrogen of a 4% bottle, by our calculation.
The recommended rate is one bottle in 125 litres of water, sprayed twice, at about 20 and 40 days after sowing or transplanting, according to a 2022 Tamil Nadu Agricultural University press note. The same note gives one 500 mL bottle per acre for drone application across two rounds [11]. Read either way, an acre receives 0.5 to 1 litre of product a season. With the 4% formula that is 0.04 to 0.09 pound of nitrogen per acre, by our calculation. A corn crop that yields 181 bushels, USDA's October national estimate [13], takes up well over a hundred pounds.
IFFCO's answer has never been that the bottle carries the bag's nitrogen. It is that a nanoparticle sprayed on a leaf is used far more efficiently than a prill spread on soil, which loses N to volatilization, leaching and denitrification. Tamil Nadu Agricultural University's press note puts conventional urea-use efficiency at 30% to 35% and says the nano form is assimilated "with no loss to the environment" [11]. Even at 100% efficiency for the nano product against 30% for the prill, 20 grams of nitrogen used perfectly replaces about 67 grams of urea nitrogen used poorly, by our calculation. The bag holds 20,700.
Ground Truth: The 1,000-to-1 ratio is not a matter of interpretation. No efficiency gain can close it, because urea in the field is already at roughly a third efficiency, not a thousandth. The bottle can only work as the claim says if most of the crop's nitrogen comes from somewhere else, the soil and the basal dose. That is what the trials found. A grower shown a liquid that "replaces" a dry-N application should ask one question before price: how many pounds of N per acre does the label guarantee?
2. What the trials found
What's new: The independent literature has matured since the 2023 critique. A PRISMA-based mini-review of 194 records published in June 2026 concludes that "first-generation nano-urea does not replace soil-applied urea." It finds the product can support reductions in soil N "generally around 20 – 25%," and that cuts of 50% or more "usually led to yield penalties or weaker N uptake" (Fellet et al., Italian Journal of Agronomy, Jun 6, 2026) [8].
Evidence: The disputes are about the size of the soil-N cut, not about the spray. Every positive result we found kept most of the basal nitrogen.
| Study | Setting | Treatment vs. full soil-N control | Result | Source |
|---|---|---|---|---|
| Punjab Agricultural University (Sikka, Kalia et al.) | Ludhiana, 2020-21 and 2021-22 | 50% soil N + 2 nano urea sprays | Wheat yield −21.6%, rice −13%; grain N −11.5% wheat, −17% rice | [5][6] |
| ICAR multi-location trials | 20 locations, selected crops | Basal conventional urea + nano urea foliar | Yield +3% to +8% over conventional alone | [9] |
| Tripathi, Kumar and Venkatesh | 21 sites, irrigated wheat, 2021-22 and 2022-23 | Full N + 2 nano urea sprays | Yield +5.5% to +9.1% by zone | [7] |
| Same | Same | 75% N + 2 nano urea sprays, or 75% N + 2 sprays of 5% urea | Not significantly different from full N | [7] |
| Fellet et al. review | 194 records, 2015-2026, mostly India | 75% soil N + nano urea vs. 50% or less | 20%-25% cut usually holds yield; 50%+ usually does not | [8] |
Sources: Down To Earth, Jan 3, 2024 [5]; Sikka et al., Plant and Soil 512, published online Dec 30, 2024 [6]; Indian Cooperative, Aug 6, 2023, reporting a Lok Sabha written reply [9]; Tripathi et al., Scientific Reports 15:3598, Jan 28, 2025 [7]; Fellet et al., Italian Journal of Agronomy 21:100109, Jun 6, 2026 [8].
Punjab's result is the hardest one. The university's soil chemists ran the IFFCO protocol for two seasons: half the soil nitrogen, plus two sprays. Down To Earth reported that wheat yield fell 21.6% and rice 13% against conventional nitrogen, that grain nitrogen fell, and that above-ground biomass and root volume were lower. It quoted the lead author, Rajeev Sikka, saying the product "cannot be recommended for rice and wheat" [5]. The work was later published in Plant and Soil under a title that states the finding: substituting foliar nano urea for soil urea "decreases growth and yield of rice and wheat" [6]. We read the Down To Earth report and the bibliographic record; we could not open the paper's full text.
The government's own trial figures are not inconsistent with Punjab's. The 3% to 8% yield gain cited in the Lok Sabha came from nano urea on top of basal conventional urea [9]. The 21-site wheat study found gains when the sprays were added to the full dose, and parity at 75% [7].
The 21-site study has a second finding that gets less attention. Its abstract reports that 75% of the recommended N plus two sprays of ordinary 5% urea solution also matched the full dose. It gave the higher marginal rate of return of the two 75% options. The highest net benefit overall came from the full dose plus two 5% urea sprays [7]. Foliar urea at heading is not new. If plain urea in a spray tank does what the nano product does, the yield effect belongs to late foliar nitrogen, not to particle size. Fellet and colleagues reach the same view on efficiency: reported gains "appear to depend more on lower N rates and improved management than on a distinctly nano effect" [8].
Ground Truth: Read together, the trials describe a foliar top-up, not a substitute. Two sprays let you trim the soil rate by about a quarter, about what a well-timed split already does. Past that, yield falls, and Punjab measured how fast. The 50% cut that the "bottle replaces a bag" message invites is exactly where the yield losses were measured.
3. What India's sales and subsidy data say
What's new: Adoption has slowed, and the government still has no manufacturer's evaluation in hand. The December 2025 Rajya Sabha reply stated that IFFCO had not submitted an evaluation report on the product. The ministry signed a study agreement with the National Productivity Council in March 2024 and a second phase in November 2025. It also signed a five-year ICAR network project in November 2025 [10].
Evidence: Production ran well ahead of sales in the first three years and has since been cut back.
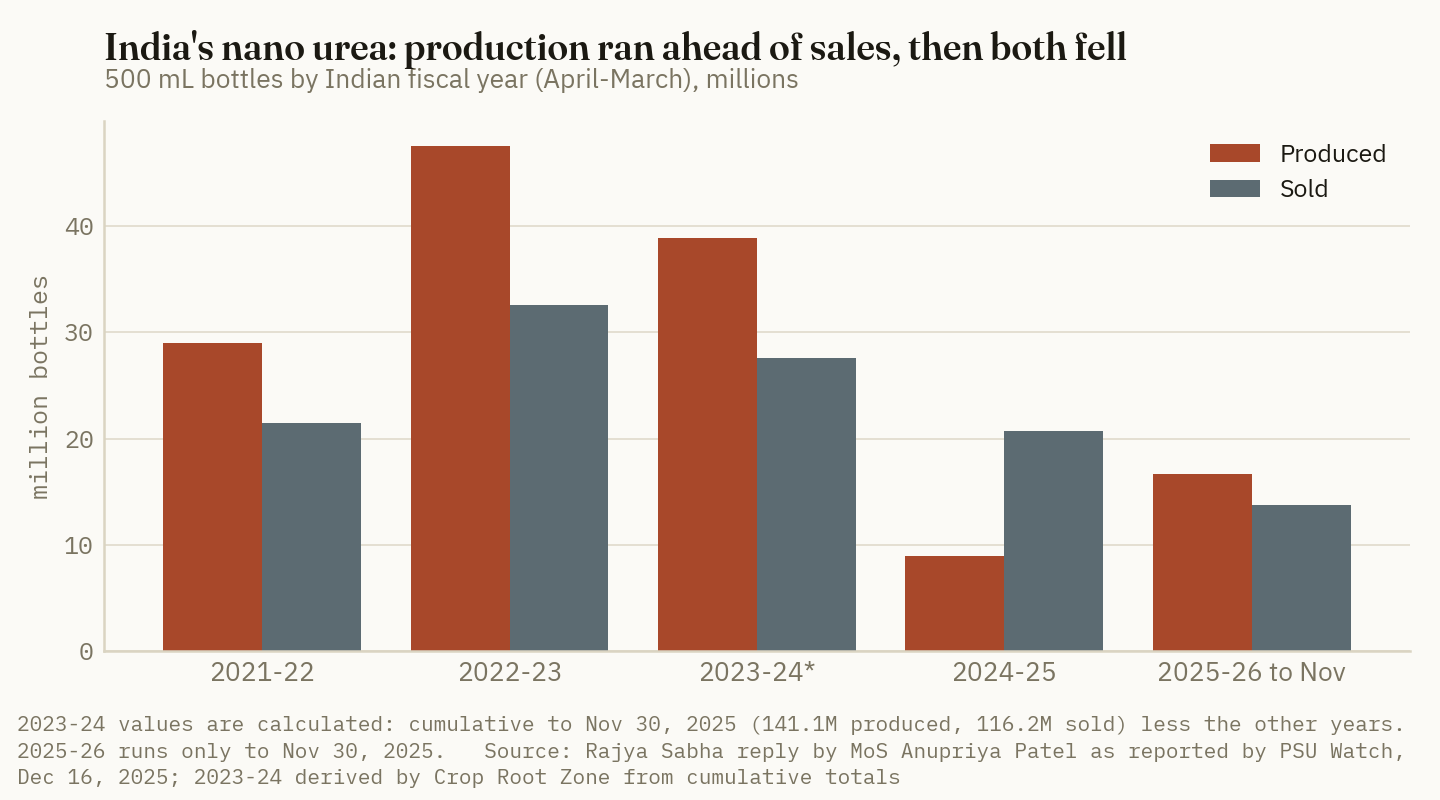
Cumulative production was 141.1 million bottles and sales 116.2 million, leaving 24.9 million produced but not sold [10]. Sales in 2024-25 were 20.7 million bottles and 13.8 million in the eight months to November 2025, against 32.6 million in 2022-23 [10].
Scale those bottles by their nitrogen. If every bottle sold were the 4% formula, the 116.2 million bottles held about 2,300 tonnes of nitrogen, by our calculation. That is as much nitrogen as about 112,000 bags of urea. Taken at face value, the bottle-for-bag claim puts the same sales at the equivalent of about 5.2 million tonnes of urea. Some bottles sold since 2024 are the 20% Plus formula; the sales figures are not split by formula. If all had been Plus, the nitrogen would be about 11,600 tonnes, still about one-fifth of 1% of the claimed equivalent.
The price comparison is shaped by subsidy. Indian farmers pay ₹242 for a 45 kg bag of urea, a maximum retail price the government holds by paying manufacturers and importers the difference. The urea portion of the fertilizer subsidy ran ₹34,947 crore from April 1 to July 21 of fiscal 2025-26 alone, by our sum of the domestic and imported lines (The Week/PTI, Jul 25, 2025) [15]. Nano urea gets no central subsidy; Gujarat pays half the cost for most farmers [10].
| Nitrogen source | Basis | $/lb N | |
|---|---|---|---|
| Nano Urea (liquid), 4% N | ₹225 per 500 mL, India | 53.74* | ██████████ |
| Nano Urea Plus, 20% N w/v | ₹225 per 500 mL, India | 10.75* | ██░░░░░░░░ |
| UAN28 | U.S. retail average, Oct 5-9 | 0.79 | ░░░░░░░░░░ |
| UAN32 | U.S. retail average, Oct 5-9 | 0.76 | ░░░░░░░░░░ |
| Urea | U.S. retail average, Oct 5-9 | 0.73 | ░░░░░░░░░░ |
| Anhydrous ammonia | U.S. retail average, Oct 5-9 | 0.60 | ░░░░░░░░░░ |
| Urea, subsidized | ₹242 per 45 kg bag, India | 0.06* | ░░░░░░░░░░ |
Sources: DTN/Progressive Farmer, Oct 14, 2026 [12]; Indian Cooperative, Apr 18, 2024 [4]; The Week/PTI, Jul 25, 2025 [15]; Federal Reserve Bank of St. Louis, FRED series DEXINUS, ₹94.96 per US$ on Oct 16, 2026 [14]. *Crop Root Zone calculation at that exchange rate. The ₹225 bottle price is the 2024 notified figure; we found no 2026 confirmation. The ₹242 bag price excludes neem-coating charges and taxes. Indian prices are converted for comparison only and are not North American offers.
$53.74/lb N
Nitrogen in a 4% nano urea bottle at India's own ₹225 price, converted at October's exchange rate: about 74 times U.S. retail urea and about 960 times the nitrogen in India's subsidized bag. (Crop Root Zone calculation from Indian Cooperative, Apr 18, 2024; FRED, Oct 16, 2026; DTN, Oct 14, 2026)
That multiple is why the bottle was never sold on its nitrogen. At ₹225 it was pitched at about the price of one bag [1][4], so that a farmer who believes the bottle replaces a bag breaks even. A farmer who believes the trials does not. He pays roughly a bag's price for a quarter-cut in topdress at best, and loses yield if he cuts deeper.
4. What a North American grower would be buying
What's new: IFFCO signed an agreement in June 2023 with Kapoor Enterprises Inc., a California company, to export nano liquid urea to the United States, announced during the Indian prime minister's state visit (Deccan Herald, Jun 22, 2023) [16]. We found no public U.S. or Canadian retail price, no farm-retail listing, and no state or federal registration record for the product in our searches. That is not proof that none exists.
Evidence: Registration is the gate. In the United States, fertilizer is registered state by state. The Association of American Plant Food Control Officials' label guide says "the laws of each state are the final standard for labeling, licensing, and registration." It also says a product whose label claims do not match the registered label is misbranded (AAPFCO, 2012) [17]. In Canada, "some fertilizers and most supplements" need pre-market assessment and registration by the Canadian Food Inspection Agency before import or sale (CFIA, modified Oct 25, 2023) [18]. We did not query each state's registered-product database or CFIA's by product name. A grower offered the product should ask for the state registration and the guaranteed analysis. A 4% N guarantee on a 500 mL bottle is 0.044 pound of nitrogen, whatever the marketing says.
The useful North American question is not what the bottle costs but what the nitrogen it lets you skip is worth, and what yield you can lose before that saving is gone. At DTN's October average of 73 cents a pound for urea N [12], the nitrogen in a 45 kg bag is worth about $33. That is the most the bag-replacement claim could be worth to a U.S. buyer, if it were true.
| Illustrative corn acre, October 2026 prices | 25% N cut (the review's workable range) | 50% N cut (the Punjab protocol) |
|---|---|---|
| Soil N rate, illustrative assumption | 160 lb → 120 lb | 160 lb → 80 lb |
| Urea N saved at $0.73/lb | $29.20* | $58.40* |
| Corn that saving buys at $4.70/bu | 6.2 bu* | 12.4 bu* |
| As a share of a 181.2 bu/acre crop | 3.4%* | 6.9%* |
| Published yield effect at that cut | No significant loss in wheat [7][8] | −13% rice, −21.6% wheat [5] |
| Yield loss at that effect, 181.2 bu at $4.70/bu | $0 | $110.71 to $183.95* |
Sources: DTN/Progressive Farmer, Oct 14, 2026 [12]; USDA WASDE-676, Oct 9, 2026, 2026/27 national corn yield 181.2 bu/acre and season-average price $4.70/bu [13]; trial results as cited. *Crop Root Zone calculation. The 160 lb/acre rate is an illustrative assumption, not a recommendation. The trial losses are from rice and wheat in Punjab and are applied to corn only to show scale; no comparable published corn trial was found. All figures are before the product's cost and the spray pass.
Two things follow. First, at a 25% cut the whole budget for the product and two spray passes is about $29 an acre, and the 21-site trial found plain foliar urea did the same job [7]. That urea costs about $4.60 per 125-litre acre-spray at October retail, by our calculation from DTN's $672 a ton [12]. Second, at a 50% cut the arithmetic breaks. The fertilizer saving is worth 6.9% of the crop, and the only published test of that cut lost 13% to 21.6% [5]. A product has to protect yield, not just save N, and the evidence says this one does not at that depth.
Ground Truth: If nano urea, or a domestic product built on the same pitch, reaches North American dealers, the label will be the honest part and the brochure will not. The sound comparison is not nano versus a bag; it is nano versus an extra pound or two of foliar urea or UAN at heading, which the trials suggest does the same thing for a few dollars. We would not cut a planned soil-N rate by more than the 20% to 25% the review supports on account of any foliar product. We would want a replicated on-farm strip, with a plain-urea foliar check, before trimming even that.
5. What to watch
What's new: Three Indian evaluations are now running: the National Productivity Council study and its second phase, and a five-year ICAR network project begun in November 2025 [10]. The review by Fellet and colleagues notes that the evidence base remains "strongly India-centred" and short-term, and that European regulators have not moved nano fertilizers into the mainstream [8].
Evidence: The 2026 review places most published work in Indian wheat, rice and maize, from a single national programme of trials and demonstrations [8]. For a North American agronomist that leaves a gap. There is no peer-reviewed corn or canola trial of the product under North American nitrogen rates in what we read. There is no published comparison against the enhanced-efficiency options a U.S. grower already has, such as urease and nitrification inhibitors or polymer coatings. Fellet and colleagues make the same point: nano urea "needs to be judged against established low-emission options such as coated and inhibitor-based urea, and not in isolation" [8].
What would change our read:
- A North American registration with a guaranteed analysis. It would show what claims a state regulator accepts, which is the claim that matters.
- Indian evaluation results, especially any that test a 50% soil-N cut against a plain foliar urea check, the comparison Punjab and the 21-site study point to.
- Plus-formula trials. Five times the nitrogen per bottle is still a small amount per acre, but most published trials used the 4% product. Results on the 20% formula would show whether the extra N changes anything at all.
Ground Truth: Sales of nano urea are falling at home, the manufacturer has not filed an evaluation, and the independent evidence has converged on a 20% to 25% top-up role that ordinary foliar urea also fills. For a North American buyer that makes it a product to test, not to plan around, and only against a plain-urea check strip.
References
- Agriculture Post, "IFFCO introduces Nano Urea for farmers from across the world," Jun 1, 2021 (IFFCO launch claims: 500 mL bottle to replace at least one bag of urea; 40,000 ppm N; ₹240 per bottle) — https://agriculturepost.com/?p=3825
- Frank, M. and Husted, S., "Is India's largest fertilizer manufacturer misleading farmers and society using dubious plant and soil science?" Plant and Soil 496(1-2):257-267, 2024 (opinion paper, published online Jul 25, 2023), doi:10.1007/s11104-023-06191-4; abstract read via Danish national research portal — https://elsevier.forskningsportal.dk/display/pub-2-s2.0-85167333165
- Down To Earth, "'No scientifically proven effects of nano liquid urea on crops': Research pokes holes in IFFCO's claims," Aug 22, 2023 — https://www.downtoearth.org.in/news/agriculture/-no-scientifically-proven-effects-of-nano-liquid-urea-on-crops-research-pokes-holes-in-iffco-s-claims-91298
- Indian Cooperative, "Govt notifies IFFCO Nano Urea Plus to meet crops' nitrogen requirements," Apr 18, 2024 (16% N w/w, 20% N w/v; ₹225 per 500 mL) — https://www.indiancooperative.com/iffco/govt-notifies-iffco-nano-urea-plus-to-meet-crops-nitrogen-requirements/
- Down To Earth, "Dip in yield, low protein content: PAU field experiment finds several problems with nano urea," Jan 3, 2024 — https://www.downtoearth.org.in/news/agriculture/dip-in-yield-low-protein-content-pau-field-experiment-finds-several-problems-with-nano-urea-93668
- Sikka, R., Kalia, A., Ahuja, R., Sidhu, S.K. and Chaitra, P., "Substitution of soil urea fertilization to foliar nano urea fertilization decreases growth and yield of rice and wheat," Plant and Soil 512(1-2):1475-1491, published online Dec 30, 2024, doi:10.1007/s11104-024-07157-w (bibliographic record only; full text not accessed) — https://doi.org/10.1007/s11104-024-07157-w
- Tripathi, S.C., Kumar, N. and Venkatesh, K., "Nano urea's environmental edge and economic efficacy in boosting wheat grain yield across diverse Indian agro-climates," Scientific Reports 15:3598, Jan 28, 2025, doi:10.1038/s41598-024-83616-9 (abstract via Europe PMC) — https://doi.org/10.1038/s41598-024-83616-9
- Fellet, G., Pilotto, L., Ceccon, P. and Marchiol, L., "Current agronomic evidence on nano-urea in the nitrogen transition of cropping systems. A mini-review," Italian Journal of Agronomy 21:100109, available online Jun 6, 2026, doi:10.1016/j.ijagro.2026.100109 — https://doi.org/10.1016/j.ijagro.2026.100109
- Indian Cooperative, "Lok Sabha: Minister quotes ICAR trials of Nano Urea; stresses its efficacy," Aug 6, 2023 (written reply of MoS Bhagwanth Khuba) — https://www.indiancooperative.com/fertilizer/lok-sabha-minister-quotes-icar-trails-of-nano-urea-stresses-its-efficacy/
- PSU Watch, "IFFCO yet to submit nano urea evaluation report; sales lag production: Govt," Dec 16, 2025 (Rajya Sabha reply of MoS Anupriya Patel) — https://psuwatch.com/newsupdates/iffco-yet-to-submit-urea-evaluation-report-sales-lag-production-govt
- Tamil Nadu Agricultural University, Public Relations Office, "IFFCO Nano Urea Field Day in ARS, Bhavanisagar," press note, Jun 18, 2022 — https://agritech.tnau.ac.in/tnaupressnotes/pdf/2022/Press%20note%20-IFFCO%20Nano%20Urea%20Field%20Day%20in%20ARS,%20Bhavanisagar%20-%20English.pdf
- DTN/Progressive Farmer, "UAN32 Leads Fertilizer Prices Higher Again in First Week of October," DTN Retail Fertilizer Trends, Oct 14, 2026 (averages for Oct 5-9, 2026) — https://www.dtnpf.com/agriculture/web/ag/crops/article/2026/10/14/uan32-leads-fertilizer-prices-higher
- USDA World Agricultural Outlook Board, World Agricultural Supply and Demand Estimates, WASDE-676, Oct 9, 2026 (2026/27 U.S. corn yield 181.2 bu/acre; season-average price $4.70/bu) — https://www.usda.gov/oce/commodity/wasde/wasde1026.pdf
- Federal Reserve Bank of St. Louis, FRED, "Indian Rupees to One U.S. Dollar Spot Exchange Rate" (DEXINUS), observation for Oct 16, 2026: 94.96 — https://fred.stlouisfed.org/series/DEXINUS
- The Week (PTI), "Govt provides Rs 49,330 cr fertilisers subsidy till July 21 of FY26," Jul 25, 2025 (urea MRP ₹242 per 45 kg bag; domestic urea ₹30,940.82 crore, imported urea ₹4,006.70 crore) — https://www.theweek.in/wire-updates/business/2025/07/25/dcm90-lsq-fertilisers.html
- Deccan Herald, "IFFCO to supply nano liquid urea to the United States," Jun 22, 2023 — https://www.deccanherald.com/business/iffco-to-supply-nano-liquid-urea-to-the-united-states-1230306.html
- Association of American Plant Food Control Officials, Product Label Guide, 2012 (hosted by Montana Department of Agriculture) — https://agr.mt.gov/_docs/fertilizer-docs/AAPFCO_FertandSoilLabelingGuide_2012.pdf
- Canadian Food Inspection Agency, "What is fertilizer or supplement registration," date modified Oct 25, 2023 — https://inspection.canada.ca/en/plant-health/fertilizers/registration-overview
Disclosures
Crop Root Zone is an independent publication. Nothing here is investment advice. Market calls, where included, reflect the editors' own read and are not a recommendation to buy or sell any security.
Discussion
This issue finds that Canadian potash's zero duty rests on exemption lists that can change by proclamation, and that a 50% duty would add about $121 a ton, or $12 an acre over a corn-soy rotation. So: what is your dealer quoting for spring 2027 potash, on what basis, and does your contract say who pays if a duty lands on tons that are already in the warehouse?
Corrections are as welcome as answers. If you check our arithmetic against a primary source and find we have it wrong, tell us. The sharpest replies get answered in next week's Letters & Responses.