Issue 14 · 2026-10-19
This issue takes products apart. Ammonium sulfate runs $538 to $813 a ton across five USDA panels, but credit its nitrogen at the local urea price and 53% to 62% of the ton is nitrogen. The sulfur left over costs 52 to 65 cents a pound, and Oklahoma's ATS line delivers it for 45. The same subtraction puts MAP phosphate at 81 cents a pound and a phosphite spray at $12 to $19 a pound of phosphate-equivalent.
The method works on prices and machines too. Retail DAP sits $131.50 over the NOLA barge, the narrowest October gap in four years. Retail anhydrous sits $483 over the Tampa contract, a gap only summer-fill cost explains. A crushed soybean is worth $15.30, the same as in August, but the bean took the margin. A point of moisture costs 2.8 cents to remove in a mixed-flow dryer and 4.1 cents in an old cross-flow.
Why now: booking sheets for 2027 are being written while the fourth-quarter Tampa sulfur contract is unsettled, the Gulf urea barge has turned up and a Florida phosphate operation is going idle for lack of sulfur. Every quote is a bundle. We have split each one into the price of the nutrient and the price of the form, the season or the label.
— Crop Root Zone, Editorial Desk.
Letters & Responses
No reader correspondence reached us this week. We searched the publication inbox for the eight days since RZ-013 went up and found no questions, corrections or pushback about it. The same search turned up older threads, so this is a true zero, not a failed search, and we would rather report it than invent a letter.
Five questions are still open, and this issue adds evidence to each.
RZ-013's strip-till question. We asked what you are quoted per acre for custom strip-till this fall, how much of it is the fertilizer add-on and how much a fuel surcharge. This issue's diesel-storage feature adds the other side of the fuel bill. A 2,000-gallon tank pays for itself past about 12,000 gallons a year, and the real discount starts with a 6,000-gallon transport load. If you own a tank, tell us its size, how many gallons you burn a year and what your supplier charges per gallon for a tankwagon drop against a transport load.
RZ-012's booking question. We asked what you were quoted for spring nitrogen and on what terms. Since then the NOLA urea barge has firmed to $435–445 a short ton. Retail anhydrous averaged $977 in DTN's October 5–9 survey, $483 over the October Tampa contract, and this issue's anhydrous feature finds the $95 drop in wholesale since summer fill has not yet reached the counter. Has your dealer quoted a price for after the tanks are refilled, and how far is it below the October price?
RZ-011's check-strip question. We asked which input on your 2027 sheet you are buying without your own check strip. This issue prices three more candidates. A phosphite pass has to return 3.1 to 6.7 bushels of corn. A ton of silicate slag has to return 15 bushels, or 6 on ground that needs lime. A $10 phosphate biological lowered yield in 10 of 56 independent Prairie site-years and raised it in 6. Strip results on any of them are welcome, with the yield difference and the number of replications.
RZ-010's drying question. We asked at what moisture you start corn and what you pay for propane. This issue's dryer feature finds that dryer design now moves the cost of a point more than the propane bid does. If you have metered gallons against bushels and moisture in and out, the gallons per bushel-point is the number we would most like to see.
The standing question on nitrogen hedging. An anonymous reader wrote to RZ-004 that a grower cannot hedge a nitrogen bill the way grain is hedged. The anhydrous feature in this issue adds a partial answer. A fall anhydrous price is mostly the dealer's summer-fill cost plus a markup, so a grower who books before the season buys at last summer's wholesale, not today's. The same feature found a seasonal step of about $40 a ton in two of the last three falls. Booking early avoids that step but does nothing about the contract itself. The correspondent remains anonymous.
Corrections, disagreements and figures from your own operation are welcome by email. We answer the sharpest ones here the following week.
In This Issue
This week's features, by department.
- Ammonium Sulfate Runs $538 to $813 a Ton Across Five USDA Panels This October. Take Out the Nitrogen and Its Sulfur Costs 52 to 65 Cents a Pound, and Oklahoma's ATS Line Delivers It for 45.Credited at each panel's own urea price, nitrogen makes up 53–62% of the value of a ton of 21-0-0-24S, and the sulfur left over costs $0.52–$0.65 a pound. On the one panel that also quotes ATS, sulfur from ATS costs $0.09 a pound less than sulfur from ammonium sulfate. At 20 lb S that is under $2 an acre. So the choice of sulfur form this fall depends on whether the crop can use ammonium sulfate's nitrogen and whether the program is dry or liquid. The price of sulfur barely enters into it.
- Retail DAP Sits $131.50 Over the NOLA Barge, the Narrowest October Gap in Four Years. Measured Against Summer Fill, the Dealer's Markup Has Shrunk Three Falls Running.DTN's Oct 5–9 survey put retail DAP at $934 a ton with the CME NOLA front month at $802.50. That $131.50 gap compares with $162–$176 in the last three Octobers, and on a June–August fill basis the retail layer over Corn Belt wholesale has fallen from $155 in 2023 to $92 now. Phosphate has less cushion between farm and Gulf than any other product on the board, so retail DAP will only come down if the barge does, at roughly 55 cents on the dollar, two to three months later.
- Retail Anhydrous Rose $39 in the Month the Tampa Contract Fell. At $977 It Sits $483 Over Wholesale, and Only Summer-Fill Cost Still Explains the Gap.DTN's Oct 5–9 survey put anhydrous at $977 a ton, up $39 on the month and $163 on the year, while the October Tampa contract fell $10 to an implied $545 a tonne. Measured against the prior month's or the prior two months' contract, retail now sits $149 and $29 further over wholesale than a year ago. Measured against the July–August contracts that filled fall tanks, it sits $17 closer. The October price is last fall's markup on this summer's fill, and the $95 a ton of wholesale decline since then reaches the counter only when the tanks are refilled.
- US Urea Imports More Than Doubled in July. Ammonia Imports Hit Their Lowest July Since at Least 2019, and UAN Fell a Third. The Fall Gap Is in the Products That Go On This Fall.The public product-level trade record runs to July. It shows an estimated 294,000 tonnes of urea, 59% of it Algerian, against 115,000 tonnes of anhydrous ammonia, with Trinidad down from 73,000 tonnes to 9,800, and 150,000 tonnes of UAN, with Russian cargoes down 70%. Total nitrogen imported January to July matched the 2019-2024 average to within 0.1%; it arrived in the first quarter and stopped in May and June. August's only public line, the value of all fertilizer imports, fell 15%. Retail anhydrous is up 20% on the year and urea 12%, while the NOLA urea barge sits $255 under retail.
- Nutrien's Midwest Potash Price Is $430, Up $35 to $45 Since Summer Fill. Retail Is $499, Up $6. A Ton Now Costs 113 Bushels of Iowa Corn, Not September's 102.DTN's Sep 28–Oct 2 survey put retail potash at $499 a ton, up 1% on the month and 3% on the year. Corn Belt terminals are $400–$425 FOB against $380–$390 at the end of August, the New Orleans barge is flat at $345–$360, and Brazil has slipped to $360–$370 a tonne CFR, which leaves the US Gulf above Brazil where it was below in August and explains why a 30,000-tonne Belarusian cargo is due at New Orleans on Oct 14. Iowa cash corn fell from $4.86 to $4.40 in four weeks, so the potash-to-corn ratio gave back 12 of the 25 bushels it had gained. At Iowa State removal rates, potash for a 210-bushel corn and 70-bushel soybean rotation costs $54 an acre, $19 of it in the corn year and $35 in the soybean year.
- A Crushed Soybean Is Worth $15.30, the Same as in August. The Bean Rose $1.14 and Took Most of the Board Margin. Oil Is Back Under Half the Value, and Processors Pay 23 to 42 Cents Over the Country Elevator.At October 16 settlements the CBOT board crush is $2.69 a bushel, down from $3.82 on August 11. The products in a bushel are worth the same; the soybean is $1.14 higher. Oil's share of that value has fallen from 52% to 48% because meal rose $28.50 a ton while oil lost 5.6 cents a pound. Processor bids are 23 cents over Iowa and Indiana country averages and 42 cents over Illinois', worth $12 to $22 an acre. Indiana processors pay 24 cents more for November delivery than for delivery now. Most new crush capacity will not run before 2028, so the plants keep the margin. Growers collect through the flat price and the delivery slot, not through a wider basis.
- Kansas Sorghum Is Bid at 86% of Corn With 1.2% of USDA's Export Number Sold. Dryland Western Kansas Needs 83% to 92% for Sorghum to Out-Earn Corn in 2027.On October 15 Kansas country elevators bid sorghum at an average 85.9% of corn, up from 79.9% a year earlier, because the U.S. crop is a third smaller and not because of exports. The 2026/27 export book held 1.9 million bushels on October 1 against USDA's 160 million, and U.S. sorghum delivered to south China costs $49 a ton more than Australian and $95 more than Argentine at the 12% tariff. Repriced to harvest bids, K-State's 2026 dryland budgets put the sorghum-versus-corn break-even ratio at about 91% in northwest Kansas and 83% in southwest Kansas. The northwest now favors corn at middle yields, the southwest is a tie, and sorghum loses less in a short-crop year in both.
- USDA's Soybean Export Number Needs 23.3 Million More Tons. None of the Last Five Years Wrote Less Than 26.4 After Early October. Iowa Beans Are Still Bid 68 Cents Under November.2026/27 soybean commitments reached 22.79 million tons on October 1, 49% of USDA's raised 1.695-billion-bushel October forecast and tied with 2022/23 for the fastest start in six years. China holds 49% of the book; without China it is 8% smaller than a year ago. The tonnage still to be sold is the smallest requirement of any recent year, so the export risk sits above USDA's number. The pace has not reached the farm: Iowa's average soybean basis widened 9 cents in four weeks, and Iowa processors went from about 30 over November to about 46 under as harvest arrived.
- Iowa Cropland Earns 2.53% in Rent. The 10-Year Treasury Pays 5.21%, and Since the Land Survey Even the Inflation-Protected Yield Has Passed It.USDA's 2026 figures put gross cash-rent yields between 1.86% in Ohio and 3.26% in Nebraska across 11 Midwest states. That is 195 to 335 basis points under the 10-year Treasury and 350 to 490 under farm mortgage rates near 6.8%. The 10-year TIPS yield rose from 2.20% to 2.88% after the June survey, which puts Iowa, Illinois, Indiana and four other states under the real risk-free rate. Each quarter-point on the cap rate is worth about $960 on an Iowa acre, about 53 cents of corn if rent tracks a quarter of gross revenue.
- A $90 Ton of Nebraska Corn Stalks Leaves $14.52 After Custom Baling and Full Nutrient Replacement. Stalk Grazing Rents for $13 an Acre in Iowa and Removes $1.27 of Nitrogen. On 200-Bushel Corn, Baling Nets $29 to $67 an Acre and Grazing $12 to $27.At DTN's Sep 28–Oct 2 retail prices, a ton of stover carries $19.92 to $29.58 of N, P, K and S on three university figures, and $11.69 to $17.88 if only phosphate and potash are counted. Nebraska's 2026 custom rates put raking, baling and moving at $45.89 a ton. Break-even is $75.48 a ton at the field with every nutrient replaced and $56.71 on high-potassium soil. Per-acre grazing rents work out to 23 to 30 cents a head a day on a 200-bushel field, roughly half the lowest published per-head rate. No Nebraska or Kansas statewide stalk rent has been published for 2026.
- A Point of Moisture Costs 2.8 Cents a Bushel to Remove in a Mixed-Flow Dryer at Iowa's October Propane and 4.1 Cents in an Old Cross-Flow. Natural Air Costs 4.4, and Five Elevator Schedules Charge 4.5 to 7 Cents Once Shrink Is Counted.Dryer design now moves the cost of a point more than the propane price does. At EIA's October 12 Iowa propane price, a 3,000-Btu cross-flow dryer burns 50% more fuel per point than a 2,000-Btu mixed-flow or heat-recovery unit. In Ohio and Indiana the old dryer costs more per point than some elevators charge for the wettest points. Natural-air fans cost more per point than a 2,000-Btu propane dryer in all six Corn Belt states we priced, so natural air pays through low capital and gentle drying, not through energy.
- A 16-Row Downforce Retrofit Costs About $6,200 a Year to Own and Pays at 0.86 Bushel of Corn an Acre Over 1,500 Acres. The Independent Trials' Median Gain Is 2 Bushels, and None of the Five That Reported Statistics Found It Significant.Public prices put active hydraulic downforce on a 16-row planter at roughly $20,000 to $40,000 in 2026 dollars. At December 2027 corn and 7.12% money, a $30,000 kit needs 1.28 bushels on 1,000 acres. University and on-farm trials measured 0 to 10 bushels against a sensible fixed setting. The 4.5 to 10.4 bushel claims come from comparisons against settings chosen to be wrong.
- A 2,000-Gallon Diesel Tank Pays Past About 12,000 Gallons a Year. A 4,000 Needs 25,500. The Real Discount Starts at a 6,000-Gallon Transport Load, Which Is Also Where the Spill Plan Starts.At list prices, 7.12% money and $5.63 farm diesel, a double-wall tank costs $817 to $5,580 a year to own and keep full. Public fuel contracts price bigger tankwagon drops at 5 to 8 cents a gallon less, and a transport load at 15 to 83 cents less. Twenty-one years of weekly EIA prices give extra storage no value as a way to time the market.
- RTK Saves About $1.39 an Acre in Overlap Over a Free Correction Signal at Today's Fertilizer Prices. On a Deere Receiver, the $7,500 Unlock Makes a 'Free' State Network Cost Nearly as Much as the $1,500 Subscription.Deere's list prices put its satellite SF-RTK at $1,500 a receiver a year and the permanent RTK license that base stations and networks need at $7,500. Iowa and Minnesota charge nothing for their state networks and Illinois plans the same; Wisconsin charges $300 and Maine has proposed $500. Priced at October fertilizer and 2027 budget seed and chemical costs, sub-inch RTK saves about $1.39 a corn-soybean acre against Deere's free 6-inch signal and $3.98 against a 12- to 15-inch WAAS signal. On two receivers that makes RTK pay past about 1,870 to 3,550 acres against the free signal, depending on source, and 650 to 1,250 against WAAS. A farm-owned base never beats the subscription at Deere list prices below four receivers held ten years. No dealer publishes a base-station install price.
- A Phosphite Spray Supplies Under 2 Pounds of Phosphate-Equivalent an Acre at $12 to $19 a Pound, 14 to 23 Times What MAP Charges. It Earns Its Cost as a Fungicide on Potatoes, Not as Phosphorus on Corn, Soybeans or Wheat.Phosphite is not a form of phosphorus that crops can use. Soil microbes have to oxidize it first, and inside the plant it can block the signals that tell the crop it is short of phosphate. At ProPhyt's label rate of 3 to 4 pints an acre and public retail prices of $42 to $68 a gallon, one pass costs $16 to $34 before application. That pass has to return 3.1 to 6.7 bushels of December 2027 corn. The only replicated North American row-crop trials we found, at Oklahoma State, showed no consistent yield gain. Potato trials show real control of pink rot and late-blight tuber rot. The labels contradict each other: Wisconsin bans phosphite from phosphate guarantees, California requires it to be guaranteed as total rather than available phosphate, and a national fertilizer label we read guarantees it as 40% available. Buy phosphite as a fungicide against water molds, never as phosphorus.
- A Ton of Silicate Slag Has to Return 15 Bushels of Corn, or 6 Where the Field Needs Lime. Rice Needs 3 Hundredweight a Year. Florida Ran 28 Rice Trials to Set Its Rate. We Found One Replicated Corn Site, and It Showed No Yield Gain.At an estimated $75 a ton delivered and spread, one ton of calcium silicate slag costs 14.8 bushels of December 2027 corn, 6.1 bushels of soybeans or 10.4 of wheat. A full liming credit on acid ground cuts that to 6.2, 2.5 and 4.3. A Florida-rate rice application needs about 3.1 hundredweight a year over two crops, roughly 4% of the US average yield, and a cane application about 1.6% a year. University trials back rice and sugarcane on low-silicon soils with soil-test calibrations. For corn and soybeans we found three independent replicated sites, and Louisiana wheat work that reports yield components. The one corn site showed no yield response. Silicon is a labelled 'beneficial substance', not a plant nutrient. Corn Belt buyers should price slag as lime and treat the silicon as a free option.
- A $10-an-Acre Phosphate Biological Must Return 2 Bushels of Corn or Replace 12 Pounds of P2O5. In 56 Independent Prairie Site-Years It Lowered Yield 10 Times and Raised It 6.At DTN's first-October retail prices, MAP phosphate costs 81 cents a pound once its nitrogen is credited. A Penicillium bilaiae product at $10 an acre therefore has to return 1.96 bushels of December 2027 corn or let a grower drop 12.3 pounds of P2O5 with no yield loss. The largest US corn dataset, 461 trials funded by the product's developer, found 2.7 bushels in replicated plots. Independent Prairie trials found no consistent gain: 5 significant increases and 9 decreases in 47 spring wheat trials, and 1 up and 1 down in 9 canola site-years. No independent replicated trial we found showed the inoculant substituting for phosphate fertilizer. Where a field can safely lose 12 pounds of P2O5, the soil test already allows the cut without the product.
- Struvite Matches MAP Only Below About $510 a Ton. The Last Public Price Sheet We Found Had It at 3.2 Times MAP per Pound of Phosphate. The Trials Support It as a Quarter of a Blend or in the Seed Row, Not as the Whole P Program.At DTN's Sep 28–Oct 2 retail prices, MAP phosphate costs 81 cents a pound and DAP 78 cents once their nitrogen is credited, so a ton of 5-28-0-10Mg struvite is worth $497 to $569 with its magnesium valued at zero. No US retailer or survey we found publishes a struvite price. The last public dealer sheet, from January 2020, priced it 1.72 times MAP a ton. Replicated trials in Iowa, Arkansas, Ontario and Saskatchewan found struvite about equal to soluble phosphate in yield, mostly on acid or incorporated ground or as part of a blend. A cold-soil Manitoba test and a wheat pot study in alkaline soil found the granule releases little early phosphorus. At a $1,000 quote, a 25% struvite share of a 60-pound program adds $13 an acre, or 2.5 bushels of December 2027 corn.
State of the Industry
Last week's column called the gap between the Gulf barge and retail nitrogen the number to watch. This week the barge rose toward retail instead of retail falling toward the barge. Phosphate lost more North American supply, sulfur fell everywhere except Tampa, and grain slipped again.
Nitrogen turned up at the Gulf. NOLA urea barges were $435–445 a short ton for October–November shipment, against $422–435 a week earlier and $375–382 a year ago. December–January trades were reported at $450–465 (Advanced Turf Solutions, Oct 19, 2026). The same summary relays that India awarded less than a quarter of its 1.7-million-tonne tender after Chinese producers turned down the implied netbacks. Trading Economics' urea benchmark ended October 16 at $457.50 a tonne, 4.3% above the October 9 print (Trading Economics, Oct 16, 2026; our arithmetic). DTN's survey for October 5–9 put retail urea at $672 a ton, anhydrous at $977 and UAN32 at $485 (DTN/Progressive Farmer, Oct 14, 2026). Retail urea now sits about $232 above the middle of the barge range, against about $255 a week ago (our arithmetic; the two readings use different DTN survey weeks). Yara and Mosaic cut the October Tampa ammonia contract by $10 a tonne (Quantum Commodity Intelligence, Sep 28, 2026). We found no public November settlement.
Phosphate is flat on price and shrinking on supply. NOLA DAP barges were $800–805 and MAP $810–815 (Advanced Turf Solutions, Oct 19, 2026). Retail DAP averaged $934 and MAP $979 (DTN/Progressive Farmer, Oct 14, 2026). Mosaic has filed notice that it will idle its South Fort Meade operation in Florida for more than six months, citing sulfur supply, with 199 jobs ending from December 8 (Fertilizer Daily, Oct 16, 2026). Argus puts China's 2026 phosphate exports at almost nothing, against 5.3 million tonnes in 2025 (Fertilizer Daily, Oct 15, 2026).
Sulfur fell, except at Tampa. A China-denominated sulfur benchmark stood 21% below a month earlier on October 19, though still about double its year-ago level (Trading Economics, Oct 19, 2026). U.S. Gulf prilled sulfur eased to $900–1,000 a tonne FOB. The third-quarter Tampa molten contract, at $705 a long ton, still sets Florida acid costs (Advanced Turf Solutions, Oct 19, 2026). We found no report that the fourth-quarter contract has settled.
Potash eased at the river and rose at the counter. NOLA barges slipped to $340–355 as Belarusian and Russian cargoes arrived. Corn Belt terminals were $395–435 (Advanced Turf Solutions, Oct 19, 2026). Retail averaged $502, its first print above $500 since August 2024 (DTN/Progressive Farmer, Oct 14, 2026).
Grain gave up more ground. December corn settled at $4.74¼ on October 16, 5½ cents lower on the week. November soybeans lost 30¾ cents to $12.61¼ and December Chicago wheat 10½ cents to $6.60½ (USDA AMS, Oct 16, 2026; our arithmetic). Soybeans fell in a week when China booked an estimated 1.2–1.5 million tonnes of U.S. beans, which still face a 13% tariff against Brazil's 3% (Farm Policy News, Oct 16, 2026). North-central Illinois elevators bid an average $4.39 for corn and $12.26 for soybeans (USDA AMS, Oct 16, 2026). A ton of anhydrous now costs about 223 bushels of that corn, against about 221 a week ago (our arithmetic). By October 11, 33% of corn and 46% of soybeans were harvested, against averages of 39% and 50%. Iowa corn stood at 14% against 34% (USDA NASS, Oct 13, 2026).
Freight stayed expensive. The Illinois River barge rate rose to 825% of tariff, $38.28 a ton, 29% above a year ago. Diesel averaged $6.179 a gallon, $2.51 above last year (USDA AMS Grain Transportation Report, Oct 15, 2026).
| Benchmark | Level | Basis | Move |
|---|---|---|---|
| Anhydrous | $977/ton | Delivered retail, Oct 5–9 | +$39 MoM; +20.0% YoY |
| Urea | $672/ton | Delivered retail, Oct 5–9 | +$14 MoM; +11.8% YoY |
| UAN32 | $485/ton | Delivered retail, Oct 5–9 | +$28 MoM; +4.1% YoY |
| UAN28 | $442/ton | Delivered retail, Oct 5–9 | +$12 MoM; +5.5% YoY |
| Urea | $435–445/st | NOLA barge, Oct 16 | $422–435 a week earlier |
| Urea | $457.50/t | Benchmark, Oct 16 | +4.3% w/w; −0.6% m/m |
| Ammonia | $545/t* | Tampa CFR, October contract | −$10 m/m |
| DAP | $934/ton | Delivered retail, Oct 5–9 | +$11 MoM; +1.4% YoY |
| DAP | $800–805/st | NOLA barge, Oct 16 | $803–808 a week earlier |
| DAP | $802.50/t | Benchmark, Oct 16 | 0.0% w/w |
| MAP | $979/ton | Delivered retail, Oct 5–9 | +$17 MoM; +6.2% YoY |
| MAP | $810–815/st | NOLA barge, Oct 16 | Unchanged |
| Potash | $502/ton | Delivered retail, Oct 5–9 | +$8 MoM; +3.5% YoY |
| Potash | $340–355/st | NOLA barge, Oct 16 | $345–360 a week earlier |
| Sulfur | $900–1,000/t | U.S. Gulf prilled, FOB | "Eased slightly" |
| Sulfur | 6,077 CNY/t | China-denominated benchmark, Oct 19 | −21% m/m; +109% YoY |
| Dec corn | $4.74¼/bu | CBOT settlement, Oct 16 | −5½¢ w/w |
| Nov soybeans | $12.61¼/bu | CBOT settlement, Oct 16 | −30¾¢ w/w |
| Dec Chicago wheat | $6.60½/bu | CBOT settlement, Oct 16 | −10½¢ w/w |
| Corn, cash | $4.39/bu | N-central Illinois elevator avg, Oct 16 | −5½¢ w/w; +13% YoY |
| Soybeans, cash | $12.26/bu | N-central Illinois elevator avg, Oct 16 | −33¢ w/w; +25% YoY |
| U.S. diesel | $6.179/gal | On-highway retail, wk Oct 12 | −2.0¢ w/w; +$2.51 YoY |
| Illinois River barge | 825% of tariff | $38.28/ton, wk Oct 13 | 814% a week earlier; +29% YoY |
| Corn harvested | 33% | 18 states, Oct 11 | 39% five-year avg |
| Soybeans harvested | 46% | 18 states, Oct 11 | 50% five-year avg |
Sources: DTN/Progressive Farmer, Oct 14, 2026 (retail, Oct 5–9; month and year moves computed from the survey's month-ago and year-ago rows); Advanced Turf Solutions, Oct 19, 2026 (NOLA barges dated Oct 16, Gulf prilled sulfur); Trading Economics, accessed Oct 19, 2026 (urea and DAP, Oct 16; sulfur, Oct 19; week-on-week urea move computed against the Oct 9 print in our last issue); Quantum Commodity Intelligence, Sep 28, 2026 (*Tampa ammonia implied from the reported $10 cut to September's $555; the October level itself is not public); USDA AMS Illinois Grain Bids, Oct 16, 2026 (CBOT settlements and cash bids; week-on-week moves computed against the Oct 9 figures in our last issue, year-on-year from the report's year-ago averages); U.S. Energy Information Administration diesel price as reported in USDA AMS Grain Transportation Report, Oct 15, 2026; USDA NASS, Oct 13, 2026. The fourth-quarter Tampa sulfur and November Tampa ammonia contracts are left out: we found no public settlement for either.
The week's verdict: the urea barge rose while corn and soybeans fell, so waiting on wholesale nitrogen cost money this week; sulfur is the one input falling fast, and the unsettled Tampa contract decides whether that reaches U.S. phosphate.
References
- Advanced Turf Solutions, "U.S. Fertilizer Market Summary," Oct 19, 2026 (prices dated Oct 16, 2026). https://www.advancedturf.com/wp-content/uploads/2026/04/ATS-Fertilizer-Market-Update-10_19_2026.pdf
- Trading Economics, Urea, accessed Oct 19, 2026. https://tradingeconomics.com/commodity/urea
- Trading Economics, Di-ammonium Phosphate, accessed Oct 19, 2026. https://tradingeconomics.com/commodity/di-ammonium
- Trading Economics, Sulfur, accessed Oct 19, 2026. https://tradingeconomics.com/commodity/sulfur
- DTN/Progressive Farmer, "UAN32 Leads Fertilizer Prices Higher Again in First Week of October," Oct 14, 2026. https://www.dtnpf.com/agriculture/web/ag/crops/article/2026/10/14/uan32-leads-fertilizer-prices-higher
- Quantum Commodity Intelligence, "Tampa ammonia falls $10/mt for October," Sep 28, 2026 (headline and summary; full text restricted to members). https://www.qcintel.com/ammonia/article/tampa-ammonia-falls-10-mt-for-october-74032.html
- Fertilizer Daily, "Mosaic layoffs hit 199 at South Fort Meade as critical sulfur shortage idles phosphate operations," Oct 16, 2026. https://www.fertilizerdaily.com/20261016-mosaic-layoffs-south-fort-meade-sulfur/
- Fertilizer Daily, "China phosphate exports collapse to near zero in 2026 as sulfur squeeze bites, Argus sees 2mt rebound," Oct 15, 2026. https://www.fertilizerdaily.com/20261015-china-phosphate-exports-2026-sulfur-argus/
- USDA Agricultural Marketing Service, Illinois Grain Bids, Oct 16, 2026. https://www.ams.usda.gov/mnreports/ams_3192.pdf
- Farm Policy News (University of Illinois), "China Buys First US Soybeans Since Trump-Xi Meeting," Oct 16, 2026, relaying Bloomberg, Reuters and S&P Global. https://farmpolicynews.illinois.edu/2026/10/china-buys-first-us-soybeans-since-trump-xi-meeting/
- USDA National Agricultural Statistics Service, Crop Progress, Oct 13, 2026 (week ending Oct 11). https://release.nass.usda.gov/reports/prog4126.txt
- USDA Agricultural Marketing Service, Grain Transportation Report, Oct 15, 2026. https://ams-prod.azureedge.us/sites/default/files/media/GTR10152026.pdf
- Crop Root Zone, RZ-013, "State of the Industry" (Oct 9 prints for Gulf urea, CBOT settlements and north-central Illinois cash bids, and the prior week's barge-to-retail urea gap, with their original sources).
Weekly Briefing
Fertilizer
Gulf urea firms as India buys under a quarter — NOLA urea barges rose to $435–445 a short ton FOB for October–November shipment from $422–435, with December–January trades at $450–465 and Corn Belt terminals at $500–520. A distributor summary reports that Chinese producers turned down the $320–325 FOB netbacks implied by India's $352.10–356.25 CFR offers, and that India awarded less than 25% of its 1.7-million-tonne requirement. A follow-up Indian tender is expected. (Advanced Turf Solutions, Oct 19, 2026)
Mosaic to idle South Fort Meade for six months or more — A WARN notice dated October 5 lists 199 layoffs at the Polk County, Florida, phosphate operation, starting December 8. Mosaic cites constrained sulfur supply and says it will restart when sulfur availability allows. Output is already reduced at Bartow and Riverview in Florida and at Faustina and Uncle Sam in Louisiana. (Fertilizer Daily, Oct 16, 2026)
China's phosphate exports fall to almost nothing — Argus puts Chinese phosphate exports for 2026 near zero, against 5.3 million tonnes in 2025, with production held for domestic use as sulfur runs short. It expects a rebound to about 2 million tonnes next year if sulfur supply allows. China's urea exports, by contrast, run at 6 to 7 million tonnes. (Fertilizer Daily, Oct 15, 2026, relaying Argus Media)
USDA says fertilizer competition action is weeks away — Deputy Secretary Stephen Vaden told RFD-TV that announcements are coming "in the coming weeks," without naming companies or measures. The FTC has been examining fertilizer pricing since May, and on October 6 DOJ and USDA widened their agreement to cover fertilizer. No finding of illegal coordination has been made, and the defendants in the consolidated private suits deny the allegations. (Fertilizer Daily, Oct 13, 2026)
Crops
China books up to 1.5 million tonnes of U.S. soybeans — Reuters counts 18 to 23 cargoes, about 1.2–1.5 million tonnes, and Bloomberg at least 20, mostly for December–March loading. These are the first purchases since the late-September summit, and Reuters puts the season's total near 15 million tonnes against a 25-million-tonne target. U.S. beans still face a 13% tariff against 3% for Brazil, so state buyers are doing the buying. (Farm Policy News, Oct 16, 2026)
Harvest reaches a third of corn, Iowa at 14% — By October 11, 33% of corn and 46% of soybeans were harvested across 18 states, against five-year averages of 39% and 50%. Iowa had 14% of its corn and 31% of its soybeans out, against 34% and 59%. Illinois was ahead, at 51% of corn against 44%. (USDA NASS, Oct 13, 2026)
Early heat and drought leave corn smaller months later — Danforth Center researchers imaged 47 corn lines through 13 days of heat, drought or both, starting just after emergence. Combined stress cut plant size more than the two stresses would predict, and drought alone did not predict the combined response. In the two lines followed further, plants were still significantly smaller 61 days after planting. Controlled-facility work: a field follow-up is planned, and the report gives no effect sizes. (The Plant Journal, via Phys.org, Oct 19, 2026)
Winter canola adds 18% to corn-soy output, in a model — A University of Illinois simulation that double-crops winter canola between fall harvest and spring planting raised total productivity about 18% and the net carbon balance 21% to 27%. Modeled, not grown: yields, fertilizer needs and economics are not reported, and the federal feedstock rule currently covers only spring canola. (Herald-Whig, via Fertilizer Daily, Oct 14, 2026)
Home & Garden
Leave a light leaf layer, work the rest in — Illinois Extension says leaves covering about 10% to 20% of a lawn can stay. Mow them dry, so you can still see grass under the shreds. In beds, work leaves into the soil this fall so they break down by spring. Wait until temperatures stay below freezing before piling shredded leaves around roses, lavender or figs. (University of Illinois Extension, Oct 16, 2026)
Horse chestnut leaves sicken before the mines show — Hungarian researchers sampled trees in 10 city parks from 2021 to 2025 and found tissue around leaf-miner tunnels losing photosynthetic activity while it still looked healthy. Chlorophyll-fluorescence imaging picked up the change before visible damage, which could help time treatment. The report gives no figures and no home-treatment advice. (Plant Stress, via Phys.org, Oct 13, 2026)
Broccoli grows under magenta solar panels, just later — A Swedish team grew broccoli under semitransparent magenta panels on a working farm. The plants reached normal size but matured 25 days later. The authors see early use on community gardens or greenhouse roofs. Prototype: one season, one crop, and no electricity figures in the report. (Cell Reports Physical Science, Oct 2, 2026, via Phys.org)
Micronutrients
Sulfur drops a fifth in a month, except at Tampa — A China-denominated sulfur benchmark was 6,077 yuan a tonne on October 19, 21% below a month earlier but still about double a year ago. U.S. Gulf prilled sulfur eased to $900–1,000 a tonne FOB and Vancouver held at $850–900. The third-quarter Tampa molten contract, at $705 a long ton, still applies, and we found no fourth-quarter settlement. (Trading Economics, Oct 19, 2026; Advanced Turf Solutions, Oct 19, 2026)
White flour strips most of biofortified wheat's zinc — CIMMYT milled 60 zinc-biofortified bread wheat lines from Sonora at three extraction rates. Going from whole-grain flour to 70% extraction cut zinc from 49.1 to 14.7 mg/kg, about 70%, and iron about 49%. Breeding for zinc does little if the bran is milled off. (Frontiers in Plant Science, Oct 7, 2026)
Fighting infection drains a plant's iron — Salk Institute researchers found that a membrane protein, SRF3, triggers a defense burst against invading microbes that uses up cellular iron. As iron falls, the protein is pulled into the cell and the response stops. Model-plant lab work in Arabidopsis: crop applications are a stated hope, not a result. (Science Advances, via Phys.org, Oct 14, 2026)
Organics
Feather meal asks run 17% to 44% above last year — Feed-grade feather meal was offered at $500 a ton FOB in Mississippi and Arkansas in the week of October 12–16, against $347.50 and $352.50 a year earlier. It was $515 delivered in the Kansas City region against $357.50, and averaged $466.67 in Minnesota against $397.50. Ruminant blood meal traded at $1,620 FOB in the central U.S., down $50 on the week but against $1,045 a year ago. These are feed-ingredient quotes, not prices for approved organic fertilizer. (USDA AMS, Oct 16, 2026)
Excreta-based fertilizers match mineral yields in a meta-analysis — German researchers pooled 134 datasets across 31 crops and found no systematic yield penalty for recycled fertilizers made from separately collected human excreta. Heavy metals were mostly low. Not ready for the field supply chain: data on pharmaceutical residues and PFAS are incomplete, and the authors say no regulatory approval pathway exists. (Frontiers in Environmental Science, via Phys.org, Oct 13, 2026)
Replanted ground looks restored before its fungi are — A Flinders University team resampled soil fungi at revegetated former farmland over six years. Fungal function kept recovering, but the community as a whole made little further progress. The authors point to land-use history and leftover soil nutrients as possible brakes. (Molecular Ecology, via Phys.org, Oct 16, 2026)
Up and Coming
BioConsortia raises $15 million for a nitrogen-fixing seed treatment — The Davis, California, company's round came from an entity tied to an existing investor and will fund launches of its Always N microbial treatment and Zaffre biostimulant. No efficacy data: the report gives no trial results, and scaling into large corn markets is described as the next test. (Fertilizer Daily, Oct 13, 2026)
A plant thought unable to host fungi turns out to trade with one — University of Sheffield researchers found Arabidopsis, long considered unable to partner with root fungi, forms a working exchange with a Mucoromycotina fine root endophyte. The fungus supplied nitrogen and phosphorus and received more than 260% more plant carbon. Lab result in a model plant: no crop or field work is reported. (Current Biology, via Phys.org, Oct 16, 2026)
A 5,000-tonne green ammonia plant for cotton growers ships — All equipment for the solar-powered Good Earth plant near Moree, New South Wales, has been delivered, and the project moves to installation and commissioning. Start-up is planned for early 2027 and the target customers are local cotton growers. Not yet running: cost and offtake terms have not been disclosed. (Fertilizer Daily, Oct 19, 2026)
A $3 billion green ammonia plan is dropped as not viable — INOX Air Products told prospective investors in an October 5 filing that a planned 500,000-tonne-a-year green ammonia plant is "not commercially viable." Press reports tie it to a Maharashtra agreement, which neither the company nor the state has confirmed. (Fertilizer Daily, Oct 13, 2026)
Interesting
Iowa lets harvest trucks run at 90,000 pounds — Through November 7, Iowa waives weight limits and permits for vehicles up to 90,000 pounds gross hauling grain, hay, stover, fertilizer and manure, with axles up to 12.5% over the 20,000-pound limit. The waiver does not cover interstates, and posted road and bridge limits still apply. (USDA AMS Grain Transportation Report, Oct 15, 2026)
Norfolk ships the most corn in 40 years — The Norfolk, Virginia, customs district exported 1.74 million tonnes of corn in 2025/26, 472% above its five-year average and the most since 1984/85. Spain and Morocco took the largest shares. (USDA AMS Grain Transportation Report, Oct 15, 2026)
The barge fleet is aging faster than it is being built — Heartland Fabrication plans a $60 million expansion that could lift its Pennsylvania yard from 180 to 280 hopper barges a year by the end of 2027. The average covered hopper is nearly 19 years old, and the dry covered fleet shrank 552 barges in 2025. (USDA AMS Grain Transportation Report, Oct 15, 2026)
Sheep in solar fields help bees, up to a point — Three years of trials at a New York solar farm found two sheep a hectare raised wild bee, honey bee and lady beetle numbers 38% over mowing, and honey bees alone 83%. At eight a hectare the vegetation was best controlled, but honey bees fell 45%. One site with one mowed control. (Environmental Research Letters, via Phys.org, Oct 14, 2026)
Off the Wall Discovery
Mushroom peptides make salt taste 70% saltier — Researchers digested proteins from the edible mushroom Hypsizygus marmoreus and screened more than 6,000 peptides. One raised the saltiness of a weak salt solution by 70.59%, and its effect lasted up to 105 seconds. Bench chemistry only: none has been tried in real low-sodium food, and the mechanism comes from computer docking. (npj Science of Food, via Phys.org, Oct 13, 2026)
Lion droppings turn up hundreds of unknown microbes — Wits University researchers sequenced 23 fecal samples from 20 wild lions in Namibia's Etosha National Park and assembled 318 bacterial and 102 viral genomes, most unlike anything in reference databases. Early and computational: the genomes suggest new species, none has been formally named, and the sample is one park. (Animal Microbiome, via Phys.org, Oct 18, 2026)
Ammonium Sulfate Runs $538 to $813 a Ton Across Five USDA Panels This October. Take Out the Nitrogen and Its Sulfur Costs 52 to 65 Cents a Pound, and Oklahoma's ATS Line Delivers It for 45.
Credited at each panel's own urea price, nitrogen makes up 53–62% of the value of a ton of 21-0-0-24S, and the sulfur left over costs $0.52–$0.65 a pound. On the one panel that also quotes ATS, sulfur from ATS costs $0.09 a pound less than sulfur from ammonium sulfate. At 20 lb S that is under $2 an acre. So the choice of sulfur form this fall depends on whether the crop can use ammonium sulfate's nitrogen and whether the program is dry or liquid. The price of sulfur barely enters into it.
DTN's weekly retail survey does not cover ammonium sulfate. A Corn Belt grower deciding between 21-0-0-24S and urea plus a separate sulfur source therefore has no national benchmark for the product in question. USDA does publish one: five of its state and regional production cost reports carry an ammonium sulfate line alongside urea on the same distributor panel, with the same F.O.B. basis, in the same week. Their latest issues, dated Sep 29 to Oct 16, quote ammonium sulfate from $538.40 a ton in Pennsylvania to $812.75 in the Pacific Northwest (USDA AMS, Sep 29–Oct 16, 2026). One of them, Oklahoma, also quotes ATS, urea and both UAN grades. That makes it the only public panel where the dry and liquid sulfur programs can be priced side by side. This piece updates the nitrogen-credit method we used on two panels in late summer (Crop Root Zone, TRZ-0145, Sep 1, 2026; TRZ-0180, Sep 10, 2026) to all five October panels. It then adds the ATS comparison and asks the grower's question: for corn, canola and soybeans this fall, does ammonium sulfate beat urea plus a separate sulfur source?
1. Five October prints, and how much of each ton is nitrogen
What's new: Four of the five panels moved ammonium sulfate sideways or down over the last report interval, while the Pacific Northwest moved it up. Pennsylvania cut its average $45.60, the Inter-Mountain West $12.80, and Oklahoma and North Carolina were unchanged. The Pacific Northwest rose $42.55 to $812.75 while its urea rose only $8.65 (USDA AMS, reports 3726, 3883, 3621, 3159 and 3657).
Evidence: A ton of ammonium sulfate carries 420 lb of nitrogen and 480 lb of sulfur. A ton of urea carries 920 lb of nitrogen. If ammonium sulfate's nitrogen is valued at the urea price on the same panel, whatever remains of the price is what the panel is paying for sulfur.
| Panel, report date | AS, $/ton | Urea, $/ton | Urea $/lb N | AS N credit, $/ton | N share of AS price | Basis |
|---|---|---|---|---|---|---|
| Pennsylvania, Oct 2 | 538.40 | 628.00 | 0.683 | 286.70 | 53% | Distributor ask, F.O.B. |
| Oklahoma, Oct 16 | 553.00 | 638.08 | 0.694 | 291.30 | 53% | Distributor ask, F.O.B. |
| North Carolina, Oct 16 | 624.00 | 767.50 | 0.834 | 350.38 | 56% | Distributor ask, F.O.B. |
| Inter-Mountain West, Sep 29 | 672.00 | 888.75 | 0.966 | 405.73 | 60% | Distributor ask, F.O.B. |
| Pacific Northwest, Oct 16 | 812.75 | 1,094.25 | 1.189 | 499.55 | 62% | Distributor ask, F.O.B. |
Sources: USDA AMS Production Cost Reports — Pennsylvania (report 3726), Oct 2, 2026; Oklahoma (3621), North Carolina (3159) and Pacific Northwest (3657), Oct 16, 2026; Inter-Mountain West (3883), Sep 29, 2026 (week ending Oct 2). N credit = 420 lb × the panel's urea $/lb N. Crop Root Zone calculations. The Illinois report of Oct 16 quotes urea at $770.00 but carries no ammonium sulfate line, so no Corn Belt panel can be included.
The headline prices differ by $274 a ton, or 51%. Most of that is nitrogen. The nitrogen credit alone differs by $213 between Pennsylvania and the Pacific Northwest, and urea nitrogen costs 74% more per pound in the Pacific Northwest panel than in Pennsylvania's. The same calculation shows ammonium sulfate as a nitrogen source. At $553 a ton in Oklahoma, a pound of N bought as ammonium sulfate costs $1.32, against $0.69 as urea on the same panel. The national retail urea figure was $0.73 a pound of N in DTN's Oct 5–9 survey (DTN/Progressive Farmer, Oct 14, 2026).
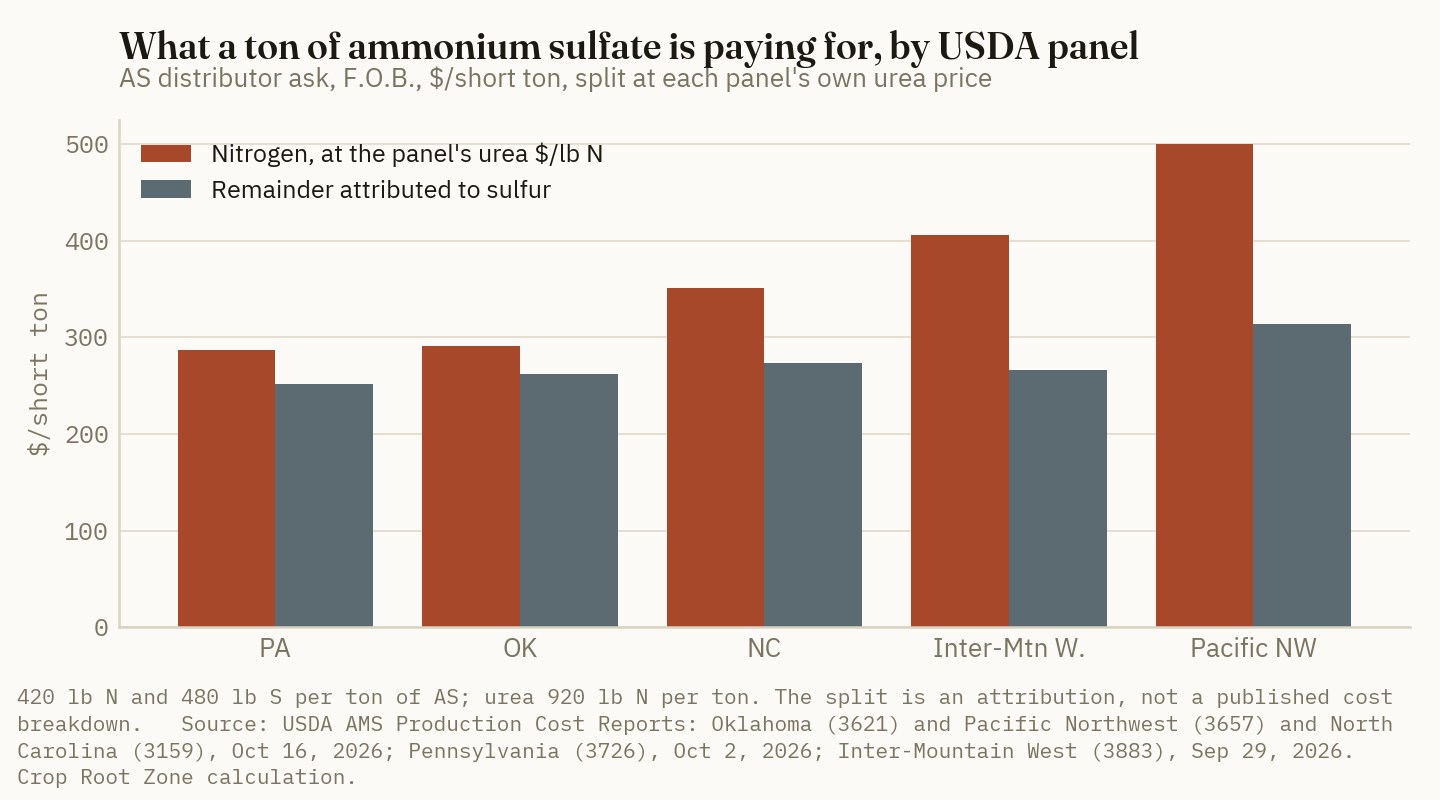
Ground Truth: Ammonium sulfate is mostly a nitrogen price. A grower comparing an $813 Pacific Northwest quote with a $553 Oklahoma quote is mainly comparing two urea markets. When a quote looks high, the first check is the local urea price, and the sulfur premium comes second. The reverse also holds: if urea falls this winter, ammonium sulfate should fall with it, even if sulfur does not move.
2. The sulfur inside the ton: 52 to 65 cents, against 45 for ATS and 31 for molten
What's new: Four panels value the sulfur in ammonium sulfate within 4.6 cents of each other, at $0.524 to $0.570 a pound. The Pacific Northwest, at $0.653, is the outlier, and it is rising. In late summer the same calculation gave $0.592 there and $0.579 in the Inter-Mountain West (Crop Root Zone, TRZ-0145, Sep 1, 2026). The Inter-Mountain West has since fallen to $0.555. The Pacific Northwest has risen about 10%, because its ammonium sulfate went up while its urea slipped from $1,099.80 to $1,094.25.
Evidence: Oklahoma's panel quotes "ATS (Sulfate)" at $370 to $450, averaging $415.00 a ton (USDA AMS, report 3621, Oct 16, 2026). We take this to be standard ammonium thiosulfate, 12-0-0-26S: 240 lb N and 520 lb S per ton. The report does not state the grade. ATS is almost always applied in a UAN program, so we credit its nitrogen at the same panel's UAN28 price of $420.10 a ton, or $0.750 a pound of N. On that basis ATS sulfur costs $0.452 a pound. Crediting the nitrogen at the urea rate instead gives $0.478. Gross, with no nitrogen credit, it is $0.798.
| Sulfur source and panel | Net $/lb S | |
|---|---|---|
| AS — Pacific Northwest, Oct 16 | 0.653 | ██████████ |
| AS — North Carolina, Oct 16 | 0.570 | █████████░ |
| AS — Inter-Mountain West, Sep 29 | 0.555 | ████████░░ |
| AS — Oklahoma, Oct 16 | 0.545 | ████████░░ |
| AS — Pennsylvania, Oct 2 | 0.524 | ████████░░ |
| ATS — Oklahoma, Oct 16 (N at UAN28) | 0.452 | ███████░░░ |
| Tampa molten sulfur contract, Q3 2026 (no N; not a fertilizer) | 0.315 | █████░░░░░ |
Sources: USDA AMS Production Cost Reports as in Table 1; ATS and UAN28 from the Oklahoma report (3621), Oct 16, 2026. Tampa: Argus Media's Q3 settlement of $705 a long ton delivered, Jul 13, 2026, relayed by Fertilizer Daily, Jul 15, 2026, divided by 2,240 lb. Net $/lb S = (product price − N credit) ÷ lb S per ton. Bars scale $0.653 to ten blocks. Crop Root Zone calculations.
$0.09/lb S
On Oklahoma's Oct 16 panel, the sulfur in ammonium sulfate costs $0.545 a pound net of nitrogen and the sulfur in ATS $0.452: $1.87 an acre at 20 lb S. (Crop Root Zone calculation from USDA AMS, Oklahoma Production Cost Report, Oct 16, 2026)
Sulfate sulfur sells at a large premium to the raw element. The ammonium sulfate residuals run 1.7 to 2.1 times the Tampa molten price per pound, and ATS runs 1.4 times. That is expected for a finished, plant-available product. It also explains why elemental sulfur and gypsum still win where their own constraints allow. We covered those trade-offs separately: elemental sulfur's oxidation break-even (Crop Root Zone, TRZ-0154, Sep 2, 2026) and gypsum's pricing outside the Tampa index (TRZ-0168, Sep 7, 2026). This piece compares the two sulfate forms a grower can put on this fall or next spring and expect to see in the crop.
One question we cannot answer from public data is how much of the Pacific Northwest's $0.10 premium over the other panels is real. That panel's ammonium sulfate range is $630 to $1,110, the widest of the five. Its average can move a long way when one distributor re-quotes. It was also the only panel to rise this fortnight.
Ground Truth: In the Plains, the South and the East, sulfur from ammonium sulfate costs about 55 cents a pound net, and ATS is about 10 cents cheaper. Ten cents on 20 pounds is $2 an acre, less than the cost difference between a dry pass and a liquid pass. That cost difference, not the sulfur price, should decide the form. A grower already running UAN should put sulfur in as ATS. A grower spreading urea should blend in ammonium sulfate. Switching N programs to save the sulfur difference does not pay. The Pacific Northwest is the exception to watch: if its premium holds into the next report, the gap there is about $4 an acre. That is still small, but it is enough to justify asking for an ATS quote.
3. The grower's decision by crop: the nitrogen credit carries the result
What's new: None of the net figures above apply if the grower cannot use ammonium sulfate's nitrogen. Agronomy sets the sulfur rates. University of Minnesota trials found that 20 lb S an acre applied ahead of corn, from any source, benefited both crops in a corn–soybean rotation. Direct sulfur applications to soybeans raised yield in only two of about 30 trials over roughly 18 years (University of Minnesota Extension, Feb 18, 2026). The Canola Council's guidance is 10–15 lb S an acre where soil tests are adequate and 20–25 lb or more where they are deficient. It names ammonium sulfate as the best source for spring application and warns against placing it with the seed (Canola Council of Canada, Mar 11, 2015).
Evidence: The table prices each crop's program on Oklahoma's Oct 16 panel. The dry program uses enough ammonium sulfate to meet the sulfur target, with urea for the remaining nitrogen. The liquid program uses ATS for the sulfur, with UAN28 for the remaining nitrogen. "Extra cost of the sulfur" is the cost above the same crop's nitrogen bought entirely as urea, or entirely as UAN28.
| Crop, N and S target per acre | Dry: AS + urea, $/acre | Extra cost of the sulfur, dry | Liquid: ATS + UAN28, $/acre | Extra cost of the sulfur, liquid |
|---|---|---|---|---|
| Corn, 180 lb N + 20 lb S | 135.75 | 10.90 | 144.07 | 9.04 |
| Canola, 120 lb N + 20 lb S | 94.13 | 10.90 | 99.06 | 9.04 |
| Wheat, 100 lb N + 15 lb S | 77.53 | 8.18 | 81.80 | 6.78 |
| Soybean, 0 lb N + 15 lb S (no N credit) | 17.28 | 17.28 | 11.97 | 11.97 |
Crop Root Zone illustrative estimates from USDA AMS, Oklahoma Production Cost Report, Oct 16, 2026: AS $553.00, urea $638.08, ATS $415.00, UAN28 $420.10, distributor ask, F.O.B. Products: AS 83.3 lb + urea 353.3 lb for corn; ATS 76.9 lb + UAN28 609.9 lb for corn; equivalent arithmetic for the other rows. Rates are illustrative. Product only: excludes application, freight, blending and any agronomic difference between forms. Soybean rows carry no nitrogen credit because the crop does not need it.
Three results matter for buying decisions.
First, for corn, canola and wheat, the sulfur is a small add-on to a nitrogen bill whichever form is used: $7 to $11 an acre on programs of $78 to $144. The liquid program costs more in total in Oklahoma because UAN28 nitrogen ($0.750 a pound) costs more there than urea nitrogen ($0.694). That reflects the choice of nitrogen form, not the sulfur.
Second, on soybeans the nitrogen credit disappears, and ammonium sulfate becomes the most expensive way to supply sulfur. Without the credit it costs $1.15 a pound of S, against $0.80 for ATS. The Minnesota trial record points to a cheaper option than either: put the 20 lb on the corn year and let the soybeans use the carryover.
Third, any ammonium sulfate applied beyond the sulfur need buys nitrogen at the ammonium sulfate price. Blenders commonly round sulfur up, for example 100 lb of ammonium sulfate (24 lb S) where 15 lb S was the target. Each extra 100 lb of ammonium sulfate costs $27.65 at Oklahoma's price. It supplies 21 lb of N worth $14.57 at urea's rate, so each extra 100 lb costs $13.08 more than the equivalent urea. Across 1,000 acres that is $13,000 for nitrogen the urea would have supplied anyway.
Ground Truth: Size the ammonium sulfate to the sulfur target and never to the nitrogen. Then the dry-versus-liquid gap is $2 an acre, and the form can follow the nitrogen program. The costly mistakes this fall are elsewhere: paying for ammonium sulfate's nitrogen on soybeans that will not use it, or rounding ammonium sulfate up so that 20 or 30 lb of N comes in at $1.32 a pound instead of $0.69. On a corn–soybean farm, the cheapest sulfur for the soybeans is what was put on the corn the year before.
4. What is setting ammonium sulfate supply and price now
What's new: The signals on the producer side point to a softer price, but the timing is uncertain. AdvanSix's Hopewell, Virginia site, which the company describes as the world's largest single-site ammonium sulfate producer, makes the fertilizer as a co-product of caprolactam, the nylon 6 feedstock (AdvanSix, Form 10-Q, Q2 2026). In August the company said it expected the North American ammonium sulfate fill program to drive a sequential decline in domestic pricing in the third quarter, in the face of competitive dynamics and higher sulfur input costs (AdvanSix, Aug 6, 2026).
Evidence:
| Driver | Latest public reading | Direction for fall/spring AS price | Source |
|---|---|---|---|
| Main US producer's fill program | Q3 domestic AS pricing expected lower than Q2 | Lower | AdvanSix, Aug 6, 2026 |
| Main US producer's Q2 sales | Plant Nutrients sales −16% to $131.4 million; company volume −15%, price +18% | Weak demand, high carry-in price | AdvanSix, Aug 6, 2026 |
| Caprolactam co-product output | Q2 caprolactam sales −6% to $62.6 million on soft carpet demand; Hopewell utilization in the mid-70s% during turnaround | Less co-product AS made, independent of fertilizer demand | AdvanSix, Aug 6, 2026; Q2 call summary, Aug 7, 2026 |
| US ammonium sulfate imports | 48,129 t in July 2026, −37% on July 2025 | Tighter, offsetting the fill discount | UN Comtrade via Crop Root Zone, TRZ-0278, Oct 14, 2026 |
| Tampa molten sulfur, Q4 contract | Unsettled publicly as of Oct 19; Q3 at a record $705/lt; trade expects $50–$100/lt lower | Lower cost for spring 2027 product | Argus, Jul 13, 2026; ICIS (search-indexed); TRZ-0270, Oct 12, 2026 |
| Brazilian demand for amsul | Imports at parity with urea in 2025, ahead in early 2026 | Competes for the same co-product stream | Crop Root Zone, TRZ-0180, Sep 10, 2026 |
Sources as listed. The AdvanSix volume and price figures are company-wide, not ammonium sulfate alone. The company does not publish an ammonium sulfate price. The ICIS expectation comes from a search-engine summary of its sulphur market page, which we could not open directly, and is labelled as such in the references.
The supply side of ammonium sulfate does not respond to its own price. About half the world's supply is a caprolactam co-product (Crop Root Zone, TRZ-0180, Sep 10, 2026). Hopewell's ammonium sulfate output follows what the nylon chain needs, not what farmers bid. A soft carpet market lowers co-product tonnage just as the fill program is trying to move tons, and those two pressures pull price in opposite directions. Imports are the other balancing source, and they fell by more than a third in July.
Cost is moving the other way. The sulfur that a producer converts into sulfuric acid for ammonium sulfate was priced at a record $705 a long ton in the third quarter. We estimated that a $50 cut in the fourth-quarter contract takes about $11 off the cost of a ton of ammonium sulfate. It would reach product in spring 2027, not this fall (Crop Root Zone, TRZ-0270, Oct 12, 2026). By our arithmetic, $11 a ton is $0.023 a pound of S if all of it lands on the sulfur. That alone would move the Oklahoma residual from $0.545 to about $0.52, still above ATS.
Ground Truth: The fall fill price is likely to be the low point of the ammonium sulfate season, not the start of a slide. Fill programs are discounts offered to move tons ahead of the spring peak, when the company says demand and granular pricing are strongest. A lower Tampa settlement would cut cost by about $11 a ton, but it arrives in spring, when seasonal demand will absorb it. A grower who needs sulfate sulfur for spring 2027 and can store dry product gives up little by booking ammonium sulfate at today's fill price. The main exception is the Pacific Northwest, where the panel is quoting a premium that the other four regions do not show.
5. How to test a quote this week
What's new: Each of the five panels gives a break-even ammonium sulfate price: the price at which its sulfur costs the same as ATS sulfur. The formula is 420 × local urea $/lb N + 480 × $0.452. Only Oklahoma quotes ATS, so applying its ATS cost to the other panels is our estimate. Those panels may price ATS differently.
Evidence:
| Panel | AS ask, $/ton | Break-even AS vs. ATS sulfur, $/ton | AS over break-even, $/ton | At 20 lb S, $/acre |
|---|---|---|---|---|
| Pennsylvania | 538.40 | 503.58* | 34.82* | 1.45* |
| Oklahoma | 553.00 | 508.18 | 44.82 | 1.87 |
| North Carolina | 624.00 | 567.26* | 56.74* | 2.36* |
| Inter-Mountain West | 672.00 | 622.61* | 49.39* | 2.06* |
| Pacific Northwest | 812.75 | 716.43* | 96.32* | 4.01* |
Crop Root Zone calculations from USDA AMS Production Cost Reports as in Table 1. *Assumes Oklahoma's ATS net sulfur cost of $0.452/lb applies on that panel. No other USDA panel publishes an ATS price. Per-acre column = excess ÷ 480 lb S × 20 lb S.
For a grower with a quote in hand, the check takes two steps. Divide the local urea price per ton by 920 to get urea's price per pound of N. Multiply that by 420 and subtract the result from the ammonium sulfate quote. Divide what is left by 480. A result of 50 to 57 cents is in line with four of the five USDA panels. A result above 65 cents is more than even the Pacific Northwest panel is paying, and worth a second quote or an ATS price before booking.
What to watch, in order:
- AdvanSix's third-quarter results on Nov 4 (AdvanSix, Oct 6, 2026). They will show whether the fill-program price decline the company expected materialized, and give the company's first read on spring ammonium sulfate demand.
- The Pacific Northwest panel's next fortnightly report. If its sulfur residual stays near $0.65 a pound while the other panels hold near $0.55, the regional premium is real.
- The fourth-quarter Tampa settlement. A cut of $50 to $100 a long ton lowers spring 2027 ammonium sulfate cost by roughly $11 to $22 a ton, by the scaling in TRZ-0270.
- US ammonium sulfate imports for August and September in the next Comtrade and Census releases, to see whether July's 37% drop was one month or a trend.
References
- USDA Agricultural Marketing Service, Oklahoma Production Cost Report (Bi-Weekly), report 3621, Fri Oct 16, 2026 (ammonium sulfate, ATS, urea, UAN28, UAN32; distributor ask, F.O.B.) — https://www.ams.usda.gov/mnreports/ams_3621.pdf
- USDA Agricultural Marketing Service, Pacific Northwest Production Cost Report (Bi-Weekly), report 3657, Fri Oct 16, 2026 — https://www.ams.usda.gov/mnreports/ams_3657.pdf
- USDA Agricultural Marketing Service, North Carolina Production Cost Report (Weekly), report 3159, Fri Oct 16, 2026 — https://www.ams.usda.gov/mnreports/ams_3159.pdf
- USDA Agricultural Marketing Service, Pennsylvania Production Cost Report (Bi-Weekly), report 3726, Fri Oct 2, 2026 — https://www.ams.usda.gov/mnreports/ams_3726.pdf
- USDA Agricultural Marketing Service, Inter-Mountain West Production Cost Report (Monthly), report 3883, Tue Sep 29, 2026 (week ending Oct 2, 2026) — https://www.ams.usda.gov/mnreports/ams_3883.pdf
- USDA Agricultural Marketing Service, Illinois Production Cost Report (Bi-weekly), report 3195, Fri Oct 16, 2026 (no ammonium sulfate line) — https://www.ams.usda.gov/mnreports/ams_3195.pdf
- DTN/Progressive Farmer, Russ Quinn, "UAN32 Leads Fertilizer Prices Higher Again in First Week of October," Oct 14, 2026 (survey week Oct 5–9, 2026) — https://www.dtnpf.com/agriculture/web/ag/crops/article/2026/10/14/uan32-leads-fertilizer-prices-higher
- AdvanSix Inc., "AdvanSix Announces Second Quarter 2026 Financial Results," Form 8-K Exhibit 99, Aug 6, 2026 — https://www.sec.gov/Archives/edgar/data/0001673985/000167398526000045/exhibit99q22026prearningsa.htm
- AdvanSix Inc., Form 10-Q for the quarter ended Jun 30, 2026 — https://www.sec.gov/Archives/edgar/data/0001673985/000167398526000049/asix-20260630.htm
- Nasdaq, "AdvanSix Q2 Earnings Call Highlights," Aug 7, 2026 (Hopewell utilization; search-indexed summary, page did not load in full) — https://www.nasdaq.com/articles/advansix-q2-earnings-call-highlights
- AdvanSix Inc., "AdvanSix to Release Third Quarter Financial Results and Hold Investor Conference Call on November 4," Oct 6, 2026, via Finviz — https://finviz.com/news/399047/advansix-to-release-third-quarter-financial-results-and-hold-investor-conference-call-on-november-4
- Fertilizer Daily, "Tampa sulfur price record," Jul 15, 2026 (relaying Argus Media's Jul 13, 2026 Q3 settlement of $705/lt) — https://www.fertilizerdaily.com/20260715-tampa-sulfur-price-record/
- ICIS, Sulphur prices, analytics and forecasts market page (Q4 contracts expected $50–$100/lt below Q3; search-engine summary only, page not opened) — https://www.icis.com/explore/commodities/fertilizers/sulphur/
- University of Minnesota Extension, Daniel Kaiser, "Is sulfur a mobile nutrient? Carryover…," Minnesota Crop News, Feb 18, 2026 — https://blog-crop-news.extension.umn.edu/2026/02/is-sulfur-mobile-nutrient-carryover.html
- Canola Council of Canada, Canola Watch, "Sulphur forms: Which to use and when," Mar 11, 2015 — https://www.canolacouncil.org/canola-watch/2015/03/11/sulphur-forms-which-to-use-and-when/
- Crop Root Zone, TRZ-0145, "Ammonium Sulfate Fell and Urea Rose in the Same Report, on the Same Day, From the Same Distributors," Sep 1, 2026
- Crop Root Zone, TRZ-0180, "Brazil Now Imports as Much Ammonium Sulfate as Urea. It Is Bidding for a Nylon Byproduct, and So Are You.," Sep 10, 2026
- Crop Root Zone, TRZ-0270, "Twelve Days Into the Quarter, Tampa Sulfur Is Still Unsettled at $705. Gulf Producers Cut October Prices $45 to $70, and a $50 Cut Is Worth $18 on a Ton of DAP.," Oct 12, 2026
- Crop Root Zone, TRZ-0278, "US Urea Imports More Than Doubled in July. Ammonia Imports Hit Their Lowest July Since at Least 2019, and UAN Fell a Third.," Oct 14, 2026 (UN Comtrade HS 310221)
- Crop Root Zone, TRZ-0154, "Sulfate Sulfur Costs 81 Cents a Pound Net. Elemental Wins If More Than 41% of It Oxidizes.," Sep 2, 2026
- Crop Root Zone, TRZ-0168, "Every Sulfur Fertilizer Is Priced Off One Tampa Contract. Gypsum Is the Exception, and That Is Getting Less True.," Sep 7, 2026
Disclosures
Crop Root Zone is an independent publication. Nothing here is investment advice. Market calls, where included, reflect the editors' own read and are not a recommendation to buy or sell any security.
Retail DAP Sits $131.50 Over the NOLA Barge, the Narrowest October Gap in Four Years. Measured Against Summer Fill, the Dealer's Markup Has Shrunk Three Falls Running.
DTN's Oct 5–9 survey put retail DAP at $934 a ton with the CME NOLA front month at $802.50. That $131.50 gap compares with $162–$176 in the last three Octobers, and on a June–August fill basis the retail layer over Corn Belt wholesale has fallen from $155 in 2023 to $92 now. Phosphate has less cushion between farm and Gulf than any other product on the board, so retail DAP will only come down if the barge does, at roughly 55 cents on the dollar, two to three months later.
Retail DAP averaged $934 a ton in DTN's survey week of Oct 5–9, up $11 on the month and $13 on the year (DTN/Progressive Farmer, Oct 14, 2026). The NOLA DAP barge benchmark has barely moved. The CME DAP FOB NOLA front month settled at $802.50 a short ton on Oct 15 and has stayed between $800 and $802.50 since mid-September (CME via Investing.com, Oct 15, 2026). The difference, $131.50 a ton, is $9 wider than the $122.50 we measured on Sep 29 (Crop Root Zone, TRZ-0242, Sep 30, 2026). It is still narrower than in any of the last three Octobers. Anhydrous now sits $483 over its benchmark (Crop Root Zone, TRZ-0282, Oct 15, 2026). Phosphate is the opposite case: the farm price is closer to the Gulf than it has been in any fall this desk can measure on public data. This piece measures that gap against history, splits it into freight and retail layers, and estimates what it means for a grower pricing fall or spring phosphate.
1. The October gap: $131.50, against $162–$176 in the last three falls
What's new: USDA publishes monthly regional fertilizer prices derived from Green Markets weekly reports, starting January 2023. They include a DAP series for the US Gulf NOLA barge and one for Corn Belt wholesale (USDA AMS/Green Markets, retrieved Oct 16, 2026). The latest month is September 2026, when NOLA DAP averaged $800.63 a short ton. Set against DTN's mid-month retail survey, that gives a retail-over-barge gap for each fall back to 2023.
Evidence:
| Month | Retail DAP, $/ton | NOLA barge, $/st | Retail minus NOLA, $/st | Gap as % of retail | Basis |
|---|---|---|---|---|---|
| Oct 2023 | 711 | 534.75 | 176.25 | 24.8% | Delivered retail vs. FOB barge, monthly avg |
| Oct 2024 | 735 | 573.44 | 161.56 | 22.0% | Same |
| Oct 2025 | 921 | 754.00 | 167.00 | 18.1% | Same |
| Sep 2026 | 923 | 800.63 | 122.38 | 13.3% | Same |
| Oct 2026 | 934 | 802.50* | 131.50 | 14.1% | Delivered retail vs. CME front month |
Sources: Retail — DTN/Progressive Farmer, Oct 15, 2024 (Oct 7–11, 2024; year-ago Oct 9–13, 2023), Oct 15, 2025 (Oct 6–10, 2025) and Oct 14, 2026 (Oct 5–9 and Sep 7–11, 2026). NOLA — USDA AMS, Fertilizer Prices by Region, monthly averages derived from Green Markets, retrieved Oct 16, 2026. *October 2026 uses the CME DAP FOB NOLA front-month settlement of Oct 15, 2026 via Investing.com, because USDA has not yet published October. It is a different assessment from the Green Markets average and is not directly comparable to the earlier rows. Spreads are Crop Root Zone calculations.
$131.50/ton
Retail DAP over the NOLA barge in mid-October 2026, against $162–$176 in October 2023, 2024 and 2025. (Crop Root Zone calculation from DTN/Progressive Farmer, Oct 14, 2026; CME via Investing.com, Oct 15, 2026; USDA AMS/Green Markets, retrieved Oct 16, 2026)
The dollar gap is narrower than in any of the three prior Octobers, even though the barge price is $229 to $268 a ton higher than in 2023 and 2024. As a share of the farm price, the spread has fallen from about a quarter to about a seventh. The bases differ, so the table is not a margin calculation. DTN's figure is a delivered retail average from one survey week, while the barge price is a monthly average at a Gulf river terminal. The direction is clear all the same, and it holds whichever October benchmark is used.
On the same arithmetic, DAP now has the smallest retail-over-wholesale gap of the major products we track.
| Product, latest reading | Retail minus benchmark, $/ton | Gap as % of retail | |
|---|---|---|---|
| Anhydrous vs. Tampa contract (Oct 2026) | 483.00 | 49% | ██████████ |
| Urea vs. NOLA Gulf futures (Oct 14, 2026) | 238.50 | 35% | █████░░░░░ |
| Potash vs. NOLA barge (Sep 18, 2026) | 154.00 | 31% | ███░░░░░░░ |
| DAP vs. NOLA barge (Oct 15, 2026) | 131.50 | 14% | ███░░░░░░░ |
Sources: Anhydrous and urea — Crop Root Zone, TRZ-0282, Oct 15, 2026 (Tampa converted to short tons). Potash — Crop Root Zone, TRZ-0208, Sep 18, 2026. DAP — this article. Percentages use the DTN retail price for each product on the same date. Bars scale $483 to ten blocks. Benchmarks differ by product, so the comparison shows relative cushion, not relative margin.
Ground Truth: DAP has the least room between the Gulf and the farm of any major nutrient right now. For anhydrous, the question this fall is when dealers will pass a lower wholesale cost through. For DAP there is little cost left to pass through. At $131.50 over the barge, a fall DAP quote is already close to replacement cost. A grower waiting for retail phosphate to fall is in practice waiting for the NOLA barge to fall.
2. Splitting the gap: the freight layer held, the dealer layer shrank
What's new: The Green Markets Corn Belt series shows where the gap has narrowed. In September 2026 Corn Belt wholesale DAP averaged $855.63 a short ton. That was $55.00 over NOLA, and the September retail survey sat $67.38 over Corn Belt wholesale (USDA AMS/Green Markets, retrieved Oct 16, 2026; DTN/Progressive Farmer, Oct 14, 2026).
Evidence: We treat the first layer, Corn Belt wholesale minus NOLA, as barge freight upriver, terminal handling and the inland wholesaler's spread. We treat the second, DTN retail minus Corn Belt wholesale, as the retailer's layer: storage, truck delivery, credit and margin. Neither layer is published as such. These are our working definitions, and the Green Markets regional definitions decide exactly where the Corn Belt price is struck.
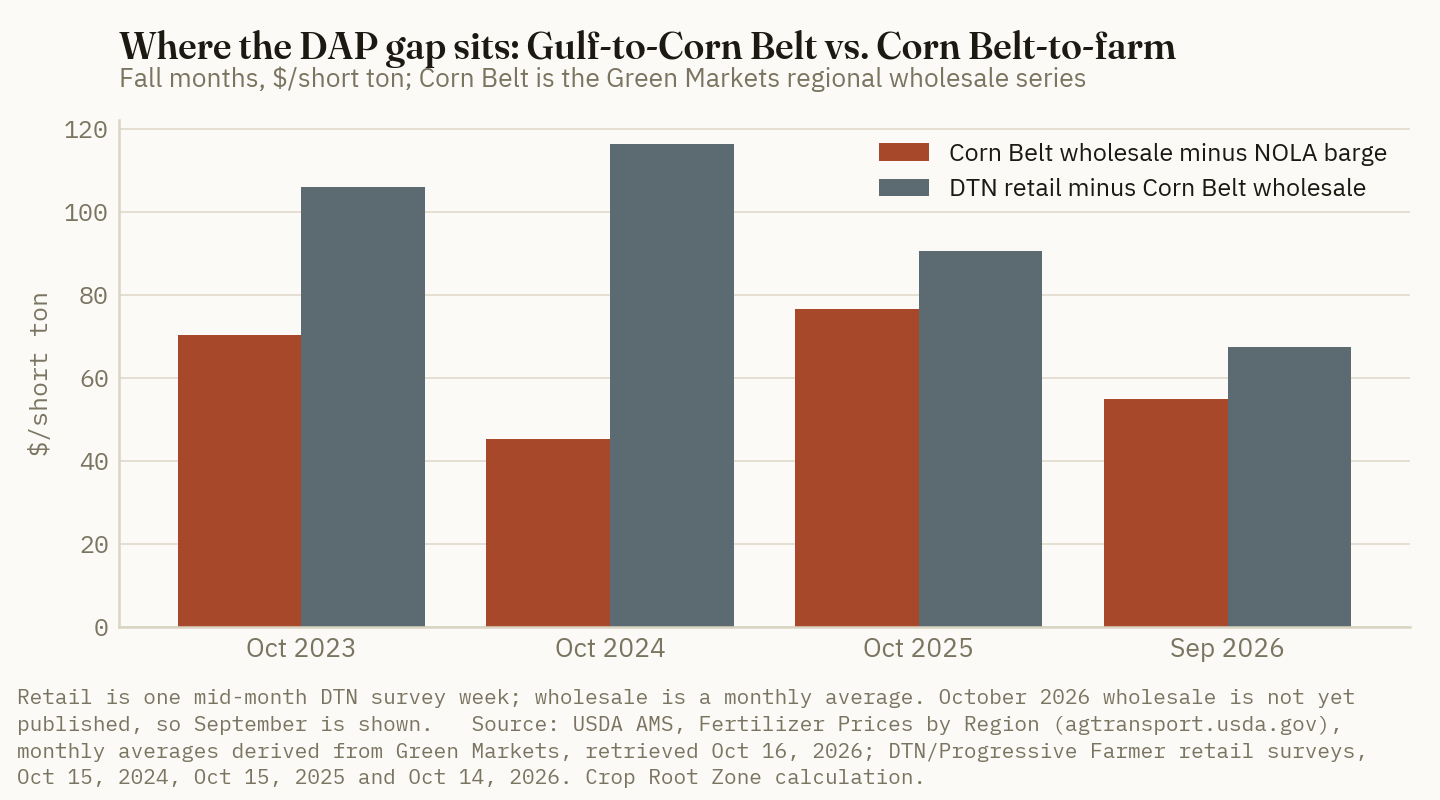
The freight layer moves around but shows no trend: $70 in October 2023, $45 in October 2024, $77 in October 2025 and $55 this September. The retail layer has the trend: $106, $116, $91, then $67. Most of the narrowing since 2024 is in the retail layer.
Freight costs are not falling, which makes the shrinking retail layer more notable. USDA's Grain Transportation Report put the US average diesel price at $6.179 a gallon for the week ending Oct 12, $2.514 above a year earlier. The southbound St. Louis barge rate was $26.85 a ton for the week of Oct 13, up 34% on the year, and Illinois River rates have been above their three-year average in every week of 2026 (USDA AMS, Oct 15, 2026). Those are grain rates moving downriver. Fertilizer moves upriver on the backhaul, and USDA does not publish an upbound fertilizer rate. The grain rates show a tight barge market and expensive trucking, but they do not measure DAP freight directly. A delivered retail price includes the truck leg to the farm, which is where $6 diesel shows up. That makes the retail layer's fall to $67 harder to explain as cost relief.
Ground Truth: The squeeze is in the dealer layer, not in freight. Retailers are delivering DAP for about $67 a ton over Corn Belt wholesale in a year when diesel is up $2.50 a gallon, against $116 two falls ago. That is not a sustainable steady-state markup on an $850 product. We read it as a retail price held below full cost recovery to keep phosphate tons moving at a price growers were already resisting. If the barge holds near $800 into spring, the more likely move in that layer is wider, not narrower. A grower should not count on today's thin gap lasting.
3. The lag test: wholesale moves first, retail follows about halfway
What's new: Same-month comparisons can mislead when wholesale is moving, because dealers sell from inventory bought earlier. Testing the gap against the dealer's likely fill cost changes the picture for 2025, and it confirms the narrowing for 2026.
Evidence: The monthly record since early 2025 shows the gap swinging from $75 to $246 and back, almost entirely because of the barge's movements.
| Month | Retail DAP, $/ton | NOLA barge, $/st | Corn Belt wholesale, $/st | Retail minus NOLA, $/st |
|---|---|---|---|---|
| Jan 2025 | 739 | 582.70 | 626.00 | 156.30 |
| Apr 2025 | 781 | 635.00 | 676.25 | 146.00 |
| Jul 2025 | 811 | 736.00 | 782.50 | 75.00 |
| Sep 2025 | 862 | 780.63 | 839.38 | 81.38 |
| Oct 2025 | 921 | 754.00 | 830.50 | 167.00 |
| Dec 2025 | 873 | 627.50 | 693.33 | 245.50 |
| Jan 2026 | 847 | 619.20 | 686.50 | 227.80 |
| Mar 2026 | 851 | 658.25 | 705.00 | 192.75 |
| Apr 2026 | 894 | 725.25 | 799.38 | 168.75 |
| Jun 2026 | 910 | 783.75 | 845.00 | 126.25 |
| Jul 2026 | 911 | 781.30 | 839.00 | 129.70 |
| Sep 2026 | 923 | 800.63 | 855.63 | 122.38 |
Sources: Retail — DTN/Progressive Farmer, Jan 21, Apr 22, Jul 22 and Oct 14, 2026; Oct 15, 2025 (mid-month survey weeks; year-ago and month-ago columns used for 2025 and for December, March and June). Wholesale — USDA AMS, Fertilizer Prices by Region, monthly averages derived from Green Markets, retrieved Oct 16, 2026. Spreads are Crop Root Zone calculations.
The pattern is a lag. When the barge rose from $635 in April 2025 to $795 in August, retail climbed more slowly and the gap fell to $75. When the barge fell $135 from October 2025 to January 2026, retail fell only $74, and the gap ballooned to $246. In our reading of this table, the Sep 2025 gap of $81 was not a thin margin. It was a dealer selling summer inventory on a rising market. The $246 of December was the reverse. Measured on that same-month basis, last October's $167 overstated the markup, because wholesale had already turned down.
The fair comparison is retail against what the dealer most likely paid. For fall DAP, that means the June–August fill.
| October retail measured against… | 2023 | 2024 | 2025 | 2026 |
|---|---|---|---|---|
| June–August NOLA average | 230.32 | 192.54 | 172.18 | 147.82 |
| June–August Corn Belt average | 155.21 | 127.79 | 124.88 | 91.83 |
| Same-month NOLA (Table 1) | 176.25 | 161.56 | 167.00 | 131.50* |
All values $/short ton, October DTN retail minus the stated wholesale average. Crop Root Zone calculations from DTN/Progressive Farmer, Oct 15, 2024, Oct 15, 2025 and Oct 14, 2026, and USDA AMS/Green Markets, retrieved Oct 16, 2026. *CME front month, Oct 15, 2026. Which fill window any one dealer used is not published.
On the fill-cost basis the narrowing is steady: the retail markup over summer Corn Belt wholesale fell from $155 to $128 to $125 to $92 across four falls. This is the opposite of anhydrous, where the October markup over July–August fill was $387 a short ton, only $17 below last year's $404 (Crop Root Zone, TRZ-0282, Oct 15, 2026). It also refines our September reading. Then we treated the $120.50 retail-to-NOLA gap as a margin (Crop Root Zone, TRZ-0214, Sep 21, 2026). Measured against fill cost it is thinner than that, and it is getting thinner.
The same table gives a rough pass-through rate. From April to September 2025 the barge rose $145.63 and retail rose $81, about 56%. From October 2025 to January 2026 the barge fell $134.80 and retail fell $74, about 55%. From March to June 2026 the barge rose $125.50 and retail rose $59, about 47%. Over windows of three to five months, retail has moved about half to 55% of the barge move, in both directions.
Ground Truth: The retail DAP price is a lagged, damped copy of the NOLA barge. It moves about 55 cents per barge dollar and arrives two to three months late. The lag is symmetric enough to matter for timing. It protects a grower who waits in a rising market and costs one who waits in a falling market, because retail is still catching up with a move that has already happened. With the barge flat at $800 for four months and retail already caught up, there is no catch-up move pending in either direction this fall. That is the main difference from last October, when retail was still on its way up and a $135 barge decline was about to start.
4. Why the barge itself stays near $800: sulfur and curtailed supply
What's new: If the dealer layer is already thin, the price a grower pays depends on the barge, and the barge depends on producer cost and supply. Both point to a high floor.
Evidence: The Tampa molten sulfur contract settled at a record $705 a long ton for the third quarter, up $50 from $655 in the second, after Middle East sulfur exports through the Strait of Hormuz were largely cut off. US Gulf export sulfur was assessed at $1,100–$1,150 a tonne FOB in early July (Fertilizer Daily, Jul 15, 2026, relaying Argus). Mosaic, the largest US phosphate producer, said its third-quarter sulfur contracts settled at that $705 level and would "primarily be reflected in fourth quarter operating results." It reported a second-quarter phosphate gross margin of minus $4 a tonne, against $67 a year earlier, on a DAP price of $773 a tonne FOB plant (Mosaic, Aug 4, 2026).
| Phosphate cost and supply marker | Value | Date | Source |
|---|---|---|---|
| Tampa molten sulfur contract, Q3 2026 | $705/lt delivered | Jul 13, 2026 | Argus via Fertilizer Daily |
| Tampa molten sulfur contract, Q2 2026 | $655/lt delivered | Q2 2026 | Argus via Fertilizer Daily |
| Mosaic sulfur cost consumed, Q2 2026 | $522/lt | Q2 2026 | Mosaic |
| Mosaic phosphate gross margin, Q2 2026 | −$4/t | Q2 2026 | Mosaic |
| Mosaic Q3 DAP price guidance | $820–$840/t FOB | Q3 2026 | Mosaic |
| Mosaic Q3 phosphate sales guidance | 1.1–1.4 million t | Q3 2026 | Mosaic |
| Mosaic Q2 2025 phosphate sales, for comparison | 1.5 million t | Q2 2025 | Mosaic |
Sources: Fertilizer Daily, Jul 15, 2026; The Mosaic Company, Q2 2026 results release, Aug 4, 2026. $/lt is per long ton; $/t is per metric tonne.
Supply is constrained as well as expensive. Mosaic said it began a partial phosphate curtailment in May and added curtailments in early July, leaving its Faustina plant fully idle and Bartow running at 40% of its target rate (Mosaic, Aug 4, 2026). Imports are the balancing source. The July suspension of the countervailing duty on Moroccan phosphate opened the door wider, but retail DAP has not fallen since (Crop Root Zone, TRZ-0209, Sep 18, 2026). We could not find a public report of a fourth-quarter Tampa sulfur settlement as of Oct 16. With the third-quarter contract only now reaching producer costs, the cost floor under the barge is still rising.
Mosaic's Q3 guidance of $820–$840 a tonne FOB plant is about $744–$762 a short ton. That is below the September NOLA barge average of $800.63, but the two are not like-for-like. Mosaic's figure is a realized average across domestic and export sales at the plant gate. The barge is a spot river-terminal price. The useful point is that producer realizations and the barge are both near $750–$800 a short ton, while producer margins are around zero. Neither end of the chain has much room to cut.
Ground Truth: With a record sulfur contract feeding into fourth-quarter producer costs and the largest domestic producer running well below capacity, a fall in the NOLA barge would most likely come from outside the US, through Indian and Chinese demand and export policy, not from US cost relief. That is why the fall phosphate decision is a bet on the world DAP market, and why the dealer quote is the wrong place to look for savings. Our September pieces on China's export licences and India's subsidy timing are the relevant watch list (Crop Root Zone, TRZ-0214, Sep 21, 2026; Crop Root Zone, TRZ-0242, Sep 30, 2026).
5. What it means for a grower pricing fall phosphate
What's new: At $934 a ton, a 150 lb/acre DAP rate costs $70.05 an acre. The $131.50 gap over the barge is $9.86 of that. Applying the roughly 55% pass-through from Section 3 to a range of barge moves gives the value of waiting.
Evidence: The scenarios assume the barge moves from today's $802.50 by early 2027 and retail follows at 55%. They are estimates built from the 2025–26 record, not forecasts.
| NOLA barge by Jan–Feb 2027 | Barge change, $/st | Implied retail DAP, $/ton | Change at 150 lb/acre |
|---|---|---|---|
| $702.50 (smaller than last winter's $135 drop) | −100 | 879* | −$4.13* |
| $752.50 | −50 | 907* | −$2.06* |
| $802.50 (flat) | 0 | 934* | $0.00* |
| $852.50 | +50 | 962* | +$2.06* |
| $902.50 | +100 | 989* | +$4.13* |
*Crop Root Zone estimates: $934 retail (DTN/Progressive Farmer, Oct 14, 2026) plus 0.55 × the barge change; per-acre values at 150 lb DAP (0.075 ton). 150 lb/acre is illustrative. Excludes application, prepay discounts and dealer-to-dealer differences.
A $100 barge move in either direction is worth about $4 an acre at the farm over the winter. Carrying cost is about the same size. Paying $934 a ton in November instead of April costs about $31 a ton, or $2.33 an acre, at an illustrative 8% annual rate (Crop Root Zone estimate; use your own operating-line rate). For spring-applied phosphate, deferring the purchase pays for itself unless the barge rises by more than about $57 a ton. Fall-applied phosphate has to be bought now, so the timing question does not arise.
The quote is the part a grower can test. The national average sits about $131.50 over the barge. Against September's Corn Belt wholesale average it sits $67 (September retail) to $78 (October retail) over. A delivered Corn Belt DAP quote much above $950 a ton is wider than the national retail layer has run this fall, and it is worth a second quote, allowing for local freight and service. MAP carries its own premium and nitrogen credit; we set out that comparison in August (Crop Root Zone, TRZ-0111, Aug 20, 2026).
Ground Truth: For most growers this fall, phosphate timing is a small decision. A plausible winter barge move is worth $2–$4 an acre, roughly the interest on paying early. The larger risk is uneven: the dealer layer is thin and could widen by $30–$50 a ton without any wholesale move, as anhydrous's seasonal step did this fall. That risk falls on whoever buys last. Our read is to lock in fall-applied tons and any spring tons that can be stored on a quote near $934, and to leave the rest for a spring price that follows the barge. Growers should not expect dealers to cut a margin they have already cut.
What to watch, in order:
- USDA's October Green Markets average, due in the next quarterly update. An October NOLA figure near $800 confirms the current gap. A drop below $780 starts a pass-through clock of two to three months.
- The fourth-quarter Tampa sulfur settlement. A further rise from $705 strengthens the producer-cost floor under the barge.
- DTN's November surveys. A DAP step of $20 or more with a flat barge would mean dealers are rebuilding the retail layer, not following wholesale.
- Indian rabi subsidy rates and Chinese export licences, which are the most likely triggers for a barge move of $50 or more.
References
- DTN/Progressive Farmer, Russ Quinn, "UAN32 Leads Fertilizer Prices Higher Again in First Week of October," Oct 14, 2026 (survey week Oct 5–9, 2026; month-ago Sep 7–11, 2026; year-ago Oct 6–10, 2025) — https://www.dtnpf.com/agriculture/web/ag/crops/article/2026/10/14/uan32-leads-fertilizer-prices-higher
- DTN/Progressive Farmer, Russ Quinn, retail fertilizer survey, Oct 15, 2025 (survey week Oct 6–10, 2025; month-ago Sep 8–12, 2025) — https://www.dtnpf.com/agriculture/web/ag/crops/article/2025/10/15/urea-retail-price-5-anhydrous-dap
- DTN/Progressive Farmer, Russ Quinn, retail fertilizer survey, Oct 15, 2024 (survey week Oct 7–11, 2024; year-ago Oct 9–13, 2023) — https://www.dtnpf.com/agriculture/web/ag/crops/article/2024/10/15/retail-fertilizer-prices-continue
- DTN/Progressive Farmer, Russ Quinn, "Fertilizer Prices Continue Downward Trend," Jul 22, 2026 (survey week Jul 13–17, 2026; month-ago Jun 15–19, 2026; year-ago Jul 14–18, 2025) — https://www.dtnpf.com/agriculture/web/ag/crops/article/2026/07/22/fertilizer-prices-continue-downward
- DTN/Progressive Farmer, Russ Quinn, "6 Fertilizer Prices See Sizeable Moves Higher," Apr 22, 2026 (survey week Apr 13–17, 2026; month-ago Mar 16–20, 2026; year-ago Apr 14–18, 2025) — https://www.dtnpf.com/agriculture/web/ag/crops/article/2026/04/22/6-fertilizer-prices-see-sizeable
- DTN/Progressive Farmer, Russ Quinn, "Seven Fertilizers Show Lower Prices," Jan 21, 2026 (survey week Jan 12–16, 2026; month-ago Dec 15–19, 2025; year-ago Jan 13–17, 2025) — https://www.dtnpf.com/agriculture/web/ag/crops/article/2026/01/21/seven-fertilizers-show-lower-prices
- USDA Agricultural Marketing Service, Fertilizer Prices by Region (agtransport.usda.gov, dataset 8bgf-5mdv), monthly averages derived from weekly Green Markets reports with permission; DAP US Gulf NOLA and Corn Belt series, Jan 2023–Sep 2026, retrieved Oct 16, 2026 — https://agtransport.usda.gov/d/8bgf-5mdv
- Investing.com, DAP FOB NOLA Futures Historical Data (CME front month, delayed), settlements Sep 16–Oct 15, 2026, retrieved Oct 16, 2026 — https://www.investing.com/indices/dap-fob-nola-futures-historical-data
- USDA Agricultural Marketing Service, Grain Transportation Report, Oct 15, 2026 (diesel week ending Oct 12; barge rates week of Oct 13) — https://www.ams.usda.gov/sites/default/files/media/GTR10152026.pdf
- The Mosaic Company, "The Mosaic Company Reports Second Quarter 2026 Results," Exhibit 99.1, Aug 4, 2026 — https://s1.q4cdn.com/823038994/files/doc_financials/2026/q2/Press-Release-Q2-2026-Exhibit-99-1-Publish.pdf
- Fertilizer Daily, "Tampa sulfur price record," Jul 15, 2026 (relaying Argus Media's Jul 13, 2026 Q3 Tampa molten sulfur settlement) — https://www.fertilizerdaily.com/20260715-tampa-sulfur-price-record/
- Crop Root Zone, TRZ-0282, "Retail Anhydrous Rose $39 in the Month the Tampa Contract Fell. At $977 It Sits $483 Over Wholesale, and Only Summer-Fill Cost Still Explains the Gap.," Oct 15, 2026
- Crop Root Zone, TRZ-0208, "Retail Potash Averages $494 a Ton and the Barge at New Orleans Is $340. That $154 Gap Is $30 Narrower Than in March, Because Wholesale Rose 11% While Retail Rose 1%.," Sep 18, 2026
- Crop Root Zone, TRZ-0214, "China Reopened Phosphate Exports on September 1 Under License. India Is Paying $920 a Tonne for DAP, and Its Subsidy Covers $660.," Sep 21, 2026
- Crop Root Zone, TRZ-0242, "India's Phosphate Subsidy Rates Expire Today With No Rabi Rates Published. Kharif Alone Used 77% of the Year's ₹54,000 Crore Budget Line.," Sep 30, 2026
- Crop Root Zone, TRZ-0209, "Washington Suspended the 16.60% Moroccan Phosphate Duty on July 8. Ten Weeks Later Retail DAP Is $923/st — $13 Higher Than the Week It Was Signed.," Sep 18, 2026
- Crop Root Zone, TRZ-0111, "MAP Costs $43 More a Ton Than DAP and Is the Cheaper Phosphate — Until You Count the Nitrogen," Aug 20, 2026
Disclosures
Crop Root Zone is an independent publication. Nothing here is investment advice. Market calls, where included, reflect the editors' own read and are not a recommendation to buy or sell any security.
Retail Anhydrous Rose $39 in the Month the Tampa Contract Fell. At $977 It Sits $483 Over Wholesale, and Only Summer-Fill Cost Still Explains the Gap.
DTN's Oct 5–9 survey put anhydrous at $977 a ton, up $39 on the month and $163 on the year, while the October Tampa contract fell $10 to an implied $545 a tonne. Measured against the prior month's or the prior two months' contract, retail now sits $149 and $29 further over wholesale than a year ago. Measured against the July–August contracts that filled fall tanks, it sits $17 closer. The October price is last fall's markup on this summer's fill, and the $95 a ton of wholesale decline since then reaches the counter only when the tanks are refilled.
Retail anhydrous ammonia averaged $977 a ton in the survey week of Oct 5–9, up $39 from $938 a month earlier and up $163 from $814 in the same week of 2025 (DTN/Progressive Farmer, Oct 14, 2026). It was the largest dollar gain on DTN's board and the second-largest in percentage terms after UAN32, and it came while the wholesale benchmark went the other way. Yara and Mosaic cut the October Tampa ammonia contract by $10 a tonne (Quantum Commodity Intelligence, Sep 28, 2026), after an $80 cut to $555 for September (Quantum Commodity Intelligence, Sep 2026). On Sep 15 we set a test for the gap between the two prices: if the October and November retail surveys still showed anhydrous above $900 with Tampa at or below $555, the inventory-lag explanation would be running out (Crop Root Zone, Sep 15, 2026). The first full October survey is in. It does not settle the question, but it narrows it to one explanation and one date.
1. The October board: anhydrous up, the contract down
What's new: Six of DTN's eight retail fertilizers rose on the month in the Oct 5–9 survey. UAN32 was the only one to move by 5% or more, the threshold DTN treats as significant. Anhydrous rose 4.2%, and 10-34-0 was the only product lower (DTN/Progressive Farmer, Oct 14, 2026).
Evidence:
| Product | Oct 5–9, 2026 | Sep 7–11, 2026 | MoM | Oct 6–10, 2025 | YoY | $/lb N | Basis |
|---|---|---|---|---|---|---|---|
| Anhydrous | 977 | 938 | +4.2% | 814 | +20% | 0.60 | Delivered, retail |
| Urea | 672 | 658 | +2.1% | 601 | +12% | 0.73 | Delivered, retail |
| UAN32 | 485 | 457 | +6.1% | 466 | +4% | 0.76 | Delivered, retail |
| UAN28 | 442 | 430 | +2.8% | 419 | +5% | 0.79 | Delivered, retail |
| DAP | 934 | 923 | +1.2% | 921 | +2% | — | Delivered, retail |
| MAP | 979 | 962 | +1.8% | 922 | +6% | — | Delivered, retail |
| Potash | 502 | 494 | +1.6% | 485 | +4% | — | Delivered, retail |
| 10-34-0 | 702 | 717 | −2.1% | 666 | +5% | — | Delivered, retail |
Source: DTN/Progressive Farmer, Oct 14, 2026. $/ton national averages; year-on-year percentages and $/lb N as published by DTN.
The weekly series shows when the anhydrous move happened. It was not a slow drift. Retail jumped $32 in the Sep 21–25 survey, the week before the October contract was reported, and has held within $2 of that level for three surveys since.
| Survey week, 2026 | Anhydrous, $/ton | Week-on-week | |
|---|---|---|---|
| Sep 7–11 | 938 | — | ████░░░░░░ |
| Sep 14–18 | 945 | +7 | █████░░░░░ |
| Sep 21–25 | 977 | +32 | ████████░░ |
| Sep 28–Oct 2 | 979 | +2 | ████████░░ |
| Oct 5–9 | 977 | −2 | ████████░░ |
Sources: DTN/Progressive Farmer, Sep 23, Sep 30, Oct 7 and Oct 14, 2026 (delivered retail). Bars scale $900–$1,000 across ten blocks, so small moves look large.
USDA's Illinois distributor survey shows the same direction. Its Oct 2 report put the average Illinois anhydrous ask at $945 a ton FOB, up $37.50 in two weeks, with quotes running from $835 to $1,050 (USDA AMS, Oct 2, 2026). The Illinois urea ask rose $48 in the same report, to $770. The two surveys use different bases and panels, but neither shows retail following the September and October contract cuts.
There is one new supply headline, and it is not a new loss of supply. On Oct 5 Nutrien said it would keep its Trinidad nitrogen operations shut indefinitely, citing gas constraints and uncertainty. The plant has produced nothing since a controlled shutdown that began on Oct 23, 2025, and Nutrien said the decision does not change its 2026 nitrogen sales outlook (BNN Bloomberg, Oct 5, 2026). Its pre-shutdown output, about 85,000 tonnes of ammonia a month, has been missing from the market for a year. The October contract was set with that already in the base.
Ground Truth: A $32 jump in one week, followed by three flat weeks, looks like a price list being reset for the application season, not a reaction to wholesale cost. Retail anhydrous did not follow wholesale up in this move, because wholesale did not go up. A grower being quoted fall anhydrous this month is paying a seasonal posted price, which is something a second or third dealer quote can test in a way no national average can.
2. Retail now sits $483 over the contract
What's new: Converting each Tampa settlement to short tons and subtracting it from the same month's retail average gives a retail-over-wholesale spread. At $483, October's is the widest in any month we have checked since September 2025. Our September piece found the previous high at $439, in June 2026 (Crop Root Zone, Sep 15, 2026).
Evidence:
| Month | Retail anhydrous, $/ton | Tampa, $/t CFR | Tampa, $/short ton | Retail minus Tampa, $/short ton |
|---|---|---|---|---|
| Oct 2024 | 688 | 560 | 508 | 180 |
| Sep 2025 | 768 | 540 | 490 | 278 |
| Oct 2025 | 814 | 590 | 535 | 279 |
| Sep 2026 | 938 | 555 | 504 | 435 |
| Oct 2026 | 977 | 545* | 494 | 483 |
Sources: Retail — DTN/Progressive Farmer, Oct 15, 2024 (Oct 7–11, 2024), Oct 15, 2025 (Sep 8–12 and Oct 6–10, 2025), Oct 14, 2026 (Sep 7–11 and Oct 5–9, 2026). Tampa — Quantum Commodity Intelligence, Sep 27, 2024; Profercy, Sep 30, 2025; Quantum Commodity Intelligence, Sep 2026 and Sep 28, 2026. *Implied from the reported $10 cut from September's $555; the October level itself is behind a paywall. Short-ton conversion (÷ 1.10231) and spreads are Crop Root Zone calculations.
$483/short ton
Retail anhydrous over the October Tampa contract, against $279 in October 2025 and $180 in October 2024. (Crop Root Zone calculation from DTN/Progressive Farmer, Oct 14, 2026; Quantum Commodity Intelligence, Sep 28, 2026; Profercy, Sep 30, 2025)
The spread is not a margin. Tampa is a delivered-to-Florida contract between one supplier and one phosphate producer, and much of the anhydrous applied in the Corn Belt comes from domestic plants by pipeline, barge and rail. The spread covers inland freight, terminal storage, handling of a pressurized product, credit, and the nurse tanks and toolbars dealers supply. Some of those costs rose this year. Illinois farm diesel was $5.63 a gallon on Oct 2 (USDA AMS, Oct 2, 2026). No public source prices those costs as a whole, but none of them plausibly rose $204 a ton in a year, which is how far the same-month spread has widened.
Ground Truth: On a same-month basis, the gap between the farm price and the benchmark has widened in each of the last two Octobers, from $180 to $279 to $483. Same-month comparisons always overstate the gap when wholesale is falling, because dealers sell from tanks filled earlier. Section 3 tests how much of the $483 that accounts for.
3. The lag test, re-run: two readings failed, one fits closely
What's new: In September we tested the gap against four assumptions about what the product in a dealer's tank had cost: the same month's contract, the prior month's, the contract two months back, and a summer average. Two of the four still left the spread narrower than a year earlier (Crop Root Zone, Sep 15, 2026). The October survey changes that.
Evidence: We use the verified July and August settlements for the summer basis. Quantum reported the July 2026 contract at $665, down $110 on the month (Quantum Commodity Intelligence, Jul 8, 2026). August was $635, from September's $80 cut to $555 (Quantum Commodity Intelligence, Sep 2026). The 2025 comparisons are $417 for July, a $25 rise on June's $392 (Quantum Commodity Intelligence, Jun 2025 and Jul 2025), and $487 for August (Quantum Commodity Intelligence, Jul 25, 2025). That July 2026 figure is $5 below the $670 we used in September, and June is now in doubt, so this version drops June from the summer basis.
| Wholesale cost assumed in the tank | Sep 2025 | Sep 2026 | Change, Sep | Oct 2025 | Oct 2026 | Change, Oct |
|---|---|---|---|---|---|---|
| Same month's contract | 278 | 435 | +156 | 279 | 483 | +204 |
| Prior month's contract | 326 | 362 | +36 | 324 | 474 | +149 |
| Contract two months earlier | 390 | 335 | −55 | 372 | 401 | +29 |
| July–August contract average | 358 | 348 | −10 | 404 | 387 | −17 |
All values are retail anhydrous minus the assumed wholesale cost, $/short ton. Crop Root Zone calculations. Retail: DTN/Progressive Farmer, Oct 15, 2025 and Oct 14, 2026 (second-week September and October surveys). Tampa: sources as cited above, converted at 1.10231 short tons per tonne. Which lag fits any one dealer is not published; the table shows the range.
Two of the explanations that held in September no longer do. If dealers price off last month's replacement cost, the gap is $149 wider than a year ago. With a two-month lag, the $55 narrowing we found in September has turned into a $29 widening, because retail rose $39 while the contract it is being compared with fell. Only the summer basis still leaves the gap narrower than last year's.
That basis is the most realistic one for fall anhydrous. Dealers fill tanks for fall application in summer fill programs. North America's largest nitrogen producer told investors in August that low channel inventories drove "strong participation" in its UAN and ammonia fill programs in July, and that it expected a strong fall ammonia season (CF Industries, Aug 6, 2026). On a July–August basis, fill cost rose about $180 a short ton on the year, from $410 to $590. Retail rose $163. The October 2026 price is almost exactly what last October's markup over summer fill would produce. Applied to this summer's fill, last year's $404 gives $994. The survey says $977.
Ground Truth: The October survey separates the possibilities. Dealers are not passing September's and October's contract cuts through, and the only cost that fits the $977 is the July–August fill, marked up by about what it was a year ago. That is ordinary inventory pricing, not a new margin. It also means the $95 a short ton that the October contract sits below the July–August average has not reached the farm yet. It reaches the counter when dealers refill, which in our reading means mostly after fall application ends. If the November and December surveys are still near $977 after refills at around $494 a short ton, the summer-fill explanation fails too.
4. The fall step-up was seasonal, not a wholesale pass-through
What's new: Retail anhydrous rose $39 from the second September survey week to the second October week this year, while the Tampa contract fell $9 a short ton between the September and October settlements. Over the same four weeks of 2025 retail rose $46 while Tampa rose $45. In 2024 retail rose $4 while Tampa rose $27.
Evidence:
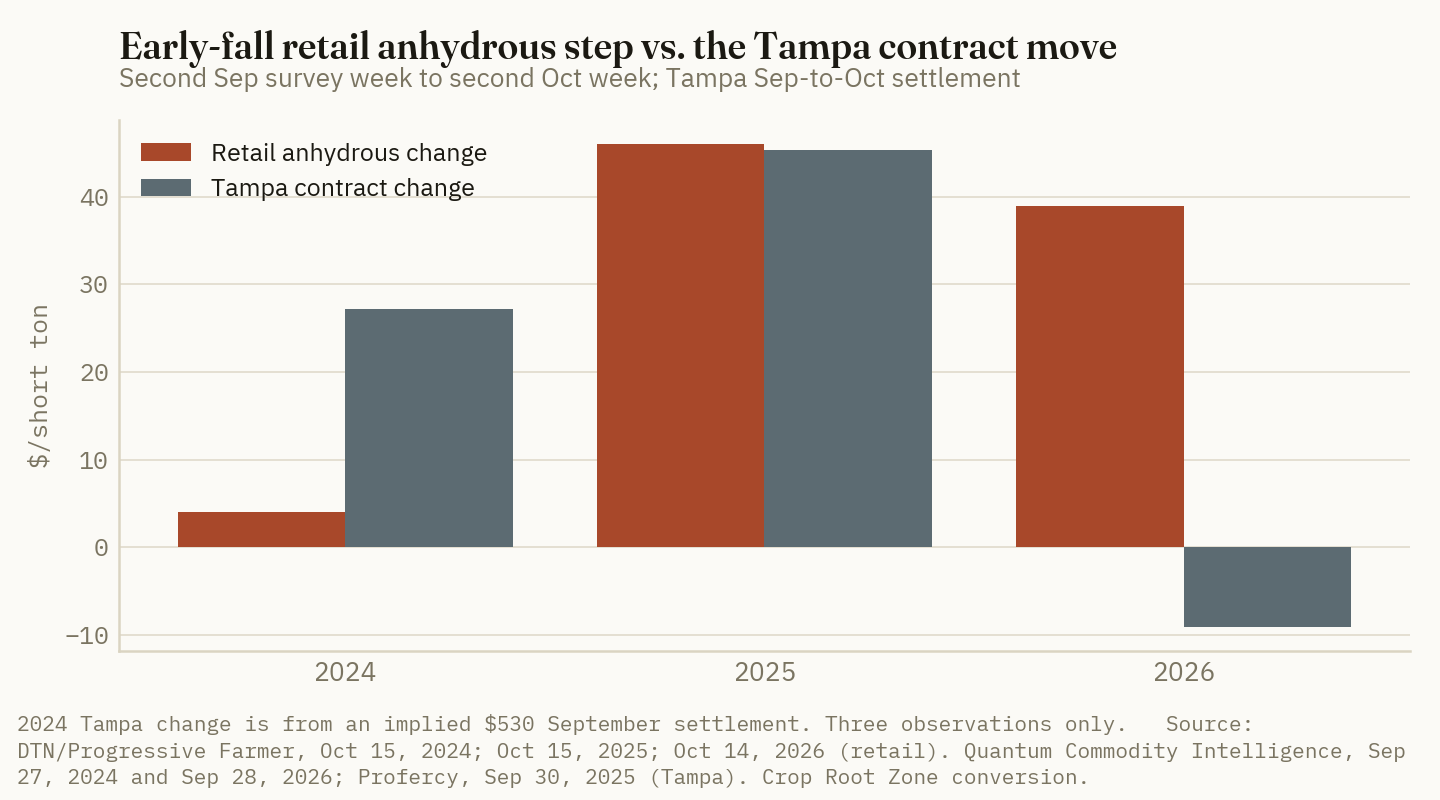
The record is three years, and it does not support a steady link between the September-to-October Tampa move and the retail move over the same weeks. In 2025 the two were almost identical. In 2024 retail lagged a rising contract and caught up later; our September 29 piece found it had risen $33 by late November (Crop Root Zone, Sep 29, 2026). In 2026 retail rose against a falling contract. That piece concluded that the fall premium in 2024 and 2025 "came from wholesale, not from a fixed seasonal markup." The 2026 data cuts against that conclusion. Measured against summer fill, the spread widened by $46 from September to October in 2025 and by $39 in 2026. That is an application-season step of roughly $40, and it appeared this year with no wholesale rise behind it.
| Sep → Oct, second survey weeks | Retail anhydrous change, $/ton | Tampa change, $/short ton | Retail move minus Tampa move |
|---|---|---|---|
| 2024 | +4 | +27* | −23 |
| 2025 | +46 | +45 | +1 |
| 2026 | +39 | −9* | +48 |
Sources: DTN/Progressive Farmer, Oct 15, 2024, Oct 15, 2025 and Oct 14, 2026; Quantum Commodity Intelligence, Sep 27, 2024 and Sep 28, 2026; Profercy, Sep 30, 2025. *The September 2024 level ($530) and the October 2026 level ($545) are implied from reported monthly changes. Crop Root Zone calculations.
Ground Truth: We said on Sep 29 that waiting from September to November would cost a grower little this year, because wholesale was not rising. The wholesale part held: the contract fell. The conclusion did not. Retail added about $40 anyway, or $3.57 an acre at 150 pounds of N. Our scenarios priced the fall move off Tampa alone, and that was the error. A seasonal step of about $40 a ton has now shown up in two of three falls regardless of wholesale. A grower who books in early September avoids the step, not the contract.
5. What the refill is worth, and what the rest of the board says
What's new: If dealers keep last October's markup over fill cost and refill at the October contract, the replacement price is about $898 a ton, $79 below the current survey. The other nitrogen products show anhydrous's per-pound advantage narrowing. Urea retail is now moving toward its barge, and UAN32 has left the narrow band it held since mid-July.
Evidence: The scenarios below apply October's $404 markup over summer fill to a range of November contract outcomes. They are estimates, not forecasts. The markup could change, and refills will not all happen in one month.
| November Tampa scenario | Tampa, $/short ton | Implied refilled retail, $/ton | $/lb N | Change vs $977 at 150 lb N/acre |
|---|---|---|---|---|
| $525: another $20 cut | 476 | 880* | 0.537* | −$8.85* |
| $545: October rolls over | 494 | 898* | 0.548* | −$7.19* |
| $585: a 2024-sized rise | 531 | 935* | 0.570* | −$3.87* |
| $665: a 2025-sized rise | 603 | 1,007* | 0.614* | +$2.77* |
*Crop Root Zone estimates: Tampa scenario ÷ 1.10231, plus the $404/short ton October 2025 markup over the July–August 2025 contract average from Section 3. $/lb N uses 1,640 lb N per ton of 82% anhydrous. 150 lb N/acre is illustrative. Excludes application, inhibitor and dealer-to-dealer differences.
Most of the range sits below today's price. Only a repeat of last fall's $110 rise in the contract, which took a large plant closing without warning, would put the refilled price above $977. The catch is timing. Fall anhydrous has to be applied in the fall, and the refill price reaches mostly spring and next summer's tons. For a grower choosing between fall anhydrous now and spring nitrogen, that $7 to $9 an acre is part of the comparison. It is not a reason to wait for a fall price cut that the inventory cycle will not deliver before freeze-up.
The per-pound comparison across forms has also moved. Anhydrous has risen 20% on the year, faster than any other nitrogen product, so its discount has narrowed.
| Anhydrous's discount per lb N vs. | Oct 2025, $/lb N | Oct 2026, $/lb N | At 180 lb N/acre, 2026 | |
|---|---|---|---|---|
| UAN28 | 0.252 | 0.194 | $34.84 | ████████░░ |
| UAN32 | 0.232 | 0.162 | $29.17 | ██████░░░░ |
| Urea | 0.157 | 0.135 | $24.25 | █████░░░░░ |
Crop Root Zone calculation from DTN/Progressive Farmer, Oct 15, 2025 and Oct 14, 2026 ($/ton ÷ lb N per ton: anhydrous 1,640, urea 920, UAN32 640, UAN28 560). Bars show the 2026 discount, scaled so $0.252 equals ten blocks. Product cost only; excludes application, which typically costs more for anhydrous.
Urea is going the other way. Retail fell $11 in a week, from $683 to $672 (DTN/Progressive Farmer, Oct 7 and Oct 14, 2026). The October Gulf urea futures contract last settled at $433.50 a short ton, and the November contract traded at $445 on Oct 14 (Farmbucks, Oct 14, 2026). That puts retail $238.50 over the prompt Gulf price, against the $258 gap we measured on Oct 8 (Crop Root Zone, Oct 8, 2026). Urea's retail-over-barge gap is closing from the retail side. Anhydrous's gap over its contract is still widening.
UAN32 is the third case. It rose $28 on the month to $485, the board's only significant move, after printing between $455 and $465 in every survey from mid-July to mid-September (Crop Root Zone, Sep 21, 2026). There is no free public UAN barge price to compare it with. The nearest public reference is the July fill book that CF Industries said averaged "probably close to $300" and extends into November (CF Industries, Aug 6, 2026). If that book is ending, UAN32 may be being repriced off a newer and higher wholesale level rather than a seasonal posted price. The public data cannot yet tell those apart. Illinois carried a single UAN32 ask, at $530 (USDA AMS, Oct 2, 2026).
Ground Truth: Fall anhydrous is still the cheapest nitrogen on the board, but it is now 16 cents a pound under UAN32 rather than 23. At 180 pounds that is about $29 an acre, down from about $42. Inhibitors, a hired application pass and any fall nitrogen loss come out of a smaller cushion than a year ago. On ground where fall anhydrous was a close call last year, it is a closer call now. For that ground, the better-value fall decision may be how many acres to apply this fall, not what price to accept. Shifting the marginal acres to spring puts them on a price that has room to fall, if the refill arithmetic holds, instead of one built on summer fill.
What to watch, in order:
- The November Tampa settlement, normally reported in the last days of October. A rollover at $545 keeps the refill price near the $898 row.
- DTN's late-October surveys. A second $30-plus seasonal step would point to margin, not inventory. A flat print near $977 is consistent with the summer-fill reading.
- USDA's next Illinois report. The Oct 2 report had a $215 range in Illinois anhydrous asks. A narrower range with a lower top would be the first sign of refilled tanks being priced in.
- December and January retail prints. If refills at about $494 a short ton do not pull the survey below $950 by then, the lag explanation will have run out on every basis we can test.
References
- DTN/Progressive Farmer, Russ Quinn, "UAN32 Leads Fertilizer Prices Higher Again in First Week of October," Oct 14, 2026 (survey week Oct 5–9, 2026; month-ago Sep 7–11, 2026; year-ago Oct 6–10, 2025) — https://www.dtnpf.com/agriculture/web/ag/crops/article/2026/10/14/uan32-leads-fertilizer-prices-higher
- DTN/Progressive Farmer, Russ Quinn, "UAN32 Leads Fertilizer Prices Higher," Oct 7, 2026 (survey week Sep 28–Oct 2, 2026) — https://www.dtnpf.com/agriculture/web/ag/crops/article/2026/10/07/uan32-leads-fertilizer-prices-higher
- DTN/Progressive Farmer, Russ Quinn, "Anhydrous Leads Fertilizer Prices Higher, Up 25% From a Year Ago," Sep 30, 2026 (survey week Sep 21–25, 2026) — https://www.dtnpf.com/agriculture/web/ag/crops/article/2026/09/30/anhydrous-leads-fertilizer-prices-25
- DTN/Progressive Farmer, Russ Quinn, "Fertilizer Prices Rise for Six of Eight Major Fertilizers," Sep 23, 2026 (survey week Sep 14–18, 2026) — https://www.dtnpf.com/agriculture/web/ag/crops/article/2026/09/23/fertilizer-prices-rise-six-eight
- DTN/Progressive Farmer, Russ Quinn, retail fertilizer survey, Oct 15, 2025 (survey week Oct 6–10, 2025; month-ago Sep 8–12, 2025) — https://www.dtnpf.com/agriculture/web/ag/crops/article/2025/10/15/urea-retail-price-5-anhydrous-dap
- DTN/Progressive Farmer, Russ Quinn, retail fertilizer survey, Oct 15, 2024 (survey week Oct 7–11, 2024; month-ago Sep 9–13, 2024) — https://www.dtnpf.com/agriculture/web/ag/crops/article/2024/10/15/retail-fertilizer-prices-continue
- Quantum Commodity Intelligence, "Tampa ammonia falls $10/mt for October," Sep 28, 2026 (headline and summary; full text paywalled) — https://www.qcintel.com/ammonia/article/tampa-ammonia-falls-10-mt-for-october-74032.html
- Quantum Commodity Intelligence, "Tampa ammonia price falls $80/mt for September," Sep 2026 (September 2026 at $555/mt CFR; summary only) — https://www.qcintel.com/ammonia/article/tampa-ammonia-price-falls-80-mt-for-september-71724.html
- Quantum Commodity Intelligence, "Tampa ammonia drops $110/mt, Trammo sells to NW Europe at $680/mt CFR," Jul 8, 2026 (July 2026 at $665/mt CFR) — https://www.qcintel.com/ammonia/article/tampa-ammonia-drops-110-mt-trammo-sells-to-nw-europe-at-680-mt-cfr-68466.html
- Profercy, "International ammonia prices maintain upward march on capacity constraints," Sep 30, 2025 (September 2025 $540/t, October 2025 $590/t CFR Tampa) — https://www.profercy.com/insights/international-ammonia-prices-maintain-upward-march-on-capacity-constraints
- Quantum Commodity Intelligence, "Tampa ammonia contract spikes by $70/mt for August," Jul 25, 2025 (August 2025 at $487/mt CFR) — https://www.qcintel.com/ammonia/article/tampa-ammonia-contract-spikes-by-70-mt-for-august-45526.html
- Quantum Commodity Intelligence, "Yara and Mosaic's Tampa ammonia settlement jumps $25/mt for July," Jul 2025 — https://www.qcintel.com/ammonia/article/yara-and-mosaic-s-tampa-ammonia-settlement-jumps-25-mt-for-july-43550.html
- Quantum Commodity Intelligence, "Yara agrees June Tampa ammonia contract with Mosaic at $392/mt CFR," Jun 2025 — https://www.qcintel.com/ammonia/article/yara-agrees-june-tampa-ammonia-contract-with-mosaic-at-392-mt-cfr-42344.html
- Quantum Commodity Intelligence, "Tampa ammonia price up $30/mt for October," Sep 27, 2024 (October 2024 at $560/mt CFR) — https://www.qcintel.com/ammonia/article/tampa-ammonia-price-up-30-mt-for-october-29903.html
- USDA AMS, Illinois Production Cost Report (Bi-weekly), Oct 2, 2026 — https://www.ams.usda.gov/mnreports/ams_3195.pdf
- Farmbucks, Urea (US Gulf) futures, CBOT, quotes as of Oct 14, 2026 — https://farmbucks.com/futures/fertilizer/urea-us-gulf
- CF Industries, Q2 2026 earnings conference call, Aug 6, 2026 (transcript via The Motley Fool) — https://www.fool.com/earnings/call-transcripts/2026/08/12/cf-industries-cf-q2-2026-earnings-call-transcript/
- BNN Bloomberg, "Nutrien to indefinitely shut Trinidad nitrogen operations amid gas supply constraints," Oct 5, 2026 — https://www.bnnbloomberg.ca/business/company-news/2026/10/05/nutrien-to-indefinitely-shut-trinidad-nitrogen-operations-amid-gas-supply-constraints
- Crop Root Zone, TRZ-0197, "Retail Anhydrous Sits $435 a Ton Over the Tampa Ammonia Contract. Last Fall the Gap Held Near $275.," Sep 15, 2026
- Crop Root Zone, TRZ-0238, "The Tampa Ammonia Contract Fell $10 for October. In the Last Two Falls It Rose $30 and $50, and Retail Anhydrous Followed It Up.," Sep 29, 2026
- Crop Root Zone, TRZ-0262, "India's Lowest Urea Offers Came In at $352.10 East and $356.25 West, Nearly 10% Under August…," Oct 8, 2026
- Crop Root Zone, TRZ-0213, "UAN32 and Urea Cost $0.714 and $0.715 a Pound of Nitrogen. UAN32 Has Not Left a $10 Band in Nine Surveys, While World Urea Rose 12% in a Month.," Sep 21, 2026
Disclosures
Crop Root Zone is an independent publication. Nothing here is investment advice. Market calls, where included, reflect the editors' own read and are not a recommendation to buy or sell any security.
US Urea Imports More Than Doubled in July. Ammonia Imports Hit Their Lowest July Since at Least 2019, and UAN Fell a Third. The Fall Gap Is in the Products That Go On This Fall.
The public product-level trade record runs to July. It shows an estimated 294,000 tonnes of urea, 59% of it Algerian, against 115,000 tonnes of anhydrous ammonia, with Trinidad down from 73,000 tonnes to 9,800, and 150,000 tonnes of UAN, with Russian cargoes down 70%. Total nitrogen imported January to July matched the 2019-2024 average to within 0.1%; it arrived in the first quarter and stopped in May and June. August's only public line, the value of all fertilizer imports, fell 15%. Retail anhydrous is up 20% on the year and urea 12%, while the NOLA urea barge sits $255 under retail.
The Census Bureau published August trade on October 6, and the product detail a fertilizer buyer needs is not in the public release. The release carries one line for all manufactured fertilizers: $576 million of imports in August, down from $679 million in August 2025 (US Census Bureau and BEA, Oct 6, 2026; Nov 19, 2025) [2][3]. Tonnes by product sit behind the Census Bureau's registered database and its keyed API [4]. The public copy of the same Census records, held by the UN's Comtrade database, runs one month further back, to July [1]. July's record splits the nitrogen market in two. Urea arrived at more than twice last July's pace. Anhydrous ammonia arrived at its lowest July since at least 2019, and UAN fell by a third. Across the four products, January-to-July nitrogen imports were within 0.1% of the 2019-2024 average. The difference this year is when it came and in what form. This piece sets out what the public record shows, where it stops, and what it means for the price of fall and spring nitrogen in the Corn Belt.
1. Where the public import record stops
What's new: The latest month of public, product-level US import data is July 2026. August exists inside the Census Bureau but reached the public only as a dollar total.
Evidence: We checked each route a reader without a subscription can take on October 14.
| Source | Latest month | Tonnes by product? | Access |
|---|---|---|---|
| Census/BEA FT-900 release, Oct 6, 2026 | August 2026 | No. One value line for "Fertilizers" | Public PDF [2] |
| Census International Trade API | August 2026 (release date) | Yes | Returned a missing-key error to us; requires a registered key [4] |
| Census USA Trade Online, USITC DataWeb | — | Yes | Account required; not used |
| UN Comtrade, US-reported monthly records | July 2026 | Yes, with origin | Public preview queries [1] |
| Argus, Quantum Commodity Intelligence | June 2026 in public summaries | Partly | Full text paywalled [5][6] |
Source: Crop Root Zone checks of each source, Oct 14, 2026. The next Census release, covering September, is scheduled for November 4, 2026 [2].
Two cautions on the Comtrade copy. First, its July 2026 urea quantity carries an estimation flag: the dollar value, $132.1 million, is reported, and the tonnage, 294,130 tonnes, was derived from it at $449 a tonne [1]. At June's reported unit value of $526 a tonne the same dollars buy 251,000 tonnes. We use the Comtrade figure and show the lower one where it matters. Second, every 2022 quantity for these four products carries the same flag, so we leave 2022 out of all averages. The averages below are 2019, 2020, 2021, 2023 and 2024.
We cross-checked the record against the trade press where both are public. Argus put seaborne urea imports at a record 1.26 million tonnes in March 2026 and 4.75 million for the July 2025-June 2026 fertilizer year (Argus Media, Jun 26, 2026) [5]. Comtrade's all-routes figures are 1.30 million and 5.28 million. Canada, which ships overland, accounts for 0.49 million of the 0.53 million gap in the fertilizer year [1]. Quantum reported a 67% month-on-month fall in June (Quantum Commodity Intelligence, Aug 4, 2026) [6]; Comtrade's all-routes fall is 62%.
2. July: urea up, the fall products down
What's new: July 2026 brought an estimated 294,000 tonnes of urea, against 118,000 a year earlier. Anhydrous ammonia fell 28% to 115,000 tonnes, UAN 33% to 150,000 and ammonium sulfate 37% to 48,000.
Evidence:
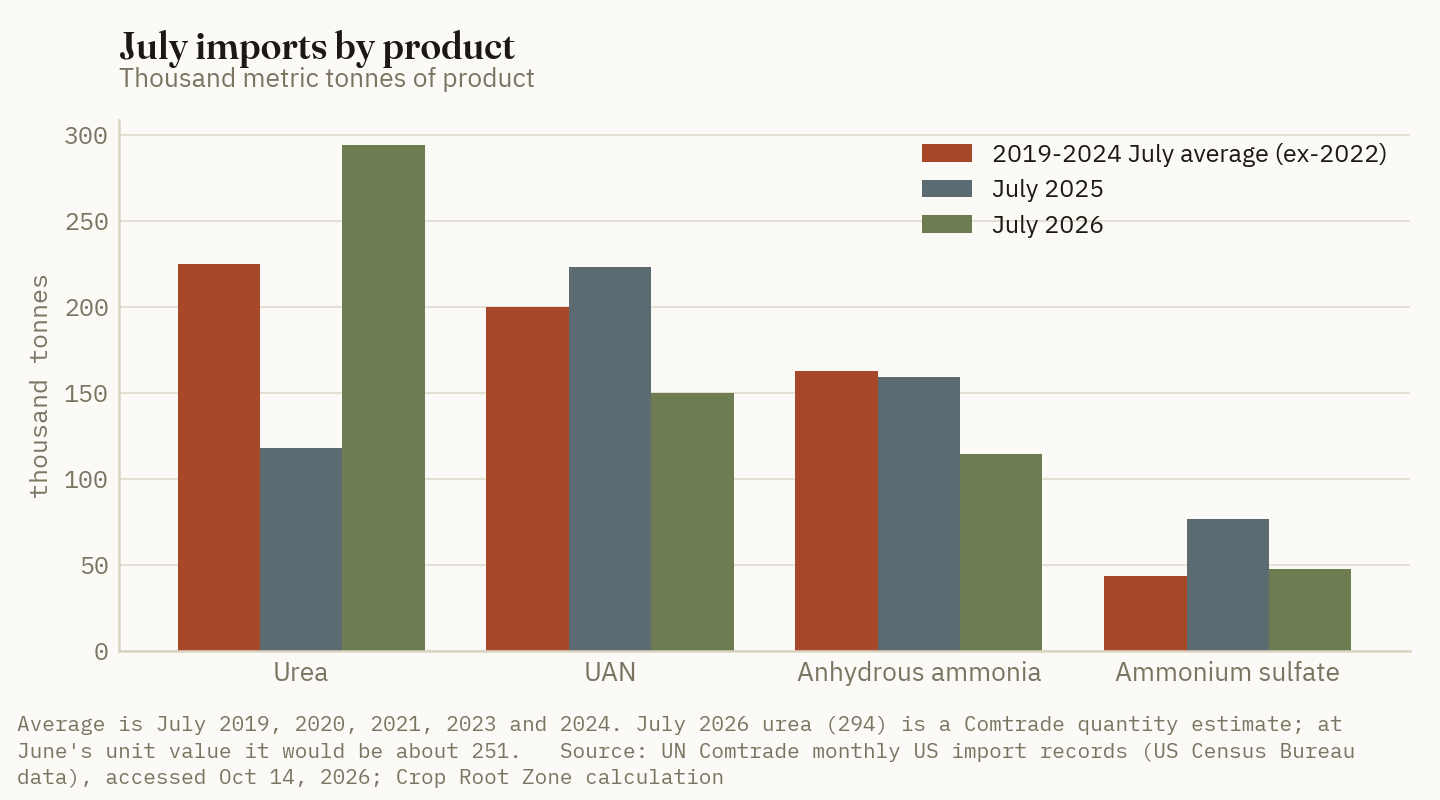
| Product | July 2026, t | July 2025, t | Change | July avg. 2019-24*, t | 2026 vs avg. | Unit value Jul 2026, $/t | Unit value Jul 2025, $/t |
|---|---|---|---|---|---|---|---|
| Urea | 294,130† | 118,088 | +149% | 225,000 | +31% | 449† | 436 |
| UAN | 150,256 | 223,274 | −33% | 199,900 | −25% | 292 | 321 |
| Anhydrous ammonia | 114,867 | 159,346 | −28% | 162,700 | −29% | 805 | 571 |
| Ammonium sulfate | 48,129 | 76,702 | −37% | 43,600 | +10% | 266 | 328 |
| Nitrogen content, all four | 284,700 | 268,100 | +6% | 306,100 | −7% |
Basis: metric tonnes of product, all routes, customs value per tonne. Source: UN Comtrade, US-reported monthly imports, HS 310210, 310280, 281410 and 310221, accessed Oct 14, 2026 [1]; changes, averages and nitrogen content are Crop Root Zone calculations. *Average of July 2019, 2020, 2021, 2023 and 2024. †Comtrade estimate from reported value; at June 2026's unit value the July urea figure would be about 251,000 t, still up 113% on the year. Nitrogen content assumes urea 46%, UAN 30% (the midpoint of 28% and 32% solutions; the record does not split them), ammonia 82%, ammonium sulfate 21%.
The ammonia line is the one that stands out. At 114,867 tonnes it is the lowest July in the seven years we can check, below 2020's 132,180. June and July together brought 240,000 tonnes, against 282,000 to 436,000 in the same two months of every other year in the series. The unit value of $805 a tonne is the highest July figure in the series, 41% above last July. Most of July's ammonia came overland from Canada and is valued at inland prices, so that unit value is not a Gulf price and should not be compared with the Tampa contract.
The urea line is the reverse. Even at the lower 251,000-tonne reading, July urea was the second-highest July in the series, behind only 2021. Imports filled what is usually one of the two quietest months of the year for urea.
9,801 tonnes
Anhydrous ammonia imported from Trinidad and Tobago in July 2026, against 73,285 tonnes in July 2025. Trinidad supplied 47% of US ammonia imports from 2021 to 2024. (UN Comtrade, accessed Oct 14, 2026; USGS, Feb 2026)
3. The year front-loaded, then stopped
What's new: January to July 2026 nitrogen imports totalled about 3.44 million tonnes of nitrogen, the same as the 2019-2024 average for those months. The first quarter ran 32% above average. May to July ran 31% below.
Evidence:
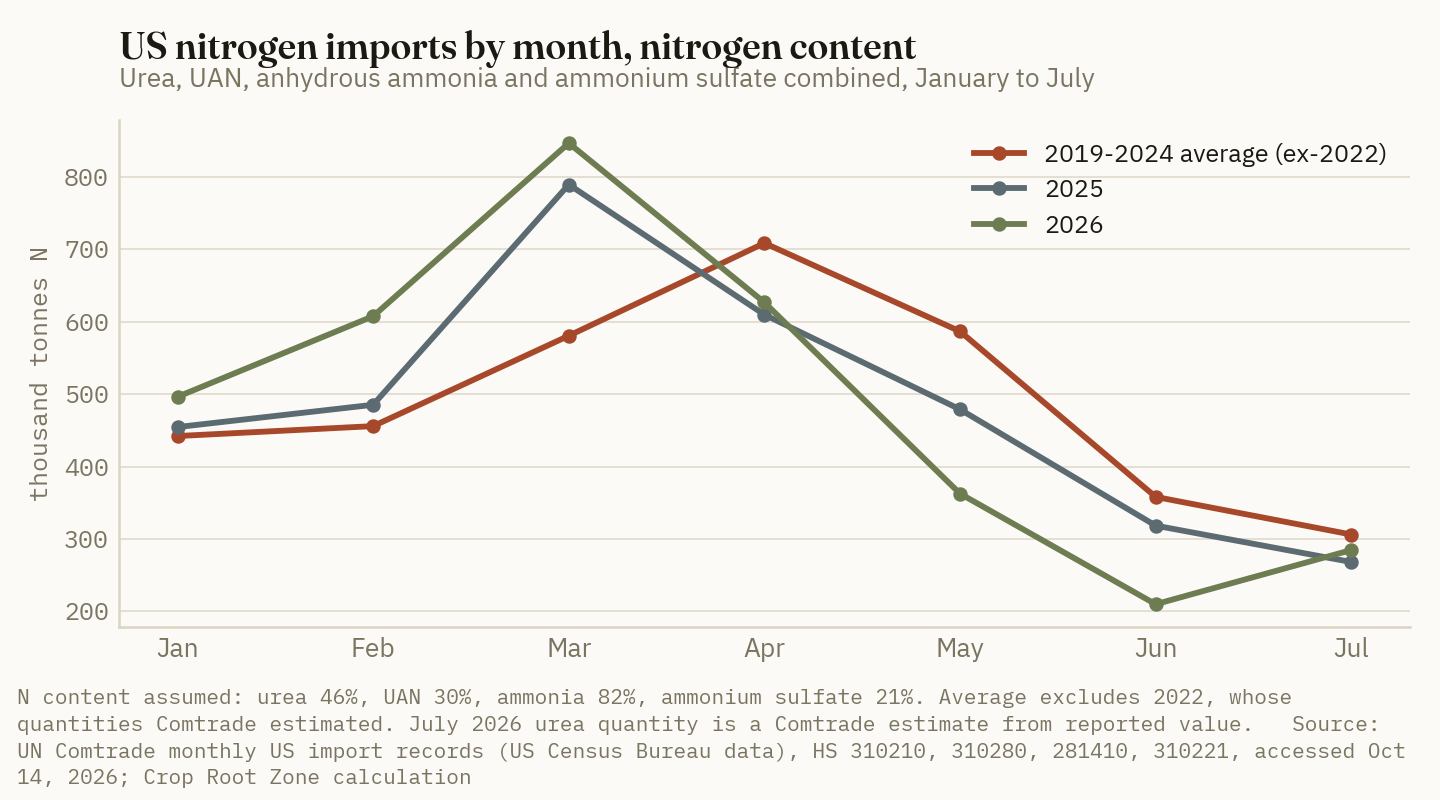
| Period | 2026, thousand t N | 2025, thousand t N | 2019-24 avg.*, thousand t N | 2026 vs avg. | |
|---|---|---|---|---|---|
| January–March | 1,951 | 1,730 | 1,479 | +32% | ██████████ |
| April | 627 | 610 | 709 | −12% | ███░░░░░░░ |
| May–July | 857 | 1,066 | 1,251 | −31% | ████░░░░░░ |
| January–July | 3,435 | 3,405 | 3,439 | −0.1% |
Basis: thousand metric tonnes of nitrogen content, four products. Source: Crop Root Zone calculation from UN Comtrade, accessed Oct 14, 2026 [1]. *Excludes 2022. Bars scale the 2026 column for the three sub-periods, with January–March at ten blocks.
The shape fits what the market went through. Argus ties this year's urea flows to the closure of the Strait of Hormuz, which it says cut off 35% of world urea trade [5], and buyers who could pull tonnes forward did. Comtrade shows 2.57 million tonnes of urea in January to March, 67% above the average for those months [1]. Then imports stopped. June brought 122,000 tonnes of urea and 210,000 tonnes of total nitrogen, the lowest June in the series, 41% under the average.
The product mix of the whole seven months matters more than the total. Urea is 17% above its January-to-July average. Ammonia is 20% below it at 1.16 million tonnes, and UAN is 15% below at 1.40 million. Ammonia's shortfall is not new: January to July 2025 was almost identical, at 1.15 million. Two new Texas ammonia plants with about 2.4 million tonnes of combined capacity have been ramping up [13], and the US relies on imports for a small share of its ammonia: net import reliance was about 5% of apparent consumption in 2025 (USGS, Feb 2026) [11]. On an annual basis the totals have barely moved; The Fertilizer Institute put US nitrogen imports at 5.8 million short tons in both 2024 and 2025 (DTN, Feb 26, 2026) [12]. Some of the drop is domestic tonnes displacing imported ones. Some of it is Trinidad.
4. Who stopped shipping, and who replaced them
What's new: Algeria supplied 59% of July's urea. Trinidad's ammonia nearly vanished. Russia's UAN fell 70%.
Evidence:
| Product, origin | July 2026, t | July 2025, t | Change |
|---|---|---|---|
| Urea, Algeria | 174,194† | 2,698 | — |
| Urea, Canada | 62,157† | 24,724 | +151% |
| Urea, Russia | 27,396† | 23,489 | +17% |
| Urea, Qatar | 0 | 38,243 | −100% |
| Urea, Oman | 11,008† | 0 | — |
| Ammonia, Canada | 104,761 | 85,624 | +22% |
| Ammonia, Trinidad and Tobago | 9,801 | 73,285 | −87% |
| UAN, Trinidad and Tobago | 75,949 | 66,422 | +14% |
| UAN, Russia | 38,500 | 128,362 | −70% |
| UAN, Canada | 35,801 | 24,070 | +49% |
Basis: metric tonnes of product. Source: UN Comtrade, US-reported imports by partner, accessed Oct 14, 2026 [1]. †Estimated quantity; Comtrade derived each July 2026 urea origin from its reported value at one unit price. A zero means no record for that origin in that month.
Trinidad's collapse is recent, and it is not simply the Nutrien shutdown. Nutrien's Point Lisas site stopped in October 2025 [11], yet Trinidad kept shipping ammonia to the US at an average of about 68,000 tonnes a month from August to December 2025, and 70,400 tonnes as late as May 2026 [1]. Other plants on the island carried the trade. Then it fell to 17,709 tonnes in June and 9,801 in July. June and July together brought 27,510 tonnes, against 79,511 in 2024 and 111,293 in 2025. Trinidad supplied 37% of US ammonia imports in the fertilizer year to June 2026 by our count, so a two-month stop is a large hole. Canada partly filled it, with 105,000 tonnes in July. We found no public report explaining the June and July drop, and ammonia moves in cargoes of 20,000 to 40,000 tonnes, so two light months can be two missed vessels. Our September 29 piece listed any new curtailment at the remaining Trinidad plants as the risk to watch [13]. The customs record is the first sign it may have come.
The urea origins show the Middle East disruption in the customs record. Qatar, the largest Gulf supplier, shipped 325,000 tonnes in February 2026 and has shipped nothing since April [1]. Algeria, a Mediterranean producer whose cargoes do not pass the Strait of Hormuz, is a regular spring supplier, but July's 174,000 tonnes was its largest month since at least January 2024, the start of the origin record we pulled. Algeria normally sends almost nothing in summer: 3,327 tonnes in July 2024 and 2,698 in July 2025 [1]. Russian urea held its ground at 27,000 tonnes in July, after 480,000 in April. Argus put Russia's share of fertilizer-year urea imports at 42%, up from 36% [5].
UAN is the one we cannot fully explain. Trinidad's UAN rose 14% in July while Russian UAN fell by 90,000 tonnes. We found no public explanation of the drop. Russian UAN has dipped in late summer before: it fell to 32,034 tonnes in August 2025 and 35,957 in September, then came back at 74,121 in October and 173,158 in November [1]. July 2026's 38,500 looks like that lull arriving a month early, not yet like a lost supplier. Russia shipped 699,000 tonnes of UAN to the US from January to July 2026, against 803,000 in the same months of 2025, a 13% shortfall that predates July.
5. What it means for a Corn Belt buyer's price
What's new: Retail anhydrous is $979 a ton, 20% above a year ago, and urea $683, 12% above. The NOLA urea barge traded at $422 to $435 a short ton in the week to October 2, and inland Corn Belt terminals at $495 to $515.
Evidence:
| Product | Retail, $/ton | vs. year ago | $/lb N | Wholesale reference | Retail over reference, $/ton |
|---|---|---|---|---|---|
| Anhydrous | 979 | +20% | 0.60 | Tampa October contract, $545/t CFR = $494/st | 485* |
| Urea | 683 | +12% | 0.74 | NOLA barge $422–435/st FOB, midpoint $428.50 | 254.50* |
| Urea | 683 | +12% | 0.74 | Corn Belt terminal $495–515/st FOB, midpoint $505 | 178* |
| UAN32 | 483 | +4% | 0.75 | No public NOLA print found | — |
| UAN28 | 430 | +3% | 0.77 | No public NOLA print found | — |
Basis: retail delivered to farm, national average, $/short ton, survey week Sep 28–Oct 2, 2026; wholesale FOB or CFR as stated. Source: DTN/Progressive Farmer, Oct 7, 2026 [8]; Advanced Turf Solutions market summary relaying NOLA and terminal prices for the week to Oct 2, 2026, published Oct 12 [9]; Tampa contract as reported in our Sep 29 piece [13]. *Crop Root Zone calculation; 1.10231 short tons per tonne.
Urea. The import record says spring urea is not short. The tonnes kept coming through July, the barge is 14% above a year ago at $428.50 against $372 to $380 [9], and the Gulf futures curve rises only $31.50 from October's $433.50 to March's $465 (Farmbucks, Oct 13, 2026) [10]. Retail is the outlier. On the same survey week the retail average sits $254.50 over the barge midpoint. That is the spread our October 8 piece put at $258 against the futures; on this week's matched barge print it is a little narrower but has not closed [14]. The ATS summary expects the barge to stay between $425 and $455 through November [9]. That is a relayed forecast, not ours.
Anhydrous. Here the import record and the price agree. June-July ammonia imports were the lowest in the seven years we can check, and Trinidad, which supplied nearly half of them from 2021 to 2024 [11], fell to 9,801 tonnes in July. Nutrien's Point Lisas site, which made about 85,000 tonnes of ammonia a month, shut in October 2025 [11] and Nutrien has since made the shutdown indefinite [9]; shipments from the island's other plants fell away in June and July [1]. CF Industries' Yazoo City complex, up to 1.3 million tons of nitrogen products a year, has been idle since November 2025 and its restart has moved to the first half of 2027, and CF expects North American nitrogen inventories to enter 2027 below average (Fertilizer Daily, Oct 5, 2026) [7]. Retail anhydrous sits $485 over the October Tampa contract. Our September 15 piece measured that gap at $435 [15]; the October contract fell $10 and retail rose, and that figure is now superseded.
UAN. July's UAN imports were 25% under the July average and the year to date is 15% under. CF told investors in its second-quarter call that it had built "a substantial UAN order book that extends into November" [7]. Retail UAN32 rose 6.2% in a month, the largest move in DTN's October 7 survey [8]. UAN is the product where thin imports and a firm domestic book point the same way.
August. The only public August number is the value of all fertilizer imports, $576 million, down 15% from August 2025 [2][3]. It includes potash and phosphate, and July shows why it cannot be read as a nitrogen signal: in July the all-fertilizer line fell 11% on the year, from $570 million (as first published) to $510 million, while the four nitrogen products rose 18%, from $239 million to $281 million [1][2][3]. August's nitrogen tonnes will be public when Comtrade posts the month, or to registered users of the Census database now.
Ground Truth: The import record does not show a nitrogen shortage. It shows the right amount of nitrogen arriving in the wrong form and at the wrong time for this fall. Urea, the product applied mostly in spring, came early and kept coming. Ammonia and UAN, the products a Corn Belt grower applies this fall and fills over winter, are the ones running short of their import history in June and July, and one of the largest domestic nitrogen complexes is down until next year. That cuts the advice two ways. A spring urea price built on scarcity is not supported by the customs record; the $254 between the barge and the retail average is a margin and inventory-cost question, and a buyer can press it. Fall anhydrous is the opposite case: the tonnes behind the retailer's tank lean harder than usual on US and Canadian plants, with the Caribbean nearly gone from the July record, and the risk for an unbooked acre in November is availability more than price. A grower who has not booked fall anhydrous should confirm tons, not chase cents. A grower pricing spring urea can afford to wait for the September and October import numbers.
What would change that read:
- August and September tonnage. If August shows ammonia and UAN back to their usual 160,000 to 200,000 tonnes a month, the gap was a two-month lull. Census publishes September on November 4 [2].
- The November Tampa settlement. A higher contract with thin imports would confirm the ammonia tightness at wholesale, not only at retail [13].
- Russian UAN. Last year it recovered to 74,000 tonnes in October and 173,000 in November. If this autumn's months stay near July's 38,500, the drop is a trend and not the usual late-summer lull.
- Urea origin. If Algerian and Russian urea keep arriving at July's rate, the spring urea case gets weaker still. If Middle East supply stays out and Algeria slows, the early pull-forward will have been the only cushion.
References
- UN Comtrade database, US-reported monthly imports for HS 310210 (urea), 310280 (urea-ammonium nitrate solutions), 281410 (anhydrous ammonia) and 310221 (ammonium sulfate), world and by partner, January 2019 to July 2026 (August 2026 not yet posted), public preview queries, accessed Oct 14, 2026 — https://comtradeplus.un.org/ (API: https://comtradeapi.un.org/public/v1/preview/C/M/HS)
- US Census Bureau and US Bureau of Economic Analysis, "U.S. International Trade in Goods and Services, August 2026" (FT-900), release CB 26-160, Oct 6, 2026, Exhibit 15 — https://www.census.gov/foreign-trade/Press-Release/ft900/ft900_2608.pdf
- US Census Bureau and US Bureau of Economic Analysis, "U.S. International Trade in Goods and Services, August 2025" (FT-900), release CB25-153, Nov 19, 2025, Exhibit 15 — https://www.census.gov/foreign-trade/Press-Release/ft900/ft900_2508.pdf
- US Census Bureau, International Trade API, imports by HS code endpoint, queried Oct 14, 2026 (returned a missing-key redirect) — https://api.census.gov/data/timeseries/intltrade/imports/hs
- Argus Media, U. Gangatirkar, "US seaborne urea imports flat with prior year," Jun 26, 2026 — https://www.argusmedia.com/en/news-and-insights/latest-market-news/2844963-us-seaborne-urea-imports-flat-with-prior-year
- Quantum Commodity Intelligence, "US urea imports see 67% drop m-o-m in June," Aug 4, 2026 (headline and public summary; full text behind registration) — https://www.qcintel.com/ammonia/article/us-urea-imports-see-67-drop-m-o-m-in-june-70344.html
- Fertilizer Daily, A. Rezvanov, "U.S. Nitrogen Supply Heads Into 2027 With Below-Average Inventories as Yazoo City Remains Offline," Oct 5, 2026 — https://www.fertilizerdaily.com/20261005-u-s-nitrogen-supply-heads-into-2027-with-below-average-inventories-as-yazoo-city-remains-offline/
- DTN/Progressive Farmer, "UAN32 Leads Fertilizer Prices Higher," Oct 7, 2026 (retail survey Sep 28–Oct 2, 2026) — https://www.dtnpf.com/agriculture/web/ag/crops/article/2026/10/07/uan32-leads-fertilizer-prices-higher
- Advanced Turf Solutions, "U.S. Fertilizer Market Summary 10/12/2026" (NOLA urea barge and Corn Belt terminal prices for the week to Oct 2, 2026, with prior week and year ago; Trinidad shutdown note; price outlook), Oct 12, 2026 — https://www.advancedturf.com/wp-content/uploads/2026/04/ATS-Fertilizer-Market-Update-10_12_2026.pdf
- Farmbucks, "Urea (US Gulf) Futures" contract chain, data stamped Oct 13, 2026, 3:41 p.m. CT; accessed Oct 14, 2026 — https://farmbucks.com/futures/fertilizer/urea-us-gulf
- US Geological Survey, "Nitrogen (Fixed)—Ammonia," Mineral Commodity Summaries 2026, February 2026 — https://pubs.usgs.gov/periodicals/mcs2026/mcs2026-nitrogen.pdf
- DTN/Progressive Farmer, R. Quinn, "TFI: Tariffs Likely Slowed US Fertilizer Imports During 2025," Feb 26, 2026 — https://www.dtnpf.com/agriculture/web/ag/crops/article/2026/02/26/tfi-tariffs-likely-slowed-us-imports
- Crop Root Zone, TRZ-0238, "The Tampa Ammonia Contract Fell $10 for October. In the Last Two Falls It Rose $30 and $50, and Retail Anhydrous Followed It Up.," Sep 29, 2026 (October contract at an implied $545/t CFR; Texas capacity).
- Crop Root Zone, TRZ-0262, "India's Lowest Urea Offers Came In at $352.10 East and $356.25 West, Nearly 10% Under August. No Offer on Either Coast Reached Our $475 Threshold. The Gulf Barge Fell to $424.75 and Retail Rose to $683.," Oct 8, 2026.
- Crop Root Zone, TRZ-0197, "Retail Anhydrous Sits $435 a Ton Over the Tampa Ammonia Contract. Last Fall the Gap Held Near $275.," Sep 15, 2026 (spread superseded here).
Disclosures
Crop Root Zone is an independent publication. Nothing here is investment advice. Market calls, where included, reflect the editors' own read and are not a recommendation to buy or sell any security.
Nutrien's Midwest Potash Price Is $430, Up $35 to $45 Since Summer Fill. Retail Is $499, Up $6. A Ton Now Costs 113 Bushels of Iowa Corn, Not September's 102.
DTN's Sep 28–Oct 2 survey put retail potash at $499 a ton, up 1% on the month and 3% on the year. Corn Belt terminals are $400–$425 FOB against $380–$390 at the end of August, the New Orleans barge is flat at $345–$360, and Brazil has slipped to $360–$370 a tonne CFR, which leaves the US Gulf above Brazil where it was below in August and explains why a 30,000-tonne Belarusian cargo is due at New Orleans on Oct 14. Iowa cash corn fell from $4.86 to $4.40 in four weeks, so the potash-to-corn ratio gave back 12 of the 25 bushels it had gained. At Iowa State removal rates, potash for a 210-bushel corn and 70-bushel soybean rotation costs $54 an acre, $19 of it in the corn year and $35 in the soybean year.
Three things happened to fall potash in the last two weeks, and they point in different directions. On Sep 29 Nutrien raised its posted Midwest potash price by $20 to $430 a short ton FOB, its second in-season increase in four weeks (Advanced Turf Solutions, Oct 5, 2026) [7]. On Oct 9 USDA raised the corn yield and December corn lost about 20 cents on the day (DTN/Progressive Farmer, Oct 9, 2026) [16]. Iowa cash corn is now 46 cents under its mid-September level, which has taken back about half of this year's improvement in what a bushel buys. And on Oct 14, tomorrow, a 30,000-tonne cargo of Belarusian granular potash is scheduled to discharge at New Orleans, the first in four years (Global Agriculture, Oct 7, 2026) [10]. The retail price has registered very little of this. DTN's survey for Sep 28–Oct 2 put potash at $499 a ton, up $6 on the month and $16 on the year (DTN/Progressive Farmer, Oct 7, 2026) [1]. This piece sets out what potash costs at each point in the chain this week, what it costs in corn, and what a removal-rate program costs per acre.
1. Retail: $499 nationally, and Illinois moved $16 in two weeks
What's new: The national average is at the top of its range and one state report has started to move faster than the average. Illinois distributor asks for white potash averaged $516.36 a ton on Oct 2, up $15.95 from the Sep 18 report (USDA AMS, Oct 2, 2026) [4].
Evidence: DTN's $499 is the highest of the 14 four-weekly rows in its table, which starts at $483 for Sep 29–Oct 3, 2025 [1]. The weekly path through September was $494, $495, $498 and $499 (DTN/Progressive Farmer, Sep 16, Sep 23 and Sep 30, 2026) [2][3]. DTN counts a move under 5% as not significant, and by that test potash has not made a significant move in a year.
| Series | Latest, $/ton | Month ago | Year ago | Change on month | Change on year | Basis |
|---|---|---|---|---|---|---|
| DTN national retail, 0-0-60 | 499 | 493 | 483 | +1.2% | +3.3% | As quoted to growers, Sep 28–Oct 2 |
| Illinois distributor ask, white 0-0-62 | 516.36 | 500.42 | n/a | +3.2% | n/a | FOB distributor, Oct 2; range $480–$550 |
| Iowa distributor ask, red 0-0-60 | 466.75† | n/a | n/a | n/a | n/a | FOB distributor, Sep 18; range $440–$505 |
Source: DTN/Progressive Farmer, Oct 7, 2026 [1]; USDA AMS Illinois Production Cost Report, Oct 2, 2026 [4], with the month-ago figure from the Sep 4 report as cited in our Sep 18 piece [23]; USDA AMS Iowa Production Cost Report, Sep 18, 2026 [5]. †Stale: the Sep 18 Iowa report was the latest posted when this was written on Oct 13, and it showed a $25.25 decline from the prior report. Percent changes are Crop Root Zone calculations. The USDA reports do not print a year-ago column.
The Illinois range tells more than the average. On Sep 4 the asks ran from $460 to $550 [23]. On Oct 2 they ran from $480 to $550 [4]. The top did not move. The bottom rose $20, which is what it looks like when the cheapest sellers reprice toward replacement cost.
The Iowa figure runs the other way and is three and a half weeks old. We report it and do not lean on it.
2. Wholesale: the inland price rose, the river did not
What's new: The posted producer price and inland terminal values have risen for six weeks while the New Orleans barge has been flat for four. That combination is unusual, and it has widened the gap between the river and the Corn Belt terminal from about $40 a ton to about $60.
Evidence: Nutrien raised its Midwest reference price to $410 a ton FOB on Sep 3 and to $430 on Sep 29 (Advanced Turf Solutions, Sep 8 and Oct 5, 2026) [7][8]. We could not find the Sep 29 increase in a second public source and are relying on the two market summaries that carry it. The same summaries put Corn Belt terminal prices at $380–$390 on Aug 31, $385–$405 on Sep 8, $390–$410 on Sep 28, $400–$420 on Oct 5 and $400–$425 on Oct 12 [6][7][8]. NOLA barges were $340–$350 on Aug 31, moved to $345–$360 in mid-September and have been quoted there in every summary since [6][7][8].
| Layer | Aug 31 | Oct 12 | Change | Year ago | Basis |
|---|---|---|---|---|---|
| Nutrien posted, Midwest | 385–395‡ | 430 | +35 to +45 | n/a | $/st FOB Midwest terminal |
| Corn Belt terminal | 380–390 | 400–425 | +27.50* | n/a | $/st FOB warehouse |
| NOLA barge | 340–350 | 345–360 | +7.50* | 325–335 | $/st FOB barge |
| Brazil, granular | 380–390 | 360–370† | −20* | n/a | $/tonne CFR |
| National retail | 493 | 499 | +6 | 483 | $/st, as quoted to growers |
Source: Advanced Turf Solutions, "U.S. Fertilizer Market Summary," Aug 31, Sep 8, Oct 5 and Oct 12, 2026 [6][7][8]; DTN/Progressive Farmer, Sep 30 and Oct 7, 2026 [1][2] (retail weeks of Aug 24–28 and Sep 28–Oct 2). *Change in the midpoint of the quoted range, a Crop Root Zone calculation. †Latest Brazil quote is from the Oct 5 summary; the Oct 12 summary did not give one. ‡See the fill-price note below.
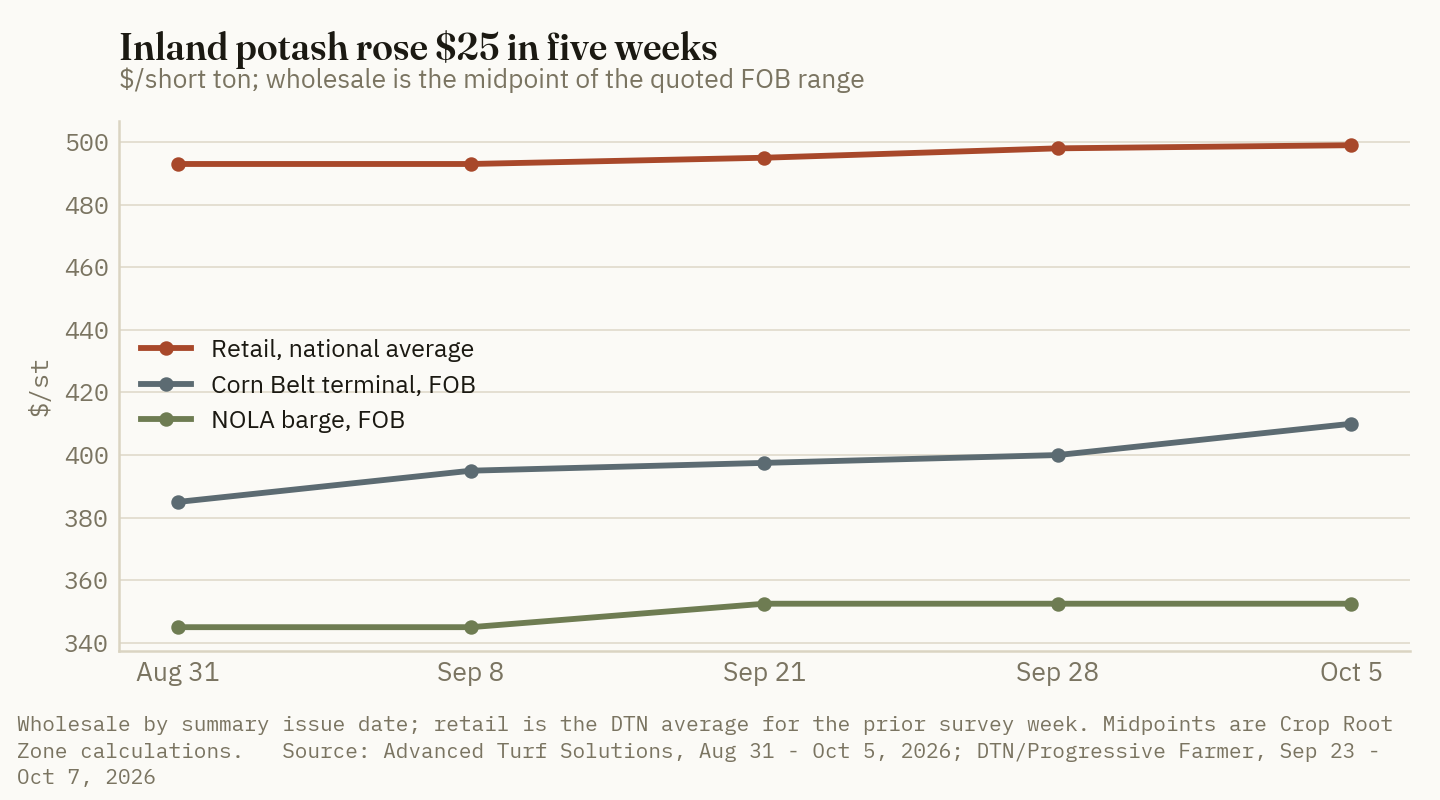
The fill price is now public, and the two sources disagree by $10. Our Sep 18 piece said no dated 2026 fill price could be found [23]. That needs correcting. Quantum Commodity Intelligence reported on Jun 11 that Nutrien rolled its summer fill potash price over at $385 a ton FOB Midwest, unchanged from April (Quantum Commodity Intelligence, Jun 11, 2026) [9]. We could read the headline and first lines only; the rest is behind a paywall. The Sep 8 market summary describes the Sep 3 increase as $15 above a "June summer fill price of $395" [8]. One plausible reading is a $385 fill offer that stepped to $395 after the fill window closed, but that is our inference and neither source says so. Either way the posted price is $35 to $45 above where retailers were offered summer tons, a rise of 9% to 12%. No fall or winter fill program for potash had been announced in anything we could find.
Retail has not followed. The gap between the national retail average and the Corn Belt terminal midpoint was $108 at the end of August and is about $87 now (Crop Root Zone calculation from [1][2][6][8]).
Ground Truth: On Sep 18 we argued that retail potash was more likely to step up $15 to $25 than to slide, because the channel was selling cheap summer tons into a flat price while replacement cost rose [23]. Illinois has now moved $16. The national average has moved $5. The part of the adjustment that is left is the national number catching up to Illinois, and our estimate is that it shows as a DTN print of $510 to $525 before Thanksgiving if the posted price holds at $430. That is an estimate from a spread, and one thing could cancel it: the river. A terminal price $60 over the barge is an invitation to anyone who can buy at New Orleans and truck inland, and the next section is about who has just shown up there.
3. Offshore: the Gulf now pays more than Brazil, and a Belarusian cargo is due
What's new: The US Gulf has moved from a discount to Brazil to a premium in seven weeks. That is the plain commercial reason a Belarusian cargo is arriving now and did not arrive earlier.
Evidence: The cargo is 30,000 tonnes of granular muriate of potash, loaded Sep 15 at Bronka near St. Petersburg and due at the Port of New Orleans around Oct 14 [10]. Arrival had not been confirmed when this was written. It follows the easing of US sanctions on the Belarusian producers that began in December 2025 [10]. Before 2021 the US took about 635,000 tonnes a year from Belarus, so this vessel is under 5% of one year of the old trade [10][12]. On Sep 21 the US president described a "massive" potash deal with Belarus, and on the same day the Belarusian president said the country had no spare volume because everything was contracted (Fertilizer Daily, relaying RFE/RL, Sep 28, 2026) [11].
Our Sep 9 piece argued that no Belarusian potash had come because the United States was the lowest-netback market on offer [24]. The price relationship behind that argument has since reversed.
| Market | Aug 20–31 | Early October | Basis |
|---|---|---|---|
| US Gulf, NOLA barge | $340/st (≈$375/t) | $345–$360/st (≈$380–$397/t) | FOB barge |
| Brazil, granular | $390–$403/t | $360–$370/t | CFR |
| US Gulf less Brazil, midpoints | about −$22/t* | about +$24/t* | Not freight-adjusted |
| World Bank MOP, monthly average | $386.90/t (Aug) | $367.50/t (Sep) | Granular spot, CFR Brazil |
| India 2026 contract | $383/t | unchanged | CFR, settled May 18 |
| China 2026 contract | $348/t | unchanged | CFR, settled Nov 2025 |
Source: August column from Fertilizer International assessments dated Aug 20 as cited in our Sep 18 piece [23]; October column from Advanced Turf Solutions, Oct 5 and Oct 12, 2026 [6][7]; World Bank Pink Sheet, Oct 2, 2026 [13]; contract settlements as cited in [23]. *Crop Root Zone calculation at 1.10231 short tons per tonne. A barge price and a CFR vessel price are not the same basis, so the difference shows direction and should not be read as an arbitrage margin.
The World Bank series confirms the offshore direction. Its muriate benchmark averaged $396.50 a tonne in July, $386.90 in August and $367.50 in September, and the third quarter averaged $383.60 against $402.90 in the second (World Bank, Oct 2, 2026) [13]. A secondary report puts the May figure at $405 and counts September as the third straight monthly decline, a fall of about 9% from May (Crux Investor, Oct 6, 2026) [12].
Two things a fall buyer would want to know are not public, and one earlier statement of ours needs correcting. No 2027 China contract has been reported. Canpotex's last public statement that it was fully committed covered sales through June 30, 2026 [26], and we found none for the second half. Its recent news is a C$500 million rebuild of its Vancouver terminal, begun Sep 25 and due for completion in 2028 (Fertilizer Daily, Sep 30, 2026) [21]. And the next new mine is later than we said in July. BHP's annual report puts Jansen Stage 1 at 84% complete on June 30 with first production in mid-2027 (BHP Group, Form 6-K, Aug 18, 2026) [20]. Our July piece gave late 2026 [26].
Ground Truth: The domestic price is rising on a producer's posted number while the seaborne price it ultimately has to answer to is falling. That can persist through a fall application season, because fall demand is prompt and inland and a vessel takes a month to arrive. It does not persist through a winter. A Midwest terminal at $430 against a Gulf barge at $345–$360 and Brazil at $360–$370 CFR is a wider inland premium than in any of the market summaries cited here or in our Sep 18 piece [23], and it is the condition under which offshore tons find the Mississippi. One 30,000-tonne vessel does not move a market that imports millions of tonnes. What it does is establish that the route works, the paperwork clears and a buyer exists. The check on a $430 posted price is the barge quote, and a grower pricing spring potash should watch the gap between New Orleans and the Corn Belt terminal. If it closes from the top, spring potash is cheaper than fall.
4. In corn: 113 bushels a ton, up from 102 four weeks ago
What's new: The potash-to-corn ratio has given back about half of this year's improvement in one month. Potash rose $5. Corn did the rest.
Evidence: On Sep 16 we put a ton of retail potash at 101.6 bushels of Iowa cash corn, using $494 potash and a $4.86 average of six Iowa country-elevator regions [22]. The same six regions averaged $4.40 on Oct 12, and the year-ago column averaged $3.66 (USDA AMS, Oct 12, 2026) [14]. December corn settled at $4.83 on Oct 12 against $5.3575 on Sep 15 [14][22]. The Oct 9 WASDE raised the corn yield 2.7 bushels to 181.2, raised ending stocks by 282 million bushels to 1.849 billion and cut the season-average price 10 cents to $4.70 [16].
113 bushels
Iowa cash corn needed to buy a ton of retail potash on Oct 12, against 102 in mid-September and 132 a year ago on the same basis. (Crop Root Zone calculation from DTN/Progressive Farmer, Oct 7, 2026 [1]; USDA AMS Iowa Daily Cash Grain Bids, Oct 12, 2026 [14])
The ratio depends on which corn price is used, and the spread across today's public prices is 16 bushels.
| Corn price used | $/bu | Bushels per ton of potash at $499 | Lb of K2O one bushel buys |
|---|---|---|---|
| Iowa country elevators, Oct 12 | 4.40 | 113.3 | 10.6 |
| Central Illinois country elevators, Oct 12 | 4.48 | 111.4 | 10.8 |
| WASDE 2026/27 season average | 4.70 | 106.2 | 11.3 |
| December 2026 futures, Oct 12 | 4.83 | 103.3 | 11.6 |
| December 2027 futures, Oct 12 | 5.1225 | 97.4 | 12.3 |
Source: USDA AMS Iowa Daily Cash Grain Bids and Illinois Grain Bids, Oct 12, 2026 [14][15]; DTN/Progressive Farmer, Oct 9, 2026 [16]; potash from [1]. Ratios are Crop Root Zone calculations. Potash at $499 a ton is $0.416 a pound of K2O.
Against recent Octobers, on USDA's national October price received:
| October | Retail potash, $/ton | US corn, $/bu | Bushels per ton | |
|---|---|---|---|---|
| 2020 | 335 | 3.61 | 92.8 | ███████░░░ |
| 2021 | 675 | 5.02 | 134.5 | ██████████ |
| 2022 | 874 | 6.49 | 134.7 | ██████████ |
| 2023 | 506 | 4.93 | 102.6 | ████████░░ |
| 2024 | 448 | 3.99 | 112.3 | ████████░░ |
| 2025 | 483 | 3.93 | 122.9 | █████████░ |
| 2026* | 499 | 4.40–4.70 | 106–113 | ████████░░ |
| 2020–25 average | 116.6 | █████████░ |
Source: Potash is the DTN national retail average for the survey weeks of Oct 5–9, 2020; Oct 4–8, 2021; Sep 26–30, 2022; Oct 9–13, 2023; Oct 7–11, 2024; Sep 29–Oct 3, 2025; and Sep 28–Oct 2, 2026 (DTN/Progressive Farmer, Oct 13, 2021; Nov 2, 2022; Oct 15, 2024; Oct 7, 2026) [1][18]. Corn is the US October price received (USDA NASS Agricultural Prices, Nov 30, 2020; Nov 30, 2021; Jan 31, 2025; Sep 29, 2026) [17]. *The October 2026 national price is not published until late November. The range shown runs from the Iowa cash average to the WASDE season-average price; the bar is drawn at 113. In October 2025 Iowa cash bids ran about 7% under the national price, so the true 2026 figure on this basis is more likely near the low end of the range. Ratios, average and bars are Crop Root Zone calculations; bars scale 134.7 to ten blocks.
Potash is still cheaper in corn than the six-year October average and cheaper than a year ago on any basis. It is no longer at the 2019–20 level our September piece reported. In soybeans the ratio has held better. A ton costs about 41 bushels at Iowa's $12.21 against 52 a year ago at $9.33, and 39 in mid-September [14][22].
5. Per acre: $19 in the corn year, $35 in the soybean year
What's new: At $499 a ton, replacing the potash a corn-soybean rotation removes costs about $54 an acre across the two crops. Nearly two-thirds of it leaves with the soybeans.
Evidence: Iowa State's removal coefficients are 0.22 lb of K2O per bushel of corn grain and 1.2 lb per bushel of soybeans (Iowa State University Extension, PM 1688, Oct 2013 edition, Table 2) [19]. We opened the 2013 edition. Our Sep 24 piece cites the February 2023 revision for the same two coefficients and for default yields of 210 and 70 bushels [25]. Tri-State and Illinois coefficients run 0.20 to 0.24 for corn and 1.15 to 1.17 for soybeans [25], so the choice of university moves the answer by less than 10%.
| Yield, corn / soybeans (bu) | K2O removed, corn year (lb) | K2O removed, soybean year (lb) | 0-0-60 for both crops (lb/acre) | Corn year, $/acre | Soybean year, $/acre | Rotation, $/acre |
|---|---|---|---|---|---|---|
| 180 / 55 | 39.6 | 66.0 | 176 | 16.47 | 27.45 | 43.91 |
| 210 / 70 | 46.2 | 84.0 | 217 | 19.21 | 34.93 | 54.14 |
| 240 / 80 | 52.8 | 96.0 | 248 | 21.96 | 39.92 | 61.88 |
Basis: potash at $499 a ton delivered retail ($0.416/lb K2O), national average, Sep 28–Oct 2 [1]; removal at 0.22 and 1.2 lb K2O per bushel [19]. No spreading charge. Crop Root Zone calculations. These are removal rates for soils in the Optimum category. They are not a recommendation for any field; the rate is a soil-test decision.
The same 210 and 70 bushel rotation at other prices in this piece:
| Price used | $/ton | $/lb K2O | Rotation, $/acre | Difference from national retail |
|---|---|---|---|---|
| National retail, a year ago | 483 | 0.403 | 52.41 | −1.73 |
| Iowa distributor ask, Sep 18† | 466.75 | 0.389 | 50.64 | −3.50 |
| Illinois low ask, Oct 2 (0-0-62) | 480 | 0.387 | 50.40 | −3.74 |
| National retail, Sep 28–Oct 2 | 499 | 0.416 | 54.14 | — |
| Illinois average ask, Oct 2 (0-0-62) | 516.36 | 0.416 | 54.22 | +0.08 |
| National retail plus $25* | 524 | 0.437 | 56.85 | +2.71 |
| Illinois high ask, Oct 2 (0-0-62) | 550 | 0.444 | 57.75 | +3.61 |
Basis: 130.2 lb K2O an acre over two crops. Sources: [1][4][5]. White 0-0-62 carries 1,240 lb of K2O a ton, so $516.36 for it costs the same per pound as $499 for 0-0-60. †Stale, see section 1. *A Crop Root Zone scenario for the retail catch-up discussed in section 2; it is not a forecast of a published price. Distributor asks are FOB and exclude delivery.
In grain, the corn year's potash costs 4.4 bushels of Iowa corn, about 2% of a 210-bushel crop. It cost 3.9 bushels in mid-September and 5.1 a year ago. The soybean year's potash costs 2.9 bushels of soybeans, about 4% of a 70-bushel crop, against 3.6 a year ago (Crop Root Zone calculations from [1][14][22]).
Ground Truth: Three different things moved the potash bill this month, and per acre they are not the same size. The corn price fall cost the corn year about half a bushel. The retail catch-up we expect is worth $2.71 on the whole rotation. The gap between the lowest and highest Illinois ask on one Friday is worth $7.35. So the ranking from September still holds after a month in which the market did more than it had all year: the quote matters more than the timing, and the timing matters more than the ratio. The second point is about which crop carries the cost. Potash is usually discussed as a corn input and budgeted in bushels of corn. At removal rates, about 65% of a rotation's potassium leaves in the soybeans, and soybeans are up 31% on the year in Iowa while corn is up 20% [14]. The crop that takes most of the potash off the field is the crop that is currently paying for it most easily. A grower trimming fall potash because corn fell 46 cents is reacting to the wrong crop.
What to watch
- The Oct 14 discharge at New Orleans, and whether a second Belarusian vessel is fixed. One cargo proves the route. A second would say something about price.
- The barge. NOLA has been $345–$360 in four straight summaries. A move above $365 would mean the river is following the posted price. A move below $345 would mean the posted price has to come back to the river.
- The next retail prints. DTN normally publishes on Wednesdays, so the next survey is expected Oct 14, and the bi-weekly Illinois and Iowa cost reports are next expected Oct 16. A national figure above $505, or a second Illinois rise, confirms the catch-up. A fresh Iowa report would replace a stale one that points the other way.
- A winter fill announcement. None is public. The fill price sets the cost of the tons that will be sold next spring.
- The World Bank's October average, due in early November. A fourth quarter that opens below $367.50 widens the gap between the offshore and inland markets.
- A 2027 China contract. The 2026 settlement was $348 a tonne and nothing has been reported for 2027.
- USDA's October corn price, due in late November, which settles the 2026 row in the ratio table.
References
- DTN/Progressive Farmer, Russ Quinn, "UAN32 Leads Fertilizer Prices Higher," Oct 7, 2026 (retail survey Sep 28–Oct 2, 2026; four-weekly table from Sep 29–Oct 3, 2025) — https://www.dtnpf.com/agriculture/web/ag/crops/article/2026/10/07/uan32-leads-fertilizer-prices-higher
- DTN/Progressive Farmer, Russ Quinn, "Anhydrous Leads Fertilizer Prices Higher, Up 25% From a Year Ago," Sep 30, 2026 (retail survey Sep 21–25, 2026; table row for Aug 24–28, 2026) — https://www.dtnpf.com/agriculture/web/ag/crops/article/2026/09/30/anhydrous-leads-fertilizer-prices-25
- DTN/Progressive Farmer, Russ Quinn, "Fertilizer Prices Continue Lower for 6 of 8 Major Nutrients," Sep 16, 2026 (survey Sep 7–11), and "Fertilizer Prices Rise for Six of Eight Major Fertilizers," Sep 23, 2026 (survey Sep 14–18) — https://www.dtnpf.com/agriculture/web/ag/crops/article/2026/09/16/fertilizer-prices-continue-lower-6-8 and https://www.dtnpf.com/agriculture/web/ag/crops/article/2026/09/23/fertilizer-prices-rise-six-eight
- USDA AMS, Illinois Production Cost Report (Bi-weekly), week ending Oct 2, 2026 — https://www.ams.usda.gov/mnreports/ams_3195.pdf
- USDA AMS, Iowa Production Cost Report (Bi-Weekly), week ending Sep 18, 2026 (the latest report posted on Oct 13, 2026; stale) — https://www.ams.usda.gov/mnreports/ams_2863.pdf
- Advanced Turf Solutions, "U.S. Fertilizer Market Summary," Oct 12, 2026 — https://www.advancedturf.com/wp-content/uploads/2026/04/ATS-Fertilizer-Market-Update-10_12_2026.pdf
- Advanced Turf Solutions, "U.S. Fertilizer Market Summary," Oct 5, 2026 — https://www.advancedturf.com/wp-content/uploads/2026/10/ATS-Fertilizer-Market-Update-10_5_2026.pdf
- Advanced Turf Solutions, "U.S. Fertilizer Market Summary," Aug 31, Sep 8, Sep 21 and Sep 28, 2026 — https://www.advancedturf.com/wp-content/uploads/2026/04/ATS-Fertilizer-Market-Update-8_31_2026.pdf (the other three issues are at the same address with 9_8_2026, 9_21_2026 and 9_28_2026 in the file name). The price-table date printed at the head of some issues does not match the issue date, so this piece refers to each by issue date.
- Quantum Commodity Intelligence, "Nutrien rolls over summer fill potash price at $385/st FOB Midwest," Jun 11, 2026 (headline and opening lines only; the article is behind a paywall) — https://www.qcintel.com/ammonia/article/nutrien-rolls-over-summer-fill-potash-price-at-385-st-fob-midwest-66708.html
- Global Agriculture, "First Belarusian potash cargo in four years set to reach US port," Oct 7, 2026 — https://www.global-agriculture.com/crop-nutrition/first-belarusian-potash-cargo-in-four-years-set-to-reach-us-port/
- Fertilizer Daily, Andrey Viktorov, relaying RFE/RL, on the limits of a US–Belarus potash deal and the New Orleans cargo, Sep 28, 2026 — https://www.fertilizerdaily.com/20260928-belarus-potash-us-deal-limits-new-orleans/
- Crux Investor, Ryan Charles, "Sanctions Relief Returns Belarusian Potash to US Ports as Prices Fall," Oct 6, 2026 (secondary source for the May 2026 World Bank figure and the 2017–21 import average) — https://www.cruxinvestor.com/posts/sanctions-relief-returns-belarusian-potash-to-us-ports-as-prices-fall
- World Bank, Commodities Price Data (The Pink Sheet), Oct 2, 2026 (potassium chloride, granular spot, CFR Brazil; July–September 2026 monthly and quarterly averages) — https://thedocs.worldbank.org/en/doc/74e8be41ceb20fa0da750cda2f6b9e4e-0050012026/related/CMO-Pink-Sheet-October-2026.pdf
- USDA AMS, Iowa Daily Cash Grain Bids, Oct 12, 2026 (six country-elevator regions, current and year-ago corn and soybean averages; CBOT settlements) — https://www.ams.usda.gov/mnreports/ams_2850.pdf
- USDA AMS, Illinois Grain Bids, Oct 12, 2026 (central Illinois country-elevator average) — https://www.ams.usda.gov/mnreports/ams_3192.pdf
- DTN/Progressive Farmer, "USDA Raises Corn Yield 2.7 bpa to 181.2," Oct 9, 2026 (October Crop Production and WASDE summary). The 20-cent fall in December corn that day is from a search-result summary of DTN's and AgWeb's same-day market coverage, which we did not open — https://www.dtnpf.com/agriculture/web/ag/news/article/2026/10/09/usda-raises-corn-yield-2-7-bpa-181-2
- USDA NASS, Agricultural Prices, released Nov 30, 2020 (October 2020 corn); Nov 30, 2021 (October 2021); Jan 31, 2025 (October 2022 and 2023); Sep 29, 2026 (October 2024 and 2025) — https://www.nass.usda.gov/Publications/Todays_Reports/reports/agpr0926.pdf, with agpr1120.pdf, agpr1121.pdf and agpr0125.pdf at the same address
- DTN/Progressive Farmer, Russ Quinn, retail fertilizer price tables: "Anhydrous Breaks $800 Per Ton," Oct 13, 2021; "Most Fertilizer Prices Continue Lower," Nov 2, 2022; "Most Retail Fertilizer Prices Continue Lower," Oct 15, 2024 — https://www.dtnpf.com/agriculture/web/ag/crops/article/2021/10/13/anhydrous-breaks-800-per-ton-prices ; https://www.dtnpf.com/agriculture/web/ag/crops/article/2022/11/02/fertilizer-prices-continue-lower ; https://www.dtnpf.com/agriculture/web/ag/crops/article/2024/10/15/retail-fertilizer-prices-continue
- Iowa State University Extension and Outreach, PM 1688, "A General Guide for Crop Nutrient and Limestone Recommendations in Iowa," revised Oct 2013, Table 2 (the Feb 2023 revision was not opened for this piece) — https://www.agronext.iastate.edu/soilfertility/info/PM%201688%202013.pdf
- BHP Group Limited, Form 6-K attaching the Annual Report 2026, Aug 18, 2026 (Jansen Stage 1 status) — https://www.sec.gov/Archives/edgar/data/0000811809/000119312526355840/d54971d6k.htm
- Fertilizer Daily, Kim Clarksen, on Canpotex's C$500 million upgrade of Neptune Bulk Terminals, Sep 30, 2026 — https://www.fertilizerdaily.com/20260930-neptune-bulk-terminals-canpotex-potash-upgrade/
- Crop Root Zone, TRZ-0199, "A Ton of Potash Costs About 102 Bushels of Corn, Back to Its 2019–20 Level. DAP Still Takes About 190, More Than at the 2022 Peak.," Sep 16, 2026.
- Crop Root Zone, TRZ-0208, "Retail Potash Averages $494 a Ton and the Barge at New Orleans Is $340. That $154 Gap Is $30 Narrower Than in March, Because Wholesale Rose 11% While Retail Rose 1%.," Sep 18, 2026 (also the source here for the Sep 4 Illinois report, the Aug 20 Fertilizer International assessments and the 2026 India and China contract settlements).
- Crop Root Zone, TRZ-0174, "The Sanctions Came Off Belarusian Potash Nine Months Ago. The Reason None Arrived Is the Price.," Sep 9, 2026.
- Crop Root Zone, TRZ-0227, "Skipping Fall P&K Ahead of Corn Saves About $87 an Acre. On Ground Testing Optimum, Only About $14 of It Is Real Money.," Sep 24, 2026 (Iowa State 2023, Tri-State and Illinois removal coefficients).
- Crop Root Zone, TRZ-0009, "Potash Holds Its Line While Belarus Reroutes and Canpotex Sells Out," Jul 18, 2026.
Disclosures
Crop Root Zone is an independent publication. Nothing here is investment advice. Market calls, where included, reflect the editors' own read and are not a recommendation to buy or sell any security.
A Crushed Soybean Is Worth $15.30, the Same as in August. The Bean Rose $1.14 and Took Most of the Board Margin. Oil Is Back Under Half the Value, and Processors Pay 23 to 42 Cents Over the Country Elevator.
At October 16 settlements the CBOT board crush is $2.69 a bushel, down from $3.82 on August 11. The products in a bushel are worth the same; the soybean is $1.14 higher. Oil's share of that value has fallen from 52% to 48% because meal rose $28.50 a ton while oil lost 5.6 cents a pound. Processor bids are 23 cents over Iowa and Indiana country averages and 42 cents over Illinois', worth $12 to $22 an acre. Indiana processors pay 24 cents more for November delivery than for delivery now. Most new crush capacity will not run before 2028, so the plants keep the margin. Growers collect through the flat price and the delivery slot, not through a wider basis.
The CBOT soybean board crush was $2.69 a bushel at Friday, October 16 settlements. November soybeans settled at $12.6125. December soybean oil was 67.15 cents a pound and December meal $359.80 a short ton, both derived from USDA's cash prices and quoted basis (USDA AMS, Illinois Grain Bids, Oct 16, 2026; USDA AMS, National Grain and Oilseed Processor Feedstuff Report, Oct 16, 2026) [1][2]. The margin has fallen $1.13 since August 11. The oil and meal from a crushed bushel are worth $15.30, one cent more than they were then. The soybean price rose $1.14, and that rise accounts for all of the decline. The crush margin is still about $1.18 above its 2021–2025 average of $1.51 (Argus Media, Jul 1, 2026) [3], but over the last two months most of the processor's margin above that average has gone into the price of beans.
TRZ-0088 found oil had become the majority of crush revenue in August (TRZ-0088, Aug 12, 2026) [4]. By mid-October it was not. This piece asks what that shift, along with the new plants and the biofuel rules behind the oil price, is worth to a grower selling 2026 soybeans this fall.
1. The board crush: $2.69, with oil at 48% of the bushel
What's new: On October 16 the products from one bushel were worth $7.39 in oil and $7.92 in meal. Oil's share of that value was 48.3%. On August 11 it was 52.3%, and on June 30 it was 52.4%.
Evidence: The table applies the standard board-crush yields, 11 pounds of oil and 44 pounds (0.022 short ton) of meal per bushel, to each date's nearby futures.
| Date | Soybeans $/bu | Oil ¢/lb | Meal $/st | Product value $/bu | Board crush $/bu | Oil share | |
|---|---|---|---|---|---|---|---|
| Oct 21, 2025 | 10.3075 | 50.65 | 286.90 | 11.88 | 1.58 | 46.9% | ████░░░░░░ |
| May 5, 2026 | — | — | — | — | 3.76 | — | █████████░ |
| Jun 3, 2026 (record) | — | — | — | — | 4.18 | — | ██████████ |
| Jun 30, 2026 | 11.17 | 67 | 304.70 | 14.07 | 2.90 | 52.4% | ███████░░░ |
| Aug 11, 2026 | 11.4725 | 72.76 | 331.30 | 15.29 | 3.82 | 52.3% | █████████░ |
| Oct 16, 2026 | 12.6125 | 67.15 | 359.80 | 15.30 | 2.69 | 48.3% | ██████░░░░ |
| 2021–2025 average | 1.51 | ████░░░░░░ |
Basis: CBOT nearby futures; bars scale the board crush to the $4.18 record. Source: Brownfield Ag News closing futures, Oct 21, 2025, as shown in search-engine results (page not reached) [5]; Argus Media, Jul 1, 2026 and May 8, 2026 (May 5, Jun 3 and Jun 30 margins and Jun 30 prices; Jun 30 oil rounded by Argus to 67 cents) [3][6]; TRZ-0088, Aug 12, 2026 (Aug 11 soybeans, oil opening quote and August meal) [4]; USDA AMS, Oct 16, 2026 [1][2]. October 16 oil and meal futures are Crop Root Zone derivations: Iowa crude oil at 66.65 cents is quoted 50 points under December, and Illinois rail meal at $379.80 is quoted $20 over December. A year-ago settlement for October 16, 2025 could not be reached, so the nearest available date is used. Product values, margins and shares are Crop Root Zone calculations, gross of processing cost and freight.
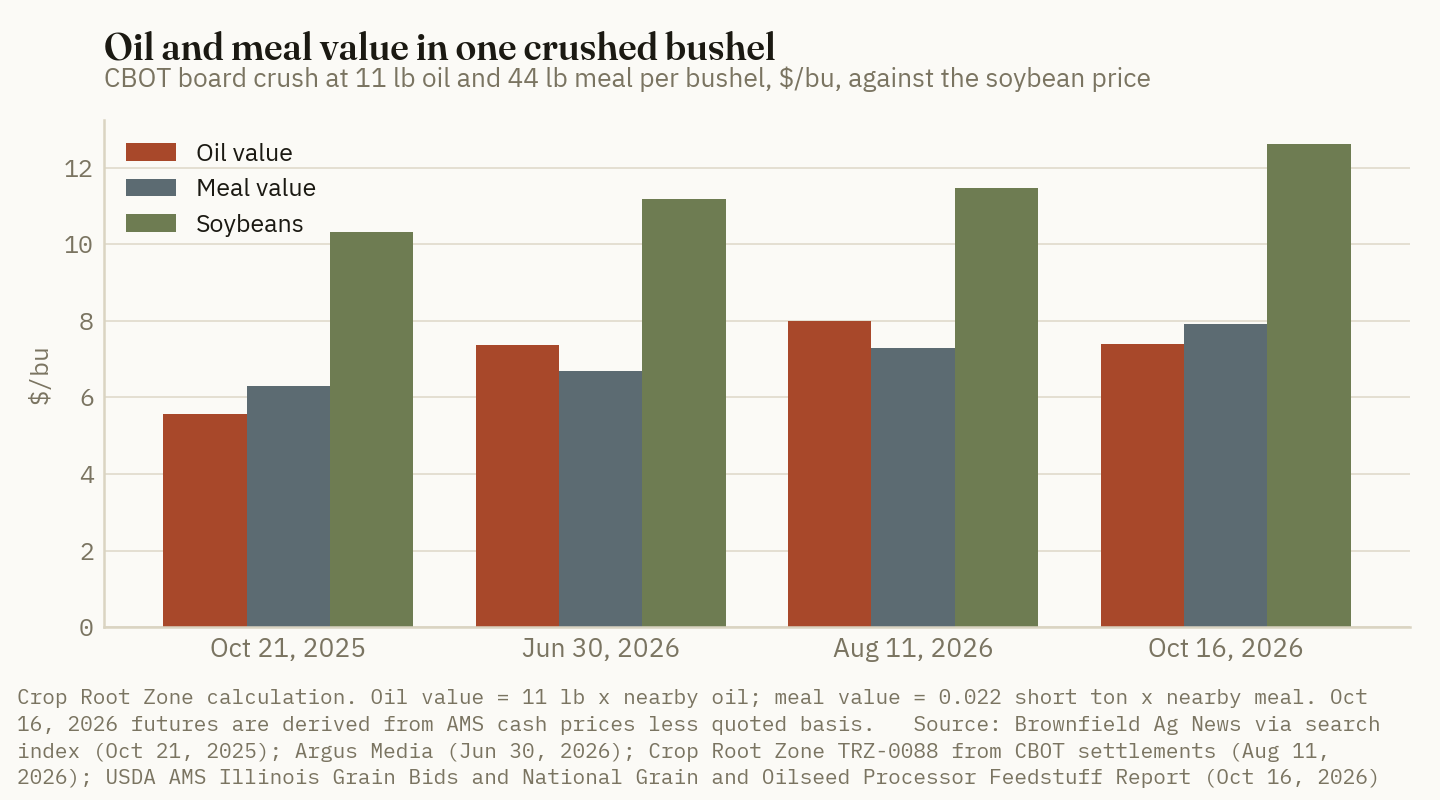
Two products moved in opposite directions. Since August 11, oil lost 5.61 cents a pound, or 62 cents a bushel. Meal gained $28.50 a ton, or 63 cents a bushel. Since June 30, meal is up $55 a ton, or 18%, while oil is flat. USDA's October balance sheet points the same way. It holds the 2026/27 meal price at $340 a ton, after a $30 increase in September, on meal exports of 22.7 million tons against 20.5 million in 2025/26 (USDA WASDE-676, Oct 9, 2026; USDA ERS, Oil Crops Outlook OCS-26i, Sep 15, 2026) [7][23]. Actual plant yields do not change the result. NOPA members' September oil yield was 11.72 pounds a bushel (Walk-Squawk Market Talk, Oct 16, 2026) [8]. At that yield the oil share is 49.6%, still below half.
Ground Truth: August's "the crush is run for the oil" was a peak reading, not a new normal. The meal leg has recovered as the oil leg has drifted, and the meal leg is a market leg, priced by feed demand and an export book that USDA has just raised. A crush that is half meal is less exposed to a single policy decision than one that is 53% oil. That makes the $2.69 margin harder to knock down than August's $3.82 was. It does not make the margin any more likely to pass through to growers (Section 4).
2. The bean took the margin, because the plants need beans
What's new: NOPA members crushed 196.3 million bushels in September, against a trade estimate of 203.7 million. That was down 4.5% from August and 0.8% below September 2025. Soybean oil stocks fell 148 million pounds to 1.053 billion, against an expected drop of about 85 million (DTN, Oct 15, 2026; Walk-Squawk Market Talk, Oct 16, 2026) [9][8].
Evidence: The shortfall came from bean supply, not demand. On October 11 the soybean harvest was 46% complete, against a five-year average of 50% (DTN/USDA NASS Crop Progress, Oct 13, 2026) [10]. Plants that end the old crop short of beans and start the new crop late must bid for supply. In late September some Iowa processors bid as much as $1 over futures for prompt delivery, and that premium was gone by mid-October once harvest beans reached the plants (TRZ-0283, Oct 15, 2026) [20]. The basis premium lasted a few days. The flat-price gain has held. USDA's 2026/27 crush forecast of 2.780 billion bushels is 5.1% above the 2.646 billion estimated for 2025/26 [7]. The marketing year opened with a September crush below the previous year's.
+$0.01 vs +$1.14
Change since August 11 in the value of the products from one crushed soybean, against the change in the November soybean price. The $1.13 drop in the board crush went to the bean. (Crop Root Zone calculation from TRZ-0088, Aug 12, 2026, and USDA AMS, Oct 16, 2026)
The same pattern appears against a year ago. Product value per bushel is up $3.42 from October 21, 2025. The bean price is up $2.31 and the margin is up $1.11. Two-thirds of the gain in product value has reached the soybean price, which in the end is where a grower collects. USDA's season-average price is $12.00 [7]. Central Illinois country elevators averaged $12.29 on October 16 [1].
3. The oil leg is a policy leg
What's new: All three policies that set the soybean oil price are now in force or close to it. EPA finalized 2026 and 2027 Renewable Fuel Standard volumes on March 27. Biomass-based diesel is set at 8.86 and 8.95 billion RIN gallons, or 9.07 and 9.20 billion after 70% of exempted small-refinery volumes is reallocated (farmdoc daily, Apr 16, 2026) [11]. The half-RIN penalty on imported fuel and feedstock is delayed to 2028. Renewable diesel's equivalence value drops to 1.5, the same as biodiesel, in 2027 [11]. For 45Z, Treasury's proposed regulations of February 4, 2026, were still not final in mid-September. IRS Notice 2026-53, issued September 8, published the 2026 emissions-rate table. Feedstock from outside the U.S., Canada and Mexico is ineligible for fuel produced after 2025, and the credit runs through 2029 (Latham & Watkins, Sep 17, 2026) [12].
Evidence: USDA puts 2026/27 soybean oil use for biofuel at 17.8 billion pounds. That compares with 14.8 billion in 2025/26 and 11.76 billion in 2024/25, and it is 54% of domestic soybean oil use [7]. On the credits, D4 RINs of 2026 vintage were assessed at 207.5 to 209 cents on October 13 (Fastmarkets, correction notice, Oct 16, 2026) [13]. The American Soybean Association estimates that the 2026 45ZCF-GREET model lowers soybean biodiesel's carbon intensity from 33.70 to 20.23 and raises its credit from $0.33 to $0.66 a gallon (ASA, Aug 27, 2026) [14]. Fastmarkets' June estimate is lower, at 49 cents for soybean oil generally (Fastmarkets, Jun 16, 2026) [15]. Converting those values to one bushel's 11 pounds of oil:
| Policy value attached to the oil in one bushel | Value | Basis |
|---|---|---|
| Oil, market value at 67.15¢/lb | $7.39 | December futures, Oct 16 |
| Biodiesel from 11 lb of oil | 1.45 gal* | ~7.6 lb oil per gallon |
| D4 RINs at 1.5 per gallon, $2.08 each | $4.52* | Fastmarkets 2026 vintage, Oct 13 midpoint |
| 45Z credit at $0.66/gal (soybean biodiesel) | $0.96* | ASA estimate, 2026 GREET |
| Policy value, total | $5.47* | 74% of the oil's market value |
Source: USDA AMS, Oct 16, 2026 [2]; Fastmarkets, Oct 16, 2026 [13]; ASA, Aug 27, 2026 [14]. *Crop Root Zone estimates. The oil-to-biodiesel conversion is a rounded industry rule of thumb. At Fastmarkets' 49-cent 45Z figure the credit line is $0.71. These are gross credit values generated downstream of the crusher. RIN and 45Z value is split among feedstock seller, producer and blender in proportions no public source reports, so the table shows the scale of the policy support, not the amount priced into soybean oil.
The scale is the point. Most of the support for soybean oil's price is created by a federal rule. The 2026–27 RFS volumes are set, and 45Z's feedstock rule shields North American oil from imported tallow and used cooking oil. Of the policies still open, the 45Z final regulations and the 2028 half-RIN start can move the oil leg far more than any crop report. Argus attributed the drop from the June margin record mainly to falling oil, to the crude-oil decline and to rebounding tallow and used-cooking-oil imports [3]. The 2026 policy changes the grower can act on directly are small. USDA's crop carbon-intensity framework is now built into the September GREET model [12]. ASA puts the maximum potential no-till plus cover-crop premium at 30 to 40 cents a bushel across much of the main soybean region, and it describes that as "the maximum potential, not the likely outcome" [14].
Ground Truth: For a grower, policy risk in the crush matters mostly for the 2027 crop, not the 2026 crop in the bin. The RVOs that drive this marketing year are final, and the North American feedstock rule is in effect even though the 45Z text is not. The event to watch is the final 45Z rule. If its credit table holds the 2026 GREET values, the oil leg stays at about $7 or more a bushel and the meal leg is the variable. If Treasury reverts to lower soybean values, oil gives back part of what it gained from the removal of indirect land-use change. On the 49-to-66-cent range of published estimates, that is up to 25 cents a bushel of credit on the oil (our arithmetic: 1.45 gal × $0.17).
4. New capacity arrives in 2028. Until then the margin stays at the plant
What's new: The two large new plants announced this year will not run during the 2026/27 marketing year. CHS will build an 80-million-bushel plant at Evansville, Wisconsin, at a cost of $700 million. Completion is targeted for fall 2028 (DTN, Sep 14, 2026) [16]. NOPA's chief executive credited the RFS volumes for the investment [16]. ADM's expansion at four plants adds about 700,000 metric tons a year, more than 25 million bushels, between mid-2028 and early 2029 (Processing Journal, Sep 15, 2026) [17].
Evidence:
| Project | Location | Size | Status | |
|---|---|---|---|---|
| CHS greenfield plant | Evansville, Wis. | 80 mil bu/yr | Fall 2028 target | ██████████ |
| Incobrasa second plant | Gilman, Ill. | 160,000 bu/day (~53 mil bu/yr*) | Operating | ███████░░░ |
| ADM expansion, four plants | Ind., Mo., Neb., N.D. | >25 mil bu/yr | Mid-2028 to early 2029 | ███░░░░░░░ |
| Bunge protein concentrate plant | Morristown, Ind. | ~4.5 mil bu/yr | Opened May 2026 | █░░░░░░░░░ |
Source: DTN, Sep 14, 2026 [16]; Processing Journal, Sep 15, 2026 [17]. *Crop Root Zone estimate at 330 operating days. Processing Journal does not give an opening date for the Incobrasa plant. Bars scaled to 80 million bushels a year.
Against that pipeline, Argus put U.S. crush capacity at up to 71 million metric tons a year in May, allowing for maintenance. That is about 2.61 billion bushels, and Argus estimated March utilization at a record 92% (Argus Media, May 8, 2026) [6]. USDA's 2.78-billion-bushel forecast is 6.6% above Argus's ceiling (our conversion at 36.74 bushels a ton). Some of the gap is plants added since May, such as Gilman's, and some is Argus's maintenance allowance. Either way, the industry has to run near its limit all year to reach USDA's number. Argus's conclusion in May still holds. With crushers near full capacity, they can absorb little more soybean demand, so a high margin passes through to the soybean price only to a limited degree [6]. When every plant is full, a wide margin does not buy more beans, and an extra 10 cents of basis would not raise the crush.
Ground Truth: Do not expect the board margin to show up as a wider processor premium this winter. A full plant bids to keep its own draw area loyal, not to win beans from the next plant. The premium should therefore track local competition and the plant's own grind schedule, not the board crush. New plants change that within their own draw areas, which is why the place to look for an improving premium is near Gilman now and around Evansville and the four ADM sites after 2028. Elsewhere, the large 2026/27 margin pays for plant expansion, and growers receive it through the flat price.
5. What the processor bid is worth, and when to deliver
What's new: On October 16 processor bids were 23 to 42 cents over the country-elevator averages in the three largest eastern Corn Belt soybean states. A year ago the premium was 34 cents in Iowa, so it has narrowed by 10 cents there. It has widened by 10 cents in Illinois and 3 cents in Indiana [1][18][19].
Evidence:
| Oct 16, 2026, current delivery | Processor $/bu | Processor basis | Country avg $/bu | Premium | Year-ago premium | Worth at 53.1 bu/ac | |
|---|---|---|---|---|---|---|---|
| Illinois (central processors) | 12.6185 | −22X to +10X | 12.1949 | +0.42 | +0.33 | $22.49 | ██████████ |
| Iowa (state) | 12.1575 | −55X to −35X | 11.9253 | +0.23 | +0.34 | $12.33 | █████░░░░░ |
| Indiana (state) | 12.3875 | −35X to −15X | 12.1446 | +0.24 | +0.21 | $12.90 | ██████░░░░ |
| Indiana, November delivery | 12.6250 | −5X to +5X | — | +0.24 over current | +0.06 | $12.61 | ██████░░░░ |
Basis: US No. 1 soybeans, delivered by truck (Indiana processors truck/rail); X = CBOT November 2026 soybeans, $12.6125. Source: USDA AMS Illinois Grain Bids [1], Iowa Daily Cash Grain Bids [18] and Indiana Grain Bids [19], Oct 16, 2026. Country averages are simple averages of each report's regional country-elevator averages (Illinois 7 regions, Iowa 6, Indiana 7), and year-ago premiums use each report's own year-ago columns. The last row compares Indiana processors' November bid with their current bid. Premiums and per-acre values use USDA's October national yield of 53.1 bu/acre [7]. Bars scaled to 42 cents. All calculations are Crop Root Zone's.
Interior basis is still where it hurts. The Iowa state average was $11.93, 68 under November [18]. TRZ-0283 traced that weakness to barge and rail costs and a late harvest, not to slow sales [20]. An Iowa processor at 45 under is the best bid in the state's report, but its 23-cent edge over the country average is the smallest of the three states, and smaller than a year ago, when the crush margin was less than two-thirds of today's. Iowa plants are not short enough to pay up while harvest beans are arriving.
Distance is the cost against that premium. This publication's haul arithmetic puts a marginal truck mile at 0.4 to 0.5 cents a bushel. Ten cents of basis covers 20 to 25 extra miles (TRZ-0256, Oct 5, 2026) [21]. On that basis, Iowa's and Indiana's 23 to 24 cents pays for roughly 45 to 60 extra miles. Illinois' 42 cents pays for roughly 85 to 105. Longer waits at the dump pit reduce both figures.
The Indiana November row is the most useful line in the three reports. Processors there pay 24 cents more for November delivery than for delivery now. A year ago the gap was 6 cents. The November futures do not change, so the extra 24 cents is all basis. A plant that pays more for beans in three weeks than for beans today is saying it has enough beans now and expects a shortfall after the harvest peak. That fits the September crush miss in Section 2. For a grower with bin space, holding three or four weeks for a November processor slot earns more than the 14½-cent futures spread from November to January on October 16 [1]. TRZ-0259 found the soybean carry covers only about three-quarters of operating-loan interest in every storage window (TRZ-0259, Oct 6, 2026) [22]. A short hold into a processor's November slot is the one storage trade on this page that clearly pays.
Ground Truth: For 2026 beans, crush economics favor a specific sequence. Price the flat price first: that is where this fall's margin has reached growers, with the bean up $1.14 since August against a product value that has not moved. Then sell the delivery slot rather than the harvest day. Our read is to book a processor slot for November or December delivery where one is quoted at a premium to current. In Indiana that is worth 24 cents, and Illinois processors already lead country elevators by 42. Truck harvest beans past the nearest elevator only when the processor premium exceeds the extra miles at half a cent a mile. Do not store unpriced beans waiting for the board crush to widen the processor's basis. While plants run at capacity, a wider margin goes to the processor. A grower who wants exposure to the crush should own it through the bean price, which is where it has been paid this fall.
References
- USDA AMS Livestock, Poultry and Grain Market News / Illinois Department of Agriculture Market News, Illinois Grain Bids, Oct 16, 2026 (final; CBOT settlements; soybean country-elevator, processor, terminal and barge bids with year-ago averages; Central Illinois average $12.29, −32X) — https://www.ams.usda.gov/mnreports/ams_3192.pdf
- USDA AMS Livestock, Poultry and Grain Market News, National Grain and Oilseed Processor Feedstuff Report, Oct 16, 2026 (soybean meal 46.5–48% and crude soybean oil by region, with basis to December futures) — https://www.ams.usda.gov/mnreports/ams_3511.pdf
- Argus Media, "US soybean crush margins slip below $3/bu," Jul 1, 2026 (Jun 30 margin $2.88; Jun 3 record $4.18; 2021–2025 average $1.51; Jun 30 oil, meal and soybean prices) — https://www.argusmedia.com/en/news-and-insights/latest-market-news/2846745-us-soybean-crush-margins-slip-below-3-bu
- Crop Root Zone, TRZ-0088, "The Crush Is Being Run for the Oil. The Meal Is 47% of the Revenue and All of the Risk.," Aug 12, 2026 (Aug 11 soybeans $11.4725, oil 72.76¢ opening quote, August meal $331.30).
- Brownfield Ag News, "Closing grain and livestock futures: October 21, 2025" (Nov 2025 soybeans $10.3075, Dec meal $286.90, Dec oil 50.65¢). Cited from search-engine result text; the page itself could not be reached — https://www.brownfieldagnews.com/market-news/closing-grain-and-livestock-futures-october-21-2025/
- Argus Media, "US soy crush margins soar, set to remain high," May 8, 2026 (May 5 margin $3.76; capacity up to 71 mn t/yr; March utilization 92%; limits on pass-through to soybean prices) — https://www.argusmedia.com/en/news-and-insights/latest-market-news/2824915-us-soy-crush-margins-soar-set-to-remain-high
- USDA World Agricultural Outlook Board, World Agricultural Supply and Demand Estimates, WASDE-676, Oct 9, 2026 (U.S. soybeans, soybean oil and soybean meal supply and use) — https://www.usda.gov/oce/commodity/wasde/wasde1026.pdf
- Walk-Squawk Market Talk, "Walk-Squawk Morning Wire," Oct 16, 2026 (NOPA September 2026 crush 196.3 mil bu vs 203.7 estimate; oil stocks 1.053 bil lb, down 148 mil; oil yield 11.72 lb/bu) — https://walksquawk.substack.com/p/walk-squawk-morning-wire-d0c
- DTN/Progressive Farmer, "Periodic Updates on the Grains, Livestock Futures Markets," Oct 15, 2026 (NOPA September crush 196.3 mil bu, "well below expectations") — https://www.dtnpf.com/agriculture/web/ag/news/article/2026/10/15/periodic-updates-grains-livestock
- DTN/Progressive Farmer, "USDA Weekly Crop Progress Report," Oct 13, 2026 (soybeans 46% harvested on Oct 11 vs 50% five-year average) — https://www.dtnpf.com/agriculture/web/ag/crops/article/2026/10/13/usda-crop-progress-corn-33-harvested
- Hubbs, T., and S. Irwin, "Rewriting the RFS Playbook: Final 2026-2027 RVOs for Biomass-Based Diesel," farmdoc daily (16):66, University of Illinois, Apr 16, 2026 — https://farmdocdaily.illinois.edu/2026/04/rewriting-the-rfs-playbook-final-2026-2027-rvos-for-biomass-based-diesel.html
- Latham & Watkins (Global Environmental Law & Regulation), "IRS Issues 45Z Tax Credit Notice and DOE Updates 45ZCF-GREET Model," Sep 17, 2026 (Notice 2026-53 of Sep 8, 2026; North American feedstock rule; credit through Dec 31, 2029; USDA FD-CIC integrated into September 2026 GREET; proposed regulations pending) — https://www.globalelr.com/2026/09/irs-issues-45z-tax-credit-notice-and-doe-updates-45zcf-greet-model/
- Fastmarkets, "Correction to biodiesel D4, D6 RIN assessments on October 13, 2026," Oct 16, 2026 (D4 B26 207.5–209 ¢/RIN) — https://www.fastmarkets.com/insights/correction-to-biodiesel-d4-d6-rin-assessments-on-october-13-2026/
- American Soybean Association (S. Gerlt, O. Karami), "A Look at Potential Soybean Farmer Premiums with 45Z," Aug 27, 2026 — https://soygrowers.com/news-releases/a-look-at-potential-soybean-farmer-premiums-with-45z/
- Fastmarkets, "The 45Z reckoning: what the finalization of US biofuel policy means for every feedstock in the supply chain," Jun 16, 2026 — https://www.fastmarkets.com/insights/the-45z-reckoning-what-the-finalization-of-us-biofuel-policy-means-for-every-feedstock-in-the-supply-chain/
- DTN/Progressive Farmer, "CHS Plans $700M Wis. Soybean Crush Plant to Expand Processing Capacity by 60%," Sep 14, 2026 — https://www.dtnpf.com/agriculture/web/ag/news/business-inputs/article/2026/09/14/chs-plans-700m-wis-soybean-crush-60
- Perkins, J., "Soybean Crush Expansion Accelerates Across U.S.," Processing Journal, Sep 15, 2026 (Incobrasa Gilman second plant; ADM four-plant expansion; Bunge Morristown) — https://www.processingjournal.com/article/1155458/soybean-crush-expansion-accelerates-across-u-s
- USDA AMS Livestock, Poultry and Grain Market News / Iowa Department of Agriculture, Iowa Daily Cash Grain Bids, Oct 16, 2026 (final; state average soybeans $11.93, −68X; processor −55X to −35X) — https://www.ams.usda.gov/mnreports/ams_2850.pdf
- USDA AMS Livestock, Poultry and Grain Market News, Indiana Grain Bids, Oct 16, 2026 (processor current and November soybean bids with year-ago averages) — https://www.ams.usda.gov/mnreports/ams_3463.pdf
- Crop Root Zone, TRZ-0283, "USDA's Soybean Export Number Needs 23.3 Million More Tons…," Oct 15, 2026.
- Crop Root Zone, TRZ-0256, "An Extra Mile to a Better Bid Costs 0.4 to 0.5 Cents a Bushel at $6.53 Diesel…," Oct 5, 2026.
- Crop Root Zone, TRZ-0259, "The Board Pays 36¾ Cents to Carry Soybeans to May…," Oct 6, 2026.
- Bukowski, M., and B. Swearingen, Oil Crops Outlook: September 2026, OCS-26i, USDA Economic Research Service, Sep 15, 2026 (2026/27 meal price raised $30 to $340/st; soybean oil biofuel use 17.8 bil lb) — https://ers.usda.gov/media/29635/ocs-26i.pdf
Disclosures
Crop Root Zone is an independent publication. Nothing here is investment advice. Market calls, where included, reflect the editors' own read and are not a recommendation to buy or sell any security.
Kansas Sorghum Is Bid at 86% of Corn With 1.2% of USDA's Export Number Sold. Dryland Western Kansas Needs 83% to 92% for Sorghum to Out-Earn Corn in 2027.
On October 15 Kansas country elevators bid sorghum at an average 85.9% of corn, up from 79.9% a year earlier, because the U.S. crop is a third smaller and not because of exports. The 2026/27 export book held 1.9 million bushels on October 1 against USDA's 160 million, and U.S. sorghum delivered to south China costs $49 a ton more than Australian and $95 more than Argentine at the 12% tariff. Repriced to harvest bids, K-State's 2026 dryland budgets put the sorghum-versus-corn break-even ratio at about 91% in northwest Kansas and 83% in southwest Kansas. The northwest now favors corn at middle yields, the southwest is a tie, and sorghum loses less in a short-crop year in both.
Kansas country elevators bid US No. 2 grain sorghum between $3.93 and $4.23 a bushel on Thursday, October 15. That is 55 to 85 cents under December corn futures, which settled at $4.78 (USDA AMS, Kansas Daily Grain Bids, Oct 15, 2026) [1]. The same elevators averaged $4.72 for corn. Sorghum is therefore bringing 85.9% of the corn price, against 79.9% on the same date a year ago. In the Texas Panhandle the ratio is unchanged at 78% to 82%, but South Plains feedyards are paying 87.6% of their corn bid for sorghum, against 79.5% a year ago (USDA AMS, Texas Daily Grain Bids, Oct 15, 2026) [2].
A better ratio would usually point to export demand. This year it does not. USDA's October balance sheet has 2026/27 exports at 160 million bushels, more than half of total use (USDA WASDE-676, Oct 9, 2026) [3]. On October 1, exporters had sold 1.9 million bushels (USDA FAS via Brownfield Ag News, Oct 8, 2026) [4]. The ratio rests on a short crop and domestic feed buyers, and the export forecast has not yet been tested. For a dryland Plains grower choosing between sorghum and corn for 2027, that combination matters more than the headline percentage.
1. The harvest ratio is six points better than a year ago
What's new: Kansas sorghum bids rose about 93 cents a bushel from a year earlier, against 81 cents for corn. The narrowing was widest where the ratio had been weakest. In central Kansas, sorghum went from 81 cents under the local corn bid to 50 cents under [1].
Evidence: Each region in the AMS reports quotes sorghum as a basis against December corn futures. The ratio below divides each region's average sorghum bid by its average corn bid on the same day.
| Region (Oct 15, 2026) | Sorghum basis | Sorghum $/bu | Corn $/bu | Ratio | Year-ago ratio | Change (pts) |
|---|---|---|---|---|---|---|
| KS northwest, country | −65Z | 4.130 | 4.655 | 88.7% | 81.4% | +7.3 |
| KS southwest, country | −75Z to −65Z | 4.118 | 4.936 | 83.4% | 79.5% | +3.9 |
| KS west, country | −85Z to −55Z | 4.118 | 4.705 | 87.5% | 81.7% | +5.8 |
| KS central, country | −85Z | 3.930 | 4.430 | 88.7% | 78.2% | +10.5 |
| KS southwest, feedyard | −45Z | 4.330 | — | — | — | — |
| KS country average (5 regions) | 4.055 | 4.721 | 85.9% | 79.9% | +6.0 | |
| TX North Panhandle, country | −90Z to −20Z | 4.163 | 5.338 | 78.0% | 76.5% | +1.5 |
| TX Central Panhandle, country | −65Z to −30Z | 4.305 | 5.280 | 81.5% | 81.8% | −0.3 |
| TX South Panhandle, country | −35Z to −20Z | 4.505 | 5.505 | 81.8% | 82.7% | −0.9 |
| TX South Plains, feedyard | +45Z to +60Z | 5.305 | 6.055 | 87.6% | 79.5% | +8.1 |
Basis: current delivery, delivered to elevator or feedyard by truck; Z = CBOT December 2026 corn, $4.78. Kansas figures are US No. 2 grain; Texas are US No. 1. Source: USDA AMS / Kansas Dept. of Agriculture, Kansas Daily Grain Bids, Oct 15, 2026 [1]; USDA AMS / Texas Dept. of Agriculture, Texas Daily Grain Bids, Oct 15, 2026 [2]. Year-ago values are each report's own "year ago" column. Ratios, averages and changes are Crop Root Zone calculations. The Kansas south country region (81.6%, against 78.6%) is left out of the table but included in the average.
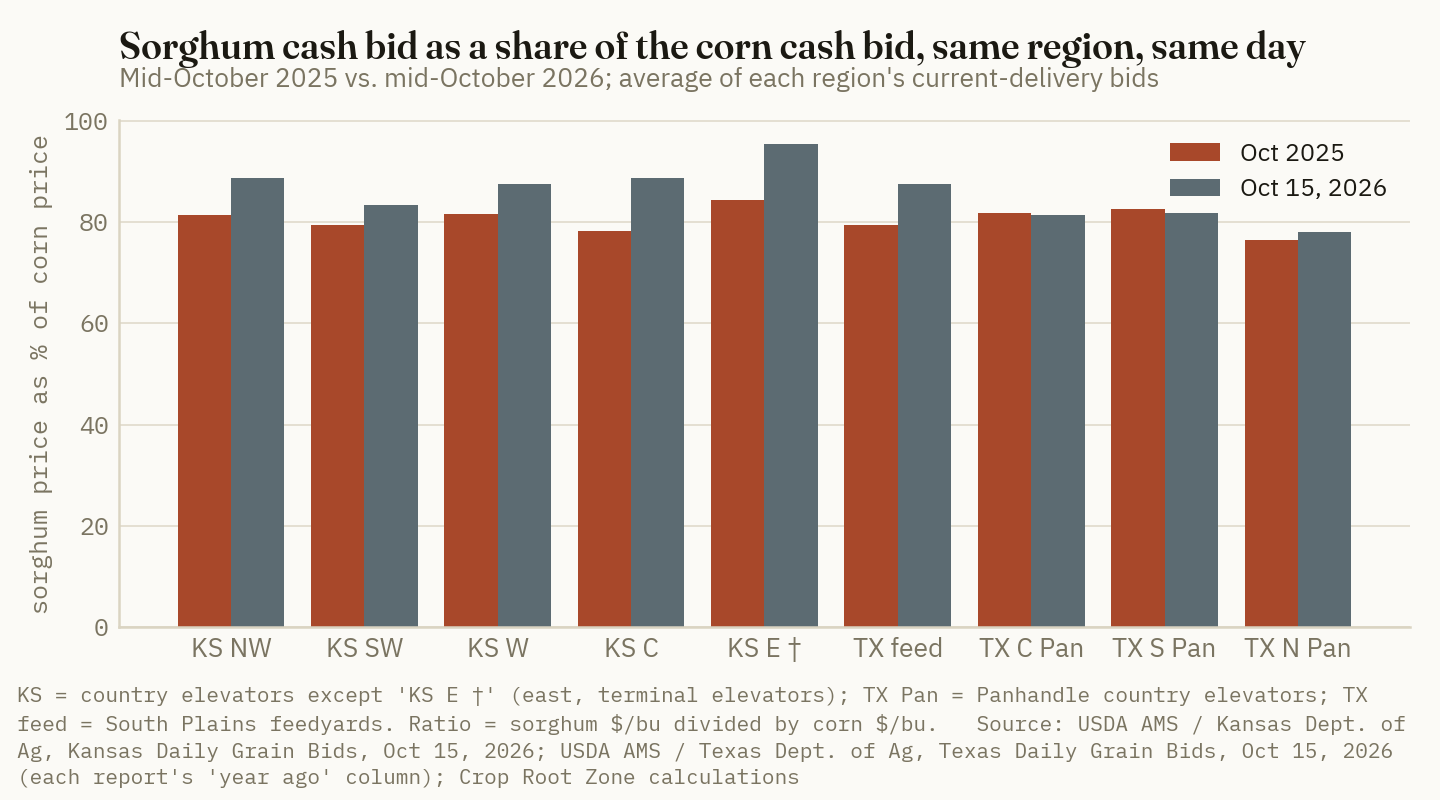
The pattern points to the source of the strength. Ratios improved most where sorghum competes with corn in a feed ration: at Kansas terminals in the east (95.4%), at central Kansas elevators, and at South Plains feedyards. They were flat at Panhandle country elevators, where sorghum is mostly priced for rail shipment to the Gulf. Domestic feed buyers lifted the ratio. The export trade did not.
Supply explains much of the rest. USDA puts the 2026 crop at 291 million bushels from 5.2 million harvested acres at 55.7 bushels an acre, against 437 million at 72.6 a year earlier [3]. In Kansas, 40% of the crop was rated poor or very poor on October 11 and 24% good or excellent. Only 23% had been harvested, against a 40% average (USDA NASS, Kansas Crop Progress and Condition, Oct 13, 2026) [5]. A small, late crop has not yet put much grain into the elevators, and that has supported harvest basis.
2. The export book: 1.9 million bushels against 160 million
What's new: Net 2026/27 sorghum sales were 2,500 tons in the week ended October 1. Japan bought 2,900 tons and Mexico 1,600 tons, while unknown destinations cancelled 2,800 tons. Total commitments, shipped and unshipped, reached 1.9 million bushels, against 25.5 million a year earlier [4]. Three weeks before, the book was 1.6 million bushels against 14.1 million, and China had cancelled 2,000 tons (USDA FAS via Brownfield Ag News, Sep 17, 2026) [6].
Evidence: Brownfield reports this number as "exports," but it is the FAS commitments figure. Its corn total for the same week, 769.4 million bushels, matches the 19.54 million tons of corn commitments in USDA's tables (TRZ-0283, Oct 15, 2026) [19]. Physical shipments are just as thin. Inspections for export from September 1 to October 8 were 10,959 tons, against 121,216 a year earlier. None was inspected at a Gulf or Texas port in the latest week (USDA AMS, Grain Inspected for Export, Oct 13, 2026) [8].
| 2026/27 U.S. sorghum, early October | Million bu | |
|---|---|---|
| USDA October export forecast | 160.0 | ██████████ |
| Business needed after October 1 | 158.1* | ██████████ |
| Year-ago commitments, same week | 25.5 | ██░░░░░░░░ |
| 2026/27 commitments, Oct 1 | 1.9 | ░░░░░░░░░░ |
| Inspected for export, Sep 1–Oct 8 | 0.4* | ░░░░░░░░░░ |
Source: USDA WASDE-676, Oct 9, 2026 [3]; USDA FAS export sales via Brownfield Ag News, Oct 8, 2026 [4]; USDA AMS, Grain Inspected for Export, Oct 13, 2026 [8]. *Crop Root Zone calculations: 160.0 − 1.9; inspections converted from 10,959 metric tons at 39.368 bu/MT. Bars scaled to 160 million bushels.
1.2%
Share of USDA's 160-million-bushel 2026/27 sorghum export forecast sold by October 1. To reach the forecast, exporters must sell about 3.3 million bushels (83,700 tons) a week for 48 weeks, against 2,500 tons in the latest week. (Crop Root Zone calculation from USDA FAS via Brownfield Ag News, Oct 8, 2026, and USDA WASDE-676, Oct 9, 2026)
A slow start is not by itself a reason to doubt the forecast. The year-ago book was also small, at 25.5 million bushels, because China was still under its higher tariff until November 2025 (TRZ-0032, Jul 24, 2026) [16]. USDA now estimates that year finished at 206 million bushels [3]. By late August, 2025/26 commitments stood at 200.6 million bushels, against 70.3 million a year before, and China was still taking 92,200 tons in the final weeks (Brownfield Ag News, Sep 3, 2026) [7]. In 2025/26, roughly 180 million bushels of business came after early October (our approximation: final exports less early-October commitments). USDA's 2026/27 forecast needs 158 million. On the arithmetic, a repeat of last winter's China buying would fill the forecast. The question is whether the conditions behind that buying still hold.
3. Why China has not returned: a price gap, not a quota
What's new: USDA's Beijing post cut its 2026/27 forecast of Chinese sorghum imports to 7.0 million tons. USDA's official number is 6.3 million, down from 7.5 million in 2025/26. In the post's view, Brazilian sorghum and DDGS and Argentine corn are increasing competition for U.S. exporters (USDA FAS GAIN CH2026-0124, Oct 1, 2026) [9].
Evidence: The post's port price survey shows the change. In early June, U.S. sorghum under the 2% tariff (with an exclusion) was the cheapest imported sorghum in south China. By early September it was the most expensive at either tariff rate.
| Delivered south China, $/MT | July delivery (Jun survey) | October delivery (Sep survey) | Change |
|---|---|---|---|
| U.S. sorghum, 12% tariff | 355 | 422 | +67 |
| U.S. sorghum, 2% tariff (exclusion) | 324 | 385 | +61 |
| Australian sorghum | 375 | 373 | −2 |
| Argentine sorghum | 335 | 327 | −8 |
| Local corn, Guangdong spot | — | 360 | — |
| Brazilian corn, within quota | — | 332 | — |
Basis: port-delivered prices from industry sources, converted at RMB 6.8 per US$. Source: USDA FAS GAIN CH2026-0085, Jul 3, 2026 [10]; USDA FAS GAIN CH2026-0124, Oct 1, 2026 [9]. Changes are Crop Root Zone calculations. The July report does not list local corn or Brazilian corn on the same basis.
At the 12% tariff, U.S. sorghum costs $49 a ton more than Australian, $95 more than Argentine and $62 more than local corn. The post reports Brazilian August offers at $300 to $310 a ton, against $391 for U.S. sorghum landed with the 12% tariff. It also notes that Brazil has scheduled China-bound cargoes of 210,000, 330,000 and 200,000 tons for September, October and November [9]. Mid-September stocks of sorghum at major Chinese ports were 1.87 million tons, a record [9]. That inventory has to clear before importers book much more.
The upside case is a tariff change. On September 27 the White House listed sorghum, with corn and wheat, among U.S. products the two countries will consider for reduced tariffs under their Board of Trade [9]. The table shows the limit of that case: at the 2% rate, U.S. sorghum would still be $12 a ton above Australian and $58 above Argentine. A tariff cut would put U.S. sorghum back in contention. It would not by itself make it the cheapest feed grain in south China, as it was in June.
The costs from the farm to the port are also higher. BNSF's shuttle tariff from Garden City, Kansas, to the Texas Gulf, including fuel surcharge, is $46.62 a ton in October, 9.5% more than a year earlier. The quoted rate is for wheat, but sorghum moves on the same route (USDA AMS, Grain Transportation Report, Oct 15, 2026) [11].
If exports fall short, the balance sheet absorbs it quickly, because 2026/27 is a small crop with a large export share:
| 2026/27 U.S. sorghum scenario | Exports (mil bu) | Ending stocks (mil bu) | Stocks-to-use |
|---|---|---|---|
| USDA, October | 160 | 26 | 8.7% |
| Exports 40 million short | 120* | 66* | 25.4%* |
| Exports at half of USDA | 80* | 106* | 48.2%* |
| For reference: 2025/26 estimate | 206 | 35 | 7.9% |
| For reference: 2024/25 | 98 | 40 | 11.9% |
Source: USDA WASDE-676, Oct 9, 2026 (2026/27 supply 326; domestic use 140; 2026/27 season-average price $4.50, down from $4.60 in September) [3]. *Crop Root Zone scenarios that change exports only and hold domestic use fixed. In practice a price discount would move some of the surplus into feed, so these overstate the stocks build. They show the direction and the scale.
USDA's $4.50 season-average sorghum price is 95.7% of its $4.70 corn price [3]. Kansas country bids are 44.5 cents under USDA's sorghum number, while the Kansas corn average, at $4.72, is close to USDA's corn price [1][3]. The futures-linked part of the market has priced corn to USDA. It has not priced sorghum to USDA's export forecast.
Ground Truth: The 2026 ratio is a short-crop ratio, and it is likely to fade once the slow Kansas harvest reaches the elevators and the 2027 crop is planted. A short crop supports the ratio for one season. A recovery in exports would support it for longer, and so far there is none. The only catalyst large enough to move it is the Board of Trade tariff decision, and even a full cut leaves U.S. sorghum priced above Australian and Argentine grain in south China. We expect USDA to reduce the 160-million-bushel export forecast by the January report unless China books U.S. sorghum in November and December as it did in 2025. If that happens, the ratio is more likely to fall back toward last year's 80% than to reach USDA's 96%.
4. The 2027 dryland acre: break-even ratios of 91% and 83%
What's new: Kansas State University's 2026 budgets for dryland wheat-corn-fallow and wheat-sorghum-fallow rotations were written in November 2025. They assume a sorghum price of 98.9% of corn in northwest Kansas and 93.0% in southwest Kansas (Kansas State University, 2026 Cost-Return Budgets, Nov 1, 2025) [12]–[15]. Harvest bids are now 88.7% and 83.4% [1]. Anyone using the published budgets as written overstates the sorghum acre.
Evidence: We held K-State's costs and yields as published and changed only the prices, to October 15 cash and to a 2027 harvest estimate. The 2027 estimate is December 2027 corn futures at $5.0925 [1] plus this week's regional basis for each crop.
| Dryland western Kansas, $/acre | NW corn | NW sorghum | SW corn | SW sorghum |
|---|---|---|---|---|
| Budget yield, bu/acre | 89 | 85 | 82 | 85 |
| Direct costs | 270.36 | 221.30 | 274.01 | 220.77 |
| — of which seed | 51.20 | 10.50 | 51.20 | 10.50 |
| — of which fertilizer | 68.96 | 67.33 | 63.17 | 67.20 |
| Total costs (incl. rent, capital recovery) | 400.66 | 347.36 | 381.81 | 324.33 |
| Return over total cost at K-State budget price | 22.09 | 52.14 | 6.05 | 49.67 |
| Return at Oct 15, 2026 cash bid | 13.63 | 3.69 | 22.97 | 25.66 |
| Return at 2027 estimate | 41.45* | 30.25* | 48.59* | 52.22* |
| Return at low yield, Oct 15 cash | −64.18† | −27.75† | −15.35† | −6.19† |
| Break-even sorghum/corn ratio, Oct 15 cash | 91.2% | 82.8% | ||
| Break-even ratio, 2027 estimate | 92.1%* | 83.6%* |
Source: Kansas State University, 2026 Corn (W-C-F) and Grain Sorghum (W-S-F) Cost-Return Budgets, Northwest and Southwest Kansas, Nov 1, 2025 [12]–[15], via AgManager.info [18]; USDA AMS Kansas Daily Grain Bids, Oct 15, 2026 [1]. Cash prices are the regional country-elevator averages in Section 1. *Estimate: 2027 prices are December 2027 corn ($5.0925) plus Oct 15 regional basis, corn $4.968 and sorghum $4.443 in the northwest and corn $5.249 and sorghum $4.430 in the southwest. †Low yields are K-State's: corn 65 bu (NW) and 71 bu (SW), sorghum 75 bu. Low-yield costs are back-solved from K-State's sensitivity tables, which are rounded to the dollar, so these are estimates within about ±$1. The break-even ratio is the sorghum price, as a share of the corn price, at which both crops return the same over total cost at middle yields.
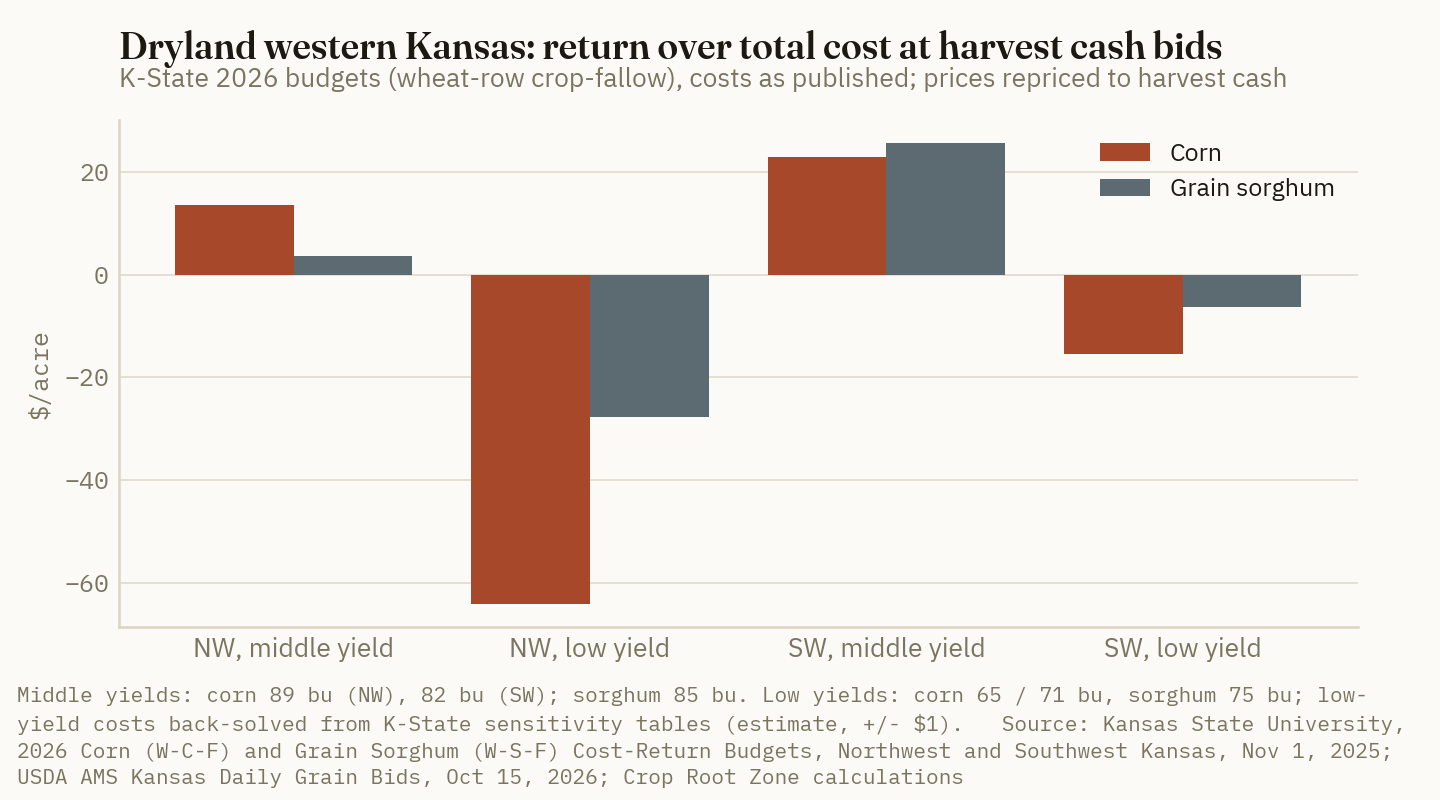
The break-even ratio differs between the two regions because K-State's budgets assume different yields. In the northwest, K-State expects dryland corn to out-yield sorghum, 89 bushels against 85. Sorghum needs a price within about 9% of corn to make up the yield and the $53 cost difference. In the southwest, sorghum is budgeted to out-yield corn, 85 against 82, so it can afford a discount of about 17%. On today's bids, corn leads by about $10 an acre in the northwest and sorghum by about $3 in the southwest. Each point on the ratio is worth about $4.20 to $4.50 an acre at 2027 estimated prices (our arithmetic).
Two details in the budgets strengthen this conclusion. First, fertilizer is close to equal across the two crops: $63 to $69 an acre, with 63 to 68 pounds of nitrogen for corn and 65 for sorghum [12]–[15]. A change in fertilizer prices this winter therefore shifts both budgets by about the same amount and barely moves the break-even ratio. Almost all of sorghum's cost advantage is in seed, $40.70 an acre, and herbicide. Second, sorghum's real advantage is in the low-yield row. At harvest bids, a short crop costs the sorghum grower $36 an acre less than the corn grower in the northwest and $9 less in the southwest. The middle-yield comparison leaves this out.
These conclusions update this publication's earlier sorghum work rather than contradicting it. TRZ-0032 used a historical ratio of about 87% [16]. The northwest break-even of 91% sits above that, which is consistent with its point that sorghum earns its place on water-limited ground through yield stability, not through price. TRZ-0239 priced Texas Panhandle sorghum at $4.90, on December 2027 corn at $5.25 less 35 cents on September 28 (TRZ-0239, Sep 29, 2026) [17]. December 2027 has since fallen 16 cents to $5.0925 [1]. The same method now gives about $4.74, which would move TRZ-0239's dryland sorghum return over variable cost from $12.65 to about $7.50 an acre (our estimate). Its conclusion, that cotton ranks first on High Plains dryland, is unchanged.
Ground Truth: For 2027 the decision on dryland western Kansas depends on probability, not on a budget line. At middle yields, corn wins in the northwest unless the ratio recovers above 91%. Section 3 argues that is unlikely without a China tariff cut. In the southwest the two crops are within a few dollars of each other on harvest bids. But a grower does not plant for the middle yield. A field with a record of short corn crops, or with subsoil moisture rated short this fall (35% of Kansas was short or very short on October 11 [5]), should be valued on the low-yield row, and there sorghum leads in both regions. Our read for the northwest is to plan the flex acres to corn only where the field's own yield history supports K-State's 89 bushels, and to put the rest in sorghum, accepting about $10 an acre less in a normal year in exchange for about $36 an acre less loss in a poor one. For the southwest, plan sorghum and switch to corn only if the new-crop ratio falls below about 83% by planting.
5. Marketing the 2026 crop in hand
What's new: The corn futures curve, against which Kansas and Texas sorghum is priced, is in carry. On October 15 March 2027 settled at $4.91, May at $4.98 and July at $5.035, against $4.78 for December 2026 [1]. In southwest Kansas, the feedyard bid for sorghum was 45 under December, 20 to 30 cents better than the region's country elevators [1].
Evidence:
| Southwest Kansas sorghum, Oct 15, 2026 | $/bu | vs. country average |
|---|---|---|
| Country elevator average (−75Z to −65Z) | 4.118 | — |
| Feedyard bid (−45Z) | 4.330 | +0.21 |
| Futures carry, December to May | +0.20 | — |
| Interest to mid-May at 7%, on $4.12 | −0.17* | — |
| Garden City–Texas Gulf rail tariff, wheat, $/MT | 46.62 | +9.5% y/y |
Source: USDA AMS Kansas Daily Grain Bids, Oct 15, 2026 [1]; USDA AMS Grain Transportation Report, Oct 15, 2026 [11]. *Crop Root Zone estimate: simple interest for seven months, before shrink, handling or storage charges.
The arithmetic for stored sorghum is thin. Futures carry to May covers interest and little else. Storage pays only if the sorghum basis narrows from 65 to 75 under toward the 45-under feedyard level, and that depends on export demand, the part of the market Sections 2 and 3 found missing. If a tariff cut brings China back in November and December, as happened in 2025, export basis would improve during the winter. If it does not, the basis will reflect harvest deliveries that are still behind schedule, with 77% of the Kansas crop not yet cut [5], and an export forecast that is likely to be reduced.
Ground Truth: In southwest Kansas the feedyard bid is 21 cents over the country average now, which is more than the futures carry nets after interest. Unpriced storage is a bet on the export market alone. Our read is to sell harvest sorghum into feed demand where trucking range allows. Store only what can be held without a price commitment until China's tariff decision, and price that against May futures rather than December, so the carry is captured. The two numbers to watch are weekly net sales to China in the FAS report, which were a 2,000-ton cancellation in the week ended September 10 and absent from the week ended October 1 [4][6], and the Kansas country ratio. If the ratio falls back below 83% as the harvest catches up, the domestic support has run out.
References
- USDA AMS Livestock, Poultry and Grain Market News / Kansas Department of Agriculture Market News, Kansas Daily Grain Bids, Oct 15, 2026 (final; US No. 2 sorghum and corn bids by region with year-ago averages; CBOT futures settlements incl. Dec 2026, Mar, May, Jul and Dec 2027 corn) — https://www.ams.usda.gov/mnreports/ams_2886.pdf
- USDA AMS Livestock, Poultry and Grain Market News / Texas Department of Agriculture Market News, Texas Daily Grain Bids, Oct 15, 2026 (final; Panhandle elevator and South Plains feedyard sorghum and corn bids with year-ago averages) — https://www.ams.usda.gov/mnreports/ams_2711.pdf
- USDA World Agricultural Outlook Board, World Agricultural Supply and Demand Estimates, WASDE-676, Oct 9, 2026 (U.S. sorghum and corn supply and use, 2024/25 through 2026/27) — https://www.usda.gov/oce/commodity/wasde/wasde1026.pdf
- Brownfield Ag News, "Mexico continues to drive U.S. corn export sales," Oct 8, 2026 (USDA FAS export sales, week ended Oct 1, 2026: sorghum and corn) — https://www.brownfieldagnews.com/news/mexico-continues-to-drive-u-s-corn-export-sales/
- USDA National Agricultural Statistics Service, Northern Plains Region, Kansas Crop Progress and Condition, week ending Oct 11, 2026, released Oct 13, 2026 — https://www.nass.usda.gov/statistics_by_State/Kansas/Publications/Crop_Progress_and_Condition/current-ks.pdf
- Brownfield Ag News, "Beef, pork export sales rise, while corn, soybeans fall," Sep 17, 2026 (USDA FAS export sales, week ended Sep 10, 2026) — https://www.brownfieldagnews.com/news/beef-pork-export-sales-rise-while-corn-soybeans-fall/
- Brownfield Ag News, "Feed demand fuels 26/27 corn, soybean meal export sales," Sep 3, 2026 (USDA FAS export sales, week ended Aug 27, 2026; 2025/26 sorghum) — https://www.brownfieldagnews.com/news/feed-demand-fuels-26-27-corn-soybean-meal-export-sales/
- USDA AMS Market News, Grain Inspected and/or Weighed for Export (WA_GR101), Oct 13, 2026 (week ending Oct 8, 2026) — https://www.ams.usda.gov/mnreports/wa_gr101.txt
- USDA Foreign Agricultural Service, GAIN Report CH2026-0124, China: Grain and Feed Update, Oct 1, 2026 (sorghum imports, Brazilian shipments, port stocks, port-delivered prices, Board of Trade product list) — https://www.fas.usda.gov/data/gain/2026/10/china-grain-and-feed-update
- USDA Foreign Agricultural Service, GAIN Report CH2026-0085, China: Grain and Feed Update, Jul 3, 2026 (port-delivered prices for July delivery) — https://apps.fas.usda.gov/newgainapi/api/Report/DownloadReportByFileName?fileName=Grain+and+Feed+Update_Beijing_China+-+People%27s+Republic+of_CH2026-0085.pdf
- USDA AMS, Grain Transportation Report, Oct 15, 2026 (Table 6, rail tariff rates for October 2026) — https://www.ams.usda.gov/sites/default/files/media/GTR10152026.pdf
- Kansas State University Department of Agricultural Economics (G. Ibendahl, D. O'Brien, S. Lancaster, J. Holman, L. Haag), 2026 Corn Cost-Return Budget (W-C-F Rotation) in Northwest Kansas, Nov 1, 2025 — https://agmanager.info/sites/default/files/wysiwyg/Corn%20Cost-Return%20Budget%20%28W-C-F%20Rotation%29%20in%20Northwest%20Kansas__Nov-01-2025.pdf
- Kansas State University, 2026 Grain Sorghum (W-S-F Rotation) Cost-Return Budget in Northwest Kansas, Nov 1, 2025 — https://agmanager.info/sites/default/files/wysiwyg/Grain%20Sorghum%20%28W-S-F%20Rotation%29%20Cost-Return%20Budget%20in%20Northwest%20Kansas__Nov-01-2025.pdf
- Kansas State University, 2026 Corn Cost-Return Budget (W-C-F Rotation) in Southwest Kansas, Nov 1, 2025 — https://agmanager.info/sites/default/files/wysiwyg/Corn%20Cost-Return%20Budget%20%28W-C-F%20Rotation%29%20in%20Southwest%20Kansas__Nov-01-2025.pdf
- Kansas State University, 2026 Grain Sorghum (W-S-F Rotation) Cost-Return Budget in Southwest Kansas, Nov 1, 2025 — https://agmanager.info/sites/default/files/wysiwyg/Grain%20Sorghum%20%28W-S-F%20Rotation%29%20Cost-Return%20Budget%20in%20Southwest%20Kansas__Nov-01-2025.pdf
- Crop Root Zone, TRZ-0032, "Sorghum's Low-Input Case Is Real — but It's a Dryland Case, Not a Corn Belt One," Jul 24, 2026.
- Crop Root Zone, TRZ-0239, "A Dryland High Plains Cotton Acre Needs 446 Pounds at 2027 Prices. It Still Beats Sorghum and Wheat on the Same Ground.," Sep 29, 2026.
- AgManager.info, Kansas State University, 2026 Farm Management Guides for Non-Irrigated Crops (index of 2026 budgets) — https://www.agmanager.info/farm-budgets/2026-farm-management-guides-non-irrigated-crops
- Crop Root Zone, TRZ-0283, "USDA's Soybean Export Number Needs 23.3 Million More Tons…," Oct 15, 2026 (corn commitments of 19,543 thousand MT for the week ended Oct 1, 2026, from USDA FAS via USDA AMS Grain Transportation Report, Oct 8, 2026).
Disclosures
Crop Root Zone is an independent publication. Nothing here is investment advice. Market calls, where included, reflect the editors' own read and are not a recommendation to buy or sell any security.
USDA's Soybean Export Number Needs 23.3 Million More Tons. None of the Last Five Years Wrote Less Than 26.4 After Early October. Iowa Beans Are Still Bid 68 Cents Under November.
2026/27 soybean commitments reached 22.79 million tons on October 1, 49% of USDA's raised 1.695-billion-bushel October forecast and tied with 2022/23 for the fastest start in six years. China holds 49% of the book; without China it is 8% smaller than a year ago. The tonnage still to be sold is the smallest requirement of any recent year, so the export risk sits above USDA's number. The pace has not reached the farm: Iowa's average soybean basis widened 9 cents in four weeks, and Iowa processors went from about 30 over November to about 46 under as harvest arrived.
U.S. exporters had sold 22.79 million metric tons of 2026/27 soybeans by October 1, counting both shipped and unshipped sales (USDA FAS via USDA AMS Grain Transportation Report, Oct 8, 2026) [1]. The next day, USDA's October WASDE raised its export forecast 10 million bushels to 1.695 billion bushels, or 46.13 million tons (USDA WASDE-676, Oct 9, 2026) [10]. The book is therefore 49.4% of the full-year number. That ties 2022/23 as the fastest early-October start in six years and is 80% larger than a year ago [1]. China accounts for 11.14 million tons of it.
When this publication last examined the book, on September 21, it was 45% full and the conclusion was that the strength had gone into freight rather than the farm-gate bid (TRZ-0215, Sep 21, 2026) [18]. Three more weeks of data allow a sharper test. Set against what was sold after October 1 in each of the last five years, USDA's remaining requirement is small, and the export risk now sits above USDA's number, not below it. The cash market has not reflected that. Iowa soybean basis is wider than it was four weeks ago.
1. The book: 49% of USDA's number, tied for the fastest start in six years
What's new: Net 2026/27 soybean sales were 549,000 tons in the week ended October 1, down 47% from the week before and near the low end of trade expectations (USDA FAS via USDA AMS GTR, Oct 8, 2026; The Western Producer, Oct 8, 2026) [1][23]. Total commitments rose to 22.79 million tons, of which 18.85 million, or 83%, was still unshipped [1].
Evidence: Weekly sales have slowed since the August surge. They are still running well ahead of the pace USDA needs.
| Week ended (2026) | Net new-crop sales (1,000 MT) | Total commitments (1,000 MT) | China (1,000 MT) | Book as % of Oct. forecast | Year-ago total (1,000 MT) |
|---|---|---|---|---|---|
| Aug 20 | 2,478 | 14,334 | 6,789 | 31.1% | — |
| Aug 27 | 1,948 | 16,282 | 7,761 | 35.3% | — |
| Sep 10 | 1,702 | 20,631 | 9,858 | 44.7% | 10,208 |
| Sep 17 | 582 | 21,202 | 10,170 | 46.0% | 10,933 |
| Sep 24 | 1,034 | 22,236 | 10,759 | 48.2% | 11,745 |
| Oct 1 | 549 | 22,785 | 11,142 | 49.4% | 12,664 |
Basis: 2026/27 marketing year (Sep 1–Aug 31); before September 1 the figures are new-crop sales. Source: USDA FAS weekly export sales as tabulated in USDA AMS Grain Transportation Report, Aug 27, Sep 3, Sep 17, Sep 24, Oct 1 and Oct 8, 2026 [1]–[5]. Percentages use the October WASDE forecast of 46.13 million MT [10] for every week and are Crop Root Zone calculations. The week ended Sep 3 is omitted because we did not read that edition's table. Year-ago totals are as currently reported by FAS.
The four weeks to October 1 averaged 967,000 tons a week. The latest three averaged 722,000. To reach USDA's 46.13 million tons, exporters need 23.35 million more over the 48 weeks left, or about 486,000 tons a week (our arithmetic). The pace is ahead of that, though a fall pace always is. The useful comparison is with earlier years at the same point, measured against the October forecast USDA published in each of them.
| Marketing year | Week ended | Commitments (1,000 MT) | Million bu | USDA Oct. forecast (mil bu) | Book as % of Oct. forecast | China share of book | Final or latest (mil bu) | Finish vs Oct. forecast |
|---|---|---|---|---|---|---|---|---|
| 2021/22 | Sep 30, 2021 | 25,328 | 931 | 2,092* | 44.5% | 49.1% | 2,152 | +60 (+2.9%) |
| 2022/23 | Sep 29, 2022 | 27,508 | 1,011 | 2,047* | 49.4% | 51.0% | 1,980 | −67 (−3.3%) |
| 2023/24 | Sep 28, 2023 | 18,560 | 682 | 1,755 | 38.9% | 43.4% | 1,700 | −55 (−3.1%) |
| 2024/25 | Oct 3, 2024 | 20,138 | 740 | 1,850 | 40.0% | 40.3% | 1,892 | +42 (+2.3%) |
| 2025/26 | Oct 2, 2025 | 12,664 | 465 | 1,685** | 27.6% | 0.0% | 1,515 | −170 (−10.1%) |
| 2026/27 | Oct 1, 2026 | 22,785 | 837 | 1,695 | 49.4% | 48.9% | — | — |
Source: commitments and China from USDA FAS via USDA AMS GTR, Oct 14, 2021; Oct 13, 2022; Oct 12, 2023; Oct 17, 2024; Oct 8, 2026 (2025/26 from the year-ago column) [1][6]–[9]. October forecasts: GTR Oct 14, 2021 and Oct 13, 2022 (*converted from the 56.95 and 55.72 million MT the GTR carries, rounded) [8][9]; USDA ERS Oil Crops Outlook, Oct 2023 [14]; GTR Oct 17, 2024 [6]; WASDE-676 [10]. **No October WASDE was issued in 2025 because of the federal shutdown (farmdoc, Nov 3, 2025) [15]; the September 2025 forecast is shown [13]. Final or latest estimates: WASDE Sep 2023, Sep 2024 and Oct 9, 2026 [10]–[12]. Bushel conversions (36.7437 bu per MT), percentages and differences are Crop Root Zone calculations.
Two things stand out. The share of the forecast booked by early October did not predict the finish. The fastest start, 2022/23, ended 3% below USDA's October number, and 2024/25, with a middling start, ended above it. And 2026/27 resembles 2022/23 closely, in the size of the book and in China's half-share of it. That year Brazil took the spring market, and it is the main argument for caution about this year's book.
2. China's half, and a smaller other half
What's new: China bought 383,000 tons in the week ended October 1, taking its 2026/27 commitments to 11.14 million tons. A year ago at this point it had bought none (USDA FAS via USDA AMS GTR, Oct 8, 2026) [1]. On September 9, USDA Under Secretary Luke Lindberg said China was "on track right now" to meet its 25-million-ton target for 2026 (The Star, Sep 11, 2026) [20]. The White House described the pledge in November 2025 as at least 25 million tons in each of 2026, 2027 and 2028, which are calendar years, not marketing years (The White House, Nov 2025) [21].
Evidence: China's book is 24% of USDA's full-year U.S. export forecast and 9.7% of the 115 million tons USDA expects China to import in 2026/27 [10]. Brazil, the alternative supplier, is projected to export a record 118.0 million tons [10]. The rest of the book is weaker than it looks:
| Buyer, week ended Oct 1 | 2026/27 commitments (1,000 MT) | Year ago (1,000 MT) | Change | |
|---|---|---|---|---|
| China | 11,142 | 0 | n/a | ██████████ |
| Mexico | 1,945 | 2,470 | −21% | ██░░░░░░░░ |
| Egypt | 630 | 0 | n/a | █░░░░░░░░░ |
| Japan | 565 | 594 | −5% | █░░░░░░░░░ |
| Indonesia | 476 | 494 | −4% | ░░░░░░░░░░ |
| All buyers except China* | 11,643 | 12,664 | −8% | ██████████ |
| Total | 22,785 | 12,664 | +80% |
Source: USDA FAS via USDA AMS GTR, Table 16, Oct 8, 2026 [1]. The top-five list is the GTR's fixed ranking. *Total less China; Crop Root Zone calculation. Bars scaled to the 11,142-ton China book; Indonesia rounds to less than half a block.
Excluding China, the 2026/27 book is about 1 million tons, or 8%, smaller than a year ago. Mexico, the second-largest buyer, is 21% behind. In other words, the whole of the headline increase comes from China.
The physical route matters as well. The Panama Canal was allowing 32 transits a day, and between September 4 and 24 all 24 China-bound soybean vessels inspected at Mississippi Gulf terminals, carrying about 1.6 million tons, were routed around the Cape of Good Hope. Six of seven Japan-bound vessels went through the canal (USDA AMS GTR, Oct 1, 2026) [2]. On October 2 the Gulf-to-Japan ocean rate was $75.75 per ton, against $37.00 from the Pacific Northwest [1]. A longer voyage to China raises the delivered cost of a Gulf cargo. For U.S. beans to compete with Brazil's, that extra cost has to come out of the Gulf bid, and in the end out of the interior price.
3. What USDA still needs is the smallest requirement in six years
What's new: USDA added 10 million bushels to 2026/27 exports in October, and left crush unchanged at 2.780 billion and ending stocks at 315 million, 6.9% of use [10]. TRZ-0271 noted that this was a small change set against an 80% lead in commitments (TRZ-0271, Oct 12, 2026) [19]. The table below puts a number on how small.
Evidence: Subtract the early-October book from each year's final exports and you get the business written after that point. That is mostly the winter and spring trade, when Brazil's crop arrives.
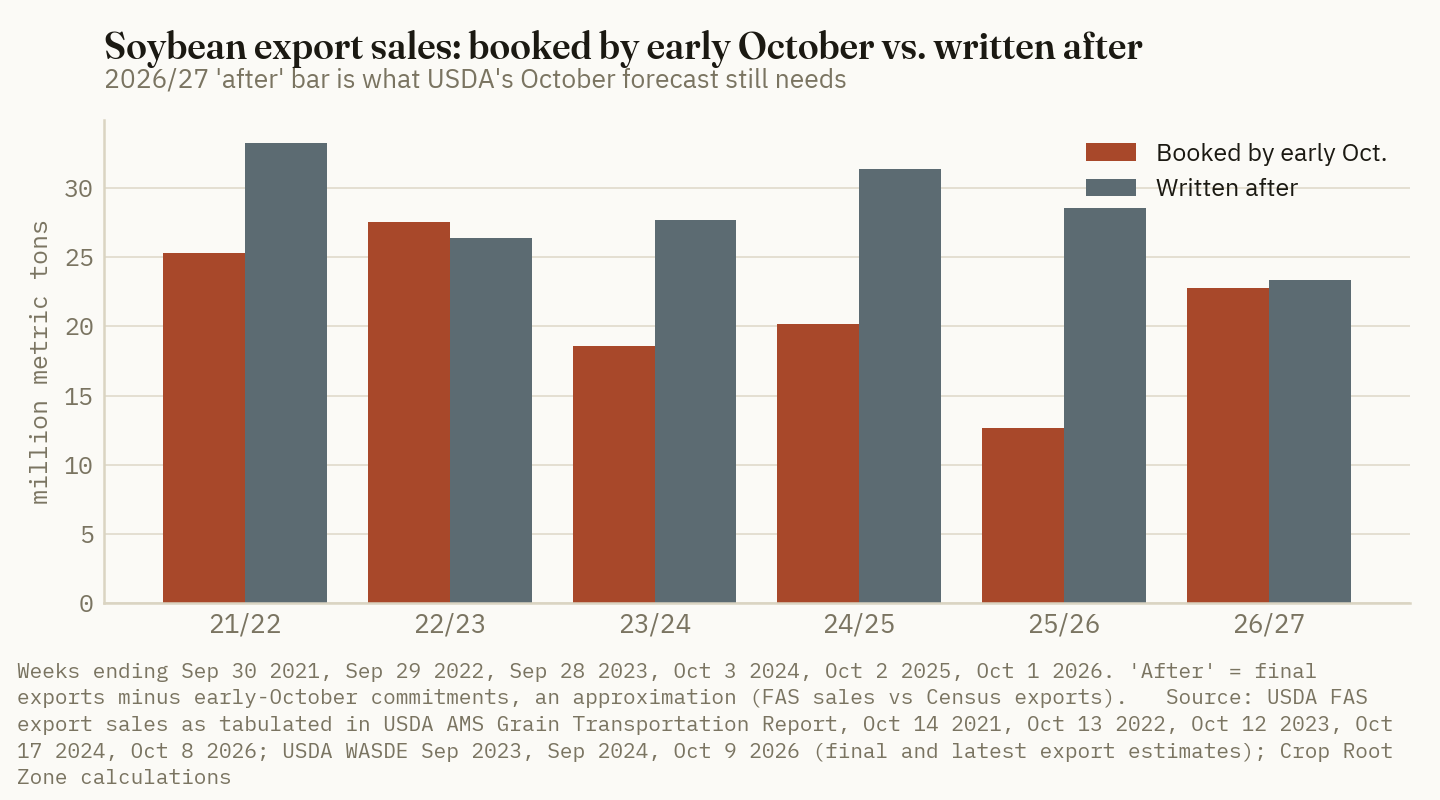
| Business written after early October | Million MT | Million bu | |
|---|---|---|---|
| 2021/22 | 33.24 | 1,221 | ██████████ |
| 2022/23 | 26.38 | 969 | ████████░░ |
| 2023/24 | 27.71 | 1,018 | ████████░░ |
| 2024/25 | 31.35 | 1,152 | █████████░ |
| 2025/26 | 28.57 | 1,050 | █████████░ |
| 2026/27, needed for USDA's 1,695 | 23.35* | 858* | ███████░░░ |
Source: Crop Root Zone calculation from the Section 1 table: final or latest export estimate (WASDE) minus early-October FAS commitments [1][6]–[12]. *Requirement, not an outcome: 46.13 million MT minus 22.785 million MT. This is an approximation. FAS export sales and the Census-based exports in WASDE do not match exactly, and some sales are cancelled or carried into the next marketing year.
23.35 million tons
What exporters must still sell to reach USDA's 1.695-billion-bushel forecast. The lowest amount written after early October in any of the last five years was 26.38 million, in 2022/23. (Crop Root Zone calculation from USDA FAS via USDA AMS GTR, Oct 8, 2026, and USDA WASDE-676, Oct 9, 2026)
The 2022/23 comparison is the hard one, because it is the year that most resembles this one. If 2026/27 matched 2022/23's post-October volume, exports would finish near 49.2 million tons, or 1,806 million bushels, 111 million above USDA. The other four years imply 1,855 to 2,059 million (our arithmetic). Even 2025/26, when China had bought nothing by early October [1], generated 28.6 million tons after this point.
That is not a forecast of 1.8 billion bushels. It does show what USDA's number assumes: a winter and spring export trade about 11% smaller than in the weakest recent year. Three things could deliver that. China may have pulled forward purchases it would otherwise have made later, to meet a calendar-year pledge. Brazil's record crop could take more of the spring than usual. And U.S. supply is tight enough that price may have to ration exports. On the last point, the balance sheet leaves little room:
| 2026/27 soybean export scenario | Exports (mil bu) | Ending stocks (mil bu) | Stocks-to-use |
|---|---|---|---|
| USDA, October | 1,695 | 315 | 6.9% |
| +55 million | 1,750* | 260* | 5.6%* |
| 2022/23's post-October volume | 1,806* | 204* | 4.3%* |
| 2023/24's post-October volume | 1,855* | 155* | 3.3%* |
Source: USDA WASDE-676, Oct 9, 2026 (supply 4,902; crush 2,780; seed 73; residual 39) [10]. *Crop Root Zone scenarios that change exports only and hold every other line fixed. In practice price would ration some of the added demand through crush or exports.
Ground Truth: The October WASDE treated a record early book as if it settled nothing, and on the history that is the conservative choice. Unless China's buying was pulled forward from the spring, the November and January reports are more likely to raise exports than cut them. Each 50-million-bushel increase takes stocks-to-use down about a point from 6.9%, so any price rationing would fall in the spring, not at harvest. That changes the risk on unpriced beans. The main downside risk is not a weaker export number. It is a repeat of 2022/23, when Brazil took the spring market. The 2022/23 comparison above is useful because it is the downside case, and even that case finishes above USDA. Our read is that USDA is more likely to have to find bushels than to find a buyer.
4. Corn: the opposite problem
What's new: USDA raised 2026/27 corn exports 25 million bushels to 3.300 billion in October, citing increased supplies [10]. Corn commitments on October 1 were 19.54 million tons, 34% below a year ago [1].
Evidence: The two crops point in opposite directions.
| Week ended Oct 1, 2026 | Soybeans | Corn |
|---|---|---|
| October WASDE export forecast (mil bu) | 1,695 (+10) | 3,300 (+25) |
| Same, million MT | 46.13 | 83.82 |
| Total commitments (1,000 MT) | 22,785 | 19,543 |
| Change vs. a year ago | +80% | −34% |
| Book as % of October forecast | 49.4% | 23.3% |
| Unshipped (1,000 MT) | 18,850 | 12,142 |
| Shipped marketing year to date (1,000 MT) | 3,935 | 7,402 |
| Net sales, latest week (1,000 MT) | 549 | 769 |
| Needed per week to reach USDA, 48 weeks (1,000 MT) | 486* | 1,339* |
| Largest buyer | China, 11,142 | Mexico, 7,682 (−23%) |
Source: USDA FAS via USDA AMS GTR, Tables 14–16, Oct 8, 2026 [1]; USDA WASDE-676, Oct 9, 2026 [10]. *Crop Root Zone calculation: (forecast − commitments) ÷ 48. Corn converted at 39.3679 bu per MT.
The corn line needs net sales of 1.34 million tons a week for the rest of the year, against 769,000 tons in the latest week. A year ago the corn book was 33.8% of what that marketing year eventually shipped, 3.429 billion bushels (our calculation from [1] and [10]). Corn shipments are running 9% ahead of last year. The shortfall is in new sales, and Mexico, the largest buyer, is 23% behind.
TRZ-0271 covered the corn carryout and argued that the demand side has more room to rise than to fall [19]. The export line is the exception. A 25-million-bushel increase that the sales book does not yet support is the corn equivalent of the soybean cushion described above, working the other way. If corn sales stay near the latest weekly pace, the risk to corn exports is a cut.
5. The farm gate: the book has not reached the bid
What's new: On October 14, Iowa's state-average soybean bid was $12.09, or 68 cents under November futures. Central Illinois country elevators averaged $12.42, 35 under (USDA AMS Iowa Daily Cash Grain Bids and Illinois Grain Bids, Oct 14, 2026) [16][17]. Four weeks earlier those bases were 59 under and 34 under [18].
Evidence: In four weeks the book grew by 2.15 million tons, or 79 million bushels. Over the same period every country basis we track was flat or weaker, and the processor premium that harvest delays had created in Iowa disappeared.
| Soybean cash bid | Mid-September | Oct 14, 2026 | Basis change |
|---|---|---|---|
| Iowa state average | $12.45, −59X (Sep 18) | $12.09, −68X | −9¢ |
| Iowa processors, average | $13.335, ≈ +30X (Sep 18) | $12.3175, ≈ −46X (range −55X to −35X) | ≈ −76¢ |
| Central Illinois country elevators | $12.94, −34X (Sep 21) | $12.42, −35X | −1¢ |
| Central Illinois processors, range | −20X to +10X (Sep 21) | −22X to +10X | ≈ flat |
| Mississippi River barge-loading, Illinois | — | $12.8225, +5X | — |
| CBOT November futures | $13.035 (Sep 18) / $13.28 (Sep 21) | $12.7725 | −26¢ / −51¢ |
Basis: X = CBOT November 2026 soybean futures; current delivery; delivered to elevator or plant by truck. Source: USDA AMS Iowa Daily Cash Grain Bids and Illinois Grain Bids, Oct 14, 2026 [16][17]; September values as published in TRZ-0215 from the same AMS reports [18]. Processor averages are Crop Root Zone calculations (average bid less the November settlement) and carry the ≈ sign.
The Iowa processor line explains much of what happened. In late September, with Iowa beans 3% harvested against a 17% average, processors bid as much as $1 over futures. Bunge's Council Bluffs plant offered $1 over for delivery by October 2 and 25 under for October–November, a $1.25 spread across a few days. Some Iowa plants were taking soybeans by rail (USDA AMS GTR, Oct 1, 2026) [2]. By October 4 Iowa was 5% harvested against a 38% average, and nationally soybeans were 25% harvested against 33% (USDA AMS GTR, Oct 8, 2026; DTN/Progressive Farmer, Oct 5, 2026) [1][22]. As harvest beans began to reach the plants, the premium for prompt delivery went away. That was a premium for timing, not a signal from export demand.
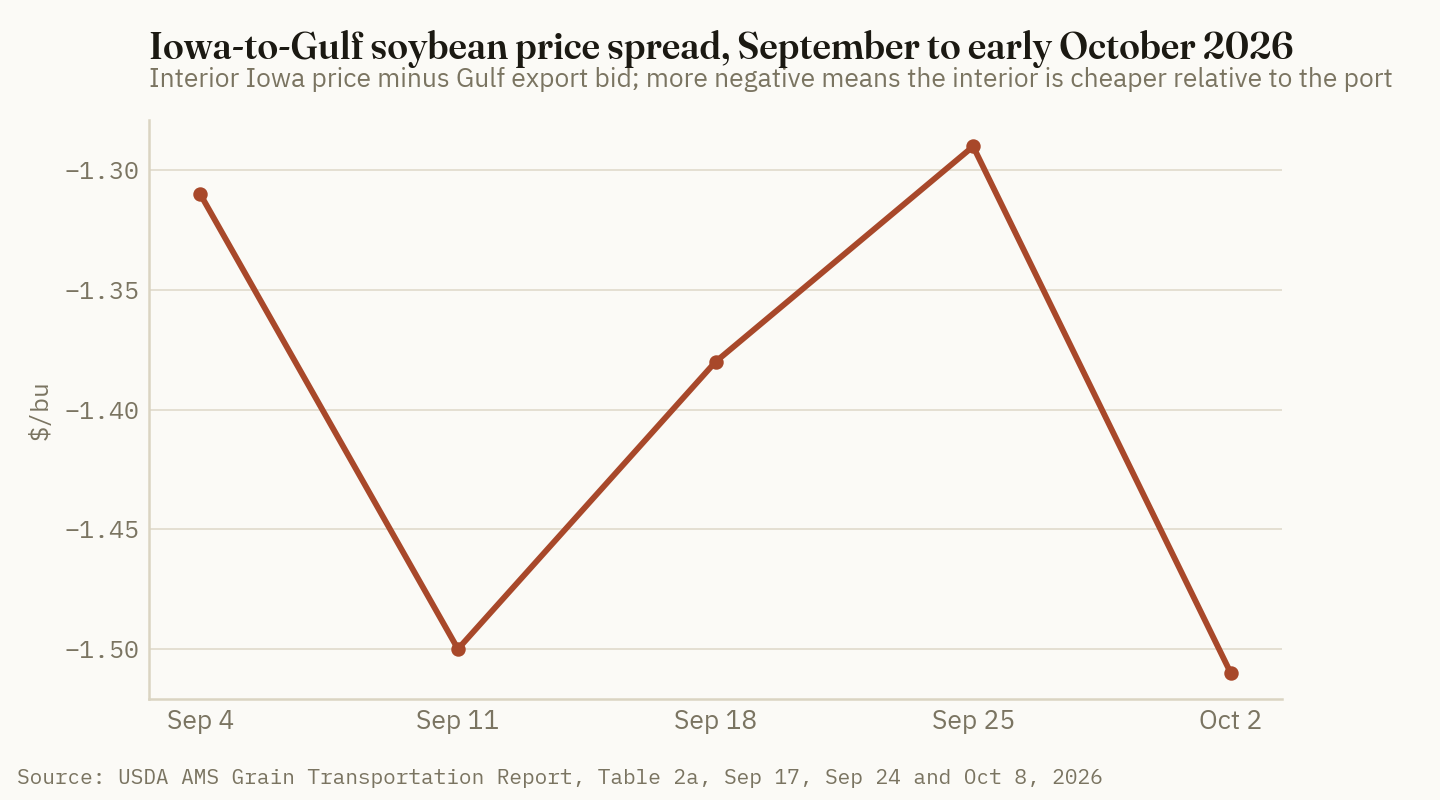
The Iowa-to-Gulf spread is the measure TRZ-0215 said to watch [18]. It narrowed to −$1.29 on September 25, then widened back to −$1.51 on October 2 [1][3][4]. The costs between the farm and the port explain much of it. The St. Louis barge rate was $28.85 a ton in the latest week, 53% above a year earlier. The October average rail fuel surcharge is 59 cents a mile, 40 cents above a year earlier. U.S. diesel was $6.199 a gallon on October 5, $2.49 above a year earlier (USDA AMS GTR, Oct 8, 2026) [1]. Gulf loadings are strong, with 39 grain vessels loaded in the week ended October 1, 26% more than a year earlier [1]. The beans are moving, but the cost of getting them to the Gulf is taking much of the export margin before it reaches the interior bid.
The futures curve offers a modest carry. On October 14, May soybeans were 31¼ cents over November [17]. Interest alone on a $12.42 central Illinois bushel held to May costs about 51 cents at 7% a year, before shrink, handling or bin costs (our estimate). For storage to cover interest, May basis would have to reach about 15 under May, against 35 under November today. USDA's $12.00 season-average price is 42 cents under today's central Illinois bid and about 98 cents under the simple average of the November-to-August futures strip [10][17]. On USDA's own numbers, then, much of the crop is expected to be sold below today's prices.
Ground Truth: The cents are in the wrong place for a harvest sale and the right place for a spring one. Iowa beans are 68 under at the country elevator, and the basis is weak because of freight and a late harvest. Sales are not the problem: barges cost 53% more than a year ago, Gulf cargoes to China are sailing around Africa, and harvested beans have just filled the gap in the processor pipeline. None of those conditions is likely to last until spring. Meanwhile, as Section 3 shows, the remaining export requirement is small enough that a 2022/23-type finish would still take carryout down by about a third. On that arithmetic, a grower who has to move beans at harvest should price them against the strongest bid within trucking range, which in Iowa this week was the top of the processor range at 35 under, not the 68-under state average. For beans already in the bin, an unpriced position is more defensible than it was in September. The carry has not improved. What has improved is the case for basis gains in the spring. The two numbers to watch are the Iowa-to-Gulf spread, which needs to narrow back toward −$1.30, and the share of weekly sales coming from buyers other than China. If non-China sales stay 8% behind last year into December, this argument weakens.
References
- USDA Agricultural Marketing Service, Grain Transportation Report, Oct 8, 2026 (FAS export sales for week ended Oct 1, 2026, Tables 14–16; Table 2a price spreads for Oct 2 and Sep 25; barge, rail fuel surcharge, diesel, ocean freight and Gulf vessel loadings; feature article on harvest progress and storage) — https://www.ams.usda.gov/sites/default/files/media/GTR10082026.pdf
- USDA AMS, Grain Transportation Report, Oct 1, 2026 (weekly highlights: Iowa rail soybean shipments and processor bids; China-bound Gulf vessels routed via the Cape of Good Hope; Panama Canal transits; FAS export sales for week ended Sep 24, 2026) — https://www.ams.usda.gov/sites/default/files/media/GTR10012026.pdf
- USDA AMS, Grain Transportation Report, Sep 24, 2026 (FAS export sales for week ended Sep 17, 2026; Iowa-to-Gulf spread, Sep 18) — https://www.ams.usda.gov/sites/default/files/media/GTR09242026.pdf
- USDA AMS, Grain Transportation Report, Sep 17, 2026 (FAS export sales for week ended Sep 10, 2026; Iowa-to-Gulf spreads, Sep 11 and Sep 4) — https://www.ams.usda.gov/sites/default/files/media/GTR09172026.pdf
- USDA AMS, Grain Transportation Report, Aug 27, 2026 (week ended Aug 20) and Sep 3, 2026 (week ended Aug 27) — https://www.ams.usda.gov/sites/default/files/media/GTR08272026.pdf ; https://www.ams.usda.gov/sites/default/files/media/GTR09032026.pdf
- USDA AMS, Grain Transportation Report, Oct 17, 2024 (FAS export sales for week ended Oct 3, 2024; October 2024 USDA forecast) — https://www.ams.usda.gov/sites/default/files/media/GTR10172024.pdf
- USDA AMS, Grain Transportation Report, Oct 12, 2023 (FAS export sales for week ended Sep 28, 2023) — https://www.ams.usda.gov/sites/default/files/media/GTR10122023.pdf
- USDA AMS, Grain Transportation Report, Oct 13, 2022 (FAS export sales for week ended Sep 29, 2022; October 2022 USDA forecast) — https://www.ams.usda.gov/sites/default/files/media/GTR10132022.pdf
- USDA AMS, Grain Transportation Report, Oct 14, 2021 (FAS export sales for week ended Sep 30, 2021; October 2021 USDA forecast) — https://www.ams.usda.gov/sites/default/files/media/GTR10142021.pdf
- USDA World Agricultural Outlook Board, World Agricultural Supply and Demand Estimates, WASDE-676, Oct 9, 2026 (U.S. soybeans and corn supply and use; world soybean supply and use) — https://www.usda.gov/oce/commodity/wasde/wasde1026.pdf
- USDA WAOB, WASDE, Sep 2023 (2021/22 soybean exports) — https://esmis.nal.usda.gov/sites/default/release-files/3t945q76s/9880x805c/v405tt51d/wasde0923.pdf
- USDA WAOB, WASDE, Sep 2024 (2022/23 and 2023/24 soybean exports) — https://esmis.nal.usda.gov/sites/default/release-files/3t945q76s/rf5610383/t148h943n/wasde0924.pdf
- USDA WAOB, WASDE, Sep 2025 (2025/26 soybean export forecast of 1,685 million bushels) — https://esmis.nal.usda.gov/sites/default/release-files/3t945q76s/z890tt821/r494xm02f/wasde0925.pdf
- USDA Economic Research Service, Oil Crops Outlook, OCS-23j, Oct 2023 (October 2023 soybean export forecast of 1,755 million bushels) — https://www.ers.usda.gov/webdocs/outlooks/107603/ocs-23j.pdf
- farmdoc daily / Farm Policy News, University of Illinois, "USDA Will Release Nov. WASDE, Crop Production Reports," Nov 3, 2025 (October 2025 supply and demand report not issued because of the shutdown) — https://farmpolicynews.illinois.edu/2025/11/usda-will-release-nov-wasde-crop-production-reports/
- USDA AMS Market News, Iowa Daily Cash Grain Bids, Oct 14, 2026 — https://www.ams.usda.gov/mnreports/ams_2850.pdf
- USDA AMS Market News, Illinois Grain Bids, Oct 14, 2026 (country, processor and barge-loading soybean bids; CBOT settlements) — https://www.ams.usda.gov/mnreports/ams_3192.pdf
- Crop Root Zone, TRZ-0215, "The Soybean Export Book Is 45% Full Ten Days Into the Year. In 2022 It Was 44.5% Full, and That Year Finished 105 Million Bushels Short.," Sep 21, 2026 (mid-September basis, futures and Iowa-to-Gulf spread, from USDA AMS reports).
- Crop Root Zone, TRZ-0271, "USDA Put 282 Million More Bushels in the Corn Carryout, 172 Million Over the Trade…," Oct 12, 2026.
- The Star (Malaysia), "US says China 'on track' to fulfil farm purchases ahead of Xi's Washington visit," Sep 11, 2026 — https://www.thestar.com.my/aseanplus/aseanplus-news/2026/09/11/us-says-china-on-track-to-fulfil-farm-purchases-ahead-of-xis-washington-visit
- The White House, "Fact Sheet: President Donald J. Trump Strikes Deal on Economic and Trade Relations with China," Nov 2025 — https://www.whitehouse.gov/fact-sheets/2025/11/fact-sheet-president-donald-j-trump-strikes-deal-on-economic-and-trade-relations-with-china/
- DTN/Progressive Farmer, E. Reiff, "USDA Crop Progress: Corn 23% Harvested, Soybeans 25% Harvested as of Oct. 4," Oct 5, 2026 — https://www.dtnpf.com/agriculture/web/AG/news/article/2026/10/05/usda-crop-progress-corn-23-harvested
- The Western Producer, "U.S. grain, oilseed review: CBOT in the red ahead of USDA report," Oct 8, 2026 — https://www.producer.com/market-update/u-s-grain-oilseed-review-cbot-in-the-red-ahead-of-usda-report/
Disclosures
Crop Root Zone is an independent publication. Nothing here is investment advice. Market calls, where included, reflect the editors' own read and are not a recommendation to buy or sell any security.
Iowa Cropland Earns 2.53% in Rent. The 10-Year Treasury Pays 5.21%, and Since the Land Survey Even the Inflation-Protected Yield Has Passed It.
USDA's 2026 figures put gross cash-rent yields between 1.86% in Ohio and 3.26% in Nebraska across 11 Midwest states. That is 195 to 335 basis points under the 10-year Treasury and 350 to 490 under farm mortgage rates near 6.8%. The 10-year TIPS yield rose from 2.20% to 2.88% after the June survey, which puts Iowa, Illinois, Indiana and four other states under the real risk-free rate. Each quarter-point on the cap rate is worth about $960 on an Iowa acre, about 53 cents of corn if rent tracks a quarter of gross revenue.
Average Iowa cropland was valued at $10,700 an acre in USDA's 2026 land values survey and rented for an average $271, a gross cash yield of 2.53% (USDA NASS, Jul 31, 2026; NASS state rents as reproduced by Progressive Dairy, Sep 2026) [1][3]. Illinois works out to 2.56%. On October 13 the 10-year Treasury closed at 5.21% and the 10-year inflation-protected Treasury (TIPS) at 2.88% (U.S. Treasury, Oct 13, 2026) [12][13]. The Chicago Fed's latest survey put the average farm real estate loan at 6.79% (Federal Reserve Bank of Chicago, Aug 2026) [9]. Land has always yielded less in rent than a bond pays, and that gap alone is not news. What changed is that the 10-year has risen 77 basis points since the end of June, when the land values were surveyed, and the real yield has now passed the rent yield on most Corn Belt ground. This piece computes the yield state by state, sets it against the risk-free and borrowing rates, and works through what a rate move and a corn move each do to the value of an acre. Our August piece computed the national ratio [16]. This one takes it to the states and to the rate side.
1. What buyers are accepting, state by state
What's new: Across 11 Midwest and Plains states with published 2026 figures, the gross rent yield ranges from 1.86% in Ohio to 3.26% in Nebraska. In the five states where we also have 2025 rents, the yield fell 4 to 13 basis points in a year.
Evidence: Neither USDA release prints the ratio. Land values come from the Land Values 2026 Summary [1]. State cash rents come from the separate Cash Rents Survey, which NASS posts in its Quick Stats database in early August [14]. We could not query Quick Stats directly, because its programmatic access needs a registered key. The 2026 state rents below come from a trade-press reproduction of the NASS state table [3]. We checked them against independent reports where those exist: Iowa's $271 and Illinois's $261 match the American Farm Bureau and farmdoc [4][5], and Nebraska's $227 matches the University of Nebraska [6]. The 2025 rents come from NASS's own December 2025 highlights sheet [2].
| State | Cropland value 2026, $/acre | Cropland cash rent 2026, $/acre | Gross rent yield 2026 | Yield 2025 | Price-to-rent, years |
|---|---|---|---|---|---|
| Nebraska | 6,960 | 227 | 3.26% | 3.32% | 30.7 |
| Nebraska, non-irrigated only | 5,650 | 168 | 2.97% | — | 33.6 |
| North Dakota | 2,800 | 86 | 3.07% | — | 32.6 |
| Missouri | 5,310 | 158 | 2.98% | — | 33.6 |
| South Dakota | 4,770 | 142 | 2.98% | — | 33.6 |
| Minnesota | 7,300 | 206 | 2.82% | 2.86% | 35.4 |
| Indiana | 8,600 | 232 | 2.70% | 2.75% | 37.1 |
| Illinois | 10,200 | 261 | 2.56% | 2.68% | 39.1 |
| Iowa | 10,700 | 271 | 2.53% | 2.66% | 39.5 |
| Michigan | 6,600 | 157 | 2.38% | — | 42.0 |
| Wisconsin | 7,600 | 170 | 2.24% | — | 44.7 |
| Ohio | 10,100 | 188 | 1.86% | — | 53.7 |
| United States | 6,020 | 160 | 2.66% | 2.76% | 37.6 |
Basis: all cropland, irrigated and non-irrigated, state averages; gross yield is rent ÷ value, before property tax, management and any financing. Source: USDA NASS, Land Values 2026 Summary, Jul 31, 2026 (values, including the 2025 column) [1]; NASS 2026 state cash rents as reproduced in Progressive Dairy, Sep 2026 [3], cross-checked for Iowa, Illinois and Nebraska [4][5][6]; Nebraska non-irrigated rent from University of Nebraska CropWatch, Sep 2, 2026 [6]; 2025 rents from NASS Highlights No. 2025-7, Dec 2025 [2]. Yields and price-to-rent are Crop Root Zone calculations. Kansas is omitted: the reproduced table shows $234 of rent on $3,540 land, a 6.6% yield that no other source supports. We treat it as a transcription error.
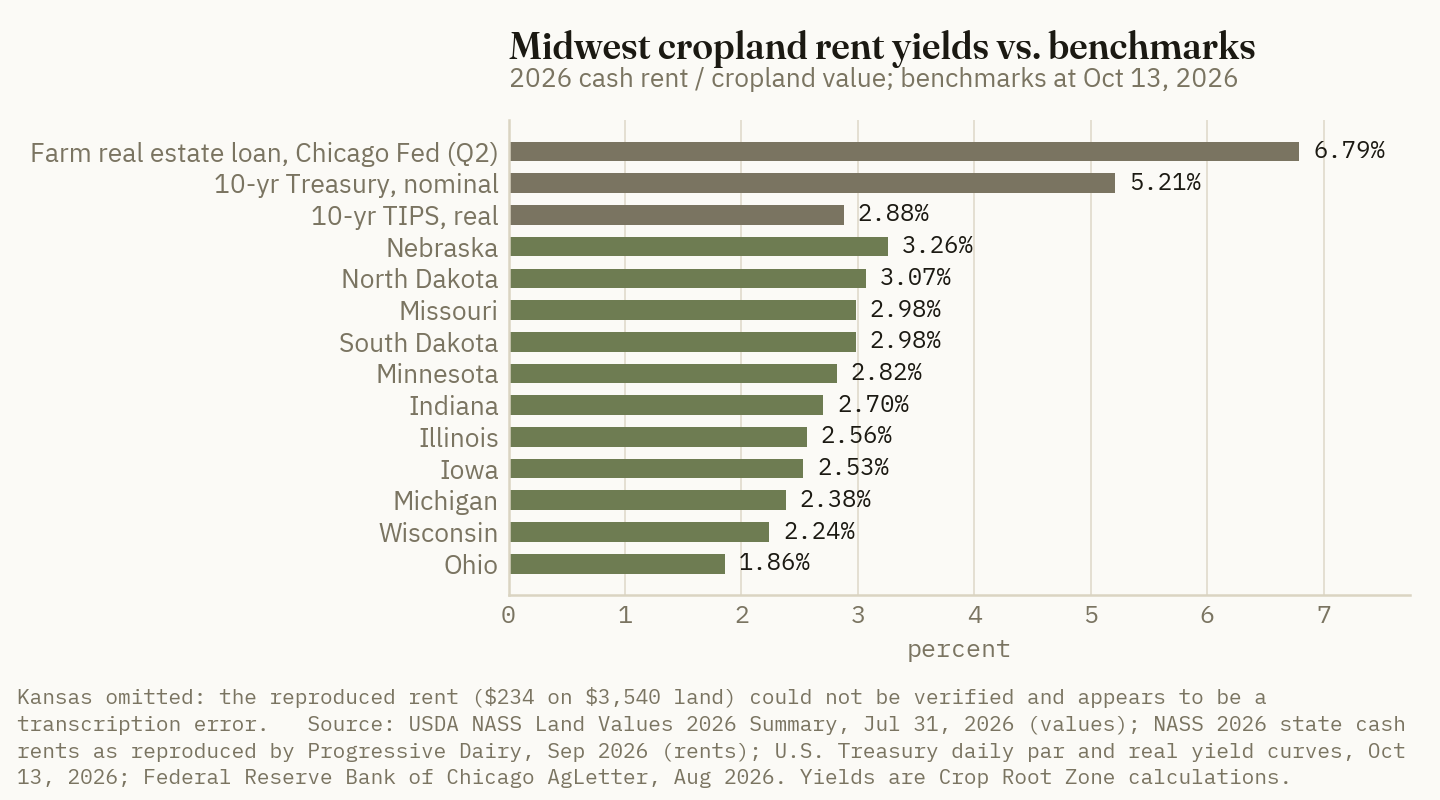
The pattern has a clear reading. The yield is highest where land is cheapest relative to what it rents for, on the western edge of the Corn Belt. It is lowest in Ohio, Wisconsin and Michigan, where cropland values have risen faster than rents. Ohio cropland was $7,740 in 2022 and is $10,100 now, up 30% [1]. Its rent is $44 below Indiana's on land that is worth $1,500 more.
The private surveys say the same thing at a finer grain. Purdue's June survey puts Indiana rent at 2.0% to 2.3% of land value across top, average and poor ground. Top-quality land fell from 2.1% in 2025 to 2.0% (Purdue University, Aug 2026) [7]. The Illinois farm managers' society computes a current return to Illinois farmland of about 2.4% to 2.6% by class from its own rents and prices (ISPFMRA mid-year survey, Aug 27, 2026) [8]. Iowa State's own 2026 survey puts the average Iowa cash rent at $270, down $1 from 2025 and $9 from the 2023–24 peak (Pro Farmer, May 22, 2026) [11]. On Iowa State's rent and USDA's value, the Iowa yield is 2.52%.
Ground Truth: The ratio fell in every state where we have two years because values rose 2.4% to 4.3% while rents went flat or down [1][2]. That is the national pattern our August piece described [16]. At state level it adds one thing: the compression is steepest on the most expensive ground. Iowa and Illinois each lost 12 to 13 basis points, while Minnesota and Indiana lost 4 to 5. A landlord in central Iowa who cites last year's value gain is citing a number that bought 13 basis points less rent per dollar.
2. Against the risk-free rate, nominal and real
What's new: The 10-year Treasury averaged 4.47% in June 2026 and closed at 5.21% on October 13. The 10-year TIPS real yield went from 2.18% to 2.88% over the same stretch [12][13]. Because the land survey reflects values around midyear, the rent yields in Section 1 were set against the June rates, not today's.
Evidence: The nominal 10-year is the wrong yardstick on its own. Cash rent tends to rise with inflation over long periods, so a 2.5% rent yield is closer to a real yield than a nominal one. The fairer comparison is with TIPS, which pays a fixed real yield on top of inflation and carries no farm risk.
| Date | 10-yr Treasury | 10-yr TIPS (real) | Iowa yield | Iowa vs. Treasury | Iowa vs. TIPS | Illinois vs. TIPS |
|---|---|---|---|---|---|---|
| June 2025 average | 4.38% | 2.09% | 2.66% | −172 bp | +57 bp | +59 bp |
| June 2026 average | 4.47% | 2.18% | 2.53% | −194 bp | +35 bp | +38 bp |
| Oct 13, 2026 close | 5.21% | 2.88% | 2.53% | −268 bp | −35 bp | −32 bp |
Basis: Treasury par yields; June figures are averages of daily closes. Source: U.S. Treasury, Daily Treasury Par Yield Curve Rates and Par Real Yield Curve Rates for 2025 and 2026, accessed Oct 14, 2026 [12][13]; land yields from Section 1. The October row holds the 2026 rent yield fixed, since no newer land value exists. Spreads are Crop Root Zone calculations.
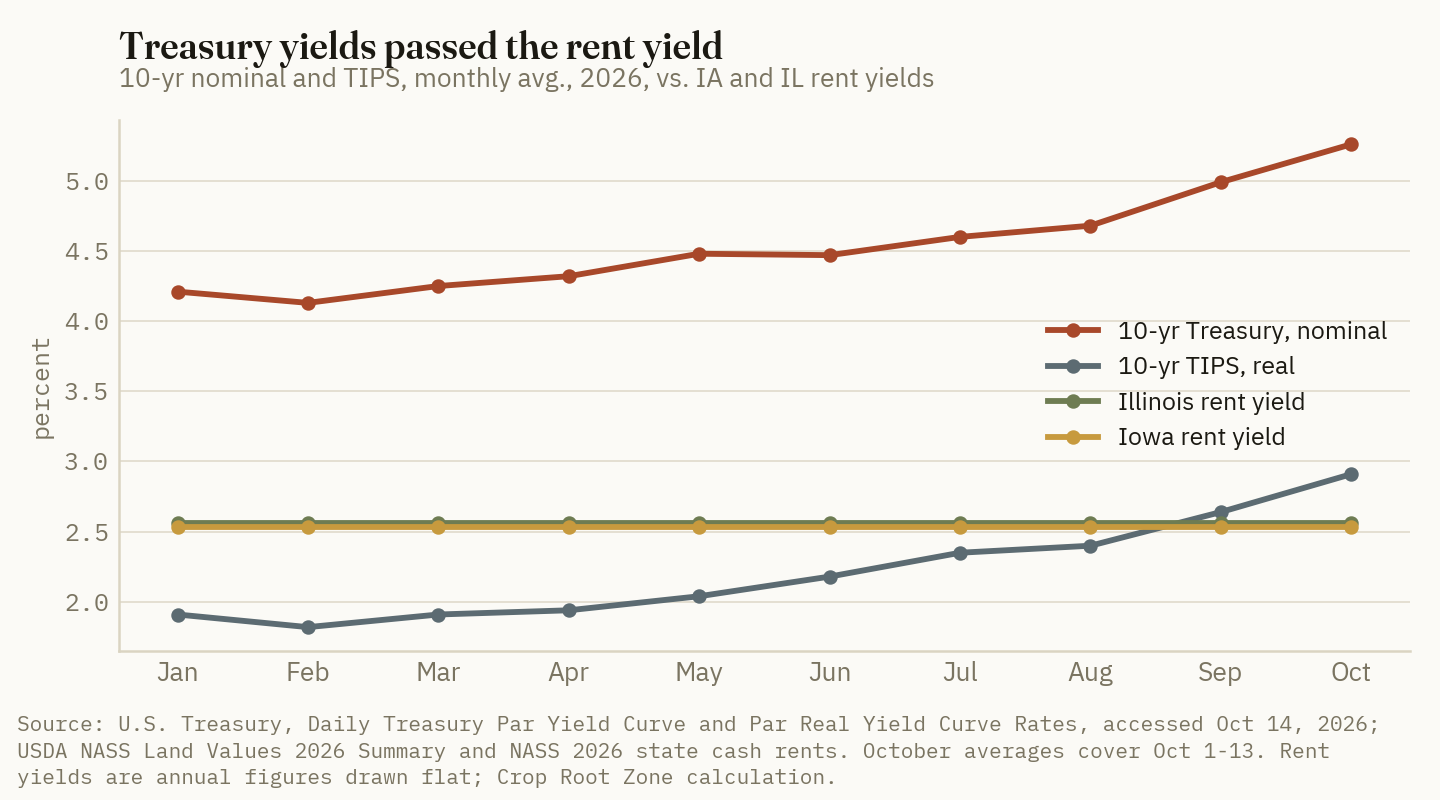
−35 bp
Iowa cropland's 2.53% gross rent yield against the 10-year TIPS real yield of 2.88% on October 13, 2026. In June 2025 the land paid 57 basis points more than the inflation-protected bond. The sign has flipped in 16 months. (Crop Root Zone calculation from USDA NASS and U.S. Treasury data, Oct 13, 2026)
The difference between the two Treasury yields, 2.33 points on October 13, is the market's 10-year inflation expectation [12][13]. To match the nominal 10-year, an Iowa acre at a 2.53% rent yield needs its value to rise 2.68% a year for ten years before property tax. That is 35 basis points a year faster than expected inflation, and it comes with weather risk, a tenant and no liquidity. Iowa cropland values have compounded at 4.9% a year since 2022, but that run began at the start of the 2022 boom [1]. Purdue's respondents expect 3.47% average inflation over five years [7]. On that view, average Indiana ground returns about 5.6% in total: its 2.1% rent yield plus 3.47% growth. That is above the Treasury but below the cost of borrowing to buy it, as Section 3 shows.
Ground Truth: The comparison that matters for the next land sale is with TIPS, not the nominal 10-year, and it changed sign this quarter. Until this summer a buyer of Iowa or Illinois ground could say the rent alone beat the real risk-free rate, with any real rent growth as a bonus. At October's yields that is no longer true for Iowa, Illinois, Indiana, Minnesota, Michigan, Wisconsin or Ohio. A buyer at the July value is now paying for real growth in rent or for something other than income: control of a neighbouring farm, a 1031 exchange, estate planning. The first public test is the Chicago and Kansas City Fed third-quarter surveys, due in November. If lenders still report flat values while the TIPS yield stays above 2.5%, the market is being set by who is buying, not by what the land earns.
3. Against what a buyer borrows at
What's new: The three Fed district surveys with current public data put farm real estate loans at 6.8% to 7.0%, about 3.6 points above the rent yield in Nebraska and 4.3 in Iowa.
Evidence:
| Survey | Area | Quarter | Farm real estate loan rate | Year earlier | Land value change, year over year | Cash rent change |
|---|---|---|---|---|---|---|
| Chicago Fed AgLetter | 7th District (IL, IN, IA, MI, WI) | Q2 2026 | 6.79% | 7.02% | Flat for "good" land; −3.7% after inflation | Not reported |
| Kansas City Fed | 10th District | Q2 2026 | 6.97% (fixed) | 7.43% | Non-irrigated +0.8%, irrigated +4.4% | Cropland about −2% |
| Kansas City Fed | Nebraska | Q2 2026 | 6.83% | 7.19% | — | — |
| Kansas City Fed | Missouri | Q2 2026 | 6.92% | 7.78% | — | — |
| Minneapolis Fed | 9th District (MN, ND, SD, WI, MT) | Q1 2026 | 6.8% (fixed and variable) | 7.4% | Non-irrigated −0.7% | Non-irrigated down more than 2% |
Source: Federal Reserve Bank of Chicago, AgLetter No. 2013, Aug 2026, rates at end of period [9]; Federal Reserve Bank of Kansas City, Agricultural Credit Survey, Aug 14, 2026, and its Q2 2026 fixed-rate and land value data files [10]; Federal Reserve Bank of Minneapolis, Ag Credit Survey, May 18, 2026 [15]. The Kansas City series includes Farm Credit System lenders from Q3 2025 onward, so its year-earlier comparison mixes panels [10]. We found no public 2026 release of the St. Louis Fed's agricultural survey; its Eighth District therefore has no row. The Minneapolis Fed's second-quarter rate table was not public as of Oct 14.
Rates fell about 25 to 85 basis points in a year, depending on the survey [9][10][15]. They are still about four points above what the land pays in rent. That is why, as Kansas State's farm management economists put it, purchased farmland "will very seldom ever cash flow" (Ibendahl and O'Brien, Oct 2025) [17]. In dollars, on an average Iowa acre:
| Per average Iowa acre ($10,700), per year | $/acre | |
|---|---|---|
| Cash rent the acre earns | 271 | ███░░░░░░░ |
| Income from $10,700 in the 10-year Treasury at 5.21% | 557 | ██████░░░░ |
| Interest only, 100% financed at 6.79% | 727 | ████████░░ |
| Payment, 100% financed, 25-year amortizing at 6.79% | 901 | ██████████ |
Basis: $/acre a year, before property tax; principal in the amortizing payment builds equity and is not a cost. Source: Crop Root Zone arithmetic on USDA NASS values and rents [1][3], U.S. Treasury yield, Oct 13, 2026 [12], and the Chicago Fed's Q2 farm real estate rate [9]. Bars scale to the $901 payment = 10 blocks.
A buyer who finances 70% at 6.79% pays about $509 an acre in interest alone, nearly twice the rent, and gives up about $167 a year on the 30% down payment at the Treasury rate. Those are our figures. The ISPFMRA survey suggests who absorbs that gap: farmers made 55% of Illinois purchases in the first half of 2026, mostly with income from land already owned, while estates made 64% of sales and 19% of sellers cited a 1031 exchange [8]. Forty-three percent of Chicago Fed lenders called district farmland overvalued and none called it undervalued [9]. The Kansas City Fed reported values still rising on irrigated ground while rents fell about 2% [10]. Purdue's respondents expect a 6.44% five-year average mortgage rate, up from 6.28% a year earlier [7].
4. What a rate move or a corn move does to the value of an acre
What's new: We hold Iowa's 2026 rent fixed and ask what the value must be at a different cap rate. Then we hold the cap rate fixed and ask what a corn price move does through rent. These are arithmetic scenarios, not forecasts. Farmland values have not historically tracked Treasury yields point for point, and the Fed surveys show no repricing so far [9][10].
Evidence: Rate side. Value equals rent divided by the cap rate. At $271 and 2.53%:
| Cap rate change | Cap rate | Iowa value at $271 rent, $/acre | Change |
|---|---|---|---|
| −50 bp | 2.03% | 13,332 | +24.6% |
| −25 bp | 2.28% | 11,872 | +11.0% |
| 0 | 2.53% | 10,700 | — |
| +25 bp | 2.78% | 9,739 | −9.0% |
| +50 bp | 3.03% | 8,936 | −16.5% |
| +77 bp (the 10-year's move, Jun 30–Oct 13) | 3.30% | 8,205 | −23.3% |
| +100 bp | 3.53% | 7,671 | −28.3% |
Basis: $/acre, gross rent held at $271. Source: Crop Root Zone calculation on USDA NASS [1][3]; the 77 bp row is the 10-year Treasury change from 4.44% on Jun 30 to 5.21% on Oct 13, 2026 [12]. Applying the full Treasury move to the land cap rate is an upper-bound illustration.
Corn side. A corn move reaches land value only through rent, and only in part. Purdue's survey gives a way to size that part. Average-quality Indiana rent is $1.25 per bushel of expected yield [7]. At the $5.05 five-year corn price Purdue's respondents expect, that is about 25% of corn gross revenue [7]. We use 25% as the base pass-through, 50% as a high case, and a 200-bushel Iowa yield. All three are our assumptions.
| Corn price move, $/bu | Rent change, 25% pass-through | Iowa value change at 2.53% | Rent change, 50% pass-through | Iowa value change at 2.53% |
|---|---|---|---|---|
| ±0.25 | ±$12.50 | ±$494 (4.6%) | ±$25 | ±$988 (9.2%) |
| ±0.50 | ±$25 | ±$988 (9.2%) | ±$50 | ±$1,976 (18.5%) |
| ±1.00 | ±$50 | ±$1,976 (18.5%) | ±$100 | ±$3,951 (36.9%) |
Basis: $/acre, 200 bu/acre corn and pass-through shares are Crop Root Zone scenario assumptions; a rotation with soybeans changes the per-acre revenue. Source: Crop Root Zone calculation; rent-per-bushel from Purdue University, Aug 2026 [7]; values and rents from [1][3].
Put the two tables together. Holding a 25-basis-point rise in the cap rate at bay takes $26.70 more rent. At 25% pass-through that is 53 cents of corn, and at 50% it is 27 cents. Offsetting the full 77-basis-point Treasury move would take $82 of rent, or $1.65 of corn at 25% pass-through. Illinois farm managers surveyed this summer assumed $4.54 corn and $11.57 soybeans and expected 2027 rents to slip $3 to $5. farmdoc notes that 2027 prices now sit nearer $5 and $12 [5][8]. On our base case, a 46-cent gap between their assumed corn price and the current one is worth roughly $23 of rent. That supports rent holding flat. It does not cover a quarter-point on the cap rate.
Ground Truth: For a renter, the rate side of this arithmetic is mostly someone else's problem, and that is the useful point. A cash tenant pays the rent, not the cap rate. At 2.53% the tenant controls $10,700 of land for $271, against $727 of interest to own it. If the market ever charged land the 10-year rate, the rent would not jump. The value would fall, because rent is set by what the crop can pay [5][7], which is why our earlier pieces read the 2027 lease off crop margins and flex factors, not land prices [18][19]. A buyer faces the reverse. A corn rally that lifts rent by $12 to $25 adds $500 to $1,000 to the acre. A quarter-point on the discount rate takes away about $960. Since June, the bond market has moved three times that far. A buyer pricing an acre this fall off July's value is betting that land keeps ignoring the bond market, as it has through 2026. A farm adding acres should run the purchase at the current 6.8% rate and today's rent, and treat any appreciation as a bonus rather than the plan.
5. What the numbers leave out
What's new: Four limits sit on the figures above. The largest is timing.
Evidence:
- Timing. USDA values reflect midyear 2026 and Purdue's are from June [1][7]. The Fed surveys cover the second quarter, except Minneapolis, whose latest rate table is from the first [9][10][15]. Every Treasury figure after June 30 is newer than every land figure. NASS posted 2026 county cash rents on October 6 [14], and we have not used them. The Chicago and Kansas City third-quarter surveys are due in November.
- Gross, not net. All yields are before property tax, insurance and management. We did not source per-acre property tax by state. Net yields to an owner are lower than shown, so every spread in Sections 2 and 3 is wider in fact.
- Averages. A state average blends land qualities. Purdue's top-quality land yields 2.0% and its poor land 2.3% [7]. Illinois classes run 2.4% to 2.6% [8]. The ratio for a particular farm depends on its rent and its sale price, not the state's.
- Earlier figures corrected. Our August 18 piece (TRZ-0108) computed the national ratio correctly at 2.66% [16]. Its regional table needs two corrections. NASS puts Corn Belt farm real estate at $8,540, not $8,590. The Rhode Island, Massachusetts, Connecticut and New Jersey figures it labelled "all land" are cropland values: Rhode Island farm real estate is $23,600, against $34,300 for its cropland [1]. The state yields here supersede that piece's decision not to compute regional ratios.
References
- USDA National Agricultural Statistics Service, Land Values 2026 Summary (ISSN 1949-1867), released Jul 31, 2026 — https://esmis.nal.usda.gov/sites/default/release-files/795999/land0726.pdf
- USDA National Agricultural Statistics Service, NASS Highlights No. 2025-7, "2025 Agricultural Land Values and Cash Rents," December 2025 — https://data.nass.usda.gov/Publications/Highlights/2025/2025LandValuesCashRents_FINAL.pdf
- Audrey Schmitz, Progressive Dairy, "2026 cropland values reach new highs while rental rates hold steady," September 2026, reproducing the NASS 2026 state table "Cropland value and rental rates" — https://www.agproud.com/ext/resources/2026/09/10/64119-schmitz-1526PD.16-17.pdf
- Daniel Munch, American Farm Bureau Federation, Market Intel, "Farmland Values Climb to New Highs as Cash Rents Hold Near Records," Aug 4, 2026 — https://www.fb.org/intel/markets/farmland-values-climb-to-new-highs-as-cash-rents-hold-near-records
- Nick Paulson, Gary Schnitkey, Juo-Han Tsay and Carl Zulauf, farmdoc daily (16):165, "Illinois Cash Rents in 2026 and Outlook for 2027," Sep 15, 2026 — https://farmdocdaily.illinois.edu/2026/09/illinois-cash-rents-in-2026-and-outlook-for-2027.html
- University of Nebraska–Lincoln CropWatch, "Nebraska 2026 Farm Real Estate Value and Cash Rent," Sep 2, 2026 — https://cropwatch.unl.edu/news/nebraska-2026-farm-real-estate-value-and-cash-rent/
- Todd Kuethe, Purdue University, Purdue Agricultural Economics Report PAER-2026-24, "Indiana's Farmland Market Holds Steady as Regions Swap Places" (Farmland Values Survey 2026; Tables 1a, 2, 3a), August 2026 — https://ag.purdue.edu/commercialag/home/wp-content/uploads/2026/08/PAER-2026-24.pdf
- Luke Worrell, Juo-Han Tsay and Gary Schnitkey, "Rents and Prices Outlook: Results from a Mid-Year Survey Conducted by the Illinois Society of Professional Farm Managers and Rural Appraisers," presentation handout, Aug 27, 2026 — https://farmdoc.illinois.edu/wp-content/uploads/2026/08/2026-08-27-Land-Values-Handout.pdf
- Elizabeth Kepner and David Oppedahl, Federal Reserve Bank of Chicago, AgLetter No. 2013, "Second Quarter Midwest Farmland Values Unchanged," August 2026 — https://www.chicagofed.org/publications/agletter/2025-2029/august-2026
- Ty Kreitman, Federal Reserve Bank of Kansas City, Agricultural Credit Survey, "Steady Tightening of Agricultural Credit Conditions Persists," Aug 14, 2026, with data files Q226-fixedinterestrates.xlsx and Q226-landvalues.xlsx — https://www.kansascityfed.org/agriculture/ag-credit-survey/steady-tightening-of-agricultural-credit-conditions-persists/
- Mike Walsten, Pro Farmer, "2026 Average Iowa Cash Rent Eases," May 22, 2026 (reporting the Iowa State University 2026 cash rent survey) — https://www.profarmer.com/news/agriculture-news/2026-average-iowa-cash-rent-eases
- U.S. Department of the Treasury, Daily Treasury Par Yield Curve Rates, 2025 and 2026, accessed Oct 14, 2026 (10-year: 5.21% on Oct 13, 2026; 4.44% on Jun 30, 2026) — https://home.treasury.gov/resource-center/data-chart-center/interest-rates/TextView?type=daily_treasury_yield_curve&field_tdr_date_value=2026
- U.S. Department of the Treasury, Daily Treasury Par Real Yield Curve Rates, 2025 and 2026, accessed Oct 14, 2026 (10-year: 2.88% on Oct 13, 2026) — https://home.treasury.gov/resource-center/data-chart-center/interest-rates/TextView?type=daily_treasury_real_yield_curve&field_tdr_date_value=2026
- USDA National Agricultural Statistics Service, "Cash Rents by County" survey page (state estimates in Quick Stats the first week of August; 2026 county release Oct 6, 2026), accessed Oct 14, 2026 — https://www.nass.usda.gov/Surveys/Guide_to_NASS_Surveys/Cash_Rents_by_County/
- Joe Mahon, Federal Reserve Bank of Minneapolis, "Higher input costs pressure district farmers" (first-quarter 2026 Ag Credit Survey), May 18, 2026 — https://www.minneapolisfed.org/article/2026/higher-input-costs-pressure-district-farmers
- Crop Root Zone, TRZ-0108, "Cropland Crossed $6,000 an Acre. The Rent It Earns Fell a Dollar.," Aug 18, 2026.
- Gregg Ibendahl and Daniel O'Brien, Kansas State University, AgManager.info, "2026 Kansas County-Level Cash Rental Rates: Non-Irrigated Cropland," Oct 11, 2025 — https://www.agmanager.info/sites/default/files/pdf/Non-Irrigated_CashRents_2026.pdf
- Crop Root Zone, TRZ-0185, "Two-Thirds of Illinois Farm Managers Expect 2027 Rent to Be Exactly What 2026 Was. Nine Percent Expect It Higher."
- Crop Root Zone, TRZ-0255, "At $5.00 Corn and $12.00 Soybeans, Illinois' Published Flex-Lease Factors Pay the Landowner $359 an Acre, $38 More Than the $321 Fixed Rent. The Operator Keeps $23 Instead of $61."
Disclosures
Crop Root Zone is an independent publication. Nothing here is investment advice. Market calls, where included, reflect the editors' own read and are not a recommendation to buy or sell any security.
A $90 Ton of Nebraska Corn Stalks Leaves $14.52 After Custom Baling and Full Nutrient Replacement. Stalk Grazing Rents for $13 an Acre in Iowa and Removes $1.27 of Nitrogen. On 200-Bushel Corn, Baling Nets $29 to $67 an Acre and Grazing $12 to $27.
At DTN's Sep 28–Oct 2 retail prices, a ton of stover carries $19.92 to $29.58 of N, P, K and S on three university figures, and $11.69 to $17.88 if only phosphate and potash are counted. Nebraska's 2026 custom rates put raking, baling and moving at $45.89 a ton. Break-even is $75.48 a ton at the field with every nutrient replaced and $56.71 on high-potassium soil. Per-acre grazing rents work out to 23 to 30 cents a head a day on a 200-bushel field, roughly half the lowest published per-head rate. No Nebraska or Kansas statewide stalk rent has been published for 2026.
A ton of new-crop corn stalks in large round bales traded at $90 in central Nebraska last week, and at $135 in large squares in the west of the state (USDA AMS, Oct 8, 2026) [10]. That ton carries about 17 lb of nitrogen, 4 lb of phosphate, 34 lb of potash and 3 lb of sulfur by the University of Nebraska's count [2], which costs $29.58 to buy back at the retail prices DTN collected for Sep 28–Oct 2 [1]. Nebraska's 2026 custom rates put raking, baling and moving it at $45.89 [8]. The central Nebraska seller who hires the work and replaces every pound keeps $14.52 a ton, or $29 an acre at two tons baled. The same field rented for grazing brings about $13 an acre on Iowa State's 2026 survey [13] and gives up $1.27 of nitrogen [17]. Left alone it brings nothing and costs nothing. This piece prices all three on 200-bushel corn. It extends our Oct 9 work on what a ton of alfalfa hay removes [27] to the residue behind the combine, and it leaves residue sprays, which we covered on Oct 1 [26], out of the arithmetic.
One caution on scale. A University of Nebraska article in 2019 put 53.5% of the state's harvested corn acres under grazing and 0.5% under balers [24]. Those shares are stale. Baling is the smaller market by two orders of magnitude, and the price prints below are thin.
1. What a ton of stover removes, and what the pounds cost this week
What's new: DTN's national retail averages for Sep 28–Oct 2 were $979 a ton for anhydrous, $683 for urea, $974 for MAP and $499 for potash. Anhydrous is up 20% on the year and potash 3% (DTN/Progressive Farmer, Oct 7, 2026) [1]. That works out to $0.60 per lb of N as anhydrous, $0.937 per lb of P2O5 through MAP with no nitrogen credit, and $0.416 per lb of K2O.
Evidence: The land-grant removal figures disagree more than the alfalfa figures did, and most of the disagreement is potash.
| Source | Basis | N, lb/ton | P2O5, lb/ton | K2O, lb/ton | S, lb/ton | P + K only, $/ton* | N-P-K-S, $/ton* |
|---|---|---|---|---|---|---|---|
| Nebraska, CropWatch 2017 | Dry residue | 17 | 4 | 34 | 3 | 17.88 | 29.58 |
| Nebraska, CropWatch 2007 | Harvested stover | 16 | 4.0 | 29 | 3.4 | 15.81 | 27.11 |
| Minnesota, 2024 | Four-site average | 13 | 1.8 | 24 | 0.9 | 11.67 | 19.92 |
| Iowa State, 2019, vegetation at maturity | Dry matter | 12 | 3 | 22 | 1 | 11.96 | 19.66 |
| Iowa State PM 1688 rate | 15% moisture | n/a | 4.8 | 18.0 | n/a | 11.98 | n/a |
| Purdue, 2008 | Dry stover | n/a | 3.6 | 20 | n/a | 11.69 | n/a |
Basis: replacement at delivered retail, US average, Sep 28–Oct 2: $0.60/lb N (anhydrous), $0.937/lb P2O5 (MAP, no N credit), $0.416/lb K2O. Sulfur is priced at an assumed $0.50/lb, the figure Minnesota used in 2024; we found no current public Corn Belt retail sulfur price. No spreading charge. Sources: University of Nebraska–Lincoln, Dec 7, 2017 [2] and Nov 16, 2007 [3]; University of Minnesota Extension, Mar 4, 2024 [5]; Iowa State University, Sep 2019 [4]; Purdue University, Oct 10, 2008 [6]; prices from DTN/Progressive Farmer, Oct 7, 2026 [1]. *Crop Root Zone calculations from unrounded prices. Crediting MAP's nitrogen at $0.60 would lower phosphate to $0.81/lb and each total by 20 to 60 cents.
On Nebraska's 2017 figure the bill is $14.14 of potash, $10.20 of nitrogen, $3.75 of phosphate and $1.50 of sulfur. Three things make that a ceiling.
Potash depends on the soil and the weather. Nebraska's own guidance says that where the soil supplies a nutrient adequately, "such as potassium in Nebraska," the value of what is removed may be 0% to 50% of fertilizer value [2]. Iowa State notes that all the potassium in the plant is soluble and leaches out of stalks and leaves with rain after grain harvest, so baled stover carries less than stover at maturity [4]. Its planning rate is 18 lb of K2O a ton, about half of Nebraska's 34.
Nitrogen may not be owed at all. Iowa State's extension guidance says the economic optimum nitrogen rate for the next corn crop is often about 20 lb an acre lower after partial stover removal, because less carbon goes back to tie nitrogen up [7]. At $0.60 that is $12 an acre saved, against the $20.40 an acre that full-value accounting charges for the nitrogen in two tons.
The pounds are per dry ton. A bale sold at 12% to 15% moisture holds 0.85 to 0.88 ton of dry matter. We have not adjusted for that. It overstates every dollar figure in this piece by a like amount.
Removal also takes base cations. Nebraska puts it at the equivalent of 35 lb of lime per ton of residue [2], and Iowa's survey has lime spreading at $8.30 a ton [9]. That is pennies a year and a real cost over a decade.
Ground Truth: The $29.58 bill is two bills. Phosphate, $3.75 a ton, is owed everywhere. The $14.14 of potash is owed in full on ground testing below optimum, at 18 lb a ton by Iowa State's planning rate on ground where it maintains K, and at half or less on high-testing Nebraska soil. The $10.20 of nitrogen is an accounting entry that Iowa State's own nitrogen guidance contradicts. A seller on high-potassium irrigated ground is giving up closer to $11 a ton than $30. A seller in eastern Iowa on Optimum-testing soil is giving up $12 to $18. Timing moves it too: stalks baled the week after the combine take more potash off the field than stalks baled after two rains, and the soil test will not show which happened.
2. What it costs to get it off the field, and what it sells for
What's new: Nebraska published its biennial custom-rate report this year, and it prints statewide cornstalk lines: raking at $9.67 an acre and baling with net wrap at $21.22 a bale, on bales averaging 1,192 lb (University of Nebraska–Lincoln, 2026) [8]. Iowa's 2026 survey has straw or corn stalk baling with wrap at $16.85 a bale (Iowa State University, Mar 2026) [9].
Evidence:
| Operation | Nebraska 2026 | Responses | Iowa 2026 | Responses | Basis |
|---|---|---|---|---|---|
| Raking cornstalks, $/acre | 9.67 | 6 | 9.90† | 24 | Custom, fuel and labor included |
| Baling cornstalks, large round, net wrap, $/bale | 21.22 | 9 | 16.85 | 31 | Custom; Iowa line is straw or corn stalk, round or square, with wrap |
| Moving large round bales to storage, $/bale | n/a | 3.25 | 11 | Custom | |
| Chopping cornstalks, $/acre | n/a | 14.55 | 32 | Custom; not included in our totals | |
| Hauling baled hay or cornstalks, $/loaded mile | 5.28 | 9 | n/a | 20-ton average load | |
| Rake, bale and move, $/ton* | 45.89 | 38.67 | 2.0 tons/acre in 1,192-lb bales | ||
| Rake, bale and move, $/acre* | 91.78 | 77.35 | 3.36 bales/acre |
Sources: University of Nebraska–Lincoln, 2026 Nebraska Agricultural Custom Rates [8]; Iowa State University, 2026 Iowa Farm Custom Rate Survey, Mar 2026 [9]. †Iowa's raking rate is for hay. *Crop Root Zone calculations. Both totals use Iowa's $3.25 a bale for moving, because Nebraska reports that job per mile, and both assume Nebraska's 1,192-lb bale. Two tons an acre is our assumption: 40% of the 5.0 tons that Nebraska's rule of one ton of residue per 40 bushels gives at 200 bushels [2].
Three cautions. The Nebraska lines rest on six and nine responses. Nebraska's 2025 livestock-services survey, on four responses, had raking at $18.57 an acre and baling at $16.44 a bale [28], so the spread between surveys is as large as the spread between states. And both 2026 surveys were taken in late winter. Iowa State assumed diesel at $2.89 a gallon [9]. Farm diesel was offered at $5.63 in Illinois in the week ending Oct 2 (USDA AMS, Oct 2, 2026) [22]. Neither university publishes a fuel adjustment for baling. If custom operators have added 20%, the Nebraska total rises by $18.36 an acre. That is a sensitivity, not a reported rate.
The price side is thinner still.
| Report | Region | Package | Tons | $/ton | Basis |
|---|---|---|---|---|---|
| Nebraska Direct Hay, Oct 8 | Central | Large round, new crop | 200 | 90.00 | FOB, feedlot use |
| Nebraska Direct Hay, Oct 8 | West | Large square 3x4 | 200 | 135.00 | FOB |
| Kansas Direct Hay, Oct 2 | Southwest | Large round, Good | 230 | 107.50 | Delivered |
| Kansas Direct Hay, Oct 2 | South central | Large square | 100 | 100.00–125.00 (avg 112.50) | Delivered |
| Iowa Direct Hay, Oct 6 | Statewide | No corn stalk trade reported | 0 | n/a | n/a |
Sources: USDA AMS Livestock, Poultry and Grain Market News, Nebraska Direct Hay Report, Oct 8, 2026 (week ending Oct 9) [10]; Kansas Direct Hay Report, Oct 2, 2026 (week ending Sep 25) [11]; Iowa Direct Hay Report, Oct 6, 2026 (week ending Oct 9) [12]. Confirmed trades only.
That is 730 tons across three states. USDA's national biomass report, which once carried corn stalk prices by state, was discontinued on Feb 28, 2025, according to a search-result summary of its final editions; we did not open them [29]. The Kansas prices are delivered. At Nebraska's $5.28 per loaded mile on a 20-ton load [8], a 50-mile haul is $13.20 a ton, which puts $107.50 delivered at about $94 at the field. That agrees with central Nebraska's $90.
The $45 gap between central and western Nebraska has a cause. The Kansas report describes extreme drought across much of Colorado and Wyoming and parts of western Nebraska, with hay moving toward the dry areas [11]. The Nebraska report adds that producers baling stalks are "somewhat disappointed with the bales per pivot" and that bales are lighter than usual [10].
| Where a $90 ton goes (central Nebraska, FOB) | $/ton | |
|---|---|---|
| Baling, $21.22 on a 1,192-lb bale | 35.60 | ██████████ |
| Net to the seller, every nutrient replaced | 14.52 | ████░░░░░░ |
| Potash, 34 lb | 14.14 | ████░░░░░░ |
| Nitrogen, 17 lb | 10.20 | ███░░░░░░░ |
| Moving bales off the field | 5.45 | ██░░░░░░░░ |
| Raking, $9.67/acre over 2.0 tons | 4.84 | █░░░░░░░░░ |
| Phosphate, 4 lb | 3.75 | █░░░░░░░░░ |
| Sulfur, 3 lb at an assumed $0.50 | 1.50 | ░░░░░░░░░░ |
Basis: $/ton as sold. Sources: USDA AMS, Oct 8, 2026 [10]; University of Nebraska–Lincoln, 2026 [8] and Dec 7, 2017 [2]; Iowa State University, Mar 2026 [9]; DTN/Progressive Farmer, Oct 7, 2026 [1]. All rows are Crop Root Zone calculations; bars scaled to baling.
$75.48 a ton
Break-even price at the field for custom-baled corn stalks in Nebraska with nitrogen, phosphate, potash and sulfur all replaced at retail. With phosphate and half the potash replaced it is $56.71. (Crop Root Zone calculation from University of Nebraska–Lincoln, 2026 [8] and Dec 7, 2017 [2], and DTN/Progressive Farmer, Oct 7, 2026 [1])
Baling is the largest line, and it is charged per bale. The light bales AMS describes raise it directly: at 1,000 lb a bale the same $21.22 is $42.44 a ton, not $35.60.
3. Renting the stalks: $9 to $21 an acre in Iowa, and what the cattle take
What's new: Iowa State's 2026 cash rent survey puts cornstalk grazing at $13 an acre statewide, from $9 in the southwest district to $21 in the central district (Iowa State University, May 2026) [13]. We found no statewide 2026 figure for Nebraska or Kansas. Nebraska's 2026 custom-rate report and its 2025 livestock-services report carry cornstalk baling lines and no stalk-grazing rent [8][28].
Evidence:
| Source | Rate | Date | Basis |
|---|---|---|---|
| Iowa, state average | $13/acre | May 2026 | Survey of typical rates; fall or winter grazing |
| Iowa, district range (8 of 9 districts reported) | $9–$21/acre | May 2026 | Southwest lowest, central highest |
| Iowa, state average, prior | $19/acre | 2024, stale | As reported by Iowa Beef Center; range $9–$34 |
| Nebraska, Dawson County area, renter fences | $14.56/acre | Jan 2025, stale | County survey, more than 30 responses |
| Nebraska, Dawson County area, landowner fences | $17.00/acre | Jan 2025, stale | Same survey |
| Nebraska, most commonly reported | $15/acre | 2017, stale | As cited by UNL in 2019 |
| Kansas, regional average | $7.50/acre | 2017, stale | As cited by UNL in 2019 |
| South Dakota guidance | $0.50–$2.00/head/day | Oct 2024 | Extension range; $1–$10/acre for extended stays |
| Kansas State worked example | $0.50–$1.00/head/day | Nov 2022 | Illustration, not a survey |
Sources: Iowa State University, Cash Rental Rates for Iowa 2026 Survey, May 2026 [13]; Iowa Beef Center, Oct 2024 [23]; Nebraska Extension, Dawson County, Jan 2, 2025 [14]; University of Nebraska–Lincoln, Jul 31, 2019 [24]; SDSU Extension, Oct 23, 2024 [15]; Kansas State University, Nov 2022 [16]. We did not open Iowa's 2025 edition, so we cannot say when the fall from $19 occurred.
What grazing removes is small. Nebraska worked the case of a pregnant cow grazing 90 days at 1.3 acres per cow on 230-bushel corn. The cattle took 966 lb of dry matter an acre, 14% of the residue. Net nitrogen removal was 2.11 lb an acre. Potassium removal was 0.06 lb. Phosphorus and calcium were net additions, because the mineral supplement brought in more than the cow carried off (University of Nebraska–Lincoln, Nov 5, 2018) [17]. At $0.60 the nitrogen is $1.27 an acre.
The yield record is long and it favors grazing. In an irrigated corn–soybean rotation at Mead, Nebraska, from 2003 to 2013, soybeans yielded about 2 to 3 bushels more after grazed corn residue, whether the grazing was in fall or spring. A five-year fall-grazing study in continuous corn at Brule found no effect on the following corn crop [18]. Sixteen years of data showed no compaction from fall or early spring grazing. Late spring grazing on wet ground roughened the surface, slowed the planter and raised the down pressure needed from 265 to 290 lb (University of Nebraska–Lincoln, Oct 1, 2024) [19]. The 2024 article says long-term grazing improved corn yields as well as soybean yields. It gives no bushel figure, and the earlier Nebraska summaries report no corn effect, so we count none.
Stocking sets the per-head arithmetic. Nebraska's table gives 57 grazing days for one 1,200-lb cow per acre on 200-bushel corn [18]. Kansas State's method gives about 62 days for a 1,300-lb cow [16].
Ground Truth: The per-acre rents are cheap against the per-head rates, and the landowner is the one who should notice. Thirteen dollars an acre spread over 57 cow-days is 23 cents a head a day. Dawson County's $14.56 and $17.00 are 26 and 30 cents. The lowest per-head figure in any extension publication we found is 50 cents, which on the same field is $28.50 an acre. Per-acre pricing leaves the weather risk with the cattle owner, who pays whether or not snow closes the field in December, and that is worth a discount. It is not obviously worth half. A grower with a fenced field and water on 200-bushel corn should quote by the head and the day, and Kansas State prefers that basis for a second reason: it gets the cattle off the field early [16].
4. Leaving it: free in cash, and not always free in bushels
What's new: Nothing published this year changes the trial record. It is worth restating because it cuts against the instinct that residue left is always yield kept.
Evidence:
| Trial | System | Removal | Result for the next corn crop | At $4.70 corn, $/acre* |
|---|---|---|---|---|
| Mead, Nebraska, 10 years | Irrigated continuous corn, no-till | 40% baled | +15 bu/acre | +70.50 |
| Mead, Nebraska, 10 years | Irrigated continuous corn, disk-till | 40% baled | +5.8 bu/acre | +27.26 |
| Mead, Nebraska, 10 years | Rainfed continuous corn, no-till | 50% baled | −1.9 bu/acre; significant only at the lowest N rate | −8.93 |
| Five Nebraska sites, 2 years | Baled, grazed and untouched strips | Baled or grazed | 234, 239 and 223 bu/acre; no significant difference | 0 |
| Meta-analysis, 36 studies, 239 site-years | Mostly Corn Belt | Various | +3% on average | n/a |
Sources: University of Nebraska–Lincoln, CropWatch, Dec 8, 2017 [20]; Ulmer et al., 2017 Nebraska Beef Cattle Report (abstract only; we could not open the full report) [21]. *Crop Root Zone calculation at USDA's October season-average farm price of $4.70 [25]. Trial results, not forecasts for any one field.
The cost of removal shows up later and off the yield monitor. Soil organic carbon in the top foot fell in every irrigated Mead treatment except no-till with nothing removed. Nebraska's authors put the retention needed to hold soil carbon in no-till at 2.4 tons an acre a year, and they warn that removal for more than three years in a row showed longer-term soil effects [20]. On an 8% slope at York, sediment loss was 30% greater with 53% removal [20]. Nebraska's 2007 guidance says little if any stover should come off medium- and high-erodibility rainfed soils, and reports losses of more than 40 bushels the next year where removal met a water deficit [3]. That figure is 19 years old and predates the Mead results. We cite it as the tail risk, not the expectation.
Leaving the residue costs money only when something is bought to manage it. On Oct 1 we priced fall residue sprays at $10 to $39 an acre applied and found one significant decay result in seven independent studies [26]. A grower in irrigated no-till corn-on-corn who is weighing a spray to deal with heavy residue has a cheaper experiment available. The Mead trial took 40% of the residue off with a baler and gained 15 bushels.
5. The net per acre, three ways, at 200 bushels
What's new: Put on one acre, the three options are closer than the per-ton prices suggest, and the ranking turns on two inputs a grower already knows: the soil-test potassium and the distance to cattle.
Evidence:
| Option, 200-bu corn | Gross, $/acre | Custom harvest, $/acre | Nutrients replaced, $/acre | Net, $/acre* | Basis |
|---|---|---|---|---|---|
| Bale 2.0 tons, $90/ton, all N-P-K-S replaced | 180.00 | 91.78 | 59.17 | 29.05 | Central Nebraska, FOB |
| Bale 2.0 tons, $90/ton, P and K replaced | 180.00 | 91.78 | 35.77 | 52.45 | Same; no N or S charge |
| Bale 2.0 tons, $90/ton, P and half of K replaced | 180.00 | 91.78 | 21.63 | 66.59 | Same; high-K soil, top of UNL's 0–50% range |
| Bale 2.0 tons, $135/ton, all N-P-K-S replaced | 270.00 | 91.78† | 59.17 | 119.05 | Western Nebraska, FOB, large squares |
| Graze, $13/acre | 13.00 | 0 | 1.27 | 11.73 | Iowa 2026 state average |
| Graze, $17/acre, landowner fences | 17.00 | 0 | 1.27 | 15.73 | Dawson County, Jan 2025, stale; fence cost not deducted |
| Graze, $0.50/head/day, 57 cow-days | 28.50 | 0 | 1.27 | 27.23 | Lowest published per-head rate, full stocking |
| Leave it | 0 | 0 | 0 | 0 | No residue product bought |
Sources: USDA AMS, Oct 8, 2026 [10]; University of Nebraska–Lincoln, 2026 [8], Dec 7, 2017 [2] and Nov 5, 2018 [17], and undated stocking table [18]; Iowa State University, Mar 2026 [9] and May 2026 [13]; Nebraska Extension, Dawson County, Jan 2, 2025 [14]; SDSU Extension, Oct 23, 2024 [15]; DTN/Progressive Farmer, Oct 7, 2026 [1]. *Crop Root Zone estimates. No yield effect, lime, fuel surcharge or seller's own time is included. †Round-bale custom costs applied to a large-square trade; an approximation.
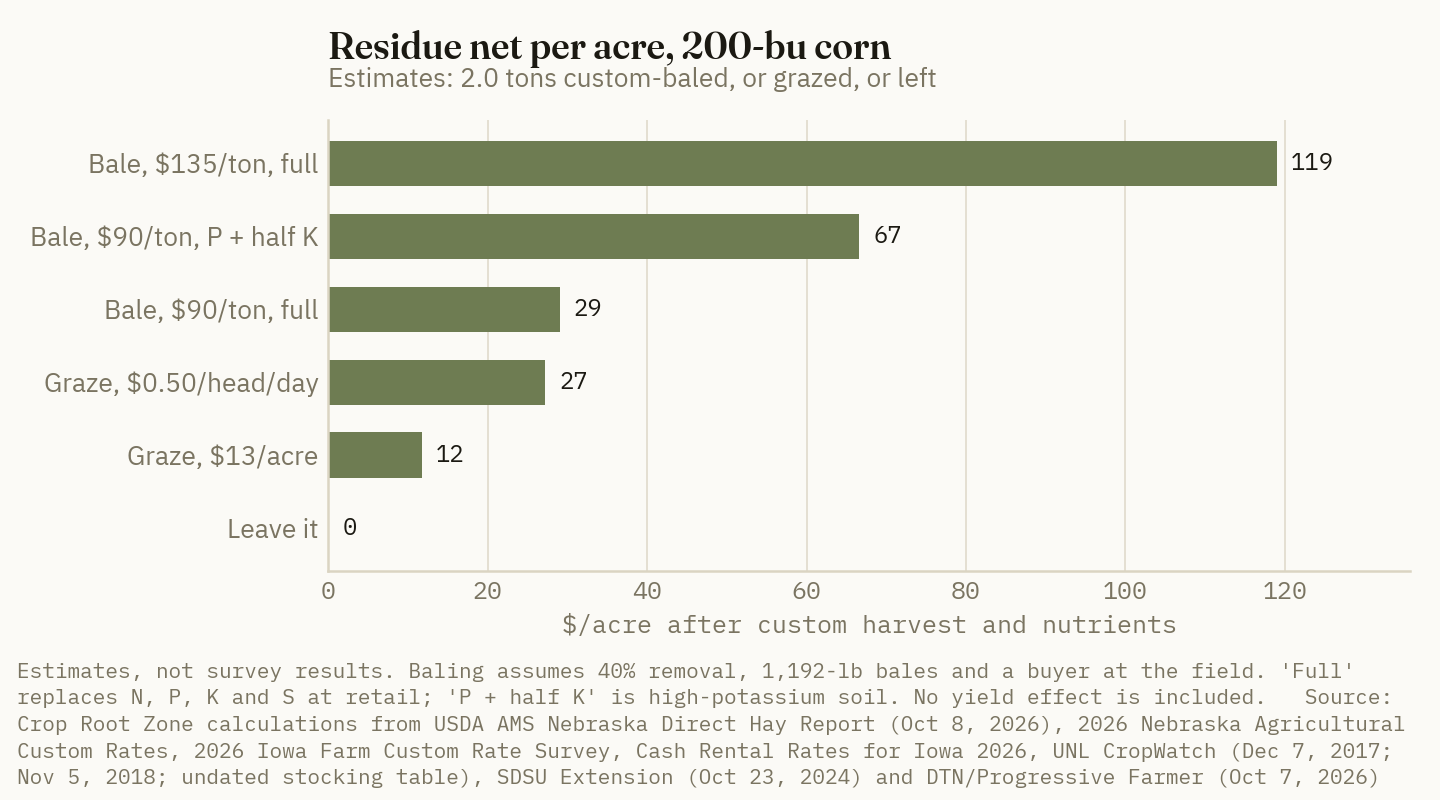
Where baling wins. Irrigated, flat, high-potassium ground within about 50 miles of a feedlot or a drought-short cow herd. There the bill is $11 a ton, not $30, the trial record shows no yield penalty and some gain, and five tons of residue leaves three after the baler, above Nebraska's 2.4-ton line. It wins by more in western Nebraska this fall. It should not be taken every year. Nebraska's authors found longer-term soil effects after more than three consecutive years of removal [20].
Where grazing wins. Rainfed ground, sloping ground, and ground testing below optimum for potassium, where the full $29.58 is owed and a $90 ton nets $29 an acre before any fuel surcharge. A 20% rise in custom charges takes that to $10.69, below Iowa's average grazing rent. Grazing also wins wherever stalks at the field bring less than about $81 a ton with full replacement, or $63 on high-potassium soil. Those are the prices at which baling only matches $11.73.
Where leaving it wins. Where there is no buyer within hauling distance and no cattle within trailering distance, which describes much of the eastern Corn Belt. Iowa's hay report carried no corn stalk trade last week [12]. It also wins on any field where erosion sets the residue requirement.
What would change the answer. A stalk price under $75 turns full-replacement baling negative. Bales at 1,000 lb add $6.84 a ton to cost. Potash at $600 would add $2.86 a ton to the full bill, which is small next to either. A wet fall that leaches the stalks before baling lowers the potash bill and raises the baling cost at once. And a published Nebraska or Kansas stalk rent for 2026 would replace the stale county and 2017 figures we had to use.
Ground Truth: The baling margin is mostly a labor and machinery margin. Of the $91.78 an acre in custom charges, a grower who owns a rake, a baler and a tractor keeps whatever part exceeds his own fuel, wrap and wear, and that is why baling persists where the hired arithmetic is thin. For the grower who has to hire it, the choice this fall is between about $12 an acre for no work and $29 to $67 for a second harvest in the busiest month of the year, with the high end available only to those who have a recent soil test showing potassium to spare. Without that test, price the full $29.58. Do not sell stalks on a per-acre handshake. The bale count and the bale weight are the product, and this year both are running light.
What we could not establish: a current retail sulfur price for the Corn Belt, a 2026 stalk-grazing rate for Nebraska or Kansas, any public price for stalks sold in the windrow, and the fuel adjustment custom balers are charging this fall.
References
- DTN/Progressive Farmer, Russ Quinn, "UAN32 Leads Fertilizer Prices Higher," Oct 7, 2026 (retail survey Sep 28–Oct 2, 2026) — https://www.dtnpf.com/agriculture/web/ag/crops/article/2026/10/07/uan32-leads-fertilizer-prices-higher
- J. Brhel, M. Schmer and C. Wortmann, "Corn Stover Removal: Nutrient Value of Stover and Impacts on Soil Properties," University of Nebraska–Lincoln CropWatch, Dec 7, 2017 — https://cropwatch.unl.edu/2017/corn-stover-removal-nutrient-value-stover-and-impacts-soil-properties
- C. Wortmann, W. Wilhelm and R. Klein, "Considerations for the Harvest of Corn Stover," University of Nebraska–Lincoln CropWatch, Nov 16, 2007 — https://cropwatch.unl.edu/considerations-harvest-corn-stover
- J. Sawyer and A. Mallarino, "Nutrient Removal When Harvesting Corn Stover," Iowa State University Agronomy Extension, Soil Fertility Current Topic, Sep 2019 — https://www.agronext.iastate.edu/soilfertility/currenttopics/CornStoverHarvest_2019.pdf
- C. Sheaffer, J. Lamb and C. Rosen, "Harvesting corn stover," University of Minnesota Extension, Minnesota Crop News, Mar 4, 2024 — https://blog-crop-news.extension.umn.edu/2024/03/harvesting-corn-stover.html
- J. Camberato, stover nutrient removal note, Purdue University Corny News Network, Oct 10, 2008 — https://www.agry.purdue.edu/ext/corn/news/articles.08/stovernutrients-1010.html
- A. Saeugling, "Nutrient Replacement with Corn and Soybean Stover Removal," Iowa State University Extension and Outreach, Integrated Crop Management, Oct 14, 2024 (cites PM 1688 and PM 3052C, which we did not open) — https://crops.extension.iastate.edu/post/nutrient-replacement-corn-and-soybean-stover-removal
- G. McClure and J. Jansen, "2026 Nebraska Agricultural Custom Rates," University of Nebraska–Lincoln Center for Agricultural Profitability, 2026 (108 responses; rates reflect late winter 2025 and early 2026) — https://cap.unl.edu/sites/unl.edu.ianr.agecon.center-for-ag-profitability/files/media/file/2026-nebraska-custom-rates-report_ada.pdf
- A. Johanns and C. Hart, "2026 Iowa Farm Custom Rate Survey," Iowa State University Ag Decision Maker File A3-10 (FM 1698), revised Mar 2026 — https://www.extension.iastate.edu/agdm/crops/pdf/a3-10.pdf
- USDA AMS Livestock, Poultry and Grain Market News, Nebraska Direct Hay Report, Oct 8, 2026 (week ending Oct 9) — https://www.ams.usda.gov/mnreports/ams_2935.pdf
- USDA AMS Livestock, Poultry and Grain Market News, Kansas Direct Hay Report, Oct 2, 2026 (week ending Sep 25) — https://www.ams.usda.gov/mnreports/ams_2885.pdf
- USDA AMS Livestock, Poultry and Grain Market News, Iowa Direct Hay Report, Oct 6, 2026 (week ending Oct 9) — https://www.ams.usda.gov/mnreports/ams_2807.pdf
- A. Johanns, "Cash Rental Rates for Iowa 2026 Survey," Iowa State University Ag Decision Maker File C2-10 (FM 1851), revised May 2026 (district summary, p. 12) — https://www.extension.iastate.edu/agdm/wholefarm/pdf/c2-10.pdf
- T. Mues, "2025 Dawson County Area Price & Rent Survey," Nebraska Extension, Jan 2, 2025 — https://extension.unl.edu/sites/unl.edu.ianr.extension/files/media/file/2025%20Land%20Rent%20Results.pdf
- H. Gessner, "Corn Stalk Rental Rates," SDSU Extension, updated Oct 23, 2024 — https://extension.sdstate.edu/corn-stalk-rental-rates
- G. McClure, "Grazing Crop Residue," Kansas State University Department of Agricultural Economics, Nov 2022 — https://www.agmanager.info/sites/default/files/pdf/CropResidueGrazing_McClure_11-21-22.pdf
- M. Drewnoski and D. Redfearn, "Nutrient Removal by Cows Grazing Corn Residue," University of Nebraska–Lincoln CropWatch, Nov 5, 2018 — https://cropwatch.unl.edu/2018/nutrient-removal-cows-grazing-corn-residue
- M. Drewnoski and D. Redfearn, "Grazing Corn Residue: A Win-Win for Crop and Cattle Producers," University of Nebraska–Lincoln CropWatch, undated, accessed Oct 13, 2026 — https://cropwatch.unl.edu/grazing-corn-residue-win-win-crop-and-cattle-producers
- M. Drewnoski, "How Grazing Corn Residue Affects the Soil," University of Nebraska–Lincoln BeefWatch, Oct 1, 2024 — https://beef.unl.edu/beefwatch/2024/how-grazing-corn-residue-affects-soil-0
- J. Brhel, M. Schmer and C. Wortmann, "Crop Residue Removal: Impacts on Yield," University of Nebraska–Lincoln CropWatch, Dec 8, 2017 — https://cropwatch.unl.edu/2017/residue-removal-impacts-yield
- K. Ulmer, J. Cox, M. Rakkar, R. Bondurant, H. Blanco-Canqui, M. Drewnoski, K. Jenkins, J. MacDonald and R. Rasby, "Effect of Corn Residue Grazing or Baling on Subsequent Crop Yield and Nutrient Removal," 2017 Nebraska Beef Cattle Report, MP104 (abstract page read; the full-text PDF could not be opened) — https://digitalcommons.unl.edu/animalscinbcr/1003
- USDA AMS Livestock, Poultry and Grain Market News, Illinois Production Cost Report (Bi-weekly), Oct 2, 2026 — https://www.ams.usda.gov/mnreports/ams_3195.pdf
- E. Lundy-Woolfolk, article on corn residue rental rates, Iowa Beef Center, Growing Beef newsletter, vol. 15, issue 4, Oct 2024 — https://www.iowabeefcenter.org/gb/2024/October2024ResidueRentalRates.html
- J. Parsons, D. Redfearn and M. Drewnoski, "The Value of Grazed Corn Residue for Crop and Cattle Producers," University of Nebraska–Lincoln CropWatch, Jul 31, 2019 (2017 rental rates and acreage shares) — https://cropwatch.unl.edu/2019/value-cattle-corn-residue/
- Crop Root Zone, TRZ-0271, "USDA Put 282 Million More Bushels in the Corn Carryout, 172 Million Over the Trade.," Oct 12, 2026 (USDA WASDE-676 season-average corn price of $4.70; the WASDE was not reopened for this piece).
- Crop Root Zone, TRZ-0249, "Mosaic's New $10 Residue Enzyme Needs 1.9 Bushels of 2027 Corn. Its Best Published Stand Gain Is Worth About 1.5.," Oct 1, 2026.
- Crop Root Zone, TRZ-0267, "A Ton of Alfalfa Hay Carries Off $27 to $33 of Phosphate and Potash, 13% to 16% of the $206 Farm Price.," Oct 9, 2026.
- G. McClure, J. Jansen and J. Parsons, "Custom Service Rates Related to Livestock Production in Nebraska," University of Nebraska–Lincoln Center for Agricultural Profitability, 2025 — https://cap.unl.edu/sites/unl.edu.ianr.agecon.center-for-ag-profitability/files/media/file/nebraska-custom-rates-livestock-2025_ada.pdf
- USDA AMS Livestock, Poultry and Grain Market News, National Biomass report (AMS_2804), discontinued Feb 28, 2025 (not opened; the discontinuation date is from a search-result summary of the report's final editions) — https://www.ams.usda.gov/mnreports/ams_2804.pdf
Disclosures
Crop Root Zone is an independent publication. Nothing here is investment advice. Market calls, where included, reflect the editors' own read and are not a recommendation to buy or sell any security.
A Point of Moisture Costs 2.8 Cents a Bushel to Remove in a Mixed-Flow Dryer at Iowa's October Propane and 4.1 Cents in an Old Cross-Flow. Natural Air Costs 4.4, and Five Elevator Schedules Charge 4.5 to 7 Cents Once Shrink Is Counted.
Dryer design now moves the cost of a point more than the propane price does. At EIA's October 12 Iowa propane price, a 3,000-Btu cross-flow dryer burns 50% more fuel per point than a 2,000-Btu mixed-flow or heat-recovery unit. In Ohio and Indiana the old dryer costs more per point than some elevators charge for the wettest points. Natural-air fans cost more per point than a 2,000-Btu propane dryer in all six Corn Belt states we priced, so natural air pays through low capital and gentle drying, not through energy.
The propane price is only half of what a point of drying costs, and it is the half a grower cannot change. EIA's weekly survey put Iowa residential propane at $1.667 a gallon on October 12, up 3.4 cents in a week. Wholesale propane in Iowa rose 9.8 cents over the same week to $1.098 (EIA, Oct 15, 2026) [1][2]. The other half is how many Btu the dryer burns to drive off a pound of water. Extension engineers put that between about 2,000 Btu for a mixed-flow or heat-recovery dryer and about 3,000 Btu for a well-maintained cross-flow dryer with no energy features (University of Wisconsin Extension, Dec 2012) [6]. That 50% spread is worth more per bushel than any move in propane this fall. Our September piece on field drydown (TRZ-0216) priced a single average dryer against the calendar [20]. This piece prices the dryers themselves. It compares each design against this week's propane and power prices in six states and against what five elevators charge. The answer depends on which dryer a farm owns and on the shape of the local elevator's schedule, more than on the propane bid.
1. Btu per pound of water sets the cost of a point
What's new: The extension rules of thumb that growers use, 0.018 gallon of propane per bushel-point from Iowa State and 0.02 from North Dakota State, are averages over designs that differ by about 50% in fuel use [3][7][8].
Evidence: The conversion is simple. North Dakota State's rule assumes 0.72 pound of water removed per bushel per point, 2,500 Btu per pound of water and 91,500 Btu in a gallon of propane. That gives 0.72 × 2,500 ÷ 91,500 = 0.0197 gallon (NDSU assumptions as indexed in Farm Progress, Dec 11, 2019) [7]. Iowa State's 0.018-gallon average implies about 2,290 Btu per pound on the same basis, with a range of 0.010 to 0.025 gallon. It adds about 0.01 kWh of fan electricity per bushel-point (Purdue Center for Commercial Agriculture, from Iowa State Ag Decision Maker, Sep 13, 2014) [8]. Wisconsin Extension engineer Scott Sanford puts cross-flow dryers at about 2,000 Btu per pound with energy-saving features in place and about 3,000 Btu for a well-maintained dryer without them. In-bin continuous-flow counterflow dryers and mixed-flow dryers run near 2,000 Btu, 20% to 30% less than a traditional cross-flow (UW Extension ENCON2.3, Dec 2012) [6]. Ontario's agriculture ministry gives a cross-flow example of 860,000 kJ, or 34 litres of propane, to take a tonne of corn from 25% to 15%. That works out to about 2,760 Btu per pound of water (OMAFRA Factsheet 17-001) [11]. Field audits vary more widely. A 2011 Wisconsin study of 10 high-temperature systems measured 1,800 to 3,700 Btu per pound. An Alberta monitoring study found 1,700 to more than 6,000 for continuous dryers and 1,300 to nearly 8,000 for fuel-fired in-bin dryers (Farmtario, Nov 4, 2021) [12].
| Dryer design | Btu per lb water | Propane, gal/bu-pt* | Iowa, $1.48 farm, ¢/bu-pt* | Iowa, $1.667 residential, ¢/bu-pt* | Ohio, $2.615 residential, ¢/bu-pt* |
|---|---|---|---|---|---|
| Cross-flow, no heat recovery or controls | 3,000 | 0.0236 | 3.6 | 4.1 | 6.3 |
| NDSU planning figure | 2,500 | 0.0197 | 3.0 | 3.4 | 5.3 |
| Iowa State 0.018-gal average (implied) | ~2,290 | 0.0180 | 2.8 | 3.1 | 4.9 |
| Mixed-flow, in-bin counterflow, or cross-flow with heat recovery | 2,000 | 0.0157 | 2.5 | 2.8 | 4.3 |
| Audited upgraded dryer (one case) | 1,841 | 0.0145 | 2.3 | 2.6 | 3.9 |
Sources: UW Extension ENCON2.3, Dec 2012 [6]; NDSU assumptions via Farm Progress, Dec 11, 2019 [7]; Iowa State AgDM via Purdue CCA, Sep 13, 2014 [8]; audited figure from Farm Progress, Aug 1, 2010, search-indexed text [13]; USDA AMS Iowa Production Cost Report, Sep 18, 2026 [3]; EIA residential propane, Oct 12, 2026 [1]; EIA commercial electricity, Jul 2026 (Iowa 13.27¢, Ohio 14.06¢/kWh) [4]. *Crop Root Zone calculations at 0.72 lb water/bu-pt and 91,500 Btu/gal, plus 0.01 kWh/bu-pt of fan power. Real dryers vary with plenum temperature, airflow, outdoor temperature and maintenance.
Two cautions apply. First, EIA's residential price is an upper bound for a farm buying in bulk. Iowa's last farm print from USDA was $1.48 on September 18, when EIA's Iowa residential series was not yet running [3]. On October 5, EIA's Iowa residential price was $1.633 [1]. Second, cold weather raises every figure in the table. Iowa State estimates drying cost rises about 14% for every 20°F drop in average outdoor temperature (Iowa State ICM News, Oct 20, 2022) [9].
Ground Truth: A grower comparing propane bids a dime apart is negotiating over about 0.2 cent a bushel-point. A grower running a 3,000-Btu dryer next to a neighbor's 2,000-Btu dryer is paying 1.3 cents more per point at Iowa's price, about six times as much. Before this fall's last fill, the useful question for the dealer is less what the gallon costs than how many gallons the dryer actually burns per bushel-point. A farm can measure it. Gallons metered against bushels and moisture in and out over one week would show which row of the table its dryer belongs in.
2. Where propane is cheap, and where power is
What's new: EIA's weekly survey resumed for the heating season in October. It shows propane in the western Corn Belt priced well below the eastern Corn Belt. Electricity follows a different map.
Evidence: On October 12, residential propane ranged from $1.647 in North Dakota and $1.667 in Iowa to $2.490 in Indiana and $2.615 in Ohio. Wholesale prices were much tighter, $1.02 to $1.17 [1][2]. So most of the east-west gap is delivery and retail margin, not supply cost. Commercial electricity in July ranged from 8.22¢ per kWh in North Dakota and 9.39¢ in Nebraska to 15.19¢ in Illinois (EIA, Sep 24, 2026) [4].
| State | Residential propane, $/gal, Oct 12 | Wholesale propane, $/gal, Oct 12 | Commercial power, ¢/kWh, Jul | Mixed-flow, ¢/bu-pt* | Natural air, ¢/bu-pt* | |
|---|---|---|---|---|---|---|
| Nebraska | 1.718 | 1.069 | 9.39 | 2.8 | 3.1 | ███████░░░ |
| Iowa | 1.667 | 1.098 | 13.27 | 2.8 | 4.4 | ██████░░░░ |
| Illinois | 1.904 | 1.089 | 15.19 | 3.2 | 5.0 | ███████░░░ |
| Minnesota | 1.964 | 1.155 | 13.49 | 3.2 | 4.5 | ███████░░░ |
| Indiana | 2.490 | 1.145 | 13.30 | 4.1 | 4.4 | █████████░ |
| Ohio | 2.615 | 1.147 | 14.06 | 4.3 | 4.6 | ██████████ |
Sources: EIA Weekly Heating Oil and Propane Prices, released Oct 15, 2026 [1][2]; EIA Electric Power Monthly Table 5.6.A, Jul 2026 data, released Sep 24, 2026 [4]. *Crop Root Zone calculations. Mixed-flow is 2,000 Btu/lb at residential propane plus 0.01 kWh/bu-pt. Natural air is 0.33 kWh/bu-pt at commercial power; at residential power rates it is 4.6 to 6.4¢. Bars scale the mixed-flow cost; 4.3¢ = 10.
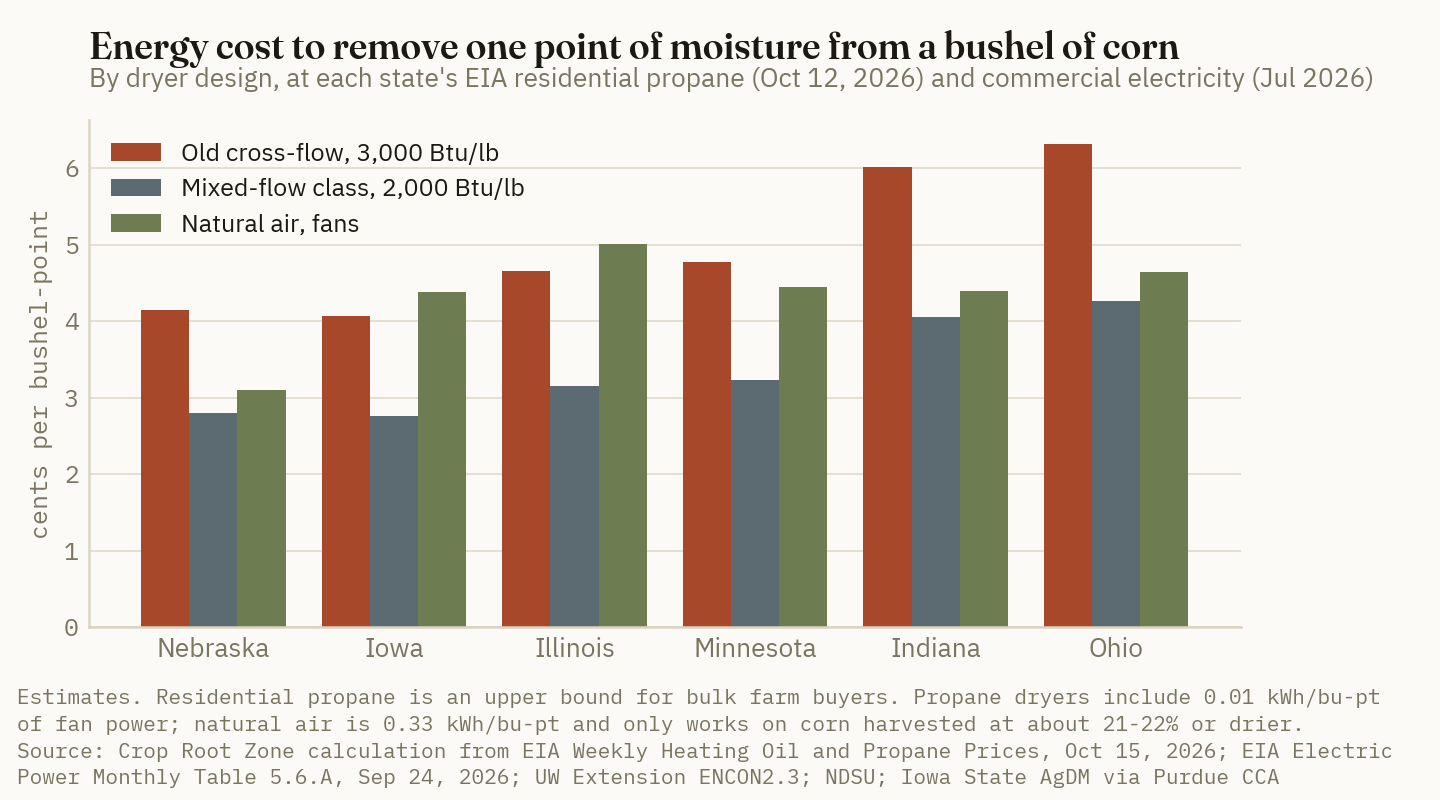
Natural air needs a separate note. It is the most efficient method in Btu terms, at about 1,200 to 1,500 Btu per pound (Farmtario, Nov 4, 2021) [12]. But a kWh of electricity costs far more than the same Btu from propane. Iowa State's natural-air average is 0.33 kWh per bushel-point, with a range of 0.30 to 0.40 [8]. At Iowa's commercial rate that is 4.4 cents, more than a modern propane dryer at $1.667 propane. The two cost the same only when propane reaches about $2.16 a gallon against a 2,500-Btu dryer (Crop Root Zone calculation).
$2.16 a gallon
The Iowa propane price at which a 2,500-Btu cross-flow dryer and natural-air fans cost the same per bushel-point, at Iowa's 13.27¢ commercial power. Iowa propane is 50 cents below it, and Ohio and Indiana are above it. (Crop Root Zone calculation from EIA, Oct 15 and Sep 24, 2026; Iowa State AgDM)
3. What the elevator really charges per point
What's new: Elevator drying charges posted for the 2026 harvest cluster at 4 to 6 cents per point. The shrink factor adds a second, less visible charge that is larger than many growers assume.
Evidence: Water loss alone from a given moisture down to 15% is 1/85, or 1.176% of wet weight per point. Elevators shrink 1.4% or 1.5% a point. The difference, 0.22 to 0.32 percentage point, covers handling loss and margin. At Iowa's October 16 state average cash corn price of $4.32 (USDA AMS, Oct 16, 2026) [5], it is worth 1.0 to 1.4 cents per point. Legacy Grain Cooperative in Illinois, effective September 2026, charges 2.5 cents per half point over 15% with a 1.4 shrink [14]. Five Star Cooperative in Iowa charges 5 cents per point with a 1.5% shrink for its 2026–27 policy year [15]. Cedar County Co-op in Iowa charges 4 cents below 24% moisture and 6 cents above, with a 1.4% shrink [16]. Two Illinois schedules taper. Ludlow Co-op's 2025–26 sheet charges 4.5 cents a point from 15.1% to 20% and 2.5 cents above, according to its search-indexed text [17]. Evergreen FS's 2025 crop policy rises 5 cents a point to 25 cents at 20%, then 2 cents a point above that [18].
| Schedule | Drying charge | Shrink | All-in at 20%, ¢/wet bu* | Per point at 20%* | Per point at 25%* | |
|---|---|---|---|---|---|---|
| Cedar County Co-op, IA (2026) | 4¢/pt <24%, 6¢ >24% | 1.4% | 24.8 | 5.0 | 7.0 | ████████░░ |
| Ludlow Co-op, IL (2025–26) | 4.5¢ to 20%, 2.5¢ above | 1.4% | 27.3 | 5.5 | 4.5 | █████████░ |
| Legacy Grain, IL (Sep 2026) | 2.5¢ per ½ pt | 1.4 × | 29.8 | 6.0 | 6.0 | █████████░ |
| Evergreen FS, IL (2025) | 5¢/pt to 20%, 2¢ above | 1.4% | 29.8 | 6.0 | 4.5 | █████████░ |
| Five Star Co-op, IA (2026–27) | 5¢/pt | 1.5% | 32.0 | 6.4 | 6.4 | ██████████ |
Sources: Legacy Grain Cooperative, Grain Discount Schedule effective Sep 2026 [14]; Five Star Cooperative, 2026–2027 Grain Policies [15]; Cedar County Co-op, Grain Services 2026 [16]; Ludlow Co-op service rates, 2025–26, search-indexed text [17]; Evergreen FS, 2025 Crop Policy [18]; Iowa state average corn $4.32, USDA AMS, Oct 16, 2026 [5]. *Crop Root Zone calculations: drying charge plus shrink in excess of 1.176% water loss per point, valued at $4.32. Cedar County's 6¢ rate is applied to every point on a load above 24%; the co-op should confirm whether it applies only to points above 24%. Bars scale the all-in charge at 20%; 32.0¢ = 10.
Set against an owned dryer, the comparison has to include the farm's own handling. Iowa State's worked example uses a 1% handling loss, and Purdue's budget adds about 1 cent a bushel to move grain through the dryer [8][9]. With those included, 20% corn dried in Iowa costs an estimated 19 cents a wet bushel in a 2,000-Btu dryer and 26 cents in a 3,000-Btu dryer, against 25 to 32 cents at the five elevators. At 25% the owned-dryer figures are 33 and 46 cents, against 45 to 70 cents at the elevators (Crop Root Zone estimates). In Ohio, at $2.615 propane, the old cross-flow costs 37 cents at 20% and 68 cents at 25%. That is more than the tapering Illinois schedules charge for the same corn.
Ground Truth: The marginal point is where the schedules differ most. Above 20%, Ludlow and Evergreen charge 2 to 2.5 cents a point. With the extra shrink, that comes to 3.0 to 3.5 cents, which is below the energy alone of a 3,000-Btu cross-flow dryer at this week's residential propane price in every one of the six states we priced. A grower with an old dryer and a tapering elevator nearby should split the crop. The wettest loads should go to town, and the owned dryer should handle corn in the high teens and low 20s, where it is the cheaper option. Where the local schedule is flat or rises with moisture, as at Cedar County, the logic reverses, and the owned dryer should take the wettest corn.
4. Choosing a dryer type, or upgrading the one on the farm
What's new: No extension service publishes a current installed price for a dryer, and the dealer prices we found online were commercial and could not be reconciled. What can be measured from public sources is the energy each design saves, and the practices that change it.
Evidence: Iowa State's 2026 custom rate survey gives a market check on the full cost of drying, including fuel, electricity and labor. Continuous-flow drying has a median of 6.0 cents a bushel-point, with a range of 2.5 to 9.0 cents from 21 responses. Bin drying has a median of 5.5 cents from 10 responses (Iowa State AgDM A3-10, Mar 2026) [10]. At Iowa's October propane, energy is 2.8 to 4.1 cents of that. That leaves roughly 2 to 3 cents a point for labor, repairs, capital and margin (Crop Root Zone estimate). Wisconsin Extension lists the main energy savings available on an existing dryer [6]:
| Change | Energy saving | Capacity effect | Saving on 900,000 bu-pts a year, Iowa $1.667* | |
|---|---|---|---|---|
| Replace 3,000-Btu cross-flow with 2,000-Btu design | ~33% | Varies | ~$11,900 | ██████████ |
| Dryeration (dump 2–3 pts wet, steep 4–12 h, cool in bin) | ~25% | Up to +70% | ~$7,700 | ██████░░░░ |
| Heat recovery on a column dryer | 10–30% | Slight loss if air recycled | ~$3,000–8,900 | █████░░░░░ |
| In-storage cooling (dump 1–1.5 pts wet) | ~15% | About +33% | ~$4,600 | ████░░░░░░ |
Sources: UW Extension ENCON2.3, Dec 2012 [6]; OMAFRA Factsheet 17-001 [11]; EIA, Oct 15, 2026 [1]. *Crop Root Zone estimates for a farm drying 150,000 bushels an average 6 points. Savings are applied to a 2,500-Btu baseline (3.41¢/bu-pt), except the replacement row, which compares 3,000 and 2,000 Btu. Savings do not add in full when combined. In Ohio, multiply by about 1.55. Bars scale the central saving (heat recovery at its ~$5,900 midpoint); $11,900 = 10.
The table points to a ranking of options. The cooling practices cost little to adopt and also add capacity, which matters most in a wet fall. Dryeration's up-to-70% capacity gain is worth more than its fuel saving in a year when the dryer limits the harvest. Wisconsin warns that dryeration produces heavy condensation on bin walls, so the corn must be moved to another bin [6]. A full replacement saves about $12,000 a year in Iowa at this scale and about $18,600 in Ohio. We found no public installed price to run a payback against. A grower can run it on the dealer's quote: Iowa State budgets drying systems over a 20- to 25-year life [8], so the question is whether about $12,000 a year, plus any capacity and grain-quality gain, covers the annual cost of that quote. Mixed-flow dryers also handle small seeds, and Wisconsin notes U.S. corn growers have adopted them slowly, possibly because of higher capital cost [6].
Natural air has limits that depend on moisture, not price. Nebraska Extension sets minimum airflow at 1.0 cfm per bushel for corn up to 18%, 1.25 cfm to 20% and 1.5 cfm to 22% (Nebraska CropWatch, Mar 22, 2017) [19]. Iowa State calls corn above 22% a high spoilage risk for natural air [9]. Minnesota guidance, as indexed, caps 1.0 cfm per bushel at 21% for southern Minnesota, Iowa and Wisconsin [21]. Natural air is not a cheaper source of energy. Its value is that the bin and fan are often already paid for and that the grain dries gently. In combination drying, a high-temperature dryer takes corn down to about 20% and natural air finishes it, so each method works where it is strongest.
5. What it means for harvest moisture targets
What's new: A farm can set its harvest moisture target from two of its own numbers: its dryer's cost per point and its local elevator's schedule. The table below gives four common cases.
Evidence: The cost per point changes in steps across moisture bands, and the steps differ by dryer.
| Setup | Cost per point, mid-teens to 20%* | Cost per point, above 20%* | Practical harvest moisture read |
|---|---|---|---|
| 2,000-Btu dryer, western Corn Belt | ~2.8¢ + handling | ~2.8¢, rising in cold weather | Start harvest early; capacity, not cost, is the limit |
| 3,000-Btu cross-flow, Iowa | ~4.1¢ | ~4.1¢ | Compare the wettest loads with the local elevator schedule |
| 3,000-Btu cross-flow, Ohio/Indiana | ~6.0–6.3¢ | ~6.0–6.3¢ | Send loads above 20% to a tapering elevator if one is in range |
| Natural air only | 3.1–5.0¢ | Not feasible above ~21–22% | Harvest no wetter than 21% unless another dryer finishes the crop |
Sources: Sections 1–4. *Crop Root Zone estimates at EIA prices for the week of Oct 12, 2026 [1][2][4].
The same figures price the opposite mistake. Each point dried below 15% gives up about 1.16% of the bushel's sale weight, or about 5.0 cents at $4.32 corn. It also burns another 2.8 to 4.1 cents of energy, so an extra point of overdrying costs roughly 8 to 9 cents a bushel (Crop Root Zone calculation). A dryer controller that holds discharge moisture within half a point therefore saves more per bushel than most efficiency upgrades. This publication priced that loss for stored bins in TRZ-0252 [20].
Ground Truth: Most farms will not buy a dryer this fall. The decision they can make this week is whether to treat the elevator as a backup or as part of the drying plan. The comparison needs only two things: the dryer's measured cost per point and the co-op's discount sheet, read band by band. On the figures above, an Iowa farm with a modern dryer should keep almost every point at home. An eastern Corn Belt farm with an older cross-flow dryer and a tapering elevator within hauling distance is probably overpaying for its wettest corn, by about 3 cents a point.
References
- U.S. Energy Information Administration, Weekly Heating Oil and Propane Prices, Residential Propane (dollars per gallon, excluding taxes), weeks of Oct 5 and Oct 12, 2026, released Oct 15, 2026 — https://www.eia.gov/dnav/pet/pet_pri_wfr_a_epllpa_prs_dpgal_w.htm
- U.S. Energy Information Administration, Weekly Heating Oil and Propane Prices, Wholesale Propane (dollars per gallon, excluding taxes), weeks of Oct 5 and Oct 12, 2026, released Oct 15, 2026 — https://www.eia.gov/dnav/pet/pet_pri_wfr_a_epllpa_pwr_dpgal_w.htm
- USDA AMS Livestock, Poultry and Grain Market News, Iowa Production Cost Report (Bi-Weekly), week ending Sep 18, 2026 (propane $1.30–$1.67, average $1.48, F.O.B. distributor) — https://ams-prod.azureedge.us/mnreports/ams_2863.pdf
- U.S. Energy Information Administration, Electric Power Monthly, Table 5.6.A, Average Price of Electricity to Ultimate Customers by End-Use Sector, by State, July 2026 data, released Sep 24, 2026 — https://www.eia.gov/electricity/monthly/epm_table_grapher.php?t=epmt_5_6_a
- USDA AMS / Iowa Department of Agriculture Market News, Iowa Daily Cash Grain Bids, Oct 16, 2026 (state average corn $4.32, 42 under December) — https://www.ams.usda.gov/mnreports/ams_2850.pdf
- Scott Sanford, University of Wisconsin Extension, "Continuous Flow Dryers," Improving Energy Efficiency in Grain Drying Fact Sheet ENCON2.3, Dec 2012 — https://fyi.extension.wisc.edu/energy/files/2016/09/FS_FlowDryers.pdf
- North Dakota State University Extension (Ken Hellevang), propane drying-cost rule (0.02 × propane price per bushel-point; 0.72 lb water per bushel-point, 2,500 Btu per lb, 91,500 Btu per gallon), as reprinted in Farm Progress, "How dry will unharvested corn get over winter?", Dec 11, 2019; assumptions taken from search-indexed text — https://www.farmprogress.com/corn/how-dry-will-unharvested-corn-get-over-winter ; rule also in NDSU Agriculture Communication release, Oct 12, 2017 — https://www.ag.ndsu.edu/news/newsreleases/2017/oct-9-2017/corn-harvest-drying-storage-challenging-this-year
- Purdue University Center for Commercial Agriculture, "Estimating the Cost for Drying Corn" (content from Iowa State Ag Decision Maker; 0.018 gal and 0.01 kWh per bu-pt high temperature, 0.33 kWh natural air, $0.01/bu handling, 20–25 year life), Sep 13, 2014, modified Mar 2, 2020 — https://ag.purdue.edu/commercialag/home/resource/2014/09/estimating-the-cost-for-drying-corn/
- Kristina TeBockhorst, Brian Dougherty and Tony Mensing, Iowa State University Extension and Outreach, "Options for Fall Grain Drying and Marketing," Integrated Crop Management News, Oct 20, 2022 — https://crops.extension.iastate.edu/cropnews/2022/10/options-fall-grain-drying-and-marketing
- Iowa State University Ag Decision Maker A3-10, 2026 Iowa Farm Custom Rate Survey, Mar 2026 (drying corn, continuous flow: average $0.055, median $0.060, range $0.025–$0.090 per point per bushel, 21 responses; bin dryer: median $0.055, 10 responses) — https://www.extension.iastate.edu/agdm/crops/pdf/a3-10.pdf
- Ontario Ministry of Agriculture, Food and Rural Affairs, Factsheet 17-001, "Reducing Energy Use in Grain Dryers," Jan 2017, revised by James Dyck (file dated Jun 29, 2023) — https://files.ontario.ca/omafra-reducing-energy-use-in-grain-dryers-17-001-en-2023-06-29.pdf
- James Dyck, Farmtario, "Grain drying and energy efficiency: The basics" (citing Brinker and Anderly 2011 and a 3D Energy Ltd. Alberta monitoring study), Nov 4, 2021 — https://farmtario.com/news/grain-drying-and-energy-efficiency-the-basics
- Farm Progress, "PowerPoints: Save energy in grain drying and field operations" (dryer upgrade audited by GDS Associates at 1,841 Btu per lb of water), Aug 1, 2010; page returned 403, figure taken from search-indexed text — https://www.farmprogress.com/farm-business/powerpoints-save-energy-in-grain-drying-and-field-operations-
- Legacy Grain Cooperative (Illinois), Grain Discount Schedule, effective Sep 2026 — https://s3.amazonaws.com/media.agricharts.com/sites/1158/Grain%20Discounts%202026.pdf
- Five Star Cooperative (Iowa), 2026–2027 Grain Procurement Policies, accessed Oct 19, 2026 — https://www.fivestarcoop.com/grain-elevators-and-services/grain-procurement-policies/
- Cedar County Co-op (Iowa), Grain Services 2026, accessed Oct 19, 2026 — https://www.cedarcountycoop.com/grain
- Ludlow Cooperative Elevator Co. (Illinois), Service Rates, 2025–26 schedule; page could not be retrieved (expired security certificate), figures taken from search-indexed text, accessed Oct 19, 2026 — https://www.ludlowcoop.com/service-rates/
- Evergreen FS (Illinois), 2025 Crop Policy, drying rate schedule, accessed Oct 19, 2026 — https://fscooperatives.com/evergreenfs/agriculture/grain-marketing/crop-policy
- Tom Dorn, reviewed by Chuck Burr, Nebraska Extension, "How to Reduce On-Farm Grain Drying Energy Costs," CropWatch, Mar 22, 2017 — https://cropwatch.unl.edu/2017/how-reduce-farm-grain-drying-energy-costs
- Crop Root Zone, TRZ-0216, "At $1.48 Propane, a Late-September Day of Field Drydown Saves About $4.40 an Acre...," Sep 21, 2026; and TRZ-0252, "Cooling a 30,000-Bushel Corn Bin This Fall Takes About $146 of Electricity...," Oct 2, 2026.
- University of Minnesota Extension, "Natural-air corn drying" (maximum initial moisture by airflow and region); page returned 403, figure taken from search-indexed text, accessed Oct 19, 2026 — https://extension.umn.edu/corn-harvest/natural-air-corn-drying
Disclosures
Crop Root Zone is an independent publication. Nothing here is investment advice. Market calls, where included, reflect the editors' own read and are not a recommendation to buy or sell any security.
A 16-Row Downforce Retrofit Costs About $6,200 a Year to Own and Pays at 0.86 Bushel of Corn an Acre Over 1,500 Acres. The Independent Trials' Median Gain Is 2 Bushels, and None of the Five That Reported Statistics Found It Significant.
Public prices put active hydraulic downforce on a 16-row planter at roughly $20,000 to $40,000 in 2026 dollars. At December 2027 corn and 7.12% money, a $30,000 kit needs 1.28 bushels on 1,000 acres. University and on-farm trials measured 0 to 10 bushels against a sensible fixed setting. The 4.5 to 10.4 bushel claims come from comparisons against settings chosen to be wrong.
Planter owners pricing winter shop work for 2027 tend to put active row-unit downforce at the top of the list. It is the retrofit that dealers pitch hardest, and it is usually the most expensive one. The question is simple. A 16-row kit costs tens of thousands of dollars, and corn for December 2027 delivery traded at $5.075 on the morning of October 16 (FXEmpire, Oct 16, 2026) [1]. How many bushels does the kit have to add, and how many has it added in trials not run by the companies that sell it? This piece uses the same approach as our sprayer and combine analyses, TRZ-0268 and TRZ-0196 [21]: list price, capital recovery at a real interest rate, and a break-even in bushels and acres. The answer is that the hurdle is low and the independent evidence is thin. A grower should frame the purchase as insurance, not as a yield product.
1. What a 16-row retrofit costs
What's new: No major brand publishes a current list price for active downforce. Dealers quote by planter, and Precision Planting's 2026 promotion offered a $50-a-row rebate on DeltaForce bought June 1 to September 30, which a 16-row buyer would have seen as $800 (Precision Planting, accessed Oct 16, 2026) [11]. The public prices that do exist are older. We converted each to September 2026 dollars using the Bureau of Labor Statistics producer price index for farm machinery, which rose from 226.6 in October 2020 to 302.752 in September 2026, an increase of 34% (BLS via FRED, Oct 16, 2026) [3].
Evidence: Precision Ag Resources, a Precision Planting dealer, posted a "12 Row Average Cost" in October 2020. DeltaForce alone was listed at $11,000. With the 20|20 SeedSense display at $5,600 and the CAN wiring network at $7,000, the total was $21,600 (PARGPS, Oct 2020) [4]. A University of Nebraska–Lincoln On-Farm Research report from 2018 put DeltaForce at "around $1,500" per row unit (UNL, 2018) [5]. UNL's 2020 reports priced an active downforce system at $20,000 in their net-return calculations, for a 12-row Kinze True Depth and an Ag Leader SureForce planter (UNL, 2020) [6][7]. Precision Planting's own case study describes a farmer with a 16-row John Deere 1770NT CCS. He spent about $19,000 the first year on the display, row modules, harnesses and load pins. The second year he spent about $30,000 on DeltaForce, vDrive and vSet together (Precision Planting, undated) [10].
| Source and year | System | Quoted cost | Basis | 16-row equivalent, 2026 $* | |
|---|---|---|---|---|---|
| PARGPS dealer, Oct 2020 | DeltaForce hydraulics only | $11,000 | 12 rows, average | ~19,600 | █████░░░░░ |
| UNL On-Farm Research, 2018 | DeltaForce | ~$1,500/row | Per row unit | ~33,900 | █████████░ |
| UNL On-Farm Research, 2020 | Kinze / Ag Leader active system | $20,000 | 12-row planter | ~35,600 | █████████░ |
| PARGPS dealer, Oct 2020 | DeltaForce + 20|20 + CAN wiring | $21,600 | 12 rows, average | ~39,500 | ██████████ |
| Farm Progress, Feb 2009 | AirForce pneumatic, planter-wide | $3,000 + $0–300/row | Planter with air bags | ~4,900–12,700 | ██░░░░░░░░ |
Sources: PARGPS, Oct 2020 [4]; UNL On-Farm Research, 2018 and 2020 [5][6][7]; Farm Progress, Feb 15, 2009 [22]; BLS Producer Price Index, farm machinery and equipment manufacturing, via FRED, Sep 2026 [3]. *Crop Root Zone estimates. Per-row prices are scaled to 16 rows. The display in the PARGPS package is counted once, and the hydraulics and wiring are scaled by row. Values are inflated by the index ratio from the quote month or year to September 2026. Dealer quotes for a given planter will differ. Bars scale the 2026 equivalent; $39,500 = 10.
That gives a working range of about $20,000 to $40,000 for a 16-row hydraulic retrofit in 2026 dollars, depending mostly on whether the planter already has the display and wiring. The independent figures agree closely. The 2018 UNL row price and the 2020 UNL system price both land at $34,000 to $36,000 once scaled to 16 rows and today's machinery prices. Pneumatic systems that control the planter's existing air bags as a single section cost much less. The only published price we found is 17 years old, so we treat it as a rough indication of size only.
2. What it costs a year, and the bushels that pays for
What's new: The extension trials that report a return used simple proration. UNL spread $20,000 over seven years and 1,500 acres to get $1.90 an acre, and over 600 acres to get $4.75 an acre (UNL, 2020) [6][7]. That leaves out interest and repairs. We use the 7.12% average farm operating-loan rate from the Chicago Fed's second-quarter survey (Federal Reserve Bank of Chicago, Aug 2026) [2]. We keep UNL's seven-year life with no salvage value, because a retrofit kit has a thin resale market. We add a repair allowance of 2% of the purchase price a year. Revenue is priced at December 2027 corn, $5.075, less a 25-cent harvest basis, which gives $4.825. The 25-cent basis follows the Purdue budget convention we used in TRZ-0263 [20].
Evidence: On those terms the capital recovery factor is 0.1863. A $30,000 kit therefore costs $5,590 a year in capital recovery plus $600 in repairs, a total of about $6,190. That is 45% more per acre than UNL's simple proration on the same price. At 1,500 planted acres it comes to $4.13 an acre, or 0.86 bushel of corn.
| Kit cost, 2026 $ | Annual cost, $/yr* | 750 ac, bu/ac* | 1,000 ac, bu/ac* | 1,500 ac, bu/ac* | 2,000 ac, bu/ac* | 3,000 ac, bu/ac* |
|---|---|---|---|---|---|---|
| 10,000 (pneumatic, est.) | 2,063 | 0.57 | 0.43 | 0.29 | 0.21 | 0.14 |
| 20,000 | 4,127 | 1.14 | 0.86 | 0.57 | 0.43 | 0.29 |
| 30,000 | 6,190 | 1.71 | 1.28 | 0.86 | 0.64 | 0.43 |
| 40,000 | 8,253 | 2.28 | 1.71 | 1.14 | 0.86 | 0.57 |
Source: Crop Root Zone model. Corn: CBOT December 2027 at 507.50¢, FXEmpire delayed quote, Oct 16, 2026, 12:44 UTC [1], less 25¢ basis. Interest: Chicago Fed AgLetter, Aug 2026, 7.12% [2]. *All values are estimates. The model uses a 7-year life, no salvage, capital recovery factor 0.1863 and repairs at 2% of cost a year. It assumes every planted acre responds; see the soybean caveat below.
0.86 bushel
The yield a $30,000 16-row downforce kit must add across 1,500 planted acres to pay for itself at December 2027 corn and 7.12% money. On 1,000 acres the hurdle is 1.28 bushels. (Crop Root Zone model; FXEmpire, Oct 16, 2026; Chicago Fed, Aug 2026)
The price inputs change the answer less than a grower might expect. On December 2026 futures at $4.7625 with no basis deduction, the 1,500-acre hurdle is 0.87 bushel. At $4.5125, the December 2026 contract less 25 cents, it is 0.91. A ten-year life cuts the $30,000 kit's annual cost to $4,895 and the 1,500-acre hurdle to 0.68 bushel. Acreage matters far more. The same kit needs 2.57 bushels on 500 acres. There is one important caveat. The planter also plants soybeans, and the public soybean evidence is thinner still. If only the corn half of a 1,500-acre rotation responds, the corn acres must carry the full cost, and the hurdle there doubles to 1.71 bushels.
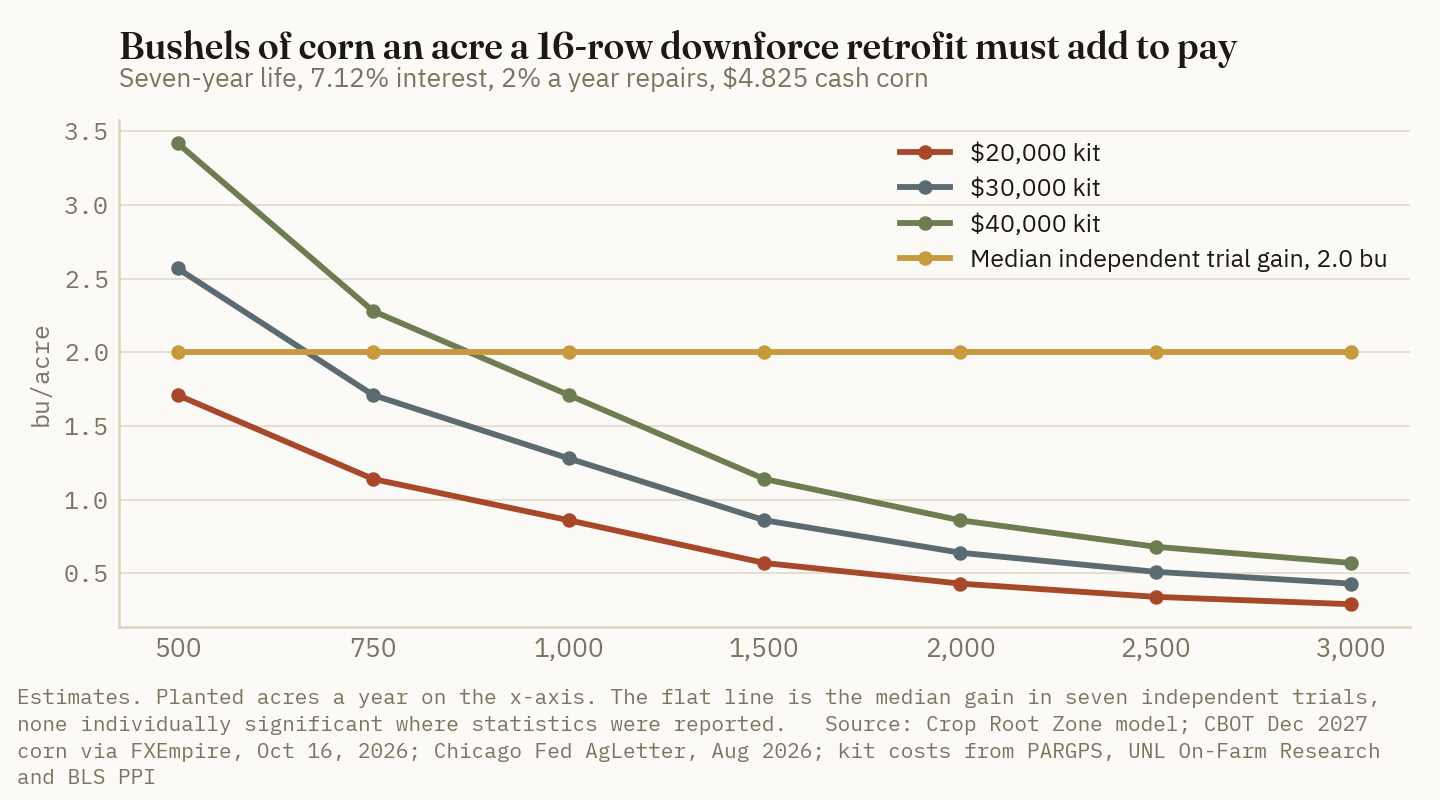
3. What the independent trials measured
What's new: We found seven public comparisons of active or hydraulic downforce against a fixed setting, run by universities or by farmer research networks independent of the equipment makers. We read the four Nebraska and Kansas reports in full. The Iowa State result comes from the indexed text of its report, and the Iowa Soybean Association and Purdue results come from trade-press accounts of the trials.
Evidence:
| Trial | Run by | System | Fixed check | Active, bu/ac | Check, bu/ac | Gain, bu/ac | Statistics |
|---|---|---|---|---|---|---|---|
| Platte Co., NE, 2018 [5] | UNL On-Farm Research | DeltaForce (~90 lb avg) | 180 lb constant | 275 | 274 | +1 | Not significant, P = 0.327 |
| Richardson Co., NE, 2020 [6] | UNL On-Farm Research | Kinze True Depth | 120 lb manual | 235 | 233 | +2 | Not significant, P = 0.234 |
| Dawson Co., NE, 2020 [7] | UNL On-Farm Research | Ag Leader SureForce, medium | 100 lb manual | 234 | 224 | +10 | Not significant, P = 0.270 |
| Kansas River Valley, KS, 2020 [12] | K-State | DeltaForce auto | 125 lb static | 204.2 | 200.2 | +4.0 | Not significant at P = 0.05 |
| Osceola Co., IA, 12 trials [13] | Iowa State | Hydraulic, Kinze 3600 | Factory springs | 201 | 201 | 0 | Not significant, P = 0.38 |
| SW Iowa, 7 fields, 2014 [14] | ISA On-Farm Network | Ag Leader hydraulic, half a 16-row | Stock springs | — | — | +1.25 avg (−2.4 to +5.5) | Not reported |
| Throckmorton, IN, 2023 [15] | Purdue / Indiana Prairie Farmer | DeltaForce | One static setting | — | — | +8 | Not reported; called preliminary |
Sources: UNL On-Farm Research study reports 0085141201803 (2018), 0416147202002 and 0709047202003 (2020) [5][6][7]; Adee, K-State, Kansas Field Research 2021 [12]; Iowa State farm report, as indexed [13]; Farm Progress, Apr 14, 2015 [14]; Farm Progress, Mar 12, 2024 [15]. UNL uses a 90% confidence level. The Dawson heavy-pressure active treatment yielded 222, 2 bushels under manual.
Sorted, the seven gains are 0, 1, 1.25, 2, 4, 8 and 10 bushels. The median is 2.0 and the mean is 3.75. Every one is positive or zero, which is worth something. None of the five trials that published statistics found the difference significant, and the two largest results each come with caveats. The 10-bushel Dawson result sits next to a heavy active setting that lost 2 bushels, inside the same non-significant test. Purdue attributed its 8-bushel 2023 result mainly to a lower final stand under the static setting, and moved to a four-setting design in 2024 to probe it (Farm Progress, Mar 12, 2024) [15]. Purdue's 2025 trial at the same farm compared spring and air-controlled row units and found no significant yield difference from downforce (Farm Progress, Mar 26, 2026) [16]. In August, Purdue's Center for Commercial Agriculture compared a modern 12-row planter with active hydraulic downforce, vacuum meters and row cleaners against a 30-year-old spring-downforce planter. Every 95% confidence interval included zero (Purdue, Aug 13, 2026) [17]. That trial bundled several technologies, so it cannot isolate downforce.
The K-State report shows where the real risk lies. In a very mellow, subsoiled seedbed, the automatic system yielded 204.2 bushels, no added downforce 202.1 and 125 pounds static 200.2, all statistically equal. At 375 pounds static the stand fell by about 3,000 plants an acre, and yield fell to 168.0 bushels, 36 below the automatic system (K-State, 2021) [12]. Active control did not beat a good fixed setting. It avoided a bad one.
Ground Truth: The independent record does not show that active downforce raises yield over a well-chosen fixed setting. It shows that a badly chosen fixed setting is costly and that the active system never chose one. The break-even is low enough that the second point is sufficient. Using K-State's own 36-bushel loss, a $30,000 kit on 1,500 acres pays if a fixed setting would have been badly overset on 2.4% of acres a year. The decision therefore turns less on any trial than on an honest answer to one question: how often do the operator's fixed settings drift wrong across the farm's soils, residue levels and wheel tracks?
4. The manufacturer numbers, and why they are larger
What's new: Precision Planting's multi-year study at its PTI Farm in Pontiac, Illinois, covering 2018 to 2025, reports average losses of 10.4 bushels an acre for downforce that was too light and 4.5 bushels for downforce that was too heavy, compared with DeltaForce automatic control (Precision Planting, accessed Oct 16, 2026) [18]. The page gives no replication count or significance test. It also claims a return of nearly $100,000 over five years on 800 acres with a 16-row planter, without showing the calculation.
Evidence: The design explains the size of the numbers. The PTI checks are settings chosen to be wrong. The university and network checks are the farmer's or researcher's best fixed setting. Both kinds of evidence can be correct at once. If the operator's fixed setting is too light, the company's own 10.4-bushel figure means the $30,000 kit pays at 1,500 acres when that happens on 8% of acres. At the 4.5-bushel too-heavy figure, it must happen on 19%. Those are plausible frequencies on a farm with variable soils or heavy no-till residue. They are much less likely on uniform, tilled ground.
Some manufacturer-sourced data is less useful. AGCO, which owns Precision Planting, released results from 19 Crop Tour sites over 2016 to 2018. The release stated that automatic downforce out-yielded too-heavy settings by 23 bushels an acre and too-light settings by 163 bushels, then gave an average gain of 93 bushels (No-Till Farmer, Feb 27, 2019) [19]. The release gives no base yields, replications or statistics, and on corn yielding about 200 bushels, a 163-bushel gap is not a credible field average. We do not use those figures.
| Evidence type | Comparison | Typical reported gain, bu/ac | Who paid | |
|---|---|---|---|---|
| University / farmer-network trials (7) | Active vs best fixed setting | 2.0 (median) | Public, checkoff, grower | ██░░░░░░░░ |
| Manufacturer PTI study, too heavy | Active vs deliberately heavy | 4.5 | Equipment maker | ████░░░░░░ |
| Manufacturer PTI study, too light | Active vs deliberately light | 10.4 | Equipment maker | ██████████ |
Sources: Table in Section 3 [5]–[7], [12]–[15]; Precision Planting, Multi-Year Corn Downforce Study, 2018–2025, accessed Oct 16, 2026 [18]. The UNL reports list the University of Nebraska–Lincoln, the Nebraska Corn Board, the Nebraska Soybean Checkoff, the Nebraska Corn Growers and the Nebraska Dry Bean Commission as sponsors and partners. Bars scale the gain; 10.4 = 10.
Ground Truth: Growers reading a downforce pitch should ask one question of every yield number: compared with what? A gain measured against a setting the company chose to be wrong is a measure of what a mistake costs, and that is real information. It is not the expected gain for a farm that already sets downforce with care. The brochure's figure of nearly $100,000 over five years on 800 acres works out to $25 an acre a year, about 5 bushels at $4.825 corn. Even on the company's own 10.4-bushel loss, that requires a too-light setting on about half the farm's acres every year.
5. Where the retrofit earns its keep, and what to check first
What's new: The trials also point to benefits that do not show up in bushels. A Fillmore County, Nebraska, grower who bought Ag Leader hydraulic downforce for the whole planter said he did so to reduce wear on the planter and to adjust better to changing conditions. His 2024 test of 40, 95 and 200 pounds found no significant yield differences, 208, 209 and 205 bushels (UNL, 2024) [9]. In a 2020 Dawson County trial with active downforce engaged, corn planted at 7 mph out-yielded 5 mph by 16 bushels, 256 to 240, which was significant. At 10 mph the stand fell from about 34,000 to 27,667 plants an acre (UNL, 2020) [8]. That trial had no fixed-downforce check at speed, so it shows that 7 mph was possible with the system. It does not show that the system made 7 mph possible.
Evidence: Four conditions tilt the decision toward buying. The first is acreage. Above about 1,300 planted acres, even a $40,000 kit needs only about 1.3 bushels. The second is variable soils or no-till residue, the conditions the K-State author singled out as making a single static setting hard to choose [12]. The third is wheel-track rows. UNL's Richardson monitor showed the system pushing down only on rows behind the tractor tires and in sprayer tracks, and lifting on the rest (UNL, 2020) [6]. The fourth is whether the farm already has a compatible display and wiring, which is the difference between a $20,000 and a $40,000 quote in our Section 1 table.
| Situation | Planted acres | Likely kit cost | Break-even, bu/ac* | Read |
|---|---|---|---|---|
| Display and wiring in place, variable no-till | 2,000 | ~$20,000 | 0.43 | Low hurdle; buy on the insurance case |
| Full install, mixed soils | 1,500 | ~$30,000 | 0.86 | Below the 2-bu independent median |
| Full install, corn-only response, 50/50 rotation | 1,500 (750 corn) | ~$30,000 | 1.71 | Close to the median; depends on how often settings drift |
| Full install, uniform tilled ground | 800 | ~$40,000 | 2.14 | Above most independent results; set springs carefully instead |
Source: Crop Root Zone model, Section 2 inputs [1][2][3]. *Estimates at $4.825 cash corn, 7.12%, 7-year life, 2% repairs.
There are cheaper options before signing a quote. The K-State result shows that a careful static setting matched the automatic system in that field, so checking gauge-wheel load and adjusting the setting by field costs time rather than capital. A planter-wide pneumatic system on a planter that already has air bags is a smaller purchase, though we found no current public price. Growers with a 20|20 or similar display can also track gauge-wheel load and ground contact for a season before buying hydraulics, and so measure how often a fixed setting is actually wrong.
Ground Truth: For a 16-row planter covering 1,500 acres or more, the downforce retrofit is a small bet: under a bushel an acre at today's December 2027 board. The independent median of 2 bushels covers it, even though no single trial proved that median. The order of purchase matters more than the decision itself. Buy the display and load pins first and record what the gauge wheels report for one spring. If the record shows a fixed setting rarely losing contact or overloading, the hydraulics can wait. If it shows the setting regularly wrong across the farm's soils, the record is the case for buying them, and it is better evidence than any brochure.
References
- FXEmpire, CBOT corn futures contracts (ZCZ26 476.25¢, ZCZ27 507.50¢), delayed quotes at 12:44 UTC, Oct 16, 2026 — https://www.fxempire.com/commodities/zc/contracts
- Federal Reserve Bank of Chicago, AgLetter No. 2013, Aug 2026 (second-quarter 2026 survey; farm operating loans 7.12%) — https://www.chicagofed.org/publications/agletter/2025-2029/august-2026
- U.S. Bureau of Labor Statistics, Producer Price Index by Industry: Farm Machinery and Equipment Manufacturing (PCU333111333111), monthly, via FRED, Federal Reserve Bank of St. Louis, downloaded Oct 16, 2026 (Oct 2020 226.6; 2018 average 214.0; Feb 2009 185.6; Sep 2026 302.752) — https://fred.stlouisfed.org/series/PCU333111333111
- Precision Ag Resources (PARGPS), "DeltaForce" product page, "12 Row Average Cost," posted Oct 2020, accessed Oct 16, 2026 — https://pargps.com/index.php/delta-force/
- University of Nebraska–Lincoln Extension, On-Farm Research, "Impact of Planting Corn with Active Down Force versus Constant Down Force on Corn Yield," Study ID 0085141201803, Platte County, 2018 — https://resultsfinder.unl.edu/sites/unl.edu.ianr.extension.on-farm-research.results-finder/files/pdf/0085141201803.pdf
- University of Nebraska–Lincoln Extension, On-Farm Research, "Kinze True Depth Hydraulic Active Downforce vs Manual Downforce," Study ID 0416147202002, Richardson County, 2020 — https://resultsfinder.unl.edu/sites/unl.edu.ianr.extension.on-farm-research.results-finder/files/pdf/0416147202002.pdf
- University of Nebraska–Lincoln Extension, On-Farm Research, "Ag Leader SureForce Systems at Different Pressures (Manual vs Medium vs Heavy)," Study ID 0709047202003, Dawson County, 2020 — https://resultsfinder.unl.edu/sites/unl.edu.ianr.extension.on-farm-research.results-finder/files/pdf/0709047202003.pdf
- University of Nebraska–Lincoln Extension, On-Farm Research, "Corn Planting Speed with Ag Leader SureForce," Study ID 0709047202004, Dawson County, 2020 — https://resultsfinder.unl.edu/sites/unl.edu.ianr.extension.on-farm-research.results-finder/files/pdf/0709047202004.pdf
- University of Nebraska–Lincoln Extension, On-Farm Research, "Planting Downforce Rates in Corn," Study ID 1546059202401, Fillmore County, 2024 — https://resultsfinder.unl.edu/sites/unl.edu.ianr.extension.on-farm-research.results-finder/files/pdf/Downforce-%20Corn.pdf
- Precision Planting, "Downforce Dan" farmer story (16-row John Deere 1770NT CCS; about $19,000 base system, about $30,000 for DeltaForce, vDrive and vSet), undated, accessed Oct 16, 2026 — https://www.precisionplanting.com/resources/articles/dan
- Precision Planting, rebate program page ($50 per row per product, purchases Jun 1–Sep 30, 2026), accessed Oct 16, 2026 — https://www.precisionplanting.com/precisiondecision
- E. A. Adee, Kansas State University, "Comparison of Static and Active Downforce on Corn at the Kansas River Valley Experiment Field in 2020," Kansas Agricultural Experiment Station Research Reports, Vol. 7, Iss. 5, 2021 — https://doi.org/10.4148/2378-5977.8072
- Iowa State University, Research and Demonstration Farms report, planter trials comparing factory spring and hydraulic down-pressure on a Kinze 3600 in 12 Osceola County fields (37 replications; 201 bu/ac each; P = 0.38), Iowa State Digital Press Farm Reports, article 3779; full text bot-gated, figures taken from the indexed report text, accessed Oct 16, 2026 — https://iastatedigitalpress.com/farmreports/article/3779/galley/3645/view
- Farm Progress, "Corn planter down force systems tested" (Iowa Soybean Association On-Farm Network trial, Harlan-area farm, seven fields, 2014), Apr 14, 2015 — https://www.farmprogress.com/corn/corn-planter-down-force-systems-tested
- Tom J. Bechman, Farm Progress / Indiana Prairie Farmer, "How to set your planter for top yields" (Purdue–Indiana Prairie Farmer 2023 Throckmorton downforce trial), Mar 12, 2024 — https://www.farmprogress.com/corn/how-to-set-your-planter-for-top-yields
- Tom J. Bechman, Farm Progress / Indiana Prairie Farmer, "What you should know about planter downforce" (Purdue 2025 Throckmorton trial), Mar 26, 2026 — https://www.farmprogress.com/planting/what-you-should-know-about-planter-downforce
- Jonah Armstrong, Stephen Boyer, Alex Helms and Chad Fiechter, Purdue Center for Commercial Agriculture, "Does New Planter Technology Pay? What a Purdue Field Trial Found," Aug 13, 2026 — https://ag.purdue.edu/commercialag/home/resource/2026/08/does-new-planter-technology-pay-purdue-field-trial/
- Precision Planting, "Multi-Year Corn Downforce Study," PTI Farm, Pontiac, Ill., 2018–2025, accessed Oct 16, 2026 — https://www.precisionplanting.com/resources/research/corn-downforce-study
- No-Till Farmer, "Field Demonstrations Confirm Impact of Ideal Planting Practices on Corn Yields" (AGCO Crop Tour, 19 sites, 2016–2018), Feb 27, 2019 — https://www.no-tillfarmer.com/articles/8580-field-demonstrations-confirm-impact-of-ideal-planting-practices-on-corn-yields
- Crop Root Zone, TRZ-0263, "Financing a 2027 Illinois Corn Acre Costs $35 to $55 in Interest at 7.12%, or 7 to 11 Bushels.," Oct 8, 2026 (25-cent new-crop corn basis convention from Purdue budgets).
- Crop Root Zone, TRZ-0268, "A New 120-Foot Sprayer Needs About 5,600 Acre-Passes a Year to Beat Iowa's $9.35 Custom Rate.," Oct 9, 2026; and TRZ-0196, "A New Combine Has to Cover About 2,700 Acres a Year to Beat Iowa's Custom Rate.," Sep 15, 2026 (capital-recovery method).
- Farm Progress, "Money-saving monitor" (Precision Planting AirForce base price about $3,000 plus $0 to $300 a row), Feb 15, 2009; full text not retrievable, figure taken from the indexed article text, accessed Oct 16, 2026 — https://www.farmprogress.com/farming-equipment/money-saving-monitor
Disclosures
Crop Root Zone is an independent publication. Nothing here is investment advice. Market calls, where included, reflect the editors' own read and are not a recommendation to buy or sell any security.
A 2,000-Gallon Diesel Tank Pays Past About 12,000 Gallons a Year. A 4,000 Needs 25,500. The Real Discount Starts at a 6,000-Gallon Transport Load, Which Is Also Where the Spill Plan Starts.
At list prices, 7.12% money and $5.63 farm diesel, a double-wall tank costs $817 to $5,580 a year to own and keep full. Public fuel contracts price bigger tankwagon drops at 5 to 8 cents a gallon less, and a transport load at 15 to 83 cents less. Twenty-one years of weekly EIA prices give extra storage no value as a way to time the market.
A farmer weighing a bigger diesel tank this fall is usually thinking about price. Midwest on-highway diesel was $6.259 a gallon in the week of October 12, which is 42 cents below the record $6.680 set three weeks earlier and still $2.65 above a year ago (EIA, Oct 14, 2026) [1][2]. Illinois No. 2 farm diesel averaged $5.63 at distributors in the week ending October 2 (USDA AMS, Oct 2, 2026) [3]. Our September piece on the same market, TRZ-0228, asked whether to fill a tank now or contract spring gallons [20]. This piece asks what a tank is worth owning in the first place. That means what it costs a year, what a bigger load actually saves, where the break-even sits by annual use, and whether extra storage pays as a way to time the market. It does not. The value of a tank is the size of the load it can take, and the step that pays most comes at the same place federal spill planning begins.
1. What a gallon of storage costs to own
What's new: Double-wall UL 142 steel tanks, which hold their own secondary containment, list online at $3.97 to $5.09 a gallon of capacity from 1,000 to 8,000 gallons in the listings used here. Midwest Industrial Tanks lists 1,000 gallons at $4,667 and 2,000 at $8,400 (Tank Retailer, accessed Oct 15, 2026) [6]. Newberry lists its large double-wall skid tank at $10,179 for 2,000 gallons, $18,539 for 4,000 and $31,739 for 8,000, with an 18 to 22 week lead time on the large sizes [7]. A second seller lists a 4,000-gallon horizontal double-wall tank at $19,612 before freight [8]. A metered 20-gallon-a-minute Fill-Rite pump with hose and automatic nozzle lists at $1,389 [9].
Evidence: The steel is only part of the annual cost. We spread the hardware over 20 years at 7.12%, which was the average Seventh District farm operating-loan rate at midyear (Federal Reserve Bank of Chicago, Aug 2026) [5]. Then we add interest on the fuel the tank holds. A tank refilled at about 20% full holds about 60% of its capacity on average. At $5.63 a gallon and 7.12%, every gallon kept on hand costs about 40 cents a year in interest.
| Tank (double-wall, UL 142) | Hardware list, $ | $/gal capacity | Capital recovery, $/yr* | Fuel interest, $/yr* | Spill plan, $/yr* | Total, $/yr* | |
|---|---|---|---|---|---|---|---|
| 1,000 gal (MIT) + pump | 6,056 | 4.67 | 577 | 241 | 0 | 817 | █░░░░░░░░░ |
| 2,000 gal (MIT) + pump | 9,789 | 4.20 | 933 | 481 | 0 | 1,414 | ███░░░░░░░ |
| 4,000 gal (Newberry) + pump | 19,928 | 4.63 | 1,899 | 962 | 0 | 2,861 | █████░░░░░ |
| 8,000 gal (Newberry) + pump | 33,128 | 3.97 | 3,156 | 1,924 | ~500 | ~5,580 | ██████████ |
Source: Tank Retailer listings for Midwest Industrial Tanks and Newberry double-wall tanks, accessed Oct 15, 2026 [6][7]; Dultmeier, Fill-Rite FR711VA, accessed Oct 15, 2026 [9]; USDA AMS, Oct 2, 2026 [3]; Federal Reserve Bank of Chicago, Aug 2026 [5]. *Crop Root Zone estimates. Capital recovery is 20 years at 7.12% (factor 0.0953). Fuel interest assumes average inventory of 60% of capacity at $5.63 a gallon. The spill-plan figure is an allowance, explained in Section 5. $/gal capacity is tank only. Freight, concrete pad, electrical and setback work are excluded; each $1,000 of installation adds about $95 a year. Bars scale total annual cost; 8,000 gal = 10.
Two things stand out. Capacity gets only slightly cheaper per gallon as tanks get bigger. The Newberry 4,000-gallon tank costs more per gallon than the Midwest Industrial 2,000. And the fuel interest grows in step with size. That interest line is the cost TRZ-0228 left out when it priced tank capital alone at a 5.25% rate [20]. At today's diesel price, the fuel in an 8,000-gallon tank costs about three-fifths as much a year as the steel.
Spread over the gallons that pass through, the cost depends on annual use. At 20,000 gallons a year, the 1,000-gallon package costs 4.1 cents a gallon, the 2,000 costs 7.1, the 4,000 costs 14.3 and the 8,000 costs 27.9. At 80,000 gallons those fall to 1.0, 1.8, 3.6 and 7.0 cents. A bigger tank has to recover that difference from a lower price per gallon delivered.
2. What a bigger load is worth: the delivery schedule
What's new: Farm co-ops rarely publish their tankwagon schedules, but state fuel contracts do, and they price drop size explicitly. The State of Arkansas's contract with Mansfield, under the OMNIA cooperative agreement, adds a tankwagon differential per gallon to the OPIS rack average. The differential depends on the gallons delivered to each location (State of Arkansas, Schedule A, accessed Oct 15, 2026) [10]. Tankwagon freight is a separate pass-through, at an estimated weighted average of 52.75 cents a gallon, plus a $125 fee on drops under 250 gallons. Transport-truck dyed diesel pulled from Little Rock is priced at the OPIS average minus 1.49 cents, with estimated freight of 4.9 cents.
Evidence:
| Drop size, gal | Tankwagon differential, ¢/gal | Typical tank that takes this drop* | |
|---|---|---|---|
| 500 or less | 19.25 | 500–600 gal | ██████████ |
| 501–1,000 | 14.25 | 1,000 gal | ███████░░░ |
| 1,001–1,500 | 12.25 | 1,500 gal | ██████░░░░ |
| 1,501–2,000 | 9.25 | 2,000 gal | █████░░░░░ |
| 2,001–4,000 | 6.25 | 4,000 gal | ███░░░░░░░ |
| 4,001 and up | 4.25 | 6,000 gal and up | ██░░░░░░░░ |
Source: State of Arkansas / Mansfield, Schedule A Customer Pricing, undated, accessed Oct 15, 2026 [10]. Differentials are added to the OPIS rack average and exclude freight, taxes and additives. *Crop Root Zone assumption that a tank is refilled at about 20% full, so it takes a drop of about 80% of its capacity. Bars scale the differential; 19.25¢ = 10.
Inside the tankwagon schedule, size is worth a few cents. Going from 800-gallon drops on a 1,000-gallon tank to 1,600-gallon drops on a 2,000 saves 5 cents a gallon. Going to 3,200-gallon drops on a 4,000 saves 8 cents. The bigger break is between the tankwagon and the transport truck. North Carolina's statewide contract defines a transport load as 6,000 gallons or more and a tankwagon drop as 500 to 5,999 gallons. In the week of August 18 to 25, 2023, transport diesel was priced 14.5 to 83.3 cents a gallon under tankwagon across the state's eight zones. The median gap was 44.6 cents (North Carolina Department of Administration, contract 1510B, week 77) [11].
15 to 83 cents
The gap between a 6,000-gallon-plus transport load and a tankwagon drop across North Carolina's eight contract zones. It is two to ten times anything the tankwagon tiers pay for a bigger drop. (NC Department of Administration, contract 1510B, Aug 18–25, 2023)
The Arkansas schedule puts that gap at about 64 cents. That figure is the tankwagon differential plus freight, against the transport price plus its freight, for a farm moving from 800-gallon drops. These are government contracts, and their delivery points are not farms. Rural routes, co-op patronage and local competition will move the numbers either way. The shape is the useful part: a few cents across the tankwagon tiers, then a step of tens of cents at the transport line.
Ground Truth: The question a grower should take to the supplier is not what a bigger tank saves. It is what the supplier charges for a 6,000-gallon transport drop compared with what it charges now. If the supplier will not quote a transport price to the farm, an 8,000-gallon tank buys only the 4.25-cent tankwagon tier at twice the carrying cost of a 4,000. If the quote is 30 cents or more under the current drop, the big tank wins from roughly 16,000 gallons a year, which is about where the fuel turns over fast enough anyway.
3. The break-even by annual use
What's new: We combined the Section 1 ownership cost with the Section 2 delivery savings. The comparison is against a farm that already runs a 1,000-gallon tank on roughly 800-gallon tankwagon drops. For the 8,000-gallon tank, we show three transport discounts: 15 cents (the low end of North Carolina's zones), 45 cents (the median) and 64 cents (the Arkansas schedule).
Evidence:
| Option vs 1,000-gal tank | Delivery saving, ¢/gal | Net at 10,000 gal/yr, ¢/gal* | Net at 20,000* | Net at 40,000* | Net at 80,000* | Break-even use, gal/yr* |
|---|---|---|---|---|---|---|
| 2,000 gal, tankwagon | 5.0 | −1.0 | 2.0 | 3.5 | 4.3 | ~11,900 |
| 4,000 gal, tankwagon | 8.0 | −12.4 | −2.2 | 2.9 | 5.4 | ~25,500 |
| 8,000 gal, transport at 15¢ | 15.0* | −32.6 | −8.8 | 3.1 | 9.0 | ~31,800 |
| 8,000 gal, transport at 45¢ | 45.0* | −2.6 | 21.2 | 33.1 | 39.0 | ~10,600 |
| 8,000 gal, transport at 64¢ | 63.6* | 16.4 | 40.2 | 52.1 | 58.0 | ~7,400 |
Source: Crop Root Zone model from the Section 1 and Section 2 inputs [3][5][6][7][9][10][11]. *All net and break-even values are estimates; transport discounts are scenarios drawn from the NC zone range and the Arkansas schedule, not farm quotes. Net is the saving per gallon of annual use after the bigger tank's extra capital recovery, fuel interest and (for 8,000 gal) spill-plan allowance. Positive means the bigger tank wins.
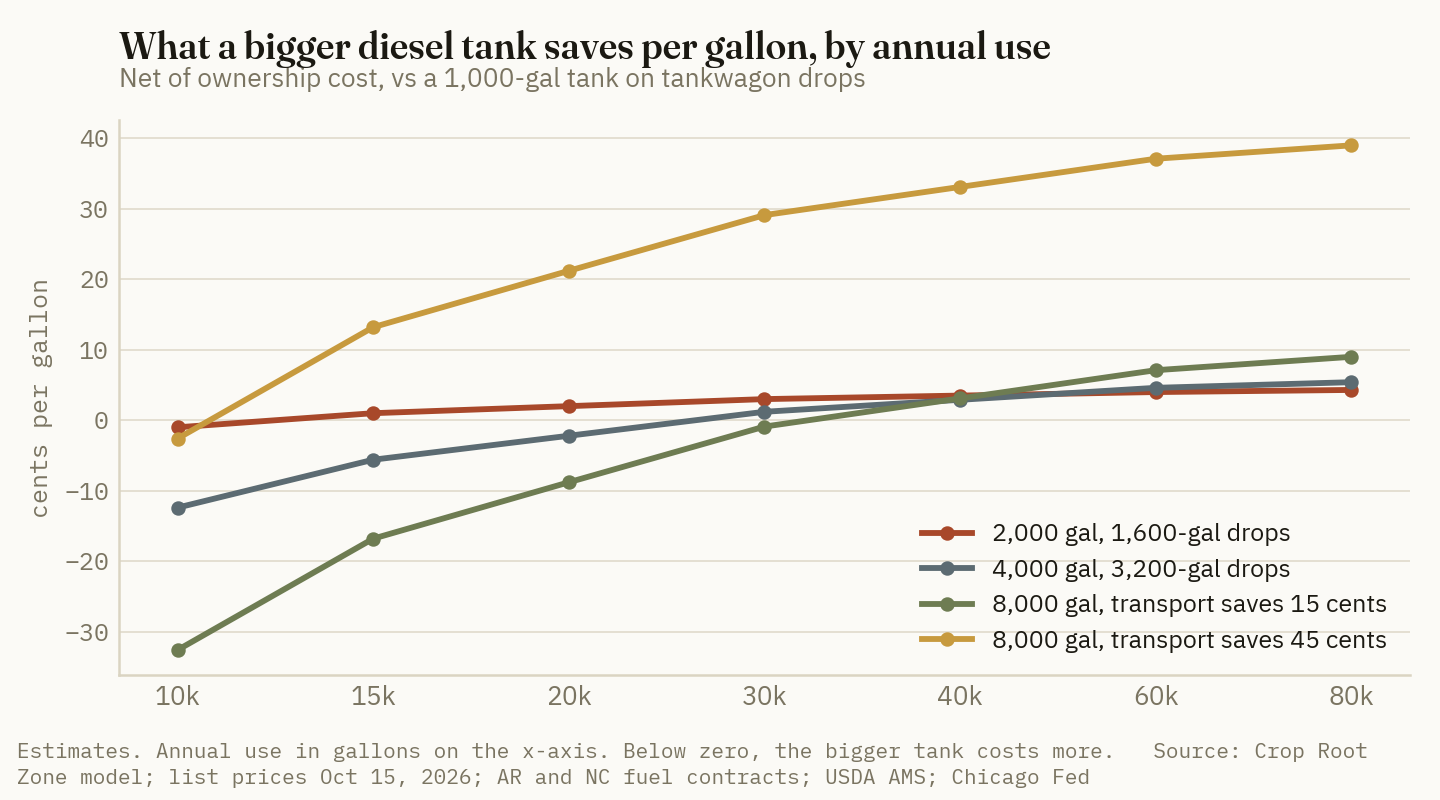
Three results stand out. First, the 2,000-gallon tank is a small, safe gain. It pays from about 12,000 gallons a year and never earns more than about 4 cents a gallon. Second, the 4,000-gallon tank is the weakest option on this schedule. It doubles the carrying cost to save 3 more cents than the 2,000, and it needs about 25,500 gallons a year to pay. Third, an 8,000-gallon tank either wins by a wide margin or loses, depending on the transport discount. At 15 cents it needs about 32,000 gallons a year. At 45 cents it pays from about 10,600 gallons, with one limit covered in Section 5: the fuel has to turn over before it ages.
Ground Truth: The tank decision is not a smooth curve. It has a gap in it. Below the transport line, extra capacity is worth a few cents a gallon at best, and the sensible size is the smallest tank that never runs dry during harvest. For many farms that is 2,000 gallons. Above the line, the saving jumps by an order of magnitude. A farm using 15,000 to 30,000 gallons a year that is considering a 4,000-gallon tank is usually buying the worst size on the schedule. It should either stay at 2,000 or price the 8,000 and the transport quote together.
4. Filling ahead of a price move: what 21 years of weekly prices say
What's new: The usual case for storage is buying before a rise. We tested it on EIA's weekly Midwest No. 2 diesel series from January 3, 2005 to October 12, 2026, a span of 1,137 weeks (EIA, weekly series, downloaded Oct 15, 2026) [2]. A farm using 20,000 gallons a year was modeled at a steady 385 gallons a week. We compared two ways to run a tank of each size. The first is price-blind: refill to full whenever the tank drops below a week's supply. The second is buy the dip: refill to full whenever this week's price is at or below its trailing average, using 4-, 13- and 52-week averages. We ran two versions. When the price is above its average, the farm either refills normally once the tank runs low, or buys only enough to keep a week in the tank. All runs carry interest at 7.12% on the fuel held.
Evidence:
| Tank size | Price-blind refill: price + interest, ¢/gal* | Buy the dip (13-wk avg): price + interest, ¢/gal* | Buy the dip vs price-blind, ¢/gal* | Range, all six dip rules, ¢/gal* |
|---|---|---|---|---|
| 1,000 gal | 330.4 | 330.8 | −0.3 | −0.2 to −1.3 |
| 2,000 gal | 330.3 | 331.6 | −1.3 | −0.9 to −3.0 |
| 4,000 gal | 330.7 | 333.2 | −2.6 | −2.3 to −4.7 |
| 8,000 gal | 331.5 | 335.7 | −4.3 | −4.0 to −5.4 |
Source: Crop Root Zone simulation on EIA Midwest (PADD 2) No. 2 diesel retail prices, weekly, Jan 3, 2005 – Oct 12, 2026 [2]. *Estimates. 20,000 gal/yr at a uniform weekly rate; 7.12% interest applied to the whole period; prices are on-highway retail including taxes, used for timing only. The simple average weekly price over the period was 330.2¢. The 13-week column uses the version that refills normally when the price is above average; the range covers both versions at 4, 13 and 52 weeks. Negative means buying the dip cost more.
Buying the dip lost money in every one of the 24 combinations of tank size, averaging window and version. The bigger the tank, the bigger the loss. The reason is in the data. Diesel prices trend, so a week below its trailing average is more often the start of a decline than the bottom of a dip. A full tank bought on that signal tends to be bought ahead of lower prices. Price-blind refilling landed within about 1.3 cents of the period's average weekly price at every size. The bigger tanks paid slightly less per gallon, but that small gain went to interest on the extra fuel. At half the interest rate, the 8,000-gallon tank would come out about 1 cent ahead of the 1,000. That is too small to support the purchase.
The futures curve gives the same answer this fall. On the morning of October 15, NY Harbor ULSD futures traded at $4.7913 for November, $4.1586 for April 2027 and $3.9144 for June 2027 (CME NYMEX via Farmbucks, Oct 15, 2026) [4]. The November-to-April backwardation of 63 cents is narrower than the 83 cents TRZ-0228 measured from October on September 24 [20], but it still points the same way. Filling a tank now for April use costs those 63 cents plus about 18 cents of interest on $5.63 fuel for five and a half months. That is roughly 81 cents a gallon more than booking April delivery at the curve (Crop Root Zone estimate).
Ground Truth: A diesel tank is a delivery-size tool, not a market-timing tool. Twenty-one years of weekly prices show no rule-based timing gain from extra storage, and the curve today charges about 81 cents to carry fuel into spring. The storage cost is worth paying for the transport discount and for not running dry during harvest. A grower who wants a view on the price should use a contract, which needs no steel and charges no interest on fuel sitting in the yard.
5. Compliance, setbacks and fuel quality
What's new: The federal rule as written still sets a general spill-plan threshold of more than 1,320 gallons of aboveground oil storage, counting containers of 55 gallons or more (40 CFR 112.1) [13]. Farms run on different numbers. Under the Water Resources Reform and Development Act of 2014, a farm needs no plan below 2,500 gallons of aggregate aboveground capacity. It also needs none between 2,500 and 6,000 gallons if it has no reportable discharge history. A farm between 6,000 and 20,000 gallons, with no tank over 10,000 gallons, may self-certify its plan. Larger farms, any tank over 10,000 gallons, or a reportable discharge history require a plan certified by a Professional Engineer (EPA, WRRDA fact sheet, Apr 24, 2015) [12]. Containers of 1,000 gallons or less on separate parcels are excluded from the count [12].
Evidence: The thresholds line up closely with the tank sizes in Section 3.
| Diesel tank added | Aggregate with 1,000 gal of other oil storage* | Federal status | Cost added |
|---|---|---|---|
| 1,000 gal | 2,000 | Under 2,500, no plan | None federal |
| 2,000 gal | 3,000 | 2,500–6,000, no plan if clean history (interim) | None federal, while the interim exemption stands |
| 4,000 gal | 5,000 | 2,500–6,000, no plan if clean history (interim) | Same; exposed if EPA lowers the line |
| 8,000 gal | 9,000 | 6,000–20,000, self-certified plan | Plan, reviewed at least every 5 years; containment and inspections |
Source: U.S. EPA, WRRDA fact sheet, Apr 24, 2015 [12]; 40 CFR 112.1 and 112.5 [13][14]; Congressional Research Service, R44536, Jan 5, 2017 [15]. *Illustrative: a gasoline tank, hydraulic and lube oil on the same parcel. Each farm's count differs.
The middle band rests on an interim figure. WRRDA allowed EPA to set the farm exemption anywhere from 2,500 to 6,000 gallons after a study. EPA concluded in June 2015 that it should be 2,500. As of the Congressional Research Service's last revision in January 2017, EPA had not proposed a rule to make the change [15]. TRZ-0228 found no final rule as of September 2026 [20]. A farm holding 4,000 to 5,000 gallons is therefore exempt under a figure EPA itself has said is too high. The 8,000-gallon tank has no such uncertainty, because it puts the farm in the self-certified band. The plan must be reviewed and documented at least once every five years (40 CFR 112.5(b)) [14]. EPA's farm sheet does not price the work. The most specific cost we found is old: an Ohio State Extension law specialist put an engineer-prepared plan "at around $1,000" and up in 2013 (Farm and Dairy, Oct 24, 2013) [16]. Our $500-a-year allowance in Section 1 assumes roughly $1,000 to $2,500 of plan work every five years, in time or fees. It is an estimate, and even at twice that the 8,000-gallon break-evens move by only a few hundred gallons a year.
State fire codes add costs that federal rules do not. The University of Georgia's extension guidance places most farm tanks of 60 to 1,100 gallons under NFPA 395 and larger tanks under NFPA 30. It advises at least 40 feet from any building, recommends secondary containment for all fuel tanks, and notes that Georgia requires installation plans to go to the State Fire Marshal (UGA Extension Bulletin 1136, rev. Nov 14, 2023) [17]. A 24-foot, 4,000-gallon skid needs that clearance on all sides. On a crowded farmstead, the site work can cost more than the tank, and it is excluded from every number above.
Fuel quality sets a floor on annual use for a given tank size. Cenex puts diesel's storage life at six to 12 months (Cenex, Oct 13, 2022) [18]. An 8,000-gallon tank taking 6,400-gallon transport drops therefore needs about 12,800 gallons a year to turn every six months, and 6,400 to turn once a year. That is above the 10,600-gallon break-even at a 45-cent discount. The binding limit for a smaller farm is fuel age, not money. Treatment is cheap by comparison. A biocide treating 1,280 gallons per 16-ounce bottle lists at $28.18, about 2.2 cents a gallon treated, and a gallon at the 200 ppm shock rate treats 5,000 gallons for $172.73, about 3.5 cents (Fisheries Supply, accessed Oct 15, 2026) [19]. Summer-grade fuel stored into winter also needs blending, as TRZ-0228 set out [20].
Ground Truth: The transport line at 6,000 gallons and the self-certification line at 6,000 gallons are effectively the same line. The federal paperwork is the price of the transport discount, and at a few hundred dollars a year it is a small one. The larger compliance exposure is in the middle band. A farm that adds a 4,000-gallon tank to stay out of planning is depending on an interim exemption EPA has said is too generous, while getting the weakest economics on the schedule. Farms that want to avoid a plan should stop at 2,000 gallons, or stage tanks of 1,000 gallons or less on separate parcels, which do not count. Farms that want the discount should go to transport size and write the plan.
References
- U.S. Energy Information Administration, Gasoline and Diesel Fuel Update, week of Oct 12, 2026, released Oct 14, 2026 — https://www.eia.gov/petroleum/gasdiesel/
- U.S. Energy Information Administration, Midwest (PADD 2) No. 2 Diesel Retail Prices, weekly series 1994–2026, downloaded Oct 15, 2026 — https://www.eia.gov/dnav/pet/hist/LeafHandler.ashx?n=PET&s=EMD_EPD2D_PTE_R20_DPG&f=W
- USDA Agricultural Marketing Service, Illinois Production Cost Report (Bi-weekly), report 3195, week ending Oct 2, 2026 — https://mymarketnews.ams.usda.gov/viewReport/3195
- CME Group NYMEX NY Harbor ULSD (HO) futures, Nov 2026 – Jun 2028 contracts, as displayed by Farmbucks, Oct 15, 2026, 8:05 a.m. CT, delayed — https://farmbucks.com/futures/energy/ulsd
- Federal Reserve Bank of Chicago, AgLetter, Aug 2026 (second-quarter 2026 survey; farm operating loans 7.12%) — https://www.chicagofed.org/publications/agletter/2025-2029/august-2026
- Tank Retailer, Midwest Industrial Tanks Double Wall Fuel Storage Tank (UL 142) listing, accessed Oct 15, 2026 — https://tankretailer.com/products/midwest-industrial-tanks-double-wall-fuel-storage-tank
- Tank Retailer, Newberry UL 142 Double Wall Skid Tank (Large) listing, accessed Oct 15, 2026 — https://tankretailer.com/products/newberry-ul-142-double-wall-skid-tank-large
- Steel Tank and Fabricating Corp., 4000 Gallon Horizontal Double Wall UL-142/F921 Tank listing, accessed Oct 15, 2026 — https://www.steeltankandfabricating.com/product/4000-gallon-horizontal-double-wall-ul-142-f921-tank/
- Dultmeier Sales, Fill-Rite FR711VA 115 Volt Fuel Transfer Pump with Mechanical Meter, 20 GPM, with Hose & Automatic Nozzle, accessed Oct 15, 2026 — https://www.dultmeier.com/115-volt-fuel-transfer-pump-with-mechanical-meter-20-gpm-with-hose-automatic-nozzle
- State of Arkansas, Mansfield fuel contract (OMNIA), Schedule A — Customer Pricing, undated, accessed Oct 15, 2026 — https://sas.arkansas.gov/wp-content/uploads/State-of-Arkansas-pricing.pdf
- North Carolina Department of Administration, Statewide Term Contract 1510B, Category B (on-road ULSD), week 77, Aug 18–25, 2023 — https://www.doa.nc.gov/html/fuels/1510b/1510b-catb-w77
- U.S. EPA, "Oil Spill Prevention, Control, and Countermeasures (SPCC) Program: Farms and the Water Resources Reform and Development Act (WRRDA)," fact sheet, Apr 24, 2015 — https://www.epa.gov/sites/default/files/2015-06/documents/final_wrrda_fact_sheet_4-24-15.pdf
- 40 CFR 112.1, General applicability (via Cornell Legal Information Institute), accessed Oct 15, 2026 — https://www.law.cornell.edu/cfr/text/40/112.1
- 40 CFR 112.5, Amendment of SPCC Plan by owners or operators (via Cornell Legal Information Institute), accessed Oct 15, 2026 — https://www.law.cornell.edu/cfr/text/40/112.5
- Jonathan L. Ramseur, Congressional Research Service, "Spill Prevention, Control, and Countermeasure (SPCC) Regulations: Background and Issues for Congress," R44536, Jan 5, 2017 — https://www.everycrsreport.com/reports/R44536.html
- Peggy Hall, Ohio State University Extension, "Farm Oil Spill Prevention Plans: Required or not?," Farm and Dairy, Oct 24, 2013 — https://www.farmanddairy.com/?p=161910
- Gary L. Hawkins and L. Mark Risse, University of Georgia Extension, "Regulations for On-Farm Storage Tanks in Georgia," Bulletin 1136, revised Nov 14, 2023 — https://fieldreport.caes.uga.edu/?p=872
- Mandi Goplen, Cenex, "How to shrink your bills with bulk fuel storage," Oct 13, 2022 — https://www.cenex.com/expert-advice-and-insights/bulk-fuel-storage
- Fisheries Supply, Biobor JF Diesel Fuel Additive listing (16 oz and 1 gal sizes, treat rates), accessed Oct 15, 2026 — https://fisheriessupply.com/biobor-bioborjf-diesel-fuel-additive
- Crop Root Zone, TRZ-0228, "Midwest Diesel Is at a Record $6.68. The Futures Curve Prices April 83 Cents Lower. Contract the Spring Gallons; Don't Fill the Tank for Them.," Sep 24, 2026 (futures spread, tank capital at 5.25%, seasonal pattern, SPCC rule status, cold-weather blending).
Disclosures
Crop Root Zone is an independent publication. Nothing here is investment advice. Market calls, where included, reflect the editors' own read and are not a recommendation to buy or sell any security.
RTK Saves About $1.39 an Acre in Overlap Over a Free Correction Signal at Today's Fertilizer Prices. On a Deere Receiver, the $7,500 Unlock Makes a 'Free' State Network Cost Nearly as Much as the $1,500 Subscription.
Deere's list prices put its satellite SF-RTK at $1,500 a receiver a year and the permanent RTK license that base stations and networks need at $7,500. Iowa and Minnesota charge nothing for their state networks and Illinois plans the same; Wisconsin charges $300 and Maine has proposed $500. Priced at October fertilizer and 2027 budget seed and chemical costs, sub-inch RTK saves about $1.39 a corn-soybean acre against Deere's free 6-inch signal and $3.98 against a 12- to 15-inch WAAS signal. On two receivers that makes RTK pay past about 1,870 to 3,550 acres against the free signal, depending on source, and 650 to 1,250 against WAAS. A farm-owned base never beats the subscription at Deere list prices below four receivers held ten years. No dealer publishes a base-station install price.
A John Deere StarFire 7000-series receiver lists at $4,300. Deere's free SF1 signal holds it to about 6 inches pass to pass. Getting to 1 inch costs either $1,500 a year for a satellite SF-RTK license or $7,500 once for the permanent RTK license that a base station or a network needs (Deere & Company, price pages dated Feb 1, 2025) [1]. Iowa's state network, with 83 Iowa DOT stations plus 21 borrowed from neighbouring states, charges nothing (Iowa DOT, accessed Oct 14, 2026) [5]. Minnesota's charges nothing either [6]. Dealer networks ask $800 to $1,250 a receiver a year [3][4]. This piece prices each route for a grain farm, values the overlap that RTK removes at this month's fertilizer prices, and finds the acres at which each one pays. The subscription is not where most of the money goes. On a Deere receiver, the one-time unlock is.
1. What each correction source costs
What's new: Deere's current product pages publish no prices. Its Precision Essentials page says only that the kit includes a StarFire 7500 with SF-RTK (Deere, accessed Oct 14, 2026) [2]. The last public Deere list we could find is a government price schedule dated February 1, 2025, which states that its prices are "recommended only" [1]. Two dealers publish network fees. Nobody we found publishes the cost of putting up a base station.
Evidence:
| Item | Price | Type | Accuracy stated | Source |
|---|---|---|---|---|
| StarFire 7000 or 7500 universal receiver | $4,300 | List, one-time | — | Deere, Feb 1, 2025 [1] |
| SF1 signal | $0 | Included | ±15 cm (6 in) pass to pass | [1] |
| SF-RTK, 1-year license | $1,500 | List, per receiver per year | ±2.5 cm (1 in) | [1] |
| RTK permanent license (base or network corrections) | $7,500 | List, one-time, per receiver | ±2.5 cm (1 in) | [1] |
| RTK radio, 450 MHz | $1,795 | List, per unit | — | [1] |
| RTK radio, 900 MHz | $1,345 | List, per unit | — | [1] |
| Ag-Pro RTK network, 1 year | $800 | Dealer asking, per receiver; capped at $4,000 for five | — | Ag-Pro, accessed Oct 14, 2026 [3] |
| GreenMark RTK network | $1,250 first, $1,100 second, $900 each after | Dealer asking, per receiver per year; 20% off at three or more | — | GreenMark, accessed Oct 14, 2026 [4] |
| Trimble CenterPoint RTX renewal | Not published | First year bundled with a new NAV-900 | "Nearly two centimeters or better" | Trimble, Oct 26, 2023 [10] |
| Emlid Reach RS3 base or rover receiver | $2,699 | Manufacturer list | — | Emlid, accessed Oct 14, 2026 [11] |
Basis: US dollars, before dealer discount, freight and installation. Source: as listed. Deere's price schedule says prices are recommended and subject to change; dealer pages carry no effective date.
Three points matter for the arithmetic. First, the $7,500 license is described as the one for corrections "from a local RTK Base Station" [1]. Ag-Pro's network page says its $800 subscription "Requires SF2/SF3 Ready and RTK Ready activations, sold separately" [3]. We therefore treat the $7,500 as the price of entry to every route except SF-RTK on a 7000-series receiver. Dealers discount it, and a grower should ask. Second, the license is per receiver, not per farm. Third, Deere's own 2010 bulletin on cellular RTK warned that "free access to a server does not equate to 'free RTK system'" and put the data plan at $40 to $100 a month a rover in that year's prices (Deere, Technology Talk Bulletin, Apr 2010) [12]. We found no current public figure for an ag data plan. We run the network cases at zero and at $600 a year, and label the second a scenario.
Other makes. Trimble announced in 2023 that a year of CenterPoint RTX comes with a new NAV-900 receiver and that renewal is a paid annual opt-in, but published no renewal price [10]. We found no current published unlock price for Trimble, Ag Leader or CNH receivers and do not estimate one.
2. What the state networks charge
What's new: The public networks are free where they exist, with two exceptions and one in the making. Maine's DOT, which has run its network free since 2007, said in September 2025 that it was considering a $500 annual fee per user account, with payment not required before August 1, 2026 [8].
Evidence:
| Network | User fee | Terms | Source |
|---|---|---|---|
| Iowa RTN | $0 | Free subscription, renewed every two years; 83 Iowa DOT stations plus 10 Minnesota, 4 Wisconsin and 7 Missouri sites | Iowa DOT, accessed Oct 14, 2026 [5] |
| MnCORS (Minnesota) | $0 | One login serves one rover at a time; accounts idle a year may be deactivated; agricultural mountpoints offered | MnDOT FAQ, updated Feb 21, 2025 [6] |
| Illinois (IDOT) | $0 planned | About 70 sites; installation began August 2024; described as "the first free public network of its kind in Illinois" | IDOT, Nov 7, 2024 [9] |
| WISCORS (Wisconsin) | $300 a year | $50 a month; organizations $300 each for five users, then $150, capped at $10,000 | Wis. Admin. Code Trans 58.06, effective Sep 1, 2020 [7] |
| MaineDOT CORS | $500 a year, proposed | Per user account; government bodies may apply for a waiver | MaineDOT, Sep 2025 [8] |
Basis: annual user fee, US dollars. Source: as listed. Data plans, receivers and unlocks are extra in every case.
We could not confirm whether Illinois's network is open to users as of October 2026. IDOT's November 2024 post is the latest official statement we found [9]. We could not open the Indiana and Michigan DOT pages and leave them out of the table rather than rely on search-result summaries. Minnesota's one-login-one-rover rule [6] means a farm running a planter tractor and a sprayer at once needs two accounts. That is free, but it is two accounts.
3. What the overlap is worth at October prices
What's new: Kansas State's method values a guidance upgrade as the change in overlap divided by implement width [13]. At this month's fertilizer asks and farmdoc's 2027 cost budgets, the step from a free 6-inch signal to RTK is worth about $1.39 a corn-soybean acre. The step from a WAAS-class signal is worth about $3.98.
Evidence. Kansas State's typical overlap settings are 12 to 15 inches for WAAS, 6 to 8 for OmniStar-class satellite corrections and 3 to 4 for RTK (Price, Kansas State University, MF3069, Dec 2012) [13]. We use the midpoints: 13.5, 7 and 3.5 inches. We place Deere's free SF1 at the 7-inch row because Deere rates it at ±6 inches [1], and that placement is ours. The method's field-efficiency gain is (old overlap − new overlap) ÷ implement width [13].
Input values per rotation acre, corn-soybean, 50/50:
- Nitrogen: 180 lb N on corn as anhydrous at $945 a ton is $103.72 an acre, or $51.86 per rotation acre. The rate is our assumption.
- Phosphate and potash: 56 lb P2O5 as MAP at $936 and 70 lb K2O as potash at $516.36 is $79.55 a year, the figure in our October 13 spreader piece [22]. Fertilizer prices are Illinois distributor asks, F.O.B., week ending October 2, the latest posted (USDA AMS, Oct 2, 2026) [17].
- Pesticides: $119 corn and $72 soybeans in farmdoc's 2027 central Illinois high-productivity budget, averaging $95.50 (Paulson et al., farmdoc daily, Sep 1, 2026) [18].
- Fuel and labor: fuel and oil of $30 and $26, hired labor of $28 and $25, averaging $54.50 [18].
| Input and implement | Value per rotation acre | Overlap removed, SF1 → RTK | Saving | Overlap removed, WAAS → RTK | Saving |
|---|---|---|---|---|---|
| Nitrogen, 40-ft toolbar* | $51.86 | 0.73% | $0.38 | 2.08% | $1.08 |
| P and K, 60-ft spreader* | $79.55 | 0.49% | $0.39 | 1.39% | $1.11 |
| Pesticide, 120-ft sprayer* | $95.50 | 0.24% | $0.23 | 0.69% | $0.66 |
| Fuel and labor, 40-ft average* | $54.50 | 0.73% | $0.40 | 2.08% | $1.14 |
| Total | $1.39 | $3.98 |
Basis: $/acre of a 50/50 corn-soybean rotation. Source: Crop Root Zone calculation on Kansas State University MF3069, Dec 2012 [13]; USDA AMS, Oct 2, 2026 [17]; farmdoc daily, Sep 1, 2026 [18]. *Implement widths and the nitrogen rate are Crop Root Zone assumptions. The fuel and labor line applies one average width to all field passes, which is a simplification.
| Upgrade | Saving, $/acre | |
|---|---|---|
| Free SF1 (6–8 in) to RTK | 1.39 | ███░░░░░░░ |
| WAAS (12–15 in) to RTK | 3.98 | ██████████ |
Basis: $/rotation acre. Source: Crop Root Zone calculation, table above. Bars scale to WAAS = 10 blocks.
Price sensitivity. Each $100 a ton on anhydrous moves the SF1-to-RTK saving by about 8 cents an acre. Farmdoc's own 2027 fertilizer line, $263 for corn and $77 for soybeans [18], is higher than our F.O.B. program. Scaling our fertilizer lines to it, the SF1-to-RTK saving rises to about $1.62.
The yardsticks behind the method. Iowa State put RTK loggers on two central Iowa farms without guidance in 2011. Across more than 2,500 acres it measured 3.3% overlap in planting and 7% in spring tillage (Darr, Iowa State University, Feb 24, 2012) [15]. Kansas State assumes an unaided driver overlaps 10% of toolbar width and a careful one 5% [13]. Its calculator tutorial suggests 8% for foam markers, 4% for lightbars and 0 to 1% for autoguidance in spraying and tillage (Dhuyvetter et al., Kansas State University, undated) [14]. A University of Sydney presentation put conventional-marker overlap at 2% to 4% on a 27-metre boom and the saving from cutting it to 10 cm at 1.6% to 3.6% (Whelan, undated) [19]. USDA's Economic Research Service estimated from 2010 survey data that guidance raised operating profit on corn farms by about 2.5% and net returns by 1.5% (Schimmelpfennig, USDA ERS, Oct 2016) [16].
Against those yardsticks, the step from no guidance to RTK is worth far more than the step from one signal to another. On the same inputs, the 10% unaided case is worth about $26.75 an acre and the 5% case about $12.68 (our arithmetic). That is the auto-steer decision, and most large grain farms made it long ago. The ERS report found guidance on over 50% of US corn and soybean acres and on about 80% of corn farms above 2,900 acres, in survey data from 2010 to 2013 [16]. The live decision now is which correction to pay for.
Ground Truth: RTK does not save seed on a row-crop planter. A 30-inch planter that drifts 3 inches does not plant the strip twice. It narrows one guess row and widens the next. Iowa State's measured planting overlap came from point rows and headlands [15], and that is work for row clutches and section control, not for a better signal. Where seed is drilled the arithmetic changes. On a 30-foot drill, half the rotation in soybeans at farmdoc's $87 seed cost [18] adds about 42 cents an acre to the SF1-to-RTK saving and $1.21 to the WAAS-to-RTK saving. A dealer's RTK payback sheet that counts corn seed on overlap is double-counting the planter's section control.
4. Where each option pays
What's new: We annualized each route for a farm running two receivers, typically a planting tractor and a sprayer that work the same weeks in spring. One-time costs are spread over seven years at 5.12% real interest, the rate this series has used for its sprayer and spreader pieces [21][22], with no resale value for a non-transferable license. That puts the $7,500 license at $1,302 a year, within $200 of the SF-RTK fee it replaces.
Evidence:
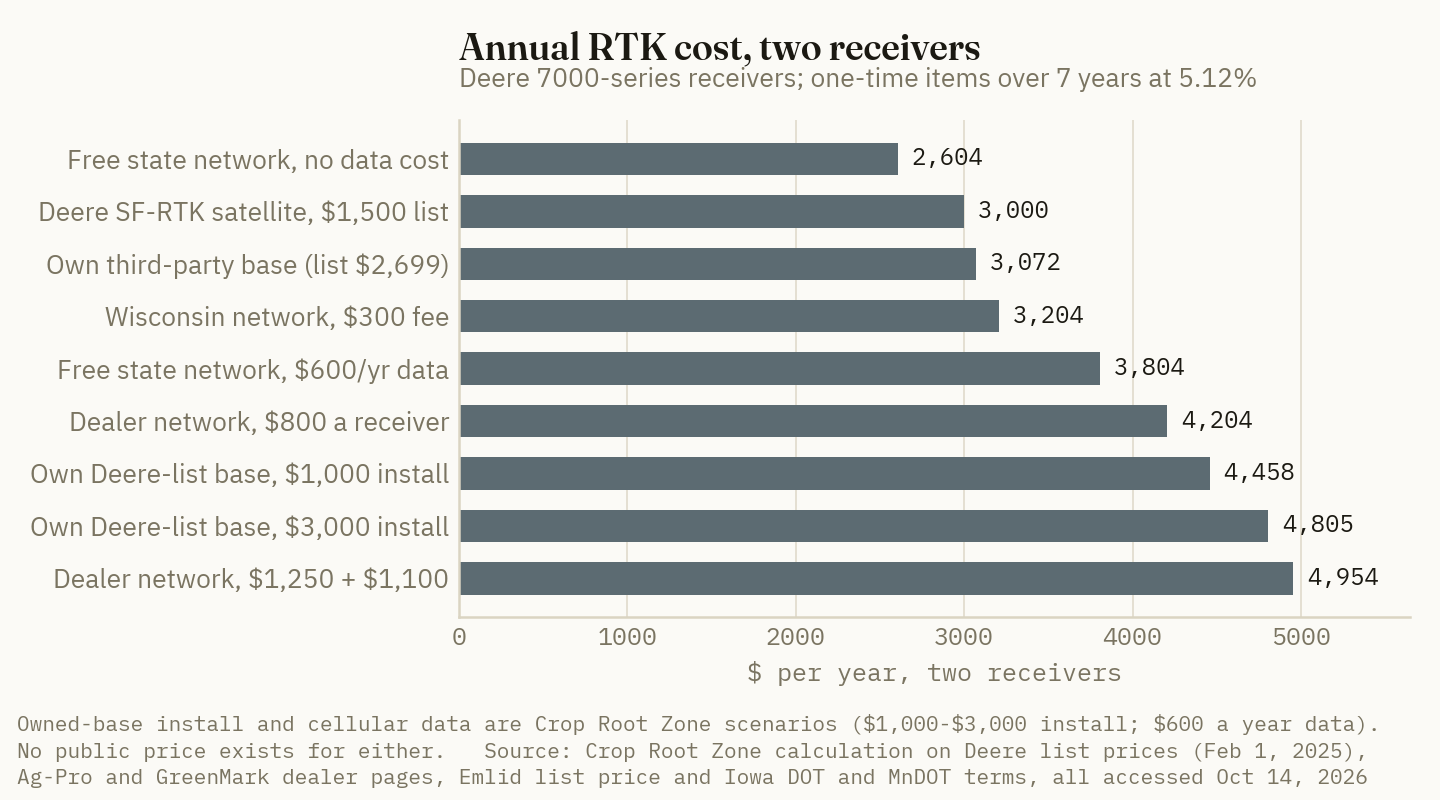
| Route, two receivers | Annual cost | Break-even acres vs free SF1 ($1.39) | Break-even acres vs WAAS ($3.98) |
|---|---|---|---|
| State network, $0 fee, no extra data cost | $2,604 | 1,867 | 654 |
| Deere SF-RTK, $1,500 list | $3,000 | 2,152 | 753 |
| Own third-party base, $2,699 list, corrections by internet* | $3,072 | 2,203 | 771 |
| Wisconsin network, $300 fee | $3,204 | 2,298 | 804 |
| State network, $600-a-year data plan* | $3,804 | 2,728 | 955 |
| Dealer network, $800 a receiver | $4,204 | 3,015 | 1,055 |
| Own base built from Deere list parts, $1,000 install* | $4,458 | 3,197 | 1,119 |
| Own base built from Deere list parts, $3,000 install* | $4,805 | 3,446 | 1,206 |
| Dealer network, $1,250 and $1,100 | $4,954 | 3,553 | 1,243 |
Basis: $/year for two receivers and acres of 50/50 corn-soybeans farmed. Source: Crop Root Zone calculation on prices in Sections 1 and 2 [1][3][4][5][6][7][11] and savings in Section 3. Every route except SF-RTK includes two $7,500 Deere RTK licenses. The Deere-parts base is a $4,300 receiver and a $1,795 radio, plus a $1,795 radio on each rover. *Crop Root Zone scenarios: no public install price exists for a farm base station, no current public price exists for a farm data plan, and the third-party base assumes the rover will accept its corrections, which a dealer must confirm. We could not establish whether the base receiver itself needs the $7,500 license; if it does, add $1,302 a year to both Deere-parts rows.
$7,500
Deere's list price for the permanent RTK license on one StarFire 7000-series receiver, which every base-station or network route needs. Spread over seven years it costs $1,302 a year, so a "free" state network saves only $198 a year a receiver against the $1,500 satellite subscription. (Deere & Company price pages, Feb 1, 2025; Crop Root Zone calculation)
Five readings from the table:
- Against the free signal, RTK is a large-farm purchase on overlap alone. At $1.39 an acre, no route pays below about 1,870 acres on two receivers.
- Against WAAS, RTK pays on an ordinary farm. Every route clears between 650 and 1,250 acres. A farm whose receivers run on WAAS-class corrections is the one for which the overlap case is strongest.
- The license, not the network fee, sets the order. The free network beats SF-RTK by only $198 a receiver a year. The license pays back against SF-RTK in about 5.9 years with no data cost, and in about 11 years with $600 of data. Past the seven-year horizon the network keeps getting cheaper, because the license is paid off and the subscription is not.
- A farm-owned base at Deere list prices does not beat the subscription. Each rover's license and radio alone come to $1,613 a year over seven years, above the $1,500 SF-RTK fee before the base is counted. At four receivers held ten years, with a $1,000 install, the owned base reaches $1,442 a receiver, just under SF-RTK. The cheaper third-party base reaches $1,419 a receiver at four receivers over seven years, if the rovers accept it.
- Dealer networks are the most expensive route on these numbers, because they stack an annual fee on the same license. They sell a dealer who answers the phone and a network maintained for farm use, and Section 5 notes what that is worth.
When the license is already paid. Many farms bought RTK activations years ago. Then the arithmetic changes completely. A free state network costs nothing but data and pays at any acreage. A dealer network at $800 pays against the free signal at about 575 acres a receiver. SF-RTK at $1,500 needs about 1,075 acres a receiver. Moving an already-unlocked receiver from a paid network or SF-RTK to a free state network saves $800 to $1,500 a receiver a year, if coverage and cellular service hold up in the field.
Ground Truth: The decision is made at the unlock, not at renewal. A grower buying a new Deere receiver should price the $7,500 license against seven years of SF-RTK before signing. If the farm sits inside Iowa's or Minnesota's network, or Illinois's once it opens, and the receiver will be kept that long, the license wins and every later year is nearly free. If the farm is in Wisconsin or Maine, or outside cellular coverage, or trades receivers every few years, the $1,500 subscription is the cheaper and simpler choice. Building a base station almost never wins on cost at list prices below four receivers. A farm that builds one is buying independence from cellular coverage, not a discount. Before choosing, ask the dealer what the license costs after discount and whether a trade-in carries it over. The answers can move the break-even by thousands of acres, and no public source states them.
5. What the arithmetic leaves out
What's new: The overlap case is the floor of RTK's value. Most of the remainder is repeatability, and none of it is priced by a public source we found.
Evidence:
Repeatability. Deere sells SF-RTK with long-term repeatability and a five-year guarantee where applicable [1]. Driving the same line from one year to the next is what strip-till, banded fertilizer, sidedressing between rows and controlled traffic depend on. Our strip-till piece found that a hired fall strip-till pass with banded dry fertilizer costs about $32 an acre in Iowa [23]. A farm doing that work needs RTK-class repeatability and should treat the overlap savings above as a bonus. A University of Kentucky whole-farm model found auto-steer raised net returns by up to 0.90%, or $3.35 an acre, on a Kentucky grain farm (Shockley, Dillon and Stombaugh, 2011) [20]. We read only the abstract and cannot say which correction source it assumed.
Coverage and downtime. Radio RTK needs line of sight to the base. Network RTK needs cellular service. Deere's 2010 bulletin put a standalone base's coverage at about 12 miles and warned that support issues can cost more when someone other than the dealer runs the network [12]. A day lost at planting can be worth more than a year of subscription. The table cannot price that, and a grower who has had the cell signal drop on a sidehill should weight it heavily.
Prices nobody publishes. We found no dealer that publishes an installed price for a farm base station, a tower or power supply, a current ag data plan, or a discounted license. We found no 2026 Deere list price; the February 2025 schedule [1] is the most recent public one. Trimble publishes no CenterPoint RTX renewal price [10]. Every one of these numbers is negotiated, and the table above is a list-price comparison, not a quote.
Fees can arrive. Maine ran its network free for 18 years before proposing a $500 fee [8]. Wisconsin has charged $300 since 2020 [7]. A grower who buys a $7,500 license to use a free state network is betting that the network stays free for seven years. At Wisconsin's $300, the license plus the fee already costs about $100 a receiver a year more than SF-RTK over seven years (our arithmetic). At Maine's proposed $500 the gap is $300.
Section control. Kansas State's calculator values guidance and section control together, because both act on the same doubled-up ground [14]. Section control's payoff depends on field shape and headland length, which the calculator asks for and our pass-to-pass arithmetic ignores. The signal upgrade and the section-control upgrade are separate purchases with separate break-evens.
Who should buy what. On these numbers, a corn-soybean farm under about 1,900 acres that already runs Deere's free 6-inch signal will not recover RTK's cost from overlap alone and should buy it only for strip-till, banding or controlled traffic. A farm of any size still steering on a WAAS-class signal recovers RTK on overlap from about 650 to 1,250 acres, depending on source. A farm that already owns RTK licenses and sits inside a free state network should be using it, and is paying $800 to $1,500 a receiver a year too much if it is not. A farm buying new receivers inside a free network and planning to keep them seven years should buy the license. Everyone else should pay the $1,500.
References
- Deere & Company, "NC 2210B Ag Management Systems" price pages (StarFire 7000 and 7500 Universal Receivers, StarFire 7500 Integrated Receiver Upgrade Kit, RTK Radio 450 and StarFire 900, G5 displays), dated Feb 1, 2025; prices described as recommended and subject to change — https://www.deere.com/assets/pdfs/region-4/industries/government-and-military-sales/contracts/price-pages/agricultural/NC%202210B%20Ag%20Mgmt%20Systems_01Feb2025.pdf
- Deere & Company, "Precision Essentials With G5 Display" product page, accessed Oct 14, 2026 (no prices published) — https://www.deere.com/en-us/products-solutions/technology-solutions/precision-agriculture-technology-solutions/precision-essentials-with-g5-display-otuwmlbd
- Ag-Pro Companies, "Precision Ag Support and Services" (Ag-Pro RTK Access, 1 year), accessed Oct 14, 2026; no effective date shown — https://www.agprocompanies.com/ohio/precision-ag/support-and-services
- GreenMark Equipment, "RTK Dealer Network/Map," accessed Oct 14, 2026; no effective date shown — https://www.greenmarkequipment.com/integrated-solutions/rtk-dealer-network-map
- Iowa Department of Transportation, Iowa Real Time Network, "Frequently Asked Questions," accessed Oct 14, 2026 — https://iowadot.gov/rtn/IaRTN-resources/Frequently-asked-questions
- Minnesota Department of Transportation, "MnCORS GNSS Network Frequently Asked Questions," updated Feb 21, 2025 — https://www.dot.state.mn.us/surveying/cors/mncors_faq.html
- Wisconsin Administrative Code, ch. Trans 58, "Surveying Reference Station System User Fee" (Trans 58.06), created by CR 19-006, Register Sep 2020 No. 777, effective Sep 1, 2020 — https://docs.legis.wisconsin.gov/document/administrativecode/Trans%2058.05(1)(a)
- Maine Department of Transportation, "MaineDOT CORS Network Update – IT and Data Management Changes and Consideration of Subscription Model," September 2025 — https://www.maine.gov/dot/sites/maine.gov.dot/files/inline-files/Notice%20to%20Users%20of%20New%20Pivot%20Software.docx
- Illinois Department of Transportation, "CORS network installation kicks off," Nov 7, 2024 — https://idot.illinois.gov/about-idot/stay-connected/idot-blog/cors-network-installation-kicks-off.html
- Trimble Inc., "Trimble Introduces Integrated Precise Point Positioning as a Subscription for Agriculture Applications," press release, Oct 26, 2023 — https://news.trimble.com/2023-10-26-Trimble-Introduces-Integrated-Precise-Point-Positioning-as-a-Subscription-for-Agriculture-Applications
- Emlid, "Reach RS3" product page (list price), accessed Oct 14, 2026 — https://emlid.com/reachrs3/
- Deere & Company, Technology Talk Bulletin, "Cellular RTK" (comparison of dealer radio RTK and cellular RTK), April 2010 — https://www.deere.com/assets/pdfs/common/stellarsupport/CellularRTK_TechTalk_97e7c70d89048f9dff219149c54ba799d4bbe521.pdf
- Randy R. Price, Kansas State University Research and Extension, "Field Efficiency Gains You Can Expect from a Guidance System," MF3069, December 2012 — https://bookstore.ksre.ksu.edu/download/field-efficiency-gains-you-can-expect-from-a-guidance-system_MF3069
- Kevin C. Dhuyvetter, Craig M. Smith, Terry L. Kastens and Dietrich L. Kastens, Kansas State University AgManager, "Guidance & Section Control Profit Calculator — User's Tutorial," Version 3.1.10 (undated) — https://www.agmanager.info/sites/default/files/GuidanceSectionControlProfitCalculator.pdf
- Matt Darr, Iowa State University Integrated Crop Management, "Precision Ag Technology Savings," Feb 24, 2012 — https://crops.extension.iastate.edu/cropnews/2012/02/precision-ag-technology-savings
- David Schimmelpfennig, USDA Economic Research Service, "Farm Profits and Adoption of Precision Agriculture," ERR-217, October 2016 — https://www.ers.usda.gov/sites/default/files/_laserfiche/publications/80326/ERR-217.pdf
- USDA Agricultural Marketing Service, Illinois Production Cost Report (Bi-weekly), report 3195, week ending Oct 2, 2026 (latest posted as of Oct 14, 2026) — https://www.ams.usda.gov/mnreports/ams_3195.pdf
- Nick Paulson, Gary Schnitkey, Carl Zulauf and Bradley Zwilling, "Illinois Crop Budgets for 2027," farmdoc daily (16):157, University of Illinois, Sep 1, 2026 (Table 2, central Illinois high-productivity farmland, 2027P) — https://farmdocdaily.illinois.edu/2026/09/illinois-crop-budgets-for-2027.html
- Brett Whelan, University of Sydney Precision Agriculture Laboratory, "Is there potential value in more precise broadacre cropping system management?" presentation slides (undated; posted 2019) — https://precision-agriculture.sydney.edu.au/wp-content/uploads/2019/08/Potential_Value.pdf
- Jordan M. Shockley, Carl R. Dillon and Timothy S. Stombaugh, "A Whole Farm Analysis of the Influence of Auto-Steer Navigation on Net Returns, Risk, and Production Practices," Journal of Agricultural and Applied Economics 43(1):57–75, February 2011 (abstract read; full text not opened) — https://doi.org/10.1017/S1074070800004053
- Crop Root Zone, TRZ-0268, "A New 120-Foot Sprayer Needs About 5,600 Acre-Passes a Year to Beat Iowa's $9.35 Custom Rate. A Seven-Year-Old One Needs 3,300. A Pull-Type Needs 1,150.," Oct 9, 2026.
- Crop Root Zone, TRZ-0276, "Hiring a Dry Fertilizer Pass Costs $8.56 an Acre in Iowa at Today's Diesel. A New Pull-Type Spinner Asked at $36,362 Beats That Past About 640 Acres a Year. Renting One at the Surveyed $7.05 Does Not.," Oct 13, 2026.
- Crop Root Zone, TRZ-0272, "A Hired Fall Strip-Till Pass With Banded Dry Fertilizer Costs About $32 an Acre in Iowa. A New 16-Row Rig Asked at $249,000 Beats That Past About 1,300 Acres. The Trials Do Not Let It Cut the P and K Rate.," Oct 12, 2026.
Disclosures
Crop Root Zone is an independent publication. Nothing here is investment advice. Market calls, where included, reflect the editors' own read and are not a recommendation to buy or sell any security.
A Phosphite Spray Supplies Under 2 Pounds of Phosphate-Equivalent an Acre at $12 to $19 a Pound, 14 to 23 Times What MAP Charges. It Earns Its Cost as a Fungicide on Potatoes, Not as Phosphorus on Corn, Soybeans or Wheat.
Phosphite is not a form of phosphorus that crops can use. Soil microbes have to oxidize it first, and inside the plant it can block the signals that tell the crop it is short of phosphate. At ProPhyt's label rate of 3 to 4 pints an acre and public retail prices of $42 to $68 a gallon, one pass costs $16 to $34 before application. That pass has to return 3.1 to 6.7 bushels of December 2027 corn. The only replicated North American row-crop trials we found, at Oklahoma State, showed no consistent yield gain. Potato trials show real control of pink rot and late-blight tuber rot. The labels contradict each other: Wisconsin bans phosphite from phosphate guarantees, California requires it to be guaranteed as total rather than available phosphate, and a national fertilizer label we read guarantees it as 40% available. Buy phosphite as a fungicide against water molds, never as phosphorus.
Phosphite products are back on row-crop spray programs this fall. MAP averaged $979 a ton at retail in the first week of October (DTN/Progressive Farmer, Oct 14, 2026) [18], and growers are looking for cheaper phosphorus. Phosphite is sold to them two ways. One is as a foliar fertilizer with a phosphate number in its grade. The other is as an EPA-registered fungicide marketed as a "plant health" pass on corn, soybeans and wheat. The chemistry is the same in both: potassium salts of phosphorous acid, H3PO3, which carries one fewer oxygen than the phosphate, H3PO4, that crops take up. That missing oxygen decides almost everything in this piece. It is why phosphite does not feed a crop phosphorus and why it works against water molds. It is also why one product can carry three different labels depending on the state. This piece covers the chemistry, the trials, the per-acre arithmetic at December 2027 futures, and what each label allows a seller to claim.
1. Phosphite is not phosphorus the crop can use, and a foliar pass carries very little of it
What's new: None of the research is new. The marketing is what keeps coming back. A 2001 review in the Journal of Plant Nutrition found that phosphites were being sold either as fungicides or as a superior source of plant phosphorus. It found published support for the fungicide use against Phytophthora-type pathogens, and no evidence that phosphite works as a sole phosphorus source (McDonald, Grant and Plaxton, 2001, abstract as indexed by AGRIS) [2]. A 2009 review in Soil Science and Plant Nutrition put the same question in its title: is phosphite a fungicide, a fertilizer or a bio-stimulator? (Thao and Yamakawa, 2009) [1]. Soil bacteria can oxidize phosphite to phosphate. Until they do, the plant cannot use it as a nutrient.
Evidence: Plant-physiology work has found a second problem. In Plant Physiology, Varadarajan and colleagues reported that phosphite "suppressed many of the Pi starvation responses" in plants (Varadarajan et al., 2002) [3]. Those responses are how a phosphorus-short root system reacts: growing root hairs and switching on phosphate transporters. Phosphite shuts them off while supplying no phosphate. A German field and pot study on corn reported the field consequence. Foliar phosphite caused severe growth damage to corn grown with too little phosphorus, and phosphite given as the only phosphorus source caused anything from stunting to plant death. Phosphite was still present in the harvested plants, unoxidized (Schroetter et al., 2006, abstract as indexed; the full text sits behind a bot check we did not pass) [4]. California's mandatory label wording accepts the slow oxidation. It warns that a soil-applied phosphite may give "a lesser response from the initial crop", with a better response from later crops (CDFA, Rev. Oct 2, 2019) [15].
The amount delivered is the second problem. ProPhyt, a potassium phosphite fungicide, carries 4.2 pounds of phosphorous-acid equivalent per gallon (EPA-accepted master label, Oct 24, 2025) [11]. At its row-crop rate of 3 to 4 pints an acre, a pass applies 1.6 to 2.1 pounds of H3PO3. Phosphorous acid is 37.8% phosphorus by weight. Even if every molecule were oxidized, 4 pints would equal 1.8 pounds of P2O5 an acre (2.1 × 0.378 × 2.291).
| What is applied or removed | lb P2O5 or P2O5-equivalent / acre | Basis | |
|---|---|---|---|
| 200 bu corn, grain removal | 74 | 0.37 lb P2O5/bu | ██████████ |
| 60 bu soybeans, grain removal | 45 | 0.75 lb P2O5/bu | ██████░░░░ |
| 70 bu wheat, grain removal | 33 | 0.47 lb P2O5/bu | ████░░░░░░ |
| ProPhyt-type potato tuber-rot program, 3 × 8 pt | 10.9* | 3 gal × 4.2 lb H3PO3, if fully oxidized | █░░░░░░░░░ |
| Phosgard 0-40-0 fertilizer label, 64 oz | 2.2 | As labelled "available" P2O5 | ░░░░░░░░░░ |
| ProPhyt-type row-crop pass, 4 pt | 1.8* | 0.5 gal × 4.2 lb H3PO3, if fully oxidized | ░░░░░░░░░░ |
| Oklahoma wheat trial, 2 Nutri-phite passes | 1.8 | 2 × 433 g P/ha | ░░░░░░░░░░ |
Source: Removal rates from University of Illinois Extension (75th-percentile values) [21]; yields are illustrative assumptions. ProPhyt concentration from the EPA-accepted label, Oct 24, 2025 [11]; Phosgard rate and guarantee from the JH Biotech label [16]; Oklahoma rate from Ali et al., 2014 [5]. *Crop Root Zone conversions: lb H3PO3 × 0.8655 = lb P2O5-equivalent. This is an upper bound, because it assumes complete oxidation. Bar column scales to 74 lb = ten blocks.
Before any question of whether it is available, a row-crop phosphite pass supplies about 2% to 5% of what one crop removes. Even a product that worked perfectly as a nutrient would be a rounding error on the phosphate budget.
2. What independent trials show: little in row crops, real disease control in potatoes
What's new: We searched for replicated, independent North American trials of foliar phosphite on corn, soybeans and wheat. We found two, both from Oklahoma State, and neither shows a dependable yield response. Potato research, where phosphite is used as a fungicide, has a much stronger record.
Evidence, wheat: Oklahoma State ran five site-years of winter wheat in 2009–2011 using Nutri-phite, a commercial phosphite foliar product (3% N, 8.7% P, 5.8% K). It was applied once or twice at 4 L/ha (Ali et al., International Journal of Agronomy, May 8, 2014) [5]. The authors reported no conflict of interest. Their abstract says grain yield "was increased by Nutri-phite treatments, especially at Morrison." Their conclusion says Nutri-phite "in all fields did not affect grain yield of wheat." The trial table explains the gap:
| Site-year | Soil test P (kg/ha) | No fertilizer | Soil N+P at 100% | Two Nutri-phite passes, no soil fertilizer | Separated statistically? |
|---|---|---|---|---|---|
| Perkins 2009/10 | 45 | 15.6 | 19.5 | 18.9 | No differences at all |
| Perry 2009/10 | 39 | 21.2 | 24.1 | 19.0 | No differences at all |
| Perkins 2010/11 | 43 | 10.4 | 21.0 | 19.4 | Phosphite = soil N+P > none |
| Morrison 2010/11 | 17 | 13.0 | 20.1 | 22.3 | Phosphite > none; = soil N+P |
| Perry 2010/11 | 42 | 7.0 | 16.9 | 6.5 | Soil N+P > phosphite = none |
Source: Ali, Sutradhar, Edano, Edwards and Girma, Oklahoma State University, Table 4, 2014 [5]. Yields in bu/acre, converted by Crop Root Zone from kg/ha (× 0.01487). Statistical groupings by Duncan's test at P ≤ 0.05, as reported. All five site-years were drought-limited, so yields are low.
Two passes of Nutri-phite supplied 0.87 kg of phosphorus and 0.3 kg of nitrogen per hectare. That cannot explain the 9-bushel gain at Perkins 2010/11 or Morrison as nutrition. At Perry the same treatment did nothing while soil fertilizer added 10 bushels. One year of corn work by the same group, presented in 2012, found no difference in leaf, stem or grain phosphorus from phosphite at V6 or VT. It found "no significant yield response" at 100% or 75% of crop need, and attributed the gains to nitrogen (Sutradhar et al., ASA-CSSA-SSSA poster abstract, 2012) [6]. A search-indexed copy of the presentation credits partial support from Biagro Western; we could not open the file to confirm this.
Evidence, soybeans: We found no replicated North American trial of foliar phosphite for soybean yield. A 16-state university trial of six national foliar fertilizer products found no consistent soybean yield gain where no deficiency existed (DTN, May 19, 2023, reporting Naeve et al., Agronomy Journal) [29]. The products were nutrient blends, not phosphite, so it does not answer the phosphite question directly. Brazilian research indexed by search reports phosphite reducing soybean downy mildew without raising yield [30]. We could not open those papers. The disease phosphite's label targets on soybeans is downy mildew. An Ohio State scouting note calls that disease "a relatively common, minor disease" that "rarely causes yield loss in soybean" (Lindsey, Crop Protection Network, Jul 25, 2024) [10].
Evidence, potatoes: Here the record is a disease record, and it holds up. Washington State researchers found that foliar phosphorous acid usually and significantly reduced late-blight tuber rot. Pink rot was lower after three applications at several site-years. Pythium leak was not controlled (Johnson, Inglis and Miller, Plant Disease, 2004, abstract as indexed; the APS page returned 403) [7]. In Atlantic Canada, foliar phosphite at 5 L/ha, applied three times at four-week intervals, protected progeny tubers against pink rot and late blight. It did not cure tubers already infected, and it slowed sprouting in seed potatoes (Al-Mughrabi with AAFC scientists, Spud Smart, Fall 2010) [9]. North Dakota State tested rates and application methods in Minnesota commercial fields from 2006 to 2009, comparing phosphorous acid against mefenoxam with resistant and sensitive pink-rot isolates (Taylor, Pasche and Gudmestad, Plant Disease, Aug 2011) [8]. That work matters because mefenoxam resistance in the pink-rot pathogen is documented.
Ground Truth: Phosphite's yield story and its disease story are about different crops. In potatoes, the pathogens it controls (Phytophthora infestans, P. erythroseptica) cause storage losses big enough to measure. In corn, soybeans and wheat, the only labelled targets are downy mildews, which seldom set yield. A row-crop "plant health" pass is therefore buying a fungicide with almost nothing to control. That is why the independent wheat and corn data look like noise.
3. What a pass costs, and the bushels it has to return
What's new: Retail prices for phosphite concentrates are hard to find and mostly sold in 2.5-gallon jugs. The listings we could find, dated or not, fall between $42 and $68 a gallon. Large-volume ag-channel prices may be lower. We found none published.
Evidence:
| Product (label type) | Listed price | Pack | $/gal | Status of listing | |
|---|---|---|---|---|---|
| Phostrol (EPA fungicide) | $105.86 | 2.5 gal | 42.34 | Double A Vineyards, viewed Oct 19, 2026; sold out | ██████░░░░ |
| Fosphite (EPA fungicide) | $54.00 | 1 gal | 54.00 | SaferGro, viewed Oct 19, 2026 | ████████░░ |
| TurfGrassPro Phite 0-0-26 (fertilizer) | $132.57 | 2.5 gal | 53.03 | DoMyOwn, search-indexed, undated | ████████░░ |
| Phostrol (EPA fungicide) | $146.68 sale / $162.98 | 2.5 gal | 58.67 / 65.19 | DoMyOwn, search-indexed; page returned 403 [23] | █████████░ |
| Agrisel BioPhos Pro (EPA fungicide) | $162.20 | 2.5 gal | 64.88 | DoMyOwn, search-indexed, undated [24] | ██████████ |
| Agri-Fos (EPA fungicide) | $169.99 MSRP | 2.5 gal | 68.00 | BFG Supply, search-indexed; page now 404 [26] | ██████████ |
Source: retailer listings as noted [22]–[27]. Bar column scales to $68 = ten blocks. Concentrations differ: ProPhyt has 4.2 lb phosphorous-acid equivalent per gallon [11] and Agri-Fos 3.35 lb [28], so a dollar per gallon is not exactly a dollar per unit of active.
We priced a pass at ProPhyt's row-crop label rates [11] across that range. A low case is 3 pints at $42.34 a gallon, or $15.88 an acre. A central case is 4 pints at $55, the midpoint of the range, or $27.50. A high case is 4 pints at $68, or $34.00. In a tank mix with a fungicide or herbicide pass already planned, the product is the whole cost. As a pass of its own, add Iowa's 2026 average custom charge of $9.35 an acre for self-propelled ground spraying, or $12.00 for aerial (Iowa State University, 2026 Iowa Farm Custom Rate Survey, Mar 2026) [19].
$15 a pound
The central-case cost of the phosphate-equivalent in a phosphite pass ($27.50 ÷ 1.8 lb), assuming every molecule oxidizes. MAP phosphate costs $0.81 a pound with its nitrogen credited. (Crop Root Zone calculation from the ProPhyt label [11], retail listings [22]–[27] and DTN, Oct 14, 2026 [18])
On the phosphate yardstick, that is $11.65 a pound in the low case, $15.13 central and $18.70 high. Those are 14, 19 and 23 times the $0.814 cost of P2O5 in MAP, after crediting MAP's nitrogen at the anhydrous price. The MAP figure is our calculation from DTN's October 14 survey [18]. No phosphorus argument closes that gap. The pass has to pay in bushels.
At October 19 futures, December 2027 corn was $5.055, November 2027 soybeans $12.395 and July 2027 SRW wheat $6.835 (FXEmpire, delayed, Oct 19, 2026) [17].
| Cost scenario, $/acre* | Corn bu (% of 200) | Soybean bu (% of 60) | Wheat bu (% of 70) |
|---|---|---|---|
| 15.88, 3 pt low, tank-mix | 3.14 (1.6%) | 1.28 (2.1%) | 2.32 (3.3%) |
| 27.50, 4 pt central, tank-mix | 5.44 (2.7%) | 2.22 (3.7%) | 4.02 (5.7%) |
| 34.00, 4 pt high, tank-mix | 6.73 (3.4%) | 2.74 (4.6%) | 4.97 (7.1%) |
| 36.85, central + own ground pass | 7.29 (3.6%) | 2.97 (5.0%) | 5.39 (7.7%) |
| 46.00, high + aerial pass | 9.10 (4.6%) | 3.71 (6.2%) | 6.73 (9.6%) |
Source: Futures from FXEmpire, Oct 19, 2026 [17]; application cost from Iowa State, Mar 2026 [19]. *Product costs are Crop Root Zone scenarios built from public retail listings, not quotes. Yields of 200, 60 and 70 bu/acre are assumptions used only for the percentage columns.
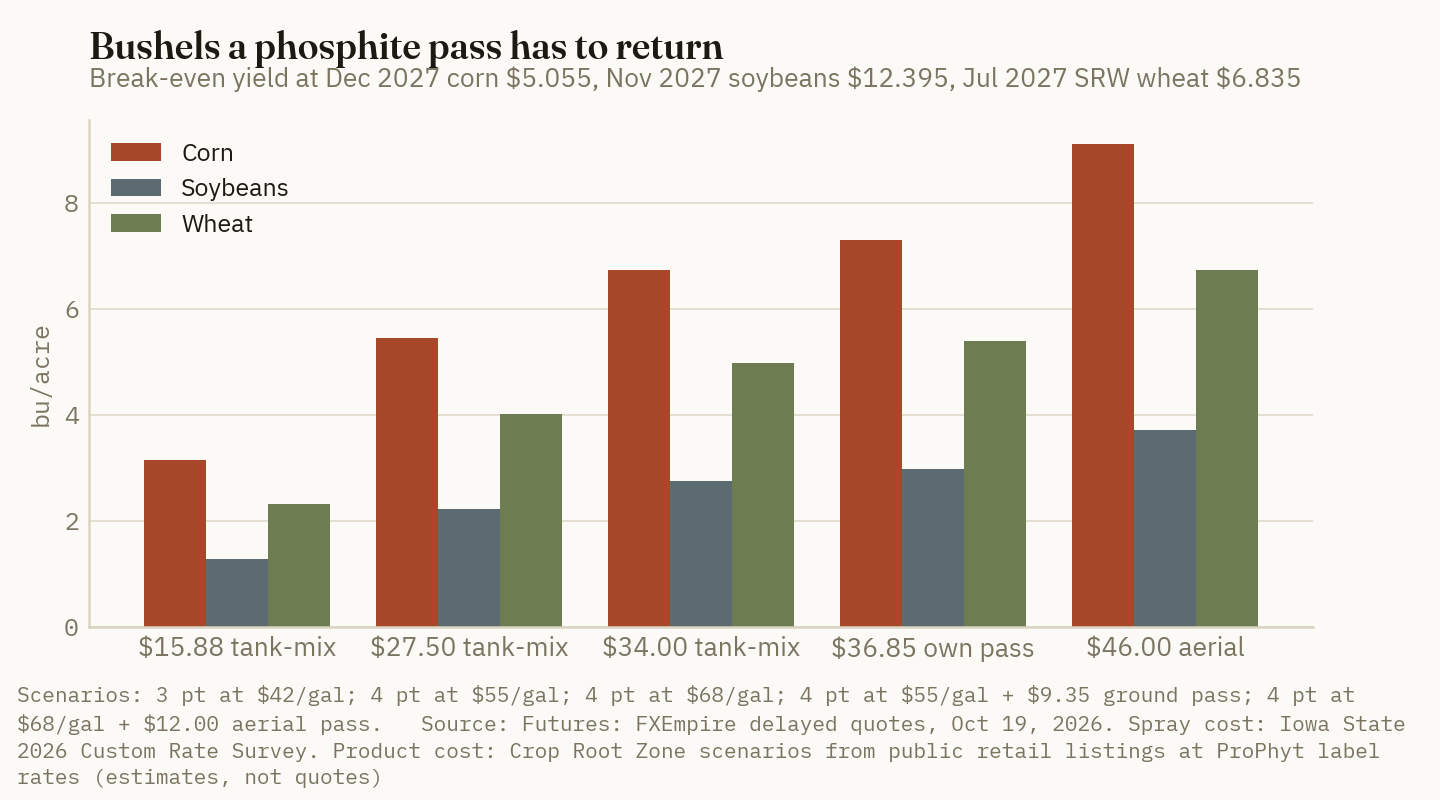
The comparison is uncomfortable for row crops. In Oklahoma, the central-case wheat break-even of 4 bushels was about a fifth of the trial's typical yield, and the treatment gave no consistent gain [5]. Potatoes look very different. USDA puts the 2025 crop at 462 cwt an acre and $10.80 a cwt, about $4,990 an acre gross (USDA NASS, Potatoes 2025 Summary, Sep 2026) [20]. A three-pass tuber-rot program at 4 pints and $55 costs $82.50 and needs 7.6 cwt, or 1.7% of yield. At ProPhyt's top in-season rate of 8 pints and $68, it costs $204 and needs 18.9 cwt, or 4.1%. Storage rot that phosphite is shown to reduce can exceed those margins in a bad year. That is a disease-pressure judgment for each field, not a guarantee.
Ground Truth: The break-even is close to the same share of crop value in both cases. On corn a single pass needs about 3% of yield; on potatoes a three-pass program needs about 2%. The difference is evidence. Potatoes have replicated trials showing that phosphite prevents a loss growers can measure. Corn, soybeans and wheat have no independent trial we could find showing a dependable gain of 3% or more. A row-crop grower paying $27.50 an acre is paying potato-program money without potato-program evidence.
4. The label decides the claim, and the labels disagree
What's new: The same potassium phosphite molecule is regulated under two regimes. Which one a product falls under sets what its seller can lawfully claim.
Evidence: Federal pesticide law defines a pesticide as any substance "intended for preventing, destroying, repelling, or mitigating any pest." It excludes substances "intended as plant nutrients" from the definition of plant regulators (7 U.S.C. § 136(u), (v)) [13]. A phosphite sold to control disease is a pesticide and needs EPA registration. Mono- and di-potassium salts of phosphorous acid were first registered in 1997 as a systemic fungicide against Pythium and Phytophthora. EPA's fact sheet adds a nuance that "biopesticide" marketing tends to leave out. Because the compound has "direct toxicity to the plant pathogen," phosphorous acid "is not classified as a biochemical". It is handled under a reduced data set "akin to" biochemical pesticides, within EPA's biopesticides division (EPA fact sheet, Oct 1998) [12]. Registration limits what can be said. EPA's October 2025 letter approving ProPhyt's amended label notes that a website referenced on a label "becomes labeling under FIFRA." It also says claims there may not "substantially differ" from what registration approved [11]. On row crops, those approved claims are downy mildew on corn (with resistant hybrids), on soybeans from flowering, and suppression of downy mildew on wheat [11].
A phosphite sold as a fertilizer falls under state fertilizer law, and the states disagree.
| Regime / jurisdiction | What a phosphite product may claim or guarantee | Source |
|---|---|---|
| Federal (FIFRA), EPA | Disease control on labelled crops and targets only; website claims count as labeling | EPA ProPhyt letter and label, Oct 24, 2025 [11] |
| Wisconsin | No fertilizer label may name phosphite as a fertilizer ingredient; no phosphate guarantee may include phosphite-derived phosphate | Wis. Admin. Code ATCP 40.10(9) [14] |
| California | Guarantee total (not available) phosphoric acid; show P as 0 or asterisked in the grade; three mandatory statements, including "supplemental fertilizer treatment" and a seed-injury warning | CDFA labeling aid, Rev. Oct 2, 2019 [15] |
| A national fertilizer label | "Available Phosphoric Acid (P2O5) … 40%," "derived from phosphorous acid"; "Prevents and corrects nutrient deficiencies" | JH Biotech Phosgard 0-40-0 label [16] |
| Turf-market fertilizer | Same chemistry sold as 0-0-26, with phosphorus shown as zero | TurfGrassPro Phite listing [25] |
Source: as cited in each row. We could not reach the text of the AAPFCO Official Publication to confirm whether a uniform national policy on phosphite exists. The state rules above are the positions we could verify.
The Phosgard label carries California's "may undergo a degree of conversion" statement. It also guarantees the same phosphorus as 40% available P2O5 and promises to "prevent and correct" deficiencies [16]. California's aid says a phosphite-only product must guarantee total phosphoric acid and flag that the phosphorus "is not in the available phosphate form" [15]. Wisconsin would not let the phosphorus be guaranteed as phosphate at all [14]. A grower in one state can therefore buy a jug that another state would treat as mislabelled. This publication has argued before that biostimulant labeling leaves the better-evidenced, pesticide-registered products easier to judge than the fertilizer-labelled ones (Crop Root Zone, TRZ-0091) [31]. Phosphite is the clearest case of that so far.
Ground Truth: Read the registration number before the grade. An EPA registration number means the product's claims have been reviewed, and the label says which disease it targets and at what rate. That is the only form of phosphite with a demonstrated return. A phosphate number in the grade of a phosphite fertilizer is, at best, a total-phosphorus figure the crop cannot use this season. In Wisconsin it would be illegal. It should never enter a phosphate budget or justify trimming MAP or DAP.
5. How to buy it, if you buy it
Buy it for a named disease. On potatoes, phosphite has replicated evidence against late-blight tuber rot and pink rot, as a protectant applied before infection, starting around tuber initiation [7][9][11]. It does not rescue tubers already infected [9]. Do not spray seed-potato fields without checking the sprouting caution [9]. On corn, soybeans and wheat the labelled target is downy mildew, so the question is whether downy mildew is costing that field yield. In most Corn Belt fields it is not [10].
Do not count it as phosphorus. At 1.8 pounds of P2O5-equivalent at most per pass, and $12 to $19 a pound for it, phosphite cannot substitute for phosphate fertilizer at any price MAP has seen. On low-testing soils it can also mask the plant's own deficiency response [3][4]. Set the phosphate rate from the soil test and buy phosphate.
Price it per pint and per pass. Rates differ by label and concentrations differ by brand: 4.2 versus 3.35 pounds of acid equivalent per gallon in the two labels we read [11][28]. Compare products by cost per acre at their own labelled rate, and add $9 to $12 if the product cannot ride an existing pass [19].
Watch the tank. ProPhyt's label calls for a spray-solution pH above 5.5 and no application to stressed plants [11]. Phosgard warns against tank mixes with copper [16]. Phytotoxicity is a real cost of an acid-based product.
Leave check strips if you try it on row crops. The only replicated North American data we found are five Oklahoma wheat site-years and one corn season, all with low yields [5][6]. Three paired strips per field, compared at the scale, is more evidence than most phosphite marketing to corn and soybean growers offers.
One result would change this read: a multi-state, replicated university trial of phosphite on corn or soybeans, run at current label rates with a fungicide-only check, showing a repeatable gain of 3% or more. We found no such trial. Until one appears, phosphite belongs on the fungicide line of a potato budget, and off the phosphorus line of every budget.
References
- H. T. B. Thao and T. Yamakawa, "Phosphite (phosphorous acid): Fungicide, fertilizer or bio-stimulator?", Soil Science and Plant Nutrition 55(2):228–234, 2009, doi:10.1111/j.1747-0765.2009.00365.x (citation as indexed; not reached directly).
- McDonald, Grant and Plaxton, "Phosphite (phosphorous acid): its relevance in the environment and agriculture and influence on plant phosphate starvation response," Journal of Plant Nutrition, 2001 (abstract as indexed by AGRIS) — https://agris.fao.org/search/ar/records/65df59d94c5aef494fe1f921
- Varadarajan et al., "Phosphite, an Analog of Phosphate, Suppresses the Coordinated Expression of Genes under Phosphate Starvation," Plant Physiology 129(3):1232–1240, 2002 — https://pmc.ncbi.nlm.nih.gov/articles/PMC166517
- Schroetter, Angeles-Wedler, Kreuzig and Schnug, "Effects of phosphite on phosphorus supply and growth of corn (Zea mays)," Landbauforschung Völkenrode 56(3-4):87–99, 2006 (abstract as search-indexed; full text behind a bot check, not reached) — https://www.openagrar.de/servlets/MCRFileNodeServlet/timport_derivate_00030872/zi040335.pdf
- M. S. Ali, A. Sutradhar, M. L. Edano, J. T. Edwards, K. Girma, "Response of Winter Wheat Grain Yield and Phosphorus Uptake to Foliar Phosphite Fertilization," International Journal of Agronomy 2014, Article 801626, published May 8, 2014 (CC-BY) — https://doi.org/10.1155/2014/801626
- A. Sutradhar, D. Arnall, M. L. Edano, M. Ali, K. Girma Desta, J. Mosali, "Effect of Foliar Application of Phosphite on Growth and Yield of Corn," ASA-CSSA-SSSA Annual Meetings poster, Oct 2012 — https://scisoc.confex.com/crops/2012am/webprogram/Paper72760.html
- D. A. Johnson, D. A. Inglis, J. S. Miller, "Control of potato tuber rots caused by oomycetes with foliar applications of phosphorous acid," Plant Disease 88:1153–1159, 2004 (abstract as search-indexed; APS page returned 403) — https://www.apsnet.org/publications/plantdisease/2004/October/Pages/88_10_1153.aspx
- Taylor, Pasche and Gudmestad, "Effect of Application Method and Rate on Residual Efficacy of Mefenoxam and Phosphorous Acid Fungicides in the Control of Pink Rot of Potato," Plant Disease 95:997–1006, Aug 2011 (design as indexed) — https://www.apsnet.org/publications/plantdisease/2011/August/Pages/95_8_997.aspx
- Spud Smart, "In the Field: Controlling Pink Rot in Potatoes," Fall 2010 (K. Al-Mughrabi, New Brunswick Department of Agriculture, with AAFC scientists) — https://spudsmart.com/in-the-field-controlling-pink-rot-in-potatos-spud-smart-fall-2010/
- L. Lindsey, The Ohio State University, "Downy mildew," Crop Protection Network Bean Binoculars, scouted Jul 25, 2024 — https://cropprotectionnetwork.org/bean-binoculars/2024-07-25-000000-downy-mildew
- U.S. EPA, letter to Luxembourg-Pamol, Inc. accepting amended labeling, and ProPhyt master label (EPA Reg. No. 42519-22), Oct 24, 2025 — https://www3.epa.gov/pesticides/chem_search/ppls/042519-00022-20251024.pdf
- U.S. EPA, Office of Pesticide Programs, "Mono- and di-potassium salts of phosphorous acid (076416) Fact Sheet," issued Oct 1998 — https://www3.epa.gov/pesticides/chem_search/reg_actions/registration/fs_PC-076416_1-Oct-98.pdf
- 7 U.S.C. § 136 (FIFRA definitions), subsections (u) and (v) — https://www.law.cornell.edu/uscode/text/7/136
- Wisconsin Administrative Code ATCP 40.10(9), phosphite and phosphorous acid — https://docs.legis.wisconsin.gov/document/administrativecode/ATCP%2040.12(3)(d)
- California Department of Food and Agriculture, Fertilizing Materials, "Phosphorous Acid Labeling Aid," Rev. Oct 2, 2019 — https://www.cdfa.ca.gov/is/ffldrs/pdfs/PhosphorousAcid.pdf
- JH Biotech, Inc., Phosgard 0-40-0 product label (Greenbook asset dated Nov 28, 2022) — https://assets.greenbook.net/01-48-10-28-11-2022-Phosgard1c_0-40-0_Label.pdf
- FXEmpire, futures contract pages for corn (ZC), soybeans (ZS) and SRW wheat (ZW), delayed quotes timestamped Oct 19, 2026, 12:44 UTC — https://www.fxempire.com/commodities/zc/contracts ; https://www.fxempire.com/commodities/zs/contracts ; https://www.fxempire.com/commodities/zw/contracts
- DTN/Progressive Farmer, "UAN32 Leads Fertilizer Prices Higher Again in First Week of October," Retail Fertilizer Trends, Oct 14, 2026 — https://www.dtnpf.com/agriculture/web/ag/crops/article/2026/10/14/uan32-leads-fertilizer-prices-higher (MAP $979/ton, anhydrous $977/ton; per-pound P2O5 is a Crop Root Zone calculation, as in TRZ-0285)
- A. Johanns and C. Hart, Iowa State University Extension and Outreach, "2026 Iowa Farm Custom Rate Survey," Ag Decision Maker File A3-10, FM 1698, Mar 2026 — https://www.extension.iastate.edu/agdm/crops/pdf/a3-10.pdf
- USDA National Agricultural Statistics Service, Potatoes 2025 Summary, Sep 2026 — https://esmis.nal.usda.gov/sites/default/release-files/796078/pots0926.pdf
- University of Illinois Extension, "Soil phosphorus," accessed Oct 19, 2026 — https://extension.illinois.edu/crops/soil-phosphorus
- Double A Vineyards, Phostrol Agricultural Fungicide (phosphorous acid), 2.5 gal listing, viewed Oct 19, 2026 — https://doubleavineyards.com/products/phostrol-agricultural-fungicide-phosphorous-acid
- DoMyOwn, Phostrol Fungicide listing (search-indexed text; page returned 403 to our fetch; sale price tied to an expired "Sale Ends 7/31" banner) — https://www.domyown.com/phostrol-fungicide-p-21783.html
- DoMyOwn, Agrisel BioPhos Pro Systemic Fungicide, 2.5 gal (search-indexed text, undated) — https://www.domyown.com/agrisel-biophos-pro-systemic-fungicide-25-gallons-p-14010.html
- DoMyOwn, TurfGrassPro Phite 0-0-26, 2.5 gal (search-indexed text, undated) — https://www.domyown.com/turfgrasspro-phite-26-p-17265.html
- BFG Supply, Agri-Fos 2.5 gal Systemic Fungicide, MSRP (search-indexed text; page returned 404 on Oct 19, 2026) — https://www.bfgsupply.com/order-now/product/31/343376/agri-fos-25gal-systemic-fungicide
- SaferGro, Fosphite product page, viewed Oct 19, 2026 — https://safergro.com/collections/all/products/fosphite
- U.S. EPA, Agri-Fos label (EPA Reg. No. 71962-1), 45.8% mono- and di-potassium salts, 3.35 lb phosphorous acid equivalent per gallon (as search-indexed) — https://www3.epa.gov/pesticides/chem_search/ppls/071962-00001-20140212.pdf
- DTN/Progressive Farmer, "Foliar Fertilizer Folly," May 19, 2023 (reporting a 46-site, 16-state university study, Agronomy Journal, doi:10.1002/agj2.20889) — https://www.dtnpf.com/agriculture/web/ag/crops/article/2023/05/19/university-study-finds-foliar-rarely
- Embrapa, foliar phosphite doses and timing on soybean (search-indexed summary only; the file could not be processed) — https://www.alice.cnptia.embrapa.br/alice/bitstream/doc/1002313/1/doses.pdf
- Crop Root Zone, TRZ-0091, "The Biostimulant Evidence Gap Is a Labeling Rule, Not a Science Problem"; see also TRZ-0285 on phosphorus-solubilizing biologicals, Oct 15, 2026.
Disclosures
Crop Root Zone is an independent publication. Nothing here is investment advice. Market calls, where included, reflect the editors' own read and are not a recommendation to buy or sell any security.
A Ton of Silicate Slag Has to Return 15 Bushels of Corn, or 6 Where the Field Needs Lime. Rice Needs 3 Hundredweight a Year. Florida Ran 28 Rice Trials to Set Its Rate. We Found One Replicated Corn Site, and It Showed No Yield Gain.
At an estimated $75 a ton delivered and spread, one ton of calcium silicate slag costs 14.8 bushels of December 2027 corn, 6.1 bushels of soybeans or 10.4 of wheat. A full liming credit on acid ground cuts that to 6.2, 2.5 and 4.3. A Florida-rate rice application needs about 3.1 hundredweight a year over two crops, roughly 4% of the US average yield, and a cane application about 1.6% a year. University trials back rice and sugarcane on low-silicon soils with soil-test calibrations. For corn and soybeans we found three independent replicated sites, and Louisiana wheat work that reports yield components. The one corn site showed no yield response. Silicon is a labelled 'beneficial substance', not a plant nutrient. Corn Belt buyers should price slag as lime and treat the silicon as a free option.
Silicon is the one element a fertilizer dealer can now sell under its own guarantee without anyone claiming it is a plant nutrient. The Association of American Plant Food Control Officials classed it as a plant "beneficial substance" by 2012, after a validated test for plant-available silicon in solid fertilizers (Korndörfer et al., ASA abstract, 2012) [19]. California has required a "Soluble Silicon (Si)" guarantee on every silicon label since January 1, 2024 (CDFA, Jul 13, 2020) [20]. The products sold under that guarantee fall into three groups. The first is calcium silicate slag, a by-product of iron, steel and elemental-phosphorus furnaces. The second is mined wollastonite. The third is liquid potassium silicate or silicic acid, sprayed at a few ounces to a few quarts an acre. The case for all three was built in the rice and sugarcane fields of Florida and Louisiana. It is now being made for corn, soybeans and wheat. This piece asks what a silicon application costs in bushels at this fall's prices, whether the liming value of calcium silicate offsets part of the bill, and how much independent replicated evidence stands behind each crop. Our earlier work on crushed rock for carbon removal [28] and on ag lime value [26][29] is not repeated here. This piece treats silicon as a crop input.
1. What silicon is on a label, and what it costs
What's new: Silicon's regulatory status is narrower than the marketing suggests. AAPFCO's definition of a beneficial substance covers a material "other than primary, secondary and micro plant nutrients" that research shows benefits a plant when applied. Product labels cite it as definition BSC-4, Available Silicon (Si) (Nuviatec CropSIL label) [22]. Moving silicon into the plant-nutrient list is a separate step, and it has not happened. Idaho's 2025 rulemaking summary of AAPFCO's Official Publication lists "T-9 Secondary and Micro Plant Nutrients (addition of silicon)" as moved to tentative (Idaho State Department of Agriculture, 2024–25) [21]. We found no record of a later vote making it official. The AAPFCO test for soluble silicon, adopted in 2017, covered dry products only. California later adapted it for liquids, and it allows a 10% investigational allowance on the guarantee [20]. A buyer can now verify a soluble-silicon number. A label guarantee says how much silicon is in the jug or the ton. It says nothing about yield.
Evidence: No public delivered price for agricultural silicate slag turned up in our search, from a supplier, an extension budget or a state survey. The last itemised university figure is from 2003, when Florida's economics fact sheet priced Everglades slag at $43.50 a ton including application (Alvarez, Datnoff and Snyder, UF/IFAS FE475, May 2004) [4]. The raw material is cheap at the plant. The US Geological Survey puts the 2025 average value of all US iron and steel slag at $40 a metric ton FOB plant. It notes that granulated blast-furnace slag for cement is under 30% of the tonnage but about 80% of the value, and that steel slags sell for as little as a few cents a ton (USGS, Feb 2026) [23]. That implies the steel slags average roughly $11 a metric ton or less at the plant (our estimate from USGS's shares). The farm price is freight, grinding and spreading. USGS notes that most slag "can be shipped only short distances by truck."
| Material | Price found | Basis | Silicon | Neutralizing value (CCE) |
|---|---|---|---|---|
| Ca silicate slag, Florida 2003 | $43.50/ton | Delivered and applied, Everglades | ~20% Si | Not stated |
| Ca silicate slag, 2026 scenario | $75/ton* | Delivered and spread | 17% Si | 81% |
| All US iron and steel slag, 2025 | $40/MT | FOB plant, all grades | Varies | Varies |
| Wollastonite, Ontario | $50/MT | FOB mine, producer's listing | ~25% Si | 60–65% (producer claim) |
| Liquid silicate sprays | No public row-crop price found | — | 0.06–0.13 lb Si/acre per program | None |
Source: UF/IFAS FE475, May 2004 [4]; USGS Mineral Commodity Summaries, Feb 2026 [23]; slag analysis from Tubana et al., ASA abstract, 2012 [13]; Canadian Wollastonite, product page accessed Oct 16, 2026, and a pricing page as indexed by search (the page returned "not found" on Oct 16, 2026) [24]; liquid silicon rate from the Huma Gro wheat report [18]. *Crop Root Zone estimate: the 2003 Florida figure carried forward by roughly 1.7 times general inflation. We test $40 and $110 alongside it. Wollastonite silicon content is our conversion of the producer's 1,200 lb SiO2 per tonne.
The liquid row is the one to read twice. In the only wheat trial we found that compared liquid and dry silicon side by side, the liquid program supplied 0.064 to 0.128 lb of silicon an acre in total. The dry wollastonite and slag treatments supplied 250 lb, about 2,000 to 3,900 times as much (Huma Gro, report on LSU research, undated) [18]. In Louisiana cane, 4 Mg/ha of slag raised the silicon removed by the crop by 48 kg/ha, about 43 lb an acre (Tubana et al., ASA abstract, 2012) [12]. A full liquid program supplies roughly 1/340th to 1/670th of that one increment. Whatever a foliar silicate does, it cannot replace the silicon a crop removes. The authors of the main US review estimate that US crops take up 9.55 million tons of silicon a year (Tubana, Babu and Datnoff, Soil Science, 2016; abstract read) [27].
2. The evidence, sorted by crop and by who ran it
What's new: The North American field record splits along two lines. The first is the crop. Rice and sugarcane on low-silicon soils have multi-site university calibrations. Corn, soybeans and wheat have a few sites. The second is who ran the work. Most of the university work used commercial slag and some carries industry co-authors. The yield claims made directly by product sellers have no independent replicated counterpart.
Evidence:
| Crop | Study | Who ran it | Size | Yield result |
|---|---|---|---|---|
| Rice | Korndörfer et al. 2001 [7] | UF/IFAS | 28 field experiments, Florida Histosols, 1992–96 | Critical soil Si set at 19 mg/L. Rate set from the trials; size of response not in abstract |
| Rice | FE475 literature review [4] | UF/IFAS | Review | Gains of 4.6% to 48% cited; 12% used in budget |
| Rice | Robichaux 2001 [10] | LSU | 1 site, 1995 | +13% at 3.3 Mg/ha |
| Rice | Tubana et al. 2014 [9]; Paye et al. 2018 [8] | LSU AgCenter | 5 sites, 2013–14; 12 sites, 2013–15, 4 reps | Significant gain at 2 of 5 sites, both in 2013; little response on high-Si, high-pH soils |
| Sugarcane | McCray et al., SS-AGR-350 [5] | UF/IFAS | 3 small-plot + 12 paired commercial fields | 0 to 9 tons cane/acre/yr; up to 23% yield loss without Si. Dolomite gave no response |
| Sugarcane | McCray, SC109 [6] | UF/IFAS | 2 mineral-soil sites | +11.7% and +16.0% cane at 3 t/acre |
| Sugarcane | Hallmark et al. 2002 [11]; Tubana et al. 2012 [12] | LSU AgCenter | 1 light soil; 2 alluvial soils, 4 reps | Slag beat calcitic lime and check (P<0.10). Gain on Commerce silt loam, none on Sharkey clay |
| Corn | Heckman & Provance-Bowley 2007 [15] | Rutgers | 1 site, 2002–03 | No yield response; less corn borer stem damage |
| Soybean | MSU Soil Fertility 2015 [16] | Michigan State | 1 site, PlantTuff at 3 rates vs ag lime | No significant difference (P = 0.63) |
| Soybean | Li, MSPB 73-2016 [17] | Mississippi State, soybean-checkoff funded | 1 site, 3 reps, 2016–17, potassium silicate | ~5% in one variety in 2016, none in the other; significant in 2017. Product "prohibitively expensive" |
| Wheat | White et al. 2014 [14] | LSU AgCenter | Several sites, 2013–14, 4 reps | Silicon moved yield components at P≤0.1; best yield at 2 t/ha in 2013 |
| Wheat | Huma Gro report [18] | Manufacturer's report of LSU plots | Not stated | +10 and +7 bu/acre for its liquid; no significance or dry-source yields reported |
| Wollastonite | Supplier materials [24] | Producer | Greenhouse and on-farm | Yield claims; no independent replicated row-crop trial found |
Source: as cited in each row. Several rows rest on conference abstracts or thesis abstracts, not full papers; see References. The MSU trial summary was blocked by the site's bot protection, so the row relies on its indexed summary.
Three things in the table are easy to miss. First, the strongest designs separate silicon from lime. Florida tested dolomite alongside slag and found no response to it [5]. Louisiana applied calcitic lime at the same rates and got no sugar gain from it [11]. Rutgers applied calcium carbonate and calcium silicate at the same neutralizing value, 7,840 kg/ha calcium carbonate equivalent, so silicon was the only difference [15]. Second, the industry ties are real but mostly at the level of material supply. The LSU slag-chemistry work carried a co-author from slag processor Edw. C. Levy [13]. The 2012 paper presenting the soluble-silicon test carried one from Harsco Metals and Minerals [19]. Florida's economics used one supplier's standard-grade product [4]. None of those papers reports a yield claim. The yield claims that come straight from sellers, Huma Gro's liquid wheat numbers [18] and wollastonite marketing [24], have no independent replicated counterpart that we could find. Third, there is no Arkansas row. We found no University of Arkansas Division of Agriculture silicon field trial in its public record.
28 vs 1
Florida set its rice silicon rate from 28 field experiments. The independent replicated corn record we found is one New Jersey site over two years, and it showed no yield gain. (Korndörfer et al., J. Plant Nutrition, 2001; Heckman and Provance-Bowley, ASA, 2007) [7][15]
3. The break-even, with and without a lime credit
What's new: At delayed quotes on the morning of October 16, December 2027 corn was $5.075, November 2027 soybeans $12.3575 and July 2027 Kansas City wheat $7.2275 (FXEmpire, Oct 16, 2026) [1]. USDA's September outlook holds the 2026/27 long-grain rice price at $13.50 per cwt, with an all-rice yield of 7,690 lb an acre (USDA ERS, Sep 15, 2026) [2]. For cane we value sugar at the statutory 24.00-cent raw cane loan rate for the 2025–2031 crops (7 U.S.C. 7272) [3]. That is a mill-level floor. A grower receives a share of it, so the grower's break-even in pounds is higher.
Evidence: Calcium silicate is also a liming material. The LSU slag analysed at 17% silicon carried 81% calcium carbonate equivalent [13], so a ton holds 1,620 lb of CCE. Ag lime costs 2.7 cents per pound of effective calcium carbonate, delivered and spread, at Missouri's 2026 survey price of $30.58 a ton [25][26]. At that rate a ton of slag displaces $43.74 of lime if all of it reacts like fine lime, or $21.87 if half does. Slag is often coarser than ag lime, and we found no fineness data for the farm product. The credit only exists where the field needed lime. Both of Florida's mineral-soil cane sites tested pH 7.5 [6], so there it is zero.
| One ton per acre, $75 delivered and spread* | Corn bu | Soybean bu | Wheat bu | Corn bu if 2 crops share it | |
|---|---|---|---|---|---|
| No lime credit (neutral or alkaline soil) | 14.8 | 6.1 | 10.4 | 7.4 | ██████████ |
| Half lime credit ($21.87) | 10.5 | 4.3 | 7.4 | 5.2 | ███████░░░ |
| Full lime credit ($43.74) | 6.2 | 2.5 | 4.3 | 3.1 | ████░░░░░░ |
| At $40/ton, full lime credit | 0 | 0 | 0 | 0 | ░░░░░░░░░░ |
| At $110/ton, no credit | 21.7 | 8.9 | 15.2 | 10.8 | ███████████████ |
Source: futures from FXEmpire, Oct 16, 2026 [1]; lime value from University of Missouri Extension G302, Mar 2026, and TRZ-0257 [25][26]; CCE from Tubana et al., 2012 [13]. *Slag prices are Crop Root Zone scenarios, not quotes. The bar column scales corn bushels, 14.8 = ten blocks; the $110 row runs past the scale. "Two crops" assumes a two-season residual, as Florida's rice budget did [4]. No row-crop residual study exists.
The specialty crops price very differently. A Florida-rate rice application of 1.11 tons an acre [4] costs $83 at our scenario price. Spread over the two crops Florida assumed, it needs 3.1 cwt a year, about 4.0% of the US average yield. The evidence is 4.6% to 48% in the Florida literature [4], 13% at the Louisiana site [10], and significant gains at 2 of 5 recent Louisiana sites [9]. A Florida mineral-soil cane field testing low for silicon gets 2 to 3 tons an acre [6]. Florida rates are meant to last a 3-year crop cycle [5]. At 2 tons and $75, that is $50 a year, or about 208 lb of sugar at the loan rate. That is 1.6% of the 6.47 tons of sugar an acre on Florida's untreated check, against measured gains of 0.81 and 0.93 tons [6]. Florida's 2004 budget found silicon profitable in both crops, with $152.94 an acre in added rice returns once disease, insect and grain-quality savings were counted [4]. That figure is two decades old, at $220-a-ton rice.
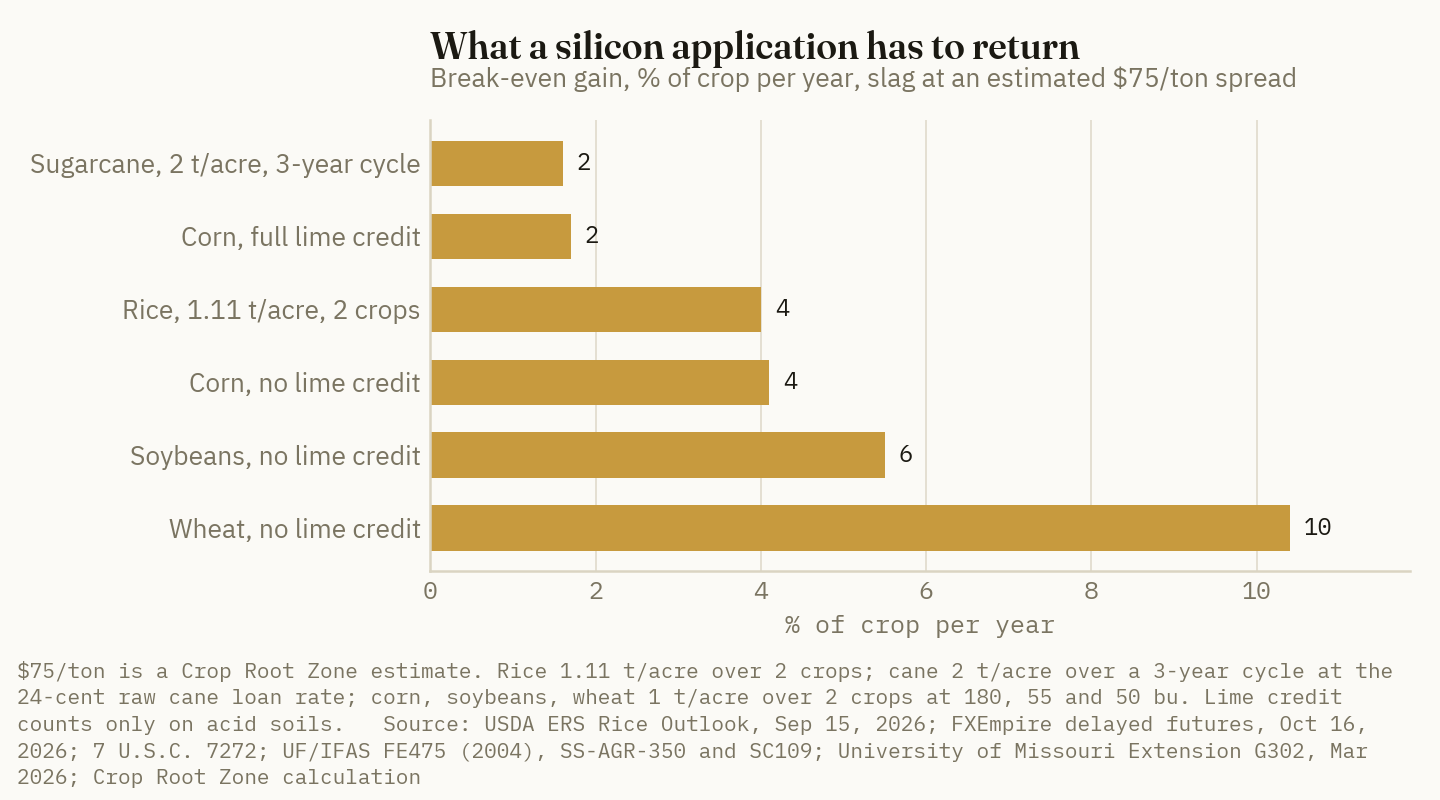
Ground Truth: The break-even turns on the lime credit, not the silicon. On an acid Corn Belt field, slag at $40 delivered and spread pays for itself as lime before the silicon counts at all. At $75, the silicon has to earn the remaining $31 a ton, about 6 bushels of corn, and the one independent corn trial that isolated silicon found nothing [15]. So the purchase test for a corn, soybean or wheat grower is not the silicon claim. It is the cost per pound of neutralizing value: (delivered-and-spread price) ÷ (2,000 × CCE × fineness). If that beats ag lime's 2.7 cents, buy the slag as lime and treat the silicon as a free option. If it does not, the silicon is a premium with no independent replicated row-crop yield behind it.
4. What the rice and cane record actually proves
The rice and cane case is strong because it is narrow. Every positive calibration comes with a soil test and a threshold. In Florida's organic soils, 0.5 N acetic acid-extractable silicon below about 15 g/m³ brings a "consistent response" to a first application. Above 25 g/m³ the recommendation is zero [5]. Florida's mineral-soil cane rates step from 3 tons an acre down to nothing as the soil test rises past 150 g/m³ [6]. Louisiana's 12-site rice work put the critical level at 41 mg/kg for grain yield on its preferred extraction, and found that "soils with high initial Si and pH" responded little [8]. The Louisiana cane data shows the soil matters as much as the crop: a gain on a Commerce silt loam and none on a Sharkey clay at the same station [12]. Even Florida's organic soils near Lake Okeechobee, with more mineral content, "should not require Si fertilization" [5].
That is the template the row-crop pitch lacks. No land-grant university in the Corn Belt or the Plains publishes a silicon soil-test calibration or a recommended rate for corn, soybeans or wheat that we could find. Without one, a grower cannot tell whether a field is the Commerce silt loam or the Sharkey clay. The slag also comes with chemistry to watch. In the LSU pot study it raised pH by up to 1.05 units at 8 Mg/ha and lowered extractable zinc in some soils [13]. On lakebed ground where liming past 6.5 already brings a manganese bill [29], an unneeded silicate application is a second liming mistake.
5. How to buy it, if you buy it
Rice and sugarcane on low-silicon soils. Pull the acetic-acid soil test and leaf silicon the extension guides call for [5][6][8]. Below the threshold, the published record supports a slag application at the extension rate. The break-even is a few percent of the crop, and the measured gains are larger. Above the threshold, skip it. Ask the supplier for a soluble-silicon guarantee by the AAPFCO method [20] and a CCE. Slags vary widely, and the Louisiana wheat and rice work used materials from 12% to 17% silicon [8][14].
Corn, soybeans and wheat. Price the slag as lime first, using the test in the Ground Truth above. Ask for CCE and a fineness analysis, which the price is meaningless without. Near a steel mill, where USGS says slag can move economically by truck [23], local material may beat ag lime on neutralizing value alone. Ontario wollastonite at its listed $50 a metric ton FOB has 60–65% CCE by the producer's figures [24]. Its full-credit lime value is about $36 to $39 a tonne before freight and spreading. Some Ontario supply has been given away under a carbon-removal program [28], which changes the price but not the agronomy.
Liquid silicon. Budget it as a stress-management bet, not a nutrient. At $5, $10 or $20 an acre, the break-even is 1.0, 2.0 or 3.9 bushels of corn (our scenarios; we found no public row-crop price). The only yield claim we found for it on wheat is the manufacturer's own [18]. The Mississippi soybean team that did see gains from soil-applied potassium silicate called the product cost "prohibitively expensive" for dryland beans [17].
Leave strips either way. With one replicated corn site in the public record, any farm that leaves untreated strips beside a silicate application is producing data the market does not have.
What would change this read is a multi-state land-grant trial in corn and soybeans on low-silicon, acid upland soils. It would need slag and ag lime at equal neutralizing value and a soil-test calibration attached, the Rutgers design at a dozen sites. Until that exists, silicon in a corn rotation is a liming purchase with an option attached.
References
- FXEmpire, futures contract pages for corn (ZC), soybeans (ZS) and KC HRW wheat (KE), delayed quotes timestamped Oct 16, 2026, 12:44 UTC — https://www.fxempire.com/commodities/zc/contracts ; https://www.fxempire.com/commodities/zs/contracts ; https://www.fxempire.com/commodities/ke/contracts
- USDA Economic Research Service, Rice Outlook: September 2026, RCS-26H, Sep 15, 2026 — https://ers.usda.gov/media/29637/rcs-26h.pdf
- 7 U.S.C. § 7272, Sugar program, subsection (a)(6), raw cane sugar loan rate of 24.00 cents per pound for the 2025–2031 crop years (Legal Information Institute, accessed Oct 16, 2026) — https://www.law.cornell.edu/uscode/text/7/7272
- J. Alvarez, L. E. Datnoff and G. H. Snyder, "The Economics of Silicon Applications on Rice and Sugarcane in Florida," UF/IFAS EDIS FE475, May 2004 (archival copy) — https://journals.flvc.org/edis/article/view/112367
- J. M. McCray, R. W. Rice and L. E. Baucum, "Calcium Silicate Recommendations for Sugarcane on Florida Organic Soils," UF/IFAS EDIS SS-AGR-350, Aug 2011 (archival copy) — https://journals.flvc.org/edis/article/view/119502
- J. M. McCray, "Calcium Silicate Recommendations for Sugarcane on Florida Mineral Soils," UF/IFAS EDIS SS-AGR-467/SC109, accessed Oct 16, 2026 — https://ask.ifas.ufl.edu/publication/SC109
- G. H. Korndörfer, G. H. Snyder, M. Ulloa, G. Powell and L. E. Datnoff, "Calibration of soil and plant silicon analysis for rice production," Journal of Plant Nutrition 24(7):1071–1084, 2001 (abstract read) — https://repository.lsu.edu/plantcrop_pubs/132
- W. Paye, B. Tubana, D. Harrell, T. Babu, Y. Kanke and L. Datnoff, "Determination of Critical Soil Silicon Levels for Rice Production in Louisiana Using Different Extraction Procedures," Communications in Soil Science and Plant Analysis 49(17):2091–2102, Sep 2018 (abstract read) — https://repository.lsu.edu/plantcrop_pubs/72
- B. Tubana, W. Paye, T. Babu et al., "Impact of Silicate Slag Fertilization on Grain Yield, Silicon Accumulation, and Plant Essential Nutrient Content of Rice," ASA-CSSA-SSSA Annual Meetings, 2014, abstract — https://scisoc.confex.com/crops/2014am/webprogram/Paper88763.html
- C. R. Robichaux, "The Effect of Calcium Silicate on Rice Yield and Sheath Blight Disease," PhD dissertation, Louisiana State University, 2001 (abstract read) — https://repository.lsu.edu/gradschool_disstheses/361
- W. B. Hallmark, V. Matichenkov, G. J. Williams and G. L. Hawkins, "Silica Deficiency in Louisiana Sugarcane," ASA-CSSA-SSSA Annual Meetings poster abstract, Nov 11, 2002 — https://download.clib.psu.ac.th/datawebclib/e_resource/e_database/agronomy/2002/Browse/pdf/S04-hallmark094122-Poster.pdf
- B. Tubana, Y. Kanke, M. Dalen, N. Chowdappa, J. Lofton and L. Datnoff, "Potential of Silicon Fertilization in Sugarcane Production in Louisiana," ASA-CSSA-SSSA Annual Meetings, Oct 23, 2012, abstract — https://scisoc.confex.com/crops/2012am/webprogram/Paper74644.html
- B. Tubana, N. Chowdappa, L. Datnoff and J. Yzenas (Edw. C. Levy Co.), "Changes in pH and Mehlich-3 Extractable Nutrients of Selected Soils From the Midwest and South USA As Influenced by Different Rates of Iron Calcium Silicate Slag," ASA-CSSA-SSSA Annual Meetings, Oct 23, 2012, abstract — https://scisoc.confex.com/crops/2012am/webprogram/Paper75336.html
- B. White, P. Dupree, B. Tubana, T. Babu and H. J. Mascagni Jr., "Effect of Varying Rates of Silicon and Nitrogen Fertilizer on Grain Yield, Yield Components, and Nutrient Uptake of Wheat," ASA-CSSA-SSSA Annual Meetings, Nov 3, 2014, abstract — https://scisoc.confex.com/crops/2014am/webprogram/Paper86277.html
- J. Heckman and M. Provance-Bowley, "Silicon Nutrition and European Corn Borer Resistance in Two Maize Hybrids," ASA-CSSA-SSSA International Meetings, Nov 7, 2007, abstract 296-14 — https://download.clib.psu.ac.th/datawebclib/e_resource/e_database/agronomy/2007/techprogram/AM07/P34575.HTM
- Michigan State University Soil Fertility Research Program, "Evaluation of Silicon Fertilizer as Compared to Ag Lime on Soybean," Mason, MI, 2015 trial summary, Feb 16, 2016 (summary as indexed by search; the PDF was blocked by the site's bot protection on Oct 16, 2026) — https://www.canr.msu.edu/soilfertility/Files/Annual-Results/2015/Soybean/SOYMSN09-15_Trial-Summary-_Feb-16-2016.pdf
- J. Li, Mississippi State University, "The effect of silicon on the growth and yield of soybean grown on nonirrigated sites," Mississippi Soybean Promotion Board project 73-2016, final report, May 2018 — https://mssoy.org/sites/default/files/documents/73-2016-li-soil-si-final-report.pdf
- Huma Gro (Huma, Inc.), "Liquid Sili-Max Improves Wheat Yield at Much Higher Efficiency than Conventional Dry Silicon Fertilizers," manufacturer's report of research by B. Tubana, LSU, undated, accessed Oct 16, 2026 — https://huma.us/editorial/blog/liquid-sili-max-improves-wheat-yield-at-much-higher-efficiency-than-conventional-dry-silicon-fertilizers
- G. Korndörfer, H. Pereira and M. C. Provance-Bowley (Harsco Metals and Minerals), "Silicon, a Plant Beneficial Substance: Methods to Quantify Plant Available Silicon in Fertilizers," ASA-CSSA-SSSA Annual Meetings, Oct 24, 2012, abstract — https://scisoc.confex.com/crops/2012am/webprogram/Paper71949.html
- California Department of Food and Agriculture, Fertilizing Materials Inspection Program, "Labeling and Enforcement of Products Guaranteeing Silicon," notice to licensees, Jul 13, 2020 — https://www.cdfa.ca.gov/is/ffldrs/docs/fertilizer/Notice_to_Industry-Silicon-07-13-20.pdf
- Idaho State Department of Agriculture, IDAPA 02.06.02 incorporation-by-reference synopsis of the AAPFCO 2025 Official Publication, Docket 02-0602-2401, 2024–25 — https://agri.idaho.gov/wp-content/uploads/24-25AdminRules/02.06.02.IBRS_.SPA_.pdf
- NuVia Technologies, CropSIL specimen label citing AAPFCO definition BSC-4, Available Silicon (Si), via FBN, accessed Oct 16, 2026 — https://www.fbn.com/api/store/market/documents/specimen-label/cropsil.pdf
- A. K. Hatfield, "Iron and Steel Slag," USGS Mineral Commodity Summaries 2026, Feb 2026 — https://pubs.usgs.gov/periodicals/mcs2026/mcs2026-iron-steel-slag.pdf
- Canadian Wollastonite, "How Canadian Wollastonite Works," accessed Oct 16, 2026 (60–65% CCE claim; 1,200 lb SiO2 per tonne) — https://canadianwollastonite.com/applications/soil-amendment/how-canadian-wollastonite-works/ ; $50/MT FOB listing as indexed by search at https://canadianwollastonite.com/?p=6498 (returned "not found" on Oct 16, 2026)
- D. Kientzy and B. Brown, "Custom Rates for Farm Services in Missouri," University of Missouri Extension G302, revised Mar 2026 (lime delivered and spread, $30.58/ton average) — https://extension.missouri.edu/publications/g302
- Crop Root Zone, TRZ-0257, "Ag Lime Costs 2.7 Cents a Pound of Effective Neutralizing Material, Delivered and Spread," 2026.
- B. S. Tubana, T. Babu and L. E. Datnoff, "A review of silicon in soils and plants and its role in US agriculture: History and future perspectives," Soil Science 181(9–10):393–411, Nov 28, 2016 (abstract read) — https://repository.lsu.edu/plantcrop_pubs/78
- Crop Root Zone, TRZ-0102, "It Takes 19 Tonnes of Rock to Remove One Tonne of Carbon. The Rock Costs $18.50," 2026.
- Crop Root Zone, TRZ-0134, "Lime Costs $30 a Ton and Is Nearly Impossible to Take Back. On Lakebed Soils It Buys You an Annual Manganese Bill," 2026.
Disclosures
Crop Root Zone is an independent publication. Nothing here is investment advice. Market calls, where included, reflect the editors' own read and are not a recommendation to buy or sell any security.
A $10-an-Acre Phosphate Biological Must Return 2 Bushels of Corn or Replace 12 Pounds of P2O5. In 56 Independent Prairie Site-Years It Lowered Yield 10 Times and Raised It 6.
At DTN's first-October retail prices, MAP phosphate costs 81 cents a pound once its nitrogen is credited. A Penicillium bilaiae product at $10 an acre therefore has to return 1.96 bushels of December 2027 corn or let a grower drop 12.3 pounds of P2O5 with no yield loss. The largest US corn dataset, 461 trials funded by the product's developer, found 2.7 bushels in replicated plots. Independent Prairie trials found no consistent gain: 5 significant increases and 9 decreases in 47 spring wheat trials, and 1 up and 1 down in 9 canola site-years. No independent replicated trial we found showed the inoculant substituting for phosphate fertilizer. Where a field can safely lose 12 pounds of P2O5, the soil test already allows the cut without the product.
MAP averaged $979 a ton at retail in the first week of October and DAP $934. Both were higher than a month earlier, and MAP was up 6% on the year (DTN/Progressive Farmer, Oct 14, 2026) [1]. Phosphate is the input growers most want to stretch going into 2027, and the products sold to stretch it are phosphorus-solubilizing biologicals. The best known is the soil fungus Penicillium bilaiae, sold alone as JumpStart and stacked with rhizobia or other microbes as TagTeam and BioniQ. The brands belong to Novonesis, formerly Novozymes, and FMC has been its exclusive Canadian distributor since June 2024 (FMC Corporation, Mar 12, 2024) [15]. The farm question has two parts. What must the product return to pay for itself at this fall's prices? And does it let a grower cut the phosphate rate, which is how it is often discussed in a high-price year? The first part is arithmetic. The second depends on who ran the trials. This piece updates our July 28 analysis of the same product class [19]. That piece leaned on the 461-trial US corn dataset without noting that the product's developer funded it.
1. What a pound of phosphate costs, and what the biological has to save
What's new: DTN's October 14 survey puts anhydrous at $977 a ton, or $0.60 a pound of nitrogen, and urea at $0.73 a pound of N [1]. Crediting the nitrogen in MAP and DAP at the anhydrous price gives the cost of the phosphate alone. That is what a rate cut saves.
Evidence:
| Product | Retail $/ton | lb P2O5/ton | $/lb P2O5, no N credit | $/lb P2O5, N credited at anhydrous | Basis |
|---|---|---|---|---|---|
| MAP 11-52-0 | 979 | 1,040 | 0.941 | 0.814 | Retail, national average |
| DAP 18-46-0 | 934 | 920 | 1.015 | 0.780 | Retail, national average |
| 10-34-0 | 702 | 680 | 1.032 | 0.856 | Retail, national average |
Source: DTN/Progressive Farmer retail survey, first week of October 2026, published Oct 14, 2026 [1]. Per-pound figures are Crop Root Zone calculations: (price − lb N × $0.60) ÷ lb P2O5.
These match the University of Nebraska's late-September figures of about $0.93 for MAP and $1.01 for DAP before the nitrogen credit (Fertilizer Daily, reporting Nebraska Extension, Oct 13, 2026) [18]. We use MAP at $0.814 a pound as the yardstick. MAP is the dominant seed-row phosphate on the Prairies and a common starter in the Corn Belt, and seed-row placement is where these inoculants are used.
The products themselves have no public price. Neither the US manufacturer page nor FMC's 2026 Canadian product guide lists one [3][13]. The only dated list price we found is a 2015 Canadian advertisement. It quoted a 2016 suggested retail price of C$49.50 for JumpStart on a pre-treated bag of canola that seeds 10 acres, about C$4.95 an acre, on pre-treated seed only (Seed World Germination, Nov 2015) [11]. Stacked products now carry two to four organisms. BioniQ, for example, combines two P. bilaiae strains with a Bacillus and a Trichoderma [13]. They are unlikely to cost less than the single-strain product did a decade ago, but we have no quote to prove it. So the rest of this piece prices the product at $5 to $20 an acre as a scenario range, with $10 as the central case. Get a written quote before using any row below.
2. Who ran the trials
What's new: The evidence base is large, but it splits cleanly by who ran it. Company-run and company-funded datasets report consistent gains. Replicated trials run without the manufacturer report gains and losses in roughly equal numbers.
Evidence:
| Study | Who ran / funded it | Crop, region | Design, n | Reported yield effect |
|---|---|---|---|---|
| Leggett et al. 2015 [5] | Funded by Novozymes BioAg; 3 of 6 authors at Novozymes | Corn, 8 US states, 2005–2011 | 92 replicated small plots | +0.17 t/ha (+1.8%), positive in 72% |
| Leggett et al. 2015 [5] | Same | Same | 369 unreplicated farm strips | +0.33 t/ha (+3.5%), positive in 80% |
| Novozymes BioAg poster, 2012 [10] | Company | Wheat, Prairies | 171 on-farm trials | Positive in 77%, mean +5.3% |
| Diaz-Zorita et al. 2016 [12] | Company (Monsanto seed-applied unit) | Corn, soybean, wheat; Argentina 2008–2014 | 97 trials | Corn +501, soybean +108, wheat +141 kg/ha |
| FMC BioniQ update, 2026 [14] | Company | Cereals and canola, Prairies, 2025 | 9 grower trials vs grower practice | Mean +3.9 bu/acre |
| Karamanos et al. 2010 [8] | Not the manufacturer, per IHARF's review | Spring wheat, Prairies, 1989–1995 | 47 field trials | 5 significant increases, 9 significant decreases |
| Mohr et al. 2013 [6] | AAFC, IHARF, WARC and others | Canola, Manitoba and Saskatchewan, 2010–2012 | 9 replicated site-years | Up in 1, down in 1, no change in 7 |
| Holzapfel, IHARF 2019 [7] | Producer-group demonstration | Canola, Indian Head SK, 2018 | 4 reps, Olsen P 7 ppm | +40 kg/ha (+1.3%), not significant (P = 0.128) |
| North Dakota, 1994 [9] | University field study | Spring wheat, 4 ND sites | Replicated | +66 kg/ha average; significant at 1 of 4 sites |
Source: as cited in each row. Karamanos et al. is summarized from the literature review in the 2019 IHARF report [7]; we did not reach the paper itself. "Significant" means as reported by each study's own test.
The Leggett paper, the largest US dataset, is peer-reviewed. Its own acknowledgement says that "Funding support for the field experiments and statistical analysis work was provided by Novozymes BioAg Ltd." [5]. Our July piece called it the largest published US program without saying who paid for it [19], and readers should weigh it accordingly. It remains the best US corn number available. No independent US corn dataset of any size turned up in our search.
The independent Prairie record is thinner but blunter. The two replicated datasets cover 56 site-years. Inoculation significantly raised yield 6 times and lowered it 10 times. In the remaining 40 it made no detectable difference. The Karamanos authors could not link either kind of response to soil test P, organic matter, texture or weather, and concluded they were random events [7]. The Mohr team found phosphate fertilizer raised canola yield in about two-thirds of rainfed site-years. They concluded the inoculant "had limited effects" on early P uptake, yield and seed P [6]. They also recorded lower plant stands in inoculated plots in 8 of 9 site-years, though every stand stayed within recommended levels [6].
6 up, 10 down
Significant yield effects from P. bilaiae in 56 independent, replicated Prairie site-years. In the other 40 it made no detectable difference. (Karamanos et al. 2010, via IHARF 2019; Mohr et al. 2013) [6][7]
The company record leans on old work too. FMC's 2026 guide cites no yield data for JumpStart. Its one chart of phosphate uptake comes from six University of Manitoba wheat trials run in 1989–1990 [13]. FMC's JumpStart page claims faster root growth and early vigour, not a yield percentage, and makes no claim that the product replaces phosphate fertilizer [4].
3. The rate-cut question: does it substitute for phosphate?
What's new: The case that matters most at $979 MAP is not a yield bump on top of a full phosphate rate. It is the claim that a grower can cut the rate and let the fungus release the difference from soil reserves. That is a testable claim, and the trials that tested it point one way.
Evidence: The trials that tested it crossed inoculation with several phosphate rates. The Mohr canola trials ran 0 to 40 kg/ha of side-banded MAP P2O5, with and without the inoculant. They found "No inoculant × P fertilizer interactions": the inoculant's effect on yield was the same at every phosphate rate [6]. The Indian Head demonstration found the same pattern. Seed yield rose with MAP rate whether or not the seed was inoculated. Inoculation changed neither early-season P uptake nor tissue P concentration (P = 0.246 and 0.346) [7]. Even the company-run Argentine program reported no interaction between phosphate fertilizer and seed inoculation in grain yield [12]. If the fungus substituted for fertilizer, its benefit would be largest at low phosphate rates and shrink as the rate rose. No dataset we found shows that shape.
That leaves the rate cut to be judged on soil test alone, and there the land-grant numbers are clear. In Iowa, about 80% of phosphate applications on Very Low testing soils and 65% on Low produce a yield increase. On Optimum soils the figure is 25%, on High 5%, and on Very High under 1% (Mallarino, Iowa State University, 2015) [16]. Nebraska sets its critical Bray-1 level for corn at about 20 ppm after corn and 15 ppm after soybean [18].
| Soil test P class (Iowa) | Chance a P application raises yield | Is a 12 lb P2O5 cut safe? | Does the biological change that? | |
|---|---|---|---|---|
| Very Low | ~80% | No | No evidence it does | ██████████ |
| Low | ~65% | No | No evidence it does | ████████ |
| Optimum | ~25% | Usually, for one year | Not needed for the cut | ███ |
| High | ~5% | Yes | Not needed for the cut | █ |
| Very High | <1% | Yes | Not needed for the cut | ░ |
Source: Response probabilities from Mallarino, Iowa State University Integrated Crop Management, 2015 [16]. The last two columns are Crop Root Zone's read of the interaction results in [6], [7] and [12]. Bar column scales response probability, 80% = ten blocks.
Ground Truth: The rate-cut pitch is circular. On High and Very High soils a grower can cut 12 pounds of P2O5, or the whole application, for a year with a 1-in-20 chance or less of losing yield. That cut is free and needs no biological. On Very Low and Low soils the cut is risky. There the developer's own corn data shows the biggest response [5], but no independent replicated trial shows the fungus replacing the fertilizer [6][7]. So the product is a yield bet on top of the phosphate rate, never a substitute for any of it. Buy it, if at all, as an add-on that has to pay in bushels. The 81-cent pound of phosphate is not a saving it can claim.
4. The break-even in bushels and in pounds
What's new: At October 15 futures, December 2027 corn was $5.11, November 2027 soybeans $12.46 and July 2027 Kansas City wheat $7.34 (FXEmpire, delayed, Oct 15, 2026) [2]. Those prices set the yield the product has to return.
Evidence:
| Product cost, $/acre* | Corn bu (% of 180) | Soybean bu (% of 55) | Wheat bu (% of 50) | lb P2O5 replaced at $0.814 | |
|---|---|---|---|---|---|
| 5 | 0.98 (0.5%) | 0.40 (0.7%) | 0.68 (1.4%) | 6.1 | ██░░░░░░░░ |
| 8 | 1.56 (0.9%) | 0.64 (1.2%) | 1.09 (2.2%) | 9.8 | ████░░░░░░ |
| 10 | 1.96 (1.1%) | 0.80 (1.5%) | 1.36 (2.7%) | 12.3 | █████░░░░░ |
| 12 | 2.35 (1.3%) | 0.96 (1.7%) | 1.63 (3.3%) | 14.7 | ██████░░░░ |
| 16 | 3.13 (1.7%) | 1.28 (2.3%) | 2.18 (4.4%) | 19.6 | ████████░░ |
| 20 | 3.91 (2.2%) | 1.61 (2.9%) | 2.72 (5.4%) | 24.6 | ██████████ |
Source: Futures from FXEmpire delayed quotes, Oct 15, 2026 [2]; phosphate cost from DTN, Oct 14, 2026 [1]. *Product costs are Crop Root Zone scenarios, not quotes; no public 2026 price exists. Yields of 180, 55 and 50 bu/acre are assumptions for the percentage columns only. The bar column scales pounds of P2O5, 24.6 lb = ten blocks. Application cost is excluded on the assumption that the product rides on seed or in an existing pass.
Set the measured responses against that table. The developer-funded replicated corn mean of 0.17 t/ha is 2.7 bushels, worth $13.85 an acre at $5.11. That covers a product up to about $13.85. The unreplicated strip mean, 5.3 bushels, covers about $27 [5]. The independent North Dakota wheat average of 66 kg/ha is about 1 bushel, worth $7.20, and it rests on one responsive site out of four [9]. The independent Indian Head canola gain of 0.71 bushels was not statistically significant [7]. For the 56 Prairie site-years in Section 2 the mean response cannot be calculated from what was published, but a record of 6 gains and 10 losses does not support a positive average.
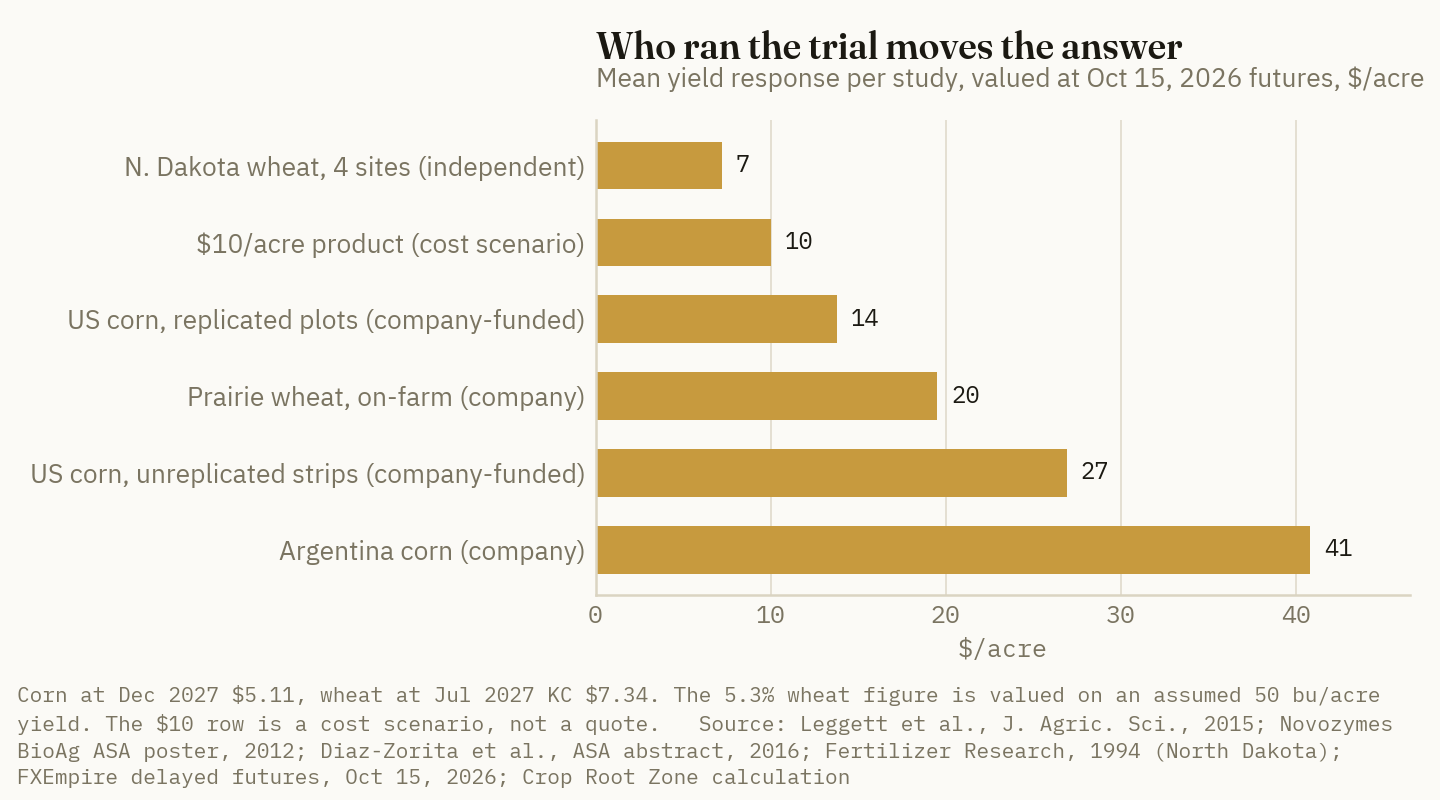
Ground Truth: The break-even is cheap: 1 to 2 bushels of corn at $5 to $10 an acre. That is exactly why the evidence fight matters. A product this cheap only needs to work a little, and the developer's corn data says it does, by 2.7 bushels in replicated plots. Independent Prairie trials say that in a typical field the effect cannot be told apart from zero. Corn-belt buyers are working from developer data alone, because no independent replicated US corn trial of any size turned up in our search. Western Canadian buyers have independent data, and it is negative-to-neutral. A corn grower paying $10 is making a reasonable bet on company evidence. A Prairie wheat or canola grower paying $10 is paying against the best independent evidence available.
5. How to buy it, if you buy it
The product is not useless, and the case against it is narrower than the independent tally suggests. The fungus does release phosphate in the lab, and the mechanism is not in dispute [5][13]. The global biofertilizer literature reports larger average gains: about 8.5% in continental climates and 20% in dry ones across all organism types (Schütz et al., 2018) [17]. That meta-analysis pools many organisms and small academic trials, and it does not isolate P. bilaiae under North American row-crop management. On the evidence here, a buyer should do four things.
Price it per acre in writing. At $5 an acre the product needs half a bushel of soybeans or one bushel of corn. At $20 it needs nearly 4 bushels of corn. The only public list price we found was C$4.95 an acre on pre-treated canola in 2016 [11]. A stacked multi-organism product priced well above that has to show a correspondingly larger independent response, and none we found does.
Keep the phosphate rate where the soil test puts it. No independent replicated trial we found supports cutting phosphate because the seed is inoculated [6][7]. Where a cut is justified, on High and Very High soils [16], make it on the soil test alone and keep the product's cost.
Leave untreated check strips. The Leggett data shows how much the design matters. The replicated mean was about half the strip mean [5]. A farm check needs at least three paired strips per field, not one, because single strips catch soil variation that can be larger than a 2-bushel effect.
Ask which data the yield claim comes from. For any yield figure, ask who ran the trials, whether they were replicated, and whether the comparison was the same phosphate rate with and without the product. Company on-farm trial counts of 163, 171 or 461 measure how widely the product was tested, not how well [5][10][11].
What would change the read is a multi-year, multi-state, replicated corn trial run by a land-grant university, with inoculation crossed against at least three phosphate rates on low-testing ground. That trial does not exist in the public record we searched. Until it does, the honest budget line for a phosphorus-solubilizing biological is the one a grower would write for any unproven add-on: a few dollars an acre at most, measured against check strips, and nothing taken off the phosphate bill.
References
- DTN/Progressive Farmer, "UAN32 Leads Fertilizer Prices Higher Again in First Week of October," Retail Fertilizer Trends, Oct 14, 2026 — https://www.dtnpf.com/agriculture/web/ag/crops/article/2026/10/14/uan32-leads-fertilizer-prices-higher
- FXEmpire, futures contract pages for corn (ZC), soybeans (ZS) and KC HRW wheat (KE), delayed quotes timestamped Oct 15, 2026, 12:44 UTC — https://www.fxempire.com/commodities/zc/contracts ; https://www.fxempire.com/commodities/zs/contracts ; https://www.fxempire.com/commodities/ke/contracts
- Novonesis, JumpStart product page (US), accessed Oct 15, 2026 — https://www.novonesis.com/en/biosolutions/animal-and-plant/plant/jumpstart
- FMC Canada, JumpStart product page, accessed Oct 15, 2026 — https://ag.fmc.com/ca/en/biologicals/jumpstart
- M. Leggett, N. K. Newlands, D. Greenshields, L. West, S. Inman, M. E. Koivunen, "Maize yield response to a phosphorus-solubilizing microbial inoculant in field trials," The Journal of Agricultural Science 153(8), 2015 — https://www.cambridge.org/core/journals/journal-of-agricultural-science/article/maize-yield-response-to-a-phosphorussolubilizing-microbial-inoculant-in-field-trials/7DFD16B27E38D684DAEEE26162592EE5
- R. Mohr, B. Irvine, C. Grant, C. Holzapfel, T. Hogg, S. Mahli, A. Kirk, "Response of Canola to the Application of Phosphorus Fertilizer and Penicillium bilaii (JumpStart)," SaskOilseeds research project summary, Jun 2013 — https://saskoilseeds.com/research-project-articles/mohr-response-of-canola-to-the-application-of-phosphorus-fertilizer-and-penicillium-bilaii-jumpstart
- C. Holzapfel, Indian Head Agricultural Research Foundation, "Seed-Placed Phosphorus Fertilizer Forms and P. bilaii Effects on Canola Emergence, Phosphorus Uptake, and Yield," ADOPT #20170410 final report, Jan 2019 — https://iharf.ca/wp-content/uploads/2024/02/Seed-placed-phosphorus-fertilizer-forms-and-P-bilaii-effect-on-canola.pdf
- R. Karamanos, N. Flore, J. Harapiak, "Re-visiting use of Penicillium bilaii with phosphorus fertilization of hard red spring wheat," Canadian Journal of Plant Science 90:265–277, 2010 (as summarized in [7]; not reached directly)
- Spring wheat response to Penicillium bilaji inoculation and drill-applied phosphorus at four North Dakota sites, Fertilizer Research, 1994 (abstract) — https://link.springer.com/article/10.1007/BF00750908
- Novozymes BioAg, poster on P. bilaiae effects on wheat, pea and lentil, ASA-CSSA-SSSA Annual Meetings, 2012, Paper 74340 (summary as indexed; the poster file could not be opened) — https://a-c-s.confex.com/crops/2012am/webprogram/Paper74340.html
- Seed World, Germination (Canada), November 2015, p. 11, JumpStart advertisement citing the 2016 suggested retail price — https://seedworld.com/cdn/flipbooks/CAN/flipbook_2015_nov_germ/files/html/page11.html
- M. Diaz-Zorita, M. Bermudez, R. M. Balina, "Seed Inoculation with Penicillium bilaiae Improves Grain Production in the Pampas Region in Argentina," ASA-CSSA-SSSA International Annual Meetings, 2016, abstract 371-10 — https://scisoc.confex.com/crops/2016am/webprogram/Paper101803.html
- FMC Canada, Biologicals by FMC 2026 Product Guide, Nov 2025 — https://ag.fmc.com/ca/sites/default/files/2025-11/Biologicals%20by%20FMC%202026%20Product%20Guide.pdf
- FMC Canada, BioniQ Technical Update, Apr 2026 — https://ag.fmc.com/ca/sites/default/files/2026-05/BioniQ%20Technical%20Update%202026%20%281%29.pdf
- FMC Corporation, "FMC Corporation expands biologicals crop protection platform in Canada," news release, Mar 12, 2024 — https://investors.fmc.com/news/news-details/2024/FMC-Corporation-expands-biologicals-crop-protection-platform-in-Canada/default.aspx
- A. P. Mallarino, "Making rational adjustments to phosphorus, potassium, and lime application rates when crop prices are low and producers want to cut inputs," Iowa State University Integrated Crop Management Conference, 2015 — https://www.agronext.iastate.edu/soilfertility/info/Mallarino_PK%20Prices%20Article-ICM%202015-1.pdf
- L. Schütz et al., "Improving Crop Yield and Nutrient Use Efficiency via Biofertilization—A Global Meta-analysis," Frontiers in Plant Science 8:2204, Jan 12, 2018 — https://www.frontiersin.org/journals/plant-science/articles/10.3389/fpls.2017.02204/full
- Fertilizer Daily, "16-year Nebraska study finds more phosphorus does not always increase corn profits," Oct 13, 2026 (reporting Patel, Shapiro and Iqbal, University of Nebraska–Lincoln, Agronomy Journal, and Nebraska Extension price figures) — https://www.fertilizerdaily.com/20261013-16-year-nebraska-study-finds-more-phosphorus-does-not-always-increase-corn-profits/
- Crop Root Zone, TRZ-0046, "Phosphate Won't Fall, So the Biologicals Are Back. Their Best Evidence Says 1.8%," Jul 28, 2026.
Disclosures
Crop Root Zone is an independent publication. Nothing here is investment advice. Market calls, where included, reflect the editors' own read and are not a recommendation to buy or sell any security.
Struvite Matches MAP Only Below About $510 a Ton. The Last Public Price Sheet We Found Had It at 3.2 Times MAP per Pound of Phosphate. The Trials Support It as a Quarter of a Blend or in the Seed Row, Not as the Whole P Program.
At DTN's Sep 28–Oct 2 retail prices, MAP phosphate costs 81 cents a pound and DAP 78 cents once their nitrogen is credited, so a ton of 5-28-0-10Mg struvite is worth $497 to $569 with its magnesium valued at zero. No US retailer or survey we found publishes a struvite price. The last public dealer sheet, from January 2020, priced it 1.72 times MAP a ton. Replicated trials in Iowa, Arkansas, Ontario and Saskatchewan found struvite about equal to soluble phosphate in yield, mostly on acid or incorporated ground or as part of a blend. A cold-soil Manitoba test and a wheat pot study in alkaline soil found the granule releases little early phosphorus. At a $1,000 quote, a 25% struvite share of a 60-pound program adds $13 an acre, or 2.5 bushels of December 2027 corn.
Struvite, the magnesium ammonium phosphate that wastewater plants crystallize out of their sludge-dewatering liquor, is sold to North American row-crop growers as a phosphorus source that stays available longer than MAP or DAP. The farm-level question is narrow: what does a pound of its phosphate cost against the mined product, and what does it return? The first half has a clean answer. DTN's retail survey for September 28 to October 2 put MAP at $974 a ton, DAP at $934 and anhydrous at $979 (DTN/Progressive Farmer, Oct 7, 2026) [1]. With the nitrogen credited, a pound of phosphate costs 81 cents in MAP and 78 cents in DAP, so a ton of 5-28-0-10Mg struvite matches them at about $497 to $569. The second half has no clean answer, because no retailer, state report or survey we could find publishes a struvite price. The only dated public quote we found is a January 2020 farm-supply cooperative's price sheet that priced it at $775 a ton when MAP was $450 [2]. This piece prices struvite under labelled scenarios. It then reads what the replicated trials show about yield and early phosphorus supply and sets out where the product earns its premium. It does not revisit biosolids, which carry a separate PFAS question [23], or TSP, which we priced against DAP on October 2 [22].
1. What struvite has to cost to match MAP and DAP
What's new: At early-October retail prices a ton of struvite is worth $497 to $569 in phosphate and nitrogen. That figure supersedes the $560–$700 band in our July 21 piece [20]. That band rested on $912 DAP and an $80-a-ton magnesium credit. Our October 13 magnesium analysis found that most row-crop acres do not need magnesium and that, where they do, dolomitic lime supplies it for little or nothing [24]. We now value the magnesium at zero and show it separately.
Evidence: A ton of struvite at the CG Pearl label analysis of 5-28-0 with 10% magnesium carries 100 lb of N, 560 lb of P2O5 and 200 lb of Mg. The label lists all three as "slowly available" and the material as magnesium ammonium phosphate (Ostara, label rev. Jun 2026) [15]. We price the phosphate in each mined product three ways. The first credits no nitrogen. The second credits the nitrogen at the survey's anhydrous price, $0.597 a pound of N. The third uses urea at $0.742 [1]. Struvite's own nitrogen is credited on the same basis.
| Product | Retail $/ton | lb P2O5/ton | lb N/ton | $/lb P2O5, no N credit | N at anhydrous | N at urea | Basis |
|---|---|---|---|---|---|---|---|
| DAP 18-46-0 | 934 | 920 | 360 | 1.015 | 0.782 | 0.725 | Retail, national average |
| MAP 11-52-0 | 974 | 1,040 | 220 | 0.937 | 0.810 | 0.779 | Retail, national average |
| 10-34-0 | 702 | 680 | 200 | 1.032 | 0.857 | 0.814 | Retail, national average |
| Struvite parity price, vs MAP | 511–524 | 560 | 100 | 0.937 | 0.810 | 0.779 | Price at which struvite P costs the same as MAP P |
| Struvite parity price, vs DAP | 480–569 | 560 | 100 | 1.015 | 0.782 | 0.725 | Same, against DAP |
Source: DTN/Progressive Farmer, retail survey week of Sep 28–Oct 2, published Oct 7, 2026 [1]; struvite analysis from the CG Pearl label [15]. Per-pound figures and parity prices are Crop Root Zone calculations. Parity = 560 lb × the mined product's $/lb P2O5 on each basis, plus struvite's 100 lb of N on the same basis. Magnesium is valued at zero.
Taking the anhydrous credit as the central case, struvite matches MAP at $513 a ton and DAP at $497. With no nitrogen credit anywhere, the range tops out at $569 against DAP. The 10-34-0 line is updated from our September 25 starter piece, which had liquid at $1.056 a pound before credit [21]. A $15 drop to $702 has taken it to $1.032.
Magnesium, if it is needed. At the 12 to 71 cents a pound our October 13 piece found for magnesium bought as dolomitic lime [24], the 200 lb in a ton of struvite would add $24 to $142. That moves parity to roughly $535 to $655 against MAP. Only a grower whose soil test calls for magnesium should count it. On a field that needs lime anyway, the dolomitic lime supplies the magnesium at no extra cost [24].
Ground Truth: The parity price fell about $50 to $130 since July, though MAP rose $20 a ton over the same span ($954 in July [20], $974 now). Dropping the $80 magnesium credit explains all of the fall in the central case; dearer phosphate put back about $36. That makes the July band the wrong yardstick for a grower holding a quote this fall. Struvite's phosphate is worth what MAP's is, about $510 a ton of product, plus magnesium only where a soil test asks for it. Any price above that line pays for something other than the nutrients, such as seed-row safety, slower release, lower runoff risk or organic eligibility. Section 4 tests whether any of those are worth the gap.
2. What struvite actually costs: the price nobody posts
What's new: We found no public 2026 price for any struvite product in the United States. DTN's survey does not carry it [1]. Nor do the USDA state cost reports this publication reads weekly. A Kansas cooperative that posts its prices online listed MAP at $980 to $990 a ton on October 6 and no struvite line (Mulvane Cooperative Union, Oct 6, 2026) [27]. The maker sells through retailers and publishes no price. Its June 2026 release for the reformulated CG P2X says only that the product delivers more nutrient "at an equal cost" per acre (Ostara, Jun 9, 2026) [17].
Evidence: Two public data points exist, both six years old.
| Source | Date | Struvite | MAP | Struvite ÷ MAP, per ton | Struvite ÷ MAP, per lb P2O5 |
|---|---|---|---|---|---|
| Farm-supply cooperative price sheet, bulk | Jan 27, 2020 | $775/ton (5-28-0-10Mg) | $450/ton | 1.72 | 3.20 |
| University of Arkansas partial budget | 2019–2020 prices | "roughly double" other P sources | — | about 2 | not stated |
Source: West Central Ag Services, fertilizer price sheet, Jan 27, 2020 [2]; Omidire et al., Agronomy Journal, 2022 [3]. Per-pound ratio is a Crop Root Zone calculation, with no nitrogen credit: $775 ÷ 560 lb = $1.384 against $450 ÷ 1,040 lb = $0.433. With nitrogen credited at that sheet's urea price the ratio is 3.8.
3.2×
What a pound of struvite phosphate cost against a pound of MAP phosphate on the last public US dealer price sheet we could find, before any nitrogen credit. (West Central Ag Services, Jan 27, 2020; Crop Root Zone calculation)
Applying the 2020 per-ton ratio to today's MAP gives a scenario price of about $1,677 a ton. It is a scenario, not a quote. The ratio could have moved either way since 2020. Mined phosphate has more than doubled since that sheet, and struvite production is fixed by the wastewater plants that make it. We show it to bound the range, alongside three round-number scenarios.
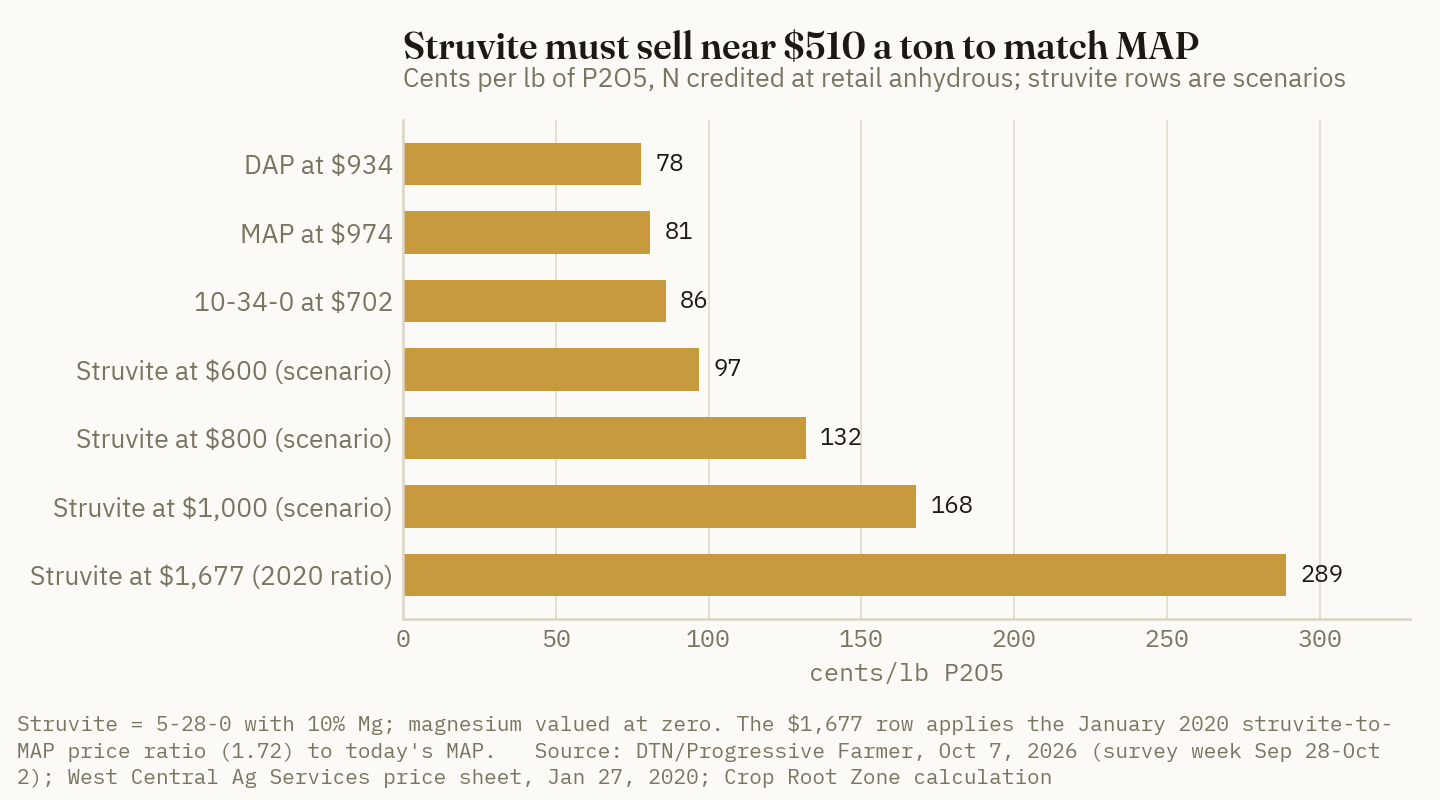
Three products, not one. The brand has also changed shape. The maker now lists three granules. CG Pearl is straight struvite, 5-28-0 with 10% Mg [15]. Crystal Green Synchro is 8-40-0 with 5% Mg "derived from magnesium ammonium phosphate and monoammonium phosphate." Half its phosphate, 20 of 40 points, is labelled slowly available, so it is a factory blend with half the P from struvite (Ostara, label rev. Jun 2026) [16]. CG P2X, the flagship, was relaunched in June at 9-42-0 with 9% Mg [17]. Its release does not say what it is made of. Its Western Canada launch described "new mineralogy formed with" magnesium (World Fertilizer, Jun 13, 2025) [18]. Pure struvite hexahydrate cannot carry more than about 29% P2O5 by its chemical formula, so 9-42-0 is not the same material as 5-28-0. We could not open a P2X label. The trials in Section 3 tested 5-28-0-type struvite. They do not describe P2X, and a grower quoted P2X should ask for the label's split between water-soluble and slowly available phosphate.
3. What the replicated trials show
What's new: Independent field work now spans corn, soybeans, wheat and canola in Iowa, Arkansas, Illinois, Ontario and Saskatchewan. It mostly finds struvite equal to soluble phosphate in yield. The conditions behind that result matter more than the headline. We found no replicated struvite field trial from the University of Minnesota. The Minnesota phosphorus projects we found test rate and timing of conventional sources. We did not substitute anything for that gap.
Evidence:
| Trial | Crop and site | Soil | Rate and placement | Result |
|---|---|---|---|---|
| Iowa State, Northeast Research Farm, 2009–2012 [5][6] | Corn, soybean, corn, soybean | Floyd, pH 5.7, Bray-1 P 11 ppm (low) | 0–250 lb P2O5 once, broadcast and incorporated; struvite vs TSP | No source difference in yield in years 1, 2 and 4; a small struvite edge at the top rate in year 3 the authors attribute to experimental error. Corn peaked at 221 bu at 98 lb P2O5; soybean at 72 bu at 132 lb. Struvite matched TSP in soil-test P build. |
| Arkansas, Marianna, 2019–2020 [3] | Corn | Silt loam, pH 7.16, Mehlich-3 P 34 ppm (~66% of optimum) | 29.4 kg P/ha (about 60 lb P2O5/ac), six sources | Commercial struvite 10.3 Mg/ha (164 bu) vs MAP 10.7 (170 bu), DAP 10.1 (161 bu), statistically similar. Lab electrochemical struvite 12.9 Mg/ha (206 bu), on smaller sub-plots. |
| Arkansas, Marianna, 2018–2019 [4] | Double-crop wheat and soybean | Silt loam, pH 6.5–6.9, Mehlich-3 P 25 ppm | 44 kg P/ha (about 90 lb P2O5/ac) per crop, struvite vs TSP vs none | Soybean yield unaffected by any P treatment, including none. Wheat yield estimated from hand samples because the plots could not be combined. |
| Illinois, two sites [9] | Soybean | Central Illinois prairie Mollisol; southern Illinois | Struvite vs MAP vs none; rates not reported in release | No yield difference between struvite and MAP. Struvite beat the control at the southern site and MAP did not. P and N leaching lower under struvite. |
| Ontario, two years [8] | Corn | Not reported in abstract | Struvite, MAP, 25:75 struvite:MAP blend by P, none | Struvite 11.4 Mg/ha (182 bu), blend 11.5 (183 bu), MAP 10.7 (170 bu), control 10.1 (161 bu); struvite and blend similar to MAP. MAP lost more P to runoff and leaching. |
| Saskatchewan, four sites, 2020 [7] | Canola, seed-placed | pH 6.4–7.8, Olsen-P 7–12 ppm | 25, 45, 65 kg P2O5/ha in the seed row; MAP, struvite, 50:50 product blend | No form difference in yield at three sites. At Yorkton the blend (3,203 kg/ha) out-yielded struvite alone (3,063). Struvite reduced stands least. |
| Manitoba, 2017–2019 [11] | Wheat, flax, alfalfa-grass | Not reported in release | Struvite rates applied once in 2017 | Wheat yield rose, flax did not. Rates matching recommendations were "not adequate at this site". Forage benefit grew in years two and three. |
Source: as numbered; bushel conversions are Crop Root Zone arithmetic (corn 1 Mg/ha = 15.93 bu/ac). The Ontario and Illinois rows rest on an abstract [8] and a university news release [9]; we did not open either full paper. The Manitoba row rests on a society news release [11].
Three readings from the table.
First, parity is easiest to show where phosphorus barely matters. In the Arkansas wheat-soybean study, soybean yield did not respond to phosphorus at all, though soil-test P was in the low category; the authors attribute this to the soil holding P from both sources [4]. "Struvite equals TSP" there means neither did anything. The Arkansas corn study did get a response, and commercial struvite tied MAP within the noise. The partial budget priced that tie. Struvite at roughly double the price of other sources returned $70 an acre less than TSP in 2019 and $140 less in 2020 ($172.74 and $346.85 a hectare). That ranked it sixth and seventh of seven treatments, below the unfertilized control in both years [3]. The 12.9 Mg/ha electrochemical result came from a lab material on 1.5-by-1.5-metre sub-plots, because supply was limited [3]. It is a research finding, not a product. The university's own summary of its three-crop program found struvite worked somewhat better on corn and soybeans than on rice [14].
Second, the strongest equal-yield result is broadcast and mixed into acid soil. The Iowa State struvite went on at pH 5.7, incorporated with two field-cultivator passes, at rates up to 250 lb P2O5 [5]. That is the setting where a low-solubility granule has the most soil contact and the most acid to dissolve it. The struvite in that study was 27% P2O5 with 1.4% water-soluble P [5]. The authors had expected it to lose at low rates and it did not [5].
Third, the granule itself is slow, and cold or alkaline soil makes it slower. A Manitoba incubation placed single granules of struvite and MAP in a pH 8.1 clay and a pH 7.0 sandy clay loam. After 20 days, only 1% to 5% of the struvite phosphorus showed up as Olsen-P, against about 40% for MAP, and almost none moved beyond 8 millimetres from the granule. Temperature (4°C against 22°C) changed little (Thiessen Martens et al., Canadian Journal of Soil Science, 2023) [10]. A wheat pot study found granular struvite dissolved at about 0.03 mg a day in alkaline soil against 0.43 mg in acid soil. Wheat uptake from granular struvite in the alkaline soil could not be told apart from the no-P control. Ground struvite mixed through the soil performed like MAP (Degryse et al., Plant and Soil, 2017) [13]. A UK pot study found early wheat P uptake 39% lower with struvite than DAP. Mixes with 20% or less of the P as struvite matched DAP alone (Talboys et al., Plant and Soil, 2016) [12].
Ground Truth: The trials and the marketing point at different uses. The equal-yield results come from broadcast, incorporated or blended phosphate, or from fields where P did not move yield. The product is sold mainly as a seed-safe, season-long starter. That is a cold, banded granule, often in high-pH ground, the setting where the lab and pot work says a pure struvite granule releases the least early phosphorus. The Saskatchewan canola data show both sides. Seed-row struvite cost the least stand of any form. Where it lagged on yield, at Yorkton, the fix was blending it with MAP [7]. Struvite alone in the seed row is a stand-protection choice. The blend is the yield choice.
4. Blend share and placement: what a premium costs per acre
What's new: The published blend guidance has moved toward a larger struvite share. The maker's 2019 guidance, as cited by the Saskatchewan team, was struvite at 25% of the phosphate in a MAP blend [7]. The Ontario corn trial used that 25:75 split [8]. The Saskatchewan 50:50 product blend worked out to 35:65 by phosphate [7]. The maker's current Synchro product is 50:50 by phosphate [16]. The UK pot work found no early-uptake penalty at 20% or less [12].
Evidence: The premium for a blend depends on the struvite share, its price and the program rate. We price a 60 lb P2O5 program, about the Arkansas corn rate [3], with MAP supplying the rest. Nitrogen is credited at anhydrous on both sides and magnesium at zero.
| Struvite price scenario | $/lb P2O5, net of N | Premium at 25% share, $/acre | At 50% share | At 100% (straight) | Bushels of Dec 2027 corn at 25% |
|---|---|---|---|---|---|
| $513 (parity) | 0.810 | 0.00 | 0.00 | 0.00 | 0.0 |
| $600 | 0.965 | 2.32 | 4.64 | 9.27 | 0.5 |
| $800 | 1.322 | 7.68 | 15.35 | 30.70 | 1.5 |
| $1,000 | 1.679 | 13.03 | 26.07 | 52.13 | 2.5 |
| $1,200 | 2.036 | 18.39 | 36.78 | 73.56 | 3.6 |
| $1,677 (2020 ratio) | 2.888 | 31.17 | 62.33 | 124.67 | 6.1 |
Basis: $/acre over an all-MAP program at $974 MAP [1]; 60 lb P2O5/acre. Corn at $5.12, December 2027 futures quoted Oct 12, 2026, as reported in TRZ-0271 [25]. Every struvite price is a Crop Root Zone scenario, not a quote. Source: Crop Root Zone calculation.
The same 25% share, as a bar column:
| Struvite at | Added cost, 25% of a 60-lb program | |
|---|---|---|
| $600 | $2.32 | █░░░░░░░░░ |
| $800 | $7.68 | ██░░░░░░░░ |
| $1,000 | $13.03 | ████░░░░░░ |
| $1,200 | $18.39 | ██████░░░░ |
| $1,677 | $31.17 | ██████████ |
Basis: $/acre over all-MAP. Source: Crop Root Zone calculation from the table above. Bars scale to the $1,677 row = 10 blocks.
Starter and seed row. A seed-row or 2x2 starter carries far less phosphate. At 20 lb P2O5 an acre of straight struvite, the premium over MAP is about $3.10 at $600, $10 at $800, $17 at $1,000 and $42 at the 2020-ratio scenario (our arithmetic on the same basis). Our September 25 piece found the bigger question with any starter is whether it pays at all. On P-sufficient Indiana ground, a pop-up starter paid in one of 21 trials [21]. A struvite starter adds its premium on top of that question.
What the premium buys, and what we could not price:
- Stand in the seed row. In Saskatchewan, MAP cut canola stands at Scott and Yorkton. Spring density averaged 48.3 and 54.6 plants per square metre against 59.9 and 67.0 with struvite, the controls at 57.1 and 69.3. Final yields were nevertheless statistically equal at Scott [7]. The safety is real. Whether it is worth money depends on how hard a grower pushes seed-row rates.
- Less phosphorus in the drainage water. Illinois measured lower P and N leaching under struvite, comparable to unfertilized soil [9]. Ontario measured greater runoff and leaching losses from MAP [8]. Neither study puts a dollar value on that, and we found no cost-share program in the sources we opened that pays for the switch.
- Residual phosphate. In a UK 90-day pot study, 66% to 82% of struvite granules were still undissolved at harvest [12]. The Iowa State struvite built soil-test P as fast as TSP [5]. Manitoba forage kept responding into year three [11]. The phosphate is not lost, but a buyer pays for it this year and draws on it later.
- PFAS. One 2023 study of wastewater-derived fertilizers in Germany and Switzerland reported total extractable organic fluorine up to 121 µg/kg in thermally treated sludge and struvite, against 154 to 7,209 in sewage sludges. That is a sum measure, not comparable line for line with state PFOS and PFOA limits [19]. We read only a search summary of the abstract. It suggests struvite is a far cleaner stream than the biosolids we covered in September [23], but it is not a product test.
5. Where struvite pencils, and where it does not
What's new: At today's MAP price, straight struvite pays as broadcast maintenance phosphate only if it is quoted near $513 a ton. Of the two public price points we found, neither came close: the 2020 sheet was at 1.72 times MAP, and the Arkansas economists saw roughly double [2][3]. Three cases justify paying above parity.
Evidence and the read, case by case:
1. As a minority share of a blend, on ground that responds to phosphate. This case has the most trial support behind it: the Ontario 25:75 split [8], the Saskatchewan blend [7] and the pot-study ceiling of about 20% [12]. At a $1,000 quote, a 25% share costs $13 an acre, or 2.5 bushels of $5.12 corn. No study we read found a 25% blend out-yielding MAP by a statistically significant margin [7][8]. The premium has to be justified by something other than yield: loss reduction, a nutrient-management plan, or a buyer's sustainability contract.
2. In the seed row, where MAP rate is limited by injury. This is canola and other sensitive crops at high seed-placed rates, the case the Saskatchewan data support [7]. The value is the extra phosphate a grower can put with the seed without losing plants. A 50:50 product blend, or a factory blend like Synchro [16], gets most of that safety without the early-supply penalty of straight struvite.
3. On organic acres. CG Pearl's label carries "For Organic Use" [15]. In an organic rotation the comparison is not MAP, which is prohibited. It is manure, compost and rock phosphate, so the parity math in Section 1 does not apply. Our October 12 organic nitrogen piece reported new-crop organic feed corn at $12.93 a bushel delivered [26]. At that price a full 60-pound program of straight struvite at the $1,677 scenario costs about $180 an acre, or 14 bushels, and at $1,000 about $107, or 8 bushels. This is the one market where a straight struvite program may pay at a premium to MAP. We have not priced it against organic-approved alternatives here, and we found no public organic struvite price.
Where it does not pencil: as a straight swap for fall-broadcast MAP or DAP on calcareous or high-pH soil. That is the combination the Manitoba incubation [10] and the alkaline-soil pot work [13] flag as slowest to release. It is also where the Arkansas partial budget, on a pH 7.16 silt loam, left commercial struvite last [3]. It also does not pencil for a farm buying it as a hedge against phosphate prices. Illinois's lead researcher told reporters in 2023 that struvite "isn't scalable right now" for Corn Belt phosphorus needs [9]. Our July piece set out the tonnage arithmetic [20].
Ground Truth: A struvite quote should be read in three numbers, not one. Divide the price by 560 to get dollars per pound of P2O5, and compare that with MAP's 81 cents. Ask what share of the blend's phosphate is struvite. Multiply the gap by that share and the acre's P rate. Most growers will find the honest premium for a 25% blend is $5 to $20 an acre at plausible quotes, and that the trials show yield parity at best, not a yield gain to pay for it. The purchase makes sense where the premium buys something specific: protecting a canola stand at a high seed-row rate, meeting a phosphorus-loss limit, or qualifying for an organic premium. A grower who cannot name which of those it is buying is paying recovered-phosphate prices for MAP results. The price itself stays private until a retailer posts it. That alone tells a buyer to get the quote in writing, per pound of P2O5, before booking spring.
References
- Russ Quinn, "UAN32 Leads Fertilizer Prices Higher," DTN Retail Fertilizer Trends, DTN/Progressive Farmer, Oct 7, 2026 (survey week Sep 28–Oct 2, 2026: DAP $934, MAP $974, 10-34-0 $702, anhydrous $979, urea $683) — https://www.dtnpf.com/agriculture/web/ag/crops/article/2026/10/07/uan32-leads-fertilizer-prices-higher
- West Central Ag Services, "Fertilizer Pricing: 01/27/2020" (Crystal Green 5-28-0-10Mg $775/ton; MAP 11-52-0 $450/ton), dated Jan 27, 2020, accessed Oct 14, 2026 — https://storcoopmediafilesprd.blob.core.windows.net/atlasportals/all-media/wcas/west-central-ag-services/pdfs/fertilizer-price-guide-01-27-20.pdf
- Niyi S. Omidire, Kristofor R. Brye, Leah English, Jennie Popp, Laszlo Kekedy-Nagy, Lauren Greenlee, Trenton L. Roberts and Edward E. Gbur, "Wastewater-recovered struvite evaluation as a fertilizer-phosphorus source for corn in eastern Arkansas," Agronomy Journal 114(5): 2994–3012, 2022, doi:10.1002/agj2.21162 (accepted manuscript read via NSF Public Access Repository, including Table 9 partial budget) — https://par.nsf.gov/servlets/purl/10351408
- Niyi S. Omidire and Kristofor R. Brye, "Wastewater-recycled struvite as a phosphorus source in a wheat–soybean double-crop production system in eastern Arkansas," Agrosystems, Geosciences & Environment 5: e20271, 2022, doi:10.1002/agg2.20271 (pages 1–9 read) — https://par.nsf.gov/servlets/purl/10351409
- Louis B. Thompson, Antonio P. Mallarino and Kenneth T. Pecinovsky, "Crop Response to Phosphorus in Fertilizer and Struvite Recovered from Corn Fiber Processing for Bioenergy," Iowa State University Northeast Research and Demonstration Farm, ISRF12-13, 2013 — http://lib.dr.iastate.edu/farms_reports/1948
- Louis B. Thompson and Antonio P. Mallarino, "Crop Availability of Phosphorus Recovered As Struvite From Corn Processing for Bioenergy in Corn-Soybean Rotations," ASA-CSSA-SSSA Annual Meetings, poster 2209, Oct 21–24, 2012 (abstract) — https://scisoc.confex.com/crops/2012am/webprogram/Paper75016.html
- Chris Holzapfel et al., Indian Head Agricultural Research Foundation, "Canola Seed Safety and Yield Response to Novel Phosphorus Sources in Saskatchewan Soils," Saskatchewan ADOPT project #20190469 final report, February 2021 — https://iharf.ca/wp-content/uploads/2024/02/Canola-seed-safety-and-yield-response-to-novel-P-sources-in-Saskatchewan-soils.pdf
- Kokulan et al., "Struvite application to field corn decreases the risk of environmental phosphorus loss while maintaining crop yield," Agriculture, Ecosystems & Environment, 2024, doi:10.1016/j.agee.2024.108936 (abstract only, read through a search summary) — https://doi.org/10.1016/j.agee.2024.108936
- Lauren Quinn, University of Illinois College of ACES, "Recycled phosphorus fertilizer reduces nutrient leaching, maintains yield," Newswise, Nov 27, 2023, on Leon, Nakayama and Margenot, Journal of Environmental Quality, doi:10.1002/jeq2.20522 (news release; full paper not opened) — https://www.newswise.com/articles/recycled-phosphorus-fertilizer-reduces-nutrient-leaching-maintains-yield
- J.R. Thiessen Martens, O.D. Srinathan and I. Amarakoon, "Fertilizing effect of wastewater-derived granular struvite on contrasting Manitoba soils," Canadian Journal of Soil Science 103(1): 259–263, 2023 — https://bioone.org/journals/canadian-journal-of-soil-science/volume-103/issue-1/cjss-2022-0013/Fertilizing-effect-of-wastewater-derived-granular-struvite-on-contrasting-Manitoba/10.1139/cjss-2022-0013.full
- American Society of Agronomy, "Study shows struvite good phosphorus source for crops," Newswise, Feb 16, 2022, on Thiessen Martens et al., Agronomy Journal, doi:10.1002/agj2.20943 (news release; full paper not opened) — https://www.newswise.com/articles/study-shows-struvite-good-phosphorus-source-for-crops
- Peter J. Talboys, James Heppell, Tiina Roose, John R. Healey, Davey L. Jones and Paul J.A. Withers, "Struvite: a slow-release fertiliser for sustainable phosphorus management?," Plant and Soil 401: 109–123, 2016 — https://pmc.ncbi.nlm.nih.gov/articles/PMC4923718/
- Fien Degryse et al., Plant and Soil, 2017, doi:10.1007/s11104-016-2990-2 (granular and ground struvite against MAP, P diffusion and wheat uptake in acid and alkaline soil; abstract only, read through a search summary; full title not confirmed) — https://doi.org/10.1007/s11104-016-2990-2
- John Lovett, University of Arkansas System Division of Agriculture, "Arkansas Field Studies Show Strengths of Alternative Fertilizer for Corn, Rice and Soybeans," Mar 17, 2023 — https://aaes.uada.edu/news/struvite-study-brye/
- Ostara Inc., CG Pearl 5-28-0 with 10% Mg product label, revised June 2026 (L11V1) — https://ostara.com/wp-content/uploads/2026/06/CG-Pearl-label_US_English_L11V1.pdf
- Ostara Inc., Crystal Green Synchro 8-40-0 with 5% Mg product label, revised June 2026 (L8V1) — https://ostara.com/wp-content/uploads/2026/06/Synchro-label_US_English_L8V1.pdf
- Ostara Inc., "Ostara Advances CG P2X with New, Higher-Analysis Formula Delivering More Than 2X the Plant-Available Nutrients," news release, Jun 9, 2026 — https://www.ostara.com/news/ostara-advances-cg-p2x-with-new-higher-analysis-formula
- World Fertilizer, "Ostara Inc. launches CG P2X in Western Canada," Jun 13, 2025 — https://www.worldfertilizer.com/product-news/13062025/ostara-inc-launches-cg-p2x-in-western-canada/
- "Levels of PFAS in various wastewater-derived fertilizers," Environmental Science: Advances, Royal Society of Chemistry, 2023 (abstract only, read through a search summary) — https://pubs.rsc.org/en/Content/ArticleLanding/2023/VA/D3VA00178D
- Crop Root Zone, TRZ-0026, "Struvite's Agronomy Question Is Settled. Its Tonnage Question Isn't.," Jul 21, 2026 (its $560–$700 replacement band is superseded by Section 1 of this piece).
- Crop Root Zone, TRZ-0230, "Liquid 10-34-0 Costs $1.06 a Pound of Phosphate and MAP Costs $0.93. At a Starter Rate the Gap Is About $2.50 an Acre. Whether the Starter Pays at All Is the Bigger Number.," Sep 25, 2026.
- Crop Root Zone, TRZ-0250, "Gulf TSP Sits $89 a Tonne Under DAP. That Pays 22 Cents a Pound for Nitrogen That Costs 60 at Retail. TSP Is the Cheaper Fall Phosphate Only Below $858 a Ton.," Oct 2, 2026.
- Crop Root Zone, TRZ-0205, "A Biosolids Application Now Replaces About $190 an Acre of Fertilizer. On Average Cropland, That Pays Only If the Chance of a PFAS Write-Off Stays Below About 3%.," Sep 17, 2026.
- Crop Root Zone, TRZ-0277, "A Pound of Magnesium Costs Nothing in Dolomitic Lime That Was Going On Anyway, 12 to 71 Cents When the Lime Is Bought for It, and $5 to $8 in a Bag. Langbeinite's Magnesium Is Free Below $454 a Ton.," Oct 13, 2026.
- Crop Root Zone, TRZ-0271, October WASDE corn and soybean balance-sheet feature, Oct 12, 2026 (December 2027 corn $5.12, FXEmpire delayed quote of Oct 12, 2026; the quote page was not reopened for this piece).
- Crop Root Zone, TRZ-0273, organic nitrogen sources cost-per-pound feature, Oct 12, 2026 (new-crop organic feed corn delivered to feed mills at $12.93 a bushel, spot).
- Mulvane Cooperative Union, fertilizer prices per ton, dated Oct 6, 2026 (11-52-0 $980 charge, $990 pre-pay; no struvite product listed), accessed Oct 14, 2026 — https://www.mulvanecoop.com/fertilizer
Disclosures
Crop Root Zone is an independent publication. Nothing here is investment advice. Market calls, where included, reflect the editors' own read and are not a recommendation to buy or sell any security.
Discussion
This issue finds that the choice between ammonium sulfate and ATS is worth under $2 an acre at 20 lb of sulfur. The costly mistakes are elsewhere: buying ammonium sulfate's nitrogen at $1.32 a pound instead of urea's $0.69, or paying for it on soybeans that do not need it. So: what sulfur source and rate are you booking for 2027 corn, what is the per-ton quote and on what basis, and are you putting any sulfur on the soybean year?
Corrections are as welcome as answers. If you check our arithmetic against a primary source and find we have it wrong, tell us. The sharpest replies get answered in next week's Letters & Responses.