Issue 13 · 2026-10-12
Nearly every feature in this issue measures the distance between two prices for the same thing. India's lowest urea offers came in at $352.10 and $356.25 a tonne, nearly 10% under August. The Gulf barge fell to $424.75 and retail urea rose to $683. Gulf sulfur producers cut October prices $45 to $70, yet a $50 cut in the unsettled Tampa contract is worth $18 on a ton of DAP and reaches spring 2027 product. Henry Hub's winter strip puts $110 of gas in a $494 ton of Tampa ammonia.
The same distance shows up on the farm. A pound of nitrogen costs $1.90 in truckload feather meal and $5.88 in bagged feather meal. A hired strip-till pass costs about $32 an acre, and a new rig asked at $249,000 beats it only past about 1,300 acres. A 5,000-gallon UAN tank needs a fall-to-spring gap above $83 a ton, and got one in three of the last seven seasons.
Why now: on Friday USDA put 282 million more bushels in the corn carryout, and on farmdoc's 2027 budget corn needs $5.20 cash to match $12.00 soybeans. With less corn revenue to cover a wide spread, we have priced each gap so a reader can see which ones a truckload quote, a hired pass or a later purchase can close.
— Crop Root Zone, Editorial Desk.
Letters & Responses
No reader correspondence reached us this week. Email is the only way to write to this publication, and nothing about it arrived in the eight days since RZ-012 went up: no questions, no corrections, no pushback. We would rather say so than invent a letter.
Five questions remain open.
RZ-012's closing question is still open. We asked what you are being quoted for spring urea, UAN or anhydrous, whether it is a full prepay, a deposit or a lock with no money down, what that money costs you, and whether you have locked any of it. We also asked whether your retailer would hold the quote past India's tender. The tender has now happened. The lowest offers were $352.10 a tonne on the east coast and $356.25 on the west, the October Gulf contract fell to $424.75 a short ton, and retail urea rose to $683, a $258 spread. This issue's financing feature prices the other half of the question: at 7.12%, each month the operating line stays open past November costs a corn acre $6.28.
RZ-011's check-strip question is still open. We asked which input on your 2027 booking sheet you are buying without your own check strip, what it costs per acre and on what kind of ground. This issue adds three candidates. Twenty-five years of Iowa trials found no banded phosphorus and potash rate that held yield below the broadcast rate. Alabama found a molybdenum response on one soil in eight. Published wood ash analyses range from 22% to 92% calcium carbonate equivalent. Strip-trial results on any of them are welcome, with the yield difference and the number of replications.
RZ-010's question on drying is also unanswered. We asked at what moisture you are starting corn, what your propane is contracted or delivered at per gallon, and whether moisture or stalk quality decides which fields go to the dryer first. This issue's balance-sheet feature adds what the board pays to hold the dried bushel: March corn was quoted 14¼ cents over December on October 12, against the 18 to 23 cents a bushel our October 1 table put on storing it on the farm to March.
RZ-009's diesel question has a new tie. We asked whether you are running your fall tillage pass, cutting it back or dropping it, and what you pay per gallon for delivered dyed diesel. At $5.63 farm diesel, this issue prices a hired strip-till pass with banded dry fertilizer at $32.12 an acre in Iowa, $20.50 less than hiring a chisel pass, a field cultivator pass and a spreader. The sprayer feature finds the same fuel moves a hired spray pass by 22 cents.
The standing question on nitrogen hedging remains open. A reader wrote to RZ-004 that a grower has no practical way to hedge a nitrogen bill the way grain can be hedged. Two features bear on it. A 5,000-gallon UAN tank is the physical version of that hedge: it costs $67 a ton a year to own, and the fall-to-spring price gap has to top $83 to pay for it, which it did in three of the last seven seasons. The natural gas feature removes one comfort a buyer might lean on: Gulf prices could fall 61% to 65% before US plants lose cash, so no North American cost floor sits under winter fill. The correspondent asked to remain anonymous and remains so.
Corrections, disagreements and quotes from your own operation are all welcome by email. We answer the sharpest ones here the following week.
In This Issue
This week's features, by department.
- Twelve Days Into the Quarter, Tampa Sulfur Is Still Unsettled at $705. Gulf Producers Cut October Prices $45 to $70, and a $50 Cut Is Worth $18 on a Ton of DAP.No fourth-quarter Tampa price is public as of October 12. The $705 contract already sits $128 to $199 a long ton under Middle East fob posts, yet the trade expects it to fall. A $50 cut takes $18 off the sulfur in a short ton of DAP and $11 off ammonium sulfate, reaches product in spring 2027, and changes nothing in this fall's retail price.
- Henry Hub's Winter Strip Is $3.37. That Puts $110 of Gas in a $494 Ton of Tampa Ammonia and $80 in a $425 Ton of Gulf Urea. Europe's Gas Costs $25.85.At the November-to-March futures strip a US plant's cash cost is about $172 a short ton for ammonia and $166 for urea. Gulf prices could fall 61% to 65% before those plants lose cash, so no North American cost floor sits under winter fill. Europe's gas bill alone is above the market, which supports prices through import demand, not through a floor.
- India's Lowest Urea Offers Came In at $352.10 East and $356.25 West, Nearly 10% Under August. No Offer on Either Coast Reached Our $475 Threshold. The Gulf Barge Fell to $424.75 and Retail Rose to $683.Bloomberg's offer ranges are the only public result from Indian Potash's October 7 tender; volumes, sellers and counter-bids are not out. We test Tuesday's thresholds against them, correct our $390 floor, and show retail urea now sits $258 over a barge that has dropped $10 since Tuesday.
- India Opens Bids for 1.7 Million Tonnes of Urea at 2 a.m. Central on Wednesday. A Granular Price Near $475 CFR Equals Today's $435 Gulf Barge. Each $10 Above or Below Is a Cent a Pound of Nitrogen.Indian Potash Limited's tender closes October 7 and no offer is public yet. We convert any India CFR price into a Gulf barge and a retail ton: about $475 matches today's $435 barge, $490 matches Middle East replacement near $449, and Chinese prills near $390 say little about either.
- A Ton of Potash Costs About 102 Bushels of Corn, Back to Its 2019–20 Level. DAP Still Takes About 190, More Than at the 2022 Peak.Iowa cash corn is up 26% on the year while retail potash is up 1%, so a ton of potash now costs about 25 fewer bushels than last September, a 20% drop and the largest of the four major nutrients. Anhydrous rose 22% and absorbed almost all of the rally, improving only 3%. Measured against its 2019–20 level, potash is back to normal; DAP and anhydrous still cost almost half as many bushels again, and DAP costs more corn per ton than it did in September or May 2022.
- USDA Put 282 Million More Bushels in the Corn Carryout, 172 Million Over the Trade. Nebraska Supplied 106 Million of the Crop Increase. Soybeans' 2027 Edge on an Illinois Acre Widens From $50 to About $100.October's WASDE raised corn yield 2.7 bushels to 181.2 and ending stocks to 1.849 billion (11.3% of use), cut the price 10 cents to $4.70 and left soybeans at 315 million and $12.00. USDA raised 2026/27 corn feed use where we expected a cut. On farmdoc's 2027 budget, corn needs $5.20 cash to match $12.00 soybeans.
- A Ton of Alfalfa Hay Carries Off $27 to $33 of Phosphate and Potash, 13% to 16% of the $206 Farm Price. A Ton of Potash Costs 2.4 Tons of Hay, Down From 3.5 in 2021. On Corn Rent, a 6-Ton Stand Needs $168 Hay to Match Corn.At DTN's Sep 28–Oct 2 retail prices of $974 for MAP and $499 for potash, five university removal figures put replacement at $26.87 to $32.97 per ton of hay, about two-thirds of it potash. On USDA's August prices that is 10% to 12% of the hay check in Pennsylvania and 21% to 25% in Iowa. On Optimum-testing ground, skipping a year of potash defers about $89 an acre and earns about $14. The trial record puts the risk in low-testing soils and young stands, and finds no case for fall timing as such. Iowa State's budget, with fertilizer repriced, breaks even at $149 a ton for a 6-ton stand on $274 rent.
- Financing a 2027 Illinois Corn Acre Costs $35 to $55 in Interest at 7.12%, or 7 to 11 Bushels. The Rent Check's Due Date Moves It as Much as the Fertilizer's. Each Month the Line Stays Open Past November Costs $6.28.On farmdoc's 2027 central Illinois budget, $1,059 of cash costs carries 5.6 to 8.7 months of interest depending on when fertilizer, seed and rent are paid. Soybeans run $23 to $36. Seed cash discounts earn 18% to 43% annualized, and Purdue's and Iowa State's interest lines leave rent out.
- The Board Pays 36¾ Cents to Carry Soybeans to May. Interest on a $12.46 Bushel Is 52. An Owned Bin Breaks Even at Iowa's Average January Basis and Falls Short of It in March and May.At October 5 settlements the soybean carry covers about three-quarters of operating-loan interest in every window. An owned bin needs roughly Iowa's five-year average January basis to break even, 17 to 24 cents better than average in March, 7 to 14 in May. Commercial storage needs more.
- USDA Sees 2026 Net Farm Income Down 2.6%. Net of $47.4 Billion in Government Payments, It Falls 18%.ERS's Sep 3 forecast has government payments at 30% of 2026 net farm income, up from 17%, and fertilizer and fuel make up almost half of a $21.2 billion rise in expenses. By this desk's estimate, about half of those payments pay for the 2025 crop. On central Illinois budgets, federal support for the 2026 corn crop falls from $86 to $17 an acre, so the return rests on a price rally that is only a month old.
- A Hired Fall Strip-Till Pass With Banded Dry Fertilizer Costs About $32 an Acre in Iowa. A New 16-Row Rig Asked at $249,000 Beats That Past About 1,300 Acres. The Trials Do Not Let It Cut the P and K Rate.Iowa's $29.65 survey rate, repriced to $5.63 farm diesel, is $32.12 an acre, or 7.3 bushels of $4.37 corn, and it is $20.50 cheaper than hiring a chisel pass, a field cultivator pass and a spreader. A new 16-row bar with a dry fertilizer cart carries about $28,100 a year of fixed cost and breaks even near 1,300 acres with the tractor treated as paid for, near 1,950 with it charged. Illinois trials put strip-till 4.5% to 7.8% above no-till corn. Twenty-five years of Iowa trials found no banded rate that held yield below the broadcast rate.
- A New 120-Foot Sprayer Needs About 5,600 Acre-Passes a Year to Beat Iowa's $9.35 Custom Rate. A Seven-Year-Old One Needs 3,300. A Pull-Type Needs 1,150.At a $543,689 list price, a 5.12% real interest rate and $5.63 farm diesel, a new self-propelled sprayer carries $46,400 a year of fixed cost and beats hired spraying only above about 1,860 acres sprayed three times. A used machine at the $220,000 median asking price gets there near 1,100 acres, and a 90-foot pull-type near 380. Diesel moves the hired rate by 22 cents. Each point of interest moves the new-machine line by about 450 acre-passes. The tender truck, the applicator license and the drift claim are in none of these numbers.
- A 5,000-Gallon UAN Tank Costs $67 a Ton a Year to Own. The Fall-to-Spring Price Gap Has to Top $83 to Pay for It, and Did in Three of the Last Seven Seasons. Add a Containment Dike and the Bar Passes $130.From October 2026 dealer listings, a 5,000-gallon poly tank under the Iowa, Illinois and Minnesota containment thresholds costs $2.21 a gallon installed. Seven seasons of DTN prices put the average fall-to-spring UAN28 gain at $40 a ton after interest. Price alone does not pay; one well-bought truckload can.
- Iowa's 90,000-Pound Harvest Window Closes October 10 With 7% of Its Corn Cut. Nebraska Allows 25% Over Until Late December, and 10,000 Extra Pounds Is Worth 2 to 7 Cents a Bushel.Five Corn Belt governors have temporary harvest weight relief in force, from 88,000 to 100,000 pounds, expiring between October 10 and December 28. We tabulate each rule and its road limits, price the extra payload at $6.29 diesel, and set it against Iowa's fine schedule and pavement wear.
- A Pound of Nitrogen Costs $1.90 in Truckload Feather Meal, $5.88 in Bagged Feather Meal and 60 Cents in Anhydrous. Organic Corn at $11.23 Pays for the First and Not the Second.On first-year-available nitrogen, allowed organic sources run from $1.50 a pound for a legume credit and $2.54 for feed-grade feather meal to $7.84–$23.82 for bagged meals and pellets, against 60 cents for anhydrous. The same feather meal costs 3.1 times as much in a 50-pound bag as on a truck, and 100 pounds of available nitrogen from any bagged product costs more than the $725-an-acre gross advantage organic corn holds over conventional.
- A Thousand Gallons of Dairy Slurry Carries $28.86 of Nutrients at October Prices. A Crop Can Use $18.79 of It the First Year. Wisconsin's Average Dragline Charge Is $17.50.At Wisconsin's book analysis of 24-8-21 and the October 7 retail survey, injected dairy slurry's first-year credit clears the average custom application charge by about a dollar per 1,000 gallons, which buys less than a mile of tanker haul. Nitrogen alone is worth $7.16. At 2% solids the same gallon is worth $11.16 and costs the same to move.
- A Ton of Average Wood Ash Carries 645 Pounds of Lime Value and 47 Pounds of Potash. It Is Worth $37 Delivered and Spread Where the Soil Needs Both, and $18 Where It Needs Only Lime.Priced at ag lime's 2.7 cents a pound and $498 retail potash, average boiler ash is worth $17.55 a ton as lime and $37.04 with its potash. Free ash pays to about 47 miles on lime value alone. Published analyses range from 22% to 92% calcium carbonate equivalent.
- A Molybdenum Seed Treatment Needs a Sixth of a Bushel of 2027 Soybeans. Liming the Same Acre to pH 6.0 Needs 5.3. Alabama Found a Molybdenum Response on One Soil in Eight.Sodium molybdate at Arkansas's seed-treatment rate costs 36 cents to $5.77 an acre at two public prices, against $33 to $67 for ag lime. Trials put the response below pH 5.8 and find none on limed ground. On a one-year lease it postpones lime; it never replaces it.
State of the Industry
Last week's column ended on a tender. The tender came in low, the Gulf barge followed it down, and the retail survey went up anyway. Then USDA found more corn than the trade expected, so the crop that pays for nitrogen got cheaper in the same week.
Wholesale nitrogen fell and retail did not. NOLA urea barges were $422–435 a short ton, against $430–452 a week earlier and $450–455 the week before that (Advanced Turf Solutions, Oct 12, 2026). The same summary relays low offers of $352.10–356.25 a tonne CFR in India's October 7 tender. We found no public report of awarded volumes or counter-bids. The Gulf urea benchmark ended October 9 at $438.50 a tonne, 1.8% under the prior Friday (Trading Economics, Oct 9, 2026). Retail went the other way. In DTN's survey for September 28–October 2, urea averaged $683 a ton, up $28 in a month, anhydrous $979, up $41, and UAN32 $483, up $28 (DTN/Progressive Farmer, Oct 7, 2026). Retail urea now sits about $255 above the middle of the barge range (our arithmetic). Supply news leaned tight: Nutrien said on October 5 that its Trinidad nitrogen plant, down since October 2025, will stay shut indefinitely (Fertilizer Daily, Oct 8, 2026). We found no public November Tampa ammonia price.
Phosphate and potash held. NOLA DAP barges were $803–808 against $805, MAP $810–815 against $800–810, and potash unchanged at $345–360 (Advanced Turf Solutions, Oct 12, 2026). Retail DAP averaged $934 and potash $499 (DTN/Progressive Farmer, Oct 7, 2026). The fourth-quarter Tampa sulfur contract was still listed as under negotiation on October 9 (Green Markets, Oct 9, 2026), while Kuwait cut its October price $45 to $820 a tonne FOB (Argus Media, Oct 5, 2026).
Corn took the report and soybeans shrugged. USDA raised the corn yield to 181.2 bushels an acre and 2026/27 ending stocks to 1.849 billion bushels, against a trade average of 1.677 billion, and put soybean stocks at 315 million (DTN/Progressive Farmer, Oct 9, 2026). December corn settled at $4.79¾, down 18 cents on the week. November soybeans gained 13¾ cents to $12.92 and December Chicago wheat lost 12 cents to $6.71 (Brownfield Ag News, Oct 9, 2026; weekly moves computed against the October 2 settlements in our last issue). North-central Illinois elevators bid an average $4.44 for corn and $12.59 for soybeans (USDA AMS, Oct 9, 2026). A ton of anhydrous now costs about 221 bushels of that corn, against about 212 a week ago (our arithmetic).
Moving the crop. U.S. diesel fell 18.3 cents to $6.199 a gallon, still $2.49 above a year ago (U.S. Energy Information Administration, Oct 5, 2026). The Illinois River barge rate was flat at 814% of tariff, or $37.77 a ton, 34% over last year. The St. Louis gauge read 23 feet on October 7, so draft is not this fall's problem. Cost is: October's rail fuel surcharge averages 59 cents a mile, 40 cents above a year ago (USDA AMS Grain Transportation Report, Oct 8, 2026). Harvest is late. By October 4, 23% of corn and 25% of soybeans were cut, against averages of 27% and 33%, and Iowa stood at 7% and 5% against 20% and 38% (USDA NASS, Oct 5, 2026).
Alternative inputs rose with the rest. Feed-grade feather meal was offered in Minnesota at an average $487.50 a ton against $397.50 a year ago, and ruminant blood meal traded at $1,670 against $1,050 (USDA AMS, Oct 9, 2026).
| Benchmark | Level | Basis | Move |
|---|---|---|---|
| Anhydrous | $979/ton | Delivered retail, Sep 28–Oct 2 | +$41 MoM; +20% YoY |
| Urea | $683/ton | Delivered retail, Sep 28–Oct 2 | +$28 MoM; +12% YoY |
| UAN28 | $430/ton | Delivered retail, Sep 28–Oct 2 | +$7 MoM; +3% YoY |
| UAN32 | $483/ton | Delivered retail, Sep 28–Oct 2 | +$28 MoM; +4% YoY |
| Urea | $422–435/st | NOLA barge, summary of Oct 12 | $430–452 a week earlier |
| Urea | $438.50/t | Gulf benchmark, Oct 9 | −1.8% w/w; −2.6% m/m |
| DAP | $934/ton | Delivered retail, Sep 28–Oct 2 | +$15 MoM; +3% YoY |
| DAP | $803–808/st | NOLA barge, summary of Oct 12 | $805 a week earlier |
| DAP | $802.50/t | Benchmark, Oct 9 | 0.0% w/w |
| MAP | $810–815/st | NOLA barge, summary of Oct 12 | $800–810 a week earlier |
| Potash | $499/ton | Delivered retail, Sep 28–Oct 2 | +$6 MoM; +3% YoY |
| Potash | $345–360/st | NOLA barge, summary of Oct 12 | Unchanged |
| Sulfur | $820/t | Kuwait posted price, FOB, October | −$45 m/m |
| Dec corn | $4.79¾/bu | CBOT settlement, Oct 9 | −18¢ w/w |
| Nov soybeans | $12.92/bu | CBOT settlement, Oct 9 | +13¾¢ w/w |
| Dec Chicago wheat | $6.71/bu | CBOT settlement, Oct 9 | −12¢ w/w |
| Corn, cash | $4.44/bu | N-central Illinois elevator avg, Oct 9 | −18¢ w/w; +17% YoY |
| Soybeans, cash | $12.59/bu | N-central Illinois elevator avg, Oct 9 | +12¢ w/w; +30% YoY |
| U.S. diesel | $6.199/gal | On-highway retail, wk Oct 5 | −18.3¢ w/w; +$2.49 YoY |
| Illinois River barge | 814% of tariff | $37.77/ton, wk ended Oct 6 | 811% a week earlier; +34% YoY |
| Barge cost indicator | 249 | USDA GTR index, wk ended Oct 7 | 248 a week earlier |
Sources: DTN/Progressive Farmer, Oct 7, 2026 (retail, Sep 28–Oct 2; month and year moves computed from the survey's month-ago and year-ago rows); Advanced Turf Solutions, Oct 12, 2026 (NOLA barges; the summary's price column still carries a 10/2/26 label, and we read it as the latest week because its "last week" column matches the October 5 edition); Trading Economics, accessed Oct 12, 2026 (urea and DAP, Oct 9; week-on-week moves computed against the Oct 2 prints in our last issue); Argus Media, Oct 5, 2026 (Kuwait sulfur); Brownfield Ag News, Oct 9, 2026 (futures; week-on-week moves computed against the Oct 2 settlements); USDA AMS Illinois Grain Bids, Oct 9, 2026 (week-on-week moves computed against last issue's Oct 2 averages, year-on-year from the report's year-ago averages); U.S. Energy Information Administration, week of Oct 5, 2026; USDA AMS Grain Transportation Report, Oct 8, 2026. Tampa ammonia is left out: the October contract is public only as a headline and we found no November price.
The week's verdict: the Gulf urea barge fell again and corn lost 18 cents while retail nitrogen rose, so a ton of anhydrous costs about nine more bushels than it did seven days ago, and the gap between barge and retail is the number to watch.
References
- Advanced Turf Solutions, "U.S. Fertilizer Market Summary," Oct 12, 2026. https://www.advancedturf.com/wp-content/uploads/2026/04/ATS-Fertilizer-Market-Update-10_12_2026.pdf
- Advanced Turf Solutions, "U.S. Fertilizer Market Summary," Oct 5, 2026. https://www.advancedturf.com/wp-content/uploads/2026/10/ATS-Fertilizer-Market-Update-10_5_2026.pdf
- Trading Economics, Urea, accessed Oct 12, 2026. https://tradingeconomics.com/commodity/urea
- Trading Economics, Di-ammonium Phosphate, accessed Oct 12, 2026. https://tradingeconomics.com/commodity/di-ammonium
- DTN/Progressive Farmer, "UAN32 Leads Fertilizer Prices Higher," Oct 7, 2026. https://www.dtnpf.com/agriculture/web/ag/crops/article/2026/10/07/uan32-leads-fertilizer-prices-higher
- Fertilizer Daily, "Nutrien Trinidad shutdown turns indefinite as gas shortage halts key 85,000 t/month ammonia site," Oct 8, 2026. https://www.fertilizerdaily.com/20261008-nutrien-trinidad-nitrogen-shutdown-indefinite/
- Green Markets (Bloomberg), "Sulfur," Oct 9, 2026 (headline only; body restricted to members). https://fertilizerpricing.com/sulfur-546/
- Argus Media, "Kuwait's KPC cuts Oct sulphur price by $45/t," Oct 5, 2026. https://www.argusmedia.com/en/news-and-insights/latest-market-news/2886522-kuwait-s-kpc-cuts-oct-sulphur-price-by-45-t
- DTN/Progressive Farmer, "USDA Raises Corn Yield 2.7 BPA to 181.2 BPA," Oct 9, 2026. https://www.dtnpf.com/agriculture/web/ag/news/article/2026/10/09/usda-raises-corn-yield-2-7-bpa-181-2
- Brownfield Ag News, "Closing Grain and Livestock Futures: October 9, 2026." https://www.brownfieldagnews.com/market-news/closing-grain-and-livestock-futures-october-9-2026/
- USDA Agricultural Marketing Service, Illinois Grain Bids, Oct 9, 2026. https://www.ams.usda.gov/mnreports/ams_3192.pdf
- U.S. Energy Information Administration, Gasoline and Diesel Fuel Update, week of Oct 5, 2026 (accessed Oct 12, 2026). https://www.eia.gov/petroleum/gasdiesel/
- USDA Agricultural Marketing Service, Grain Transportation Report, Oct 8, 2026. https://ams-prod.azureedge.us/sites/default/files/media/GTR10082026.pdf
- USDA National Agricultural Statistics Service, Crop Progress, Oct 5, 2026 (week ending Oct 4). https://release.nass.usda.gov/reports/prog4026.txt
- USDA Agricultural Marketing Service, National Animal By-Product Feedstuff Report, Oct 9, 2026 (week of Oct 5–9). https://www.ams.usda.gov/mnreports/ams_3510.pdf
- Crop Root Zone, RZ-012, "State of the Industry" (Oct 2 prints for Gulf urea and DAP, CBOT settlements and north-central Illinois cash bids, with their original sources).
Weekly Briefing
Fertilizer
UAN32 leads retail higher; anhydrous up 20% on year — DTN's survey for September 28–October 2 had seven of eight products above a month earlier, with only 10-34-0 lower. UAN32 averaged $483 a ton, up 6% on the month, anhydrous $979 and urea $683. DAP was $934, MAP $974 and potash $499, and all eight were above a year ago. (DTN/Progressive Farmer, Oct 7, 2026)
India's low urea offers land near $352 a tonne — A distributor's weekly summary relays low bids of $352.10–356.25 a tonne CFR in Indian Potash's October 7 tender, nearly 10% below August. The same summary puts NOLA urea barges at $422–435 a short ton, against $430–452 a week earlier. We found no public report of awarded volumes or counter-bids. (Advanced Turf Solutions, Oct 12, 2026)
Nutrien's Trinidad nitrogen plant stays shut indefinitely — Nutrien said on October 5 that its Point Lisas operations, down since October 23, 2025, will remain closed, citing natural gas supply constraints. The site made about 85,000 tonnes of ammonia and 55,000 tonnes of urea a month. The company said its 2026 nitrogen sales outlook is unchanged and has not said whether it will sell the assets. (Fertilizer Daily, Oct 8, 2026)
Russian and Belarusian potash shipments fell a quarter — Three producers shipped about 1.95 million tonnes in September against a monthly average near 2.6 million, as cargo diverted from the Black Sea crowded rail and Baltic ports. Market estimates cited in the report put the fourth-quarter shortfall at about 1.5 million tonnes if that pace holds. The first Belarusian cargo for New Orleans, 30,000 tonnes, is scheduled to dock October 14. (Fertilizer Daily, Oct 8, 2026; Advanced Turf Solutions, Oct 12, 2026)
Crops
USDA lifts corn yield to 181.2 bushels an acre — The October 9 reports put the corn crop at 16.034 billion bushels and 2026/27 ending stocks at 1.849 billion, against a trade average of 1.677 billion. The season-average corn price fell 10 cents to $4.70. Soybeans were 53.1 bushels, 315 million bushels of stocks and an unchanged $12.00, and wheat stocks rose to 740 million. (DTN/Progressive Farmer, Oct 9, 2026)
December corn touches limit-down, settles at $4.79¾ — Corn lost 20½ cents on report day after briefly trading at the limit. November soybeans gained 4½ cents to $12.92 and December Chicago wheat fell 12¼ cents to $6.71. DTN put soybean export commitments about 80% ahead of a year ago. (Brownfield Ag News, Oct 9, 2026; DTN/Progressive Farmer, Oct 9, 2026)
Iowa has cut 7% of its corn, not 20% — By October 4, 23% of corn and 25% of soybeans were harvested across the 18 reporting states, against five-year averages of 27% and 33%. Iowa stood at 7% and 5% against 20% and 38%, and Nebraska at 15% and 9% against 24% and 34%. Illinois was ahead of average on both crops. (USDA NASS, Oct 5, 2026)
USDA commits $180 million to sequence its seed bank — The plan, announced October 6 in Iowa, would sequence the National Plant Germplasm System, about 10% of which has been done. USDA and the Justice Department also widened their agreement to examine seed pricing, licensing and relabeling. The report says the same agreement covers fertilizer. (Fertilizer Daily, Oct 8, 2026, relaying DTN/Progressive Farmer)
Home & Garden
Broccoli sprouting seeds recalled over Salmonella risk — Gardeners Basics of Spanish Fork, Utah, recalled its Waltham 29 broccoli sprouting seeds on October 8, sold online through several large retailers. The supplier's seed lot is linked to an outbreak that has sickened at least 32 people in six states, though no illness has been reported from this product. Do not eat the seeds or sprouts; bag them, bin them and ask for a refund. (Food Poisoning Bulletin, Oct 8, 2026)
For rooftop tomatoes, look at the roof first — Eight years and 11 crop cycles in a Barcelona rooftop greenhouse found light was the deciding factor. The aging plastic roof cut production 31%, and new panels raised yields more than 56% in a year. Struvite recovered from city wastewater, at 100 grams a plant, matched mineral fertilizer. It is one greenhouse on one campus. (Agronomy for Sustainable Development, via Phys.org, Oct 7, 2026)
Mushroom blotch turns out to be a crowd — The brown blotches on white button mushrooms have been blamed on one bacterium for a century. University of Florida researchers found more than 17 pathogenic species in affected mushrooms from southern U.S. farms. That may explain why treatments work unevenly, and trials of alternatives are not finished. (Microbiological Research, via ScienceDaily, Oct 11, 2026)
Micronutrients
Kuwait cuts October sulfur $45 as Tampa waits — Kuwait's posted price fell to $820 a tonne FOB from $865. Delivered granular sulfur into China slid from a $1,050 midpoint on August 6 to $965 on October 1, which Argus ties to buyers stepping back from raw material costs. The fourth-quarter Tampa molten contract was still listed as under negotiation on October 9. (Argus Media, Oct 5, 2026; Green Markets, Oct 9, 2026)
Roots need bacteria to unlock soil iron — Plant-breeding researchers in Cologne found Arabidopsis releases one compound in acid soil and another in calcareous soil, and that neither mobilizes iron fully without root bacteria. Plants grown without their microbes stayed iron-deficient. Lab work on a model plant: no crop or field experiments are reported. (Cell, via Phys.org, Oct 9, 2026)
Venture report argues crops are losing mineral density — Deep Science Ventures' report blames breeding for yield, fertilizer regimes and degraded soil, and cites estimates that higher carbon dioxide could cut wheat zinc by up to 36.5% by 2050. It says paired farm trials showed better soil health raising nutrient levels 10% to 35%. One firm's report: its headline figures are scenarios and upper bounds, not forecasts. (Fertilizer Daily, Oct 8, 2026)
Organics
Feather meal asks run 23% to 44% above last year — Feed-grade feather meal was offered at an average $487.50 a ton FOB in Minnesota and Arkansas in the week of October 5–9, against $397.50 and $352.50 a year earlier, and $515 delivered in the Kansas City region against $357.50. Ruminant blood meal traded at $1,670 FOB in the central U.S., against $1,050. These are feed-ingredient quotes, not prices for an approved organic fertilizer. (USDA AMS, Oct 9, 2026)
Adding rye to a manure digester changes the math — A Penn State model of a 1,000-cow Northeast dairy found co-digesting manure with winter rye, switchgrass or corn stover raised methane output. Capital support needed to break even fell from about 47% for manure alone to as little as 4% in the best case. Modeled, not built, and the 4% is the best scenario only. (Biomass Conversion and Biorefinery, via Phys.org, Oct 8, 2026)
BRANDT buys Mexican specialty-input maker Altiara — The deal, announced October 5, adds plants in Mexico City and Pachuca making specialty nutrition products, biologicals, crop protection products and adjuvants, some of them listed for organic use. Terms were not disclosed. (Fertilizer Daily, Oct 9, 2026)
Up and Coming
An off switch for nitrogen fixation is mapped — A University of Arkansas-led team imaged how a methane-producing microbe locks its nitrogen-fixing enzyme into an inactive complex when energy is short, and releases it later. Basic research: the work involves no crops, and moving the system into corn is the lead author's stated hope, not a result. (Nature, via Phys.org, Oct 8, 2026)
Microphones on soybean stems listen for borers — Kansas State is field-testing the Insect Eavesdropper, a device invented at the University of Wisconsin–Madison that records the vibrations of insects feeding inside plants. The target is the soybean stem borer. In testing: the report gives no detection accuracy, and the detection models are still being built. (Kansas State University, via Phys.org, Oct 7, 2026)
Nanoparticle-carried gibberellic acid doubles grape cluster weight — Field-trial grapevines treated with the growth hormone in biodegradable nanoparticles had clusters 104% heavier and berries 15% heavier than vines given the free hormone. Early-stage: the summary names no trial size, variety, season count or cost. (Journal of the Science of Food and Agriculture, via Phys.org, Oct 7, 2026)
Two European firms pool microalgae biostimulant work — Phoenix Biosolutions and Portugal's Necton formed a joint venture, PNA, to make and sell microalgae-based inputs, starting with products already CE-marked for sale in Europe. No efficacy data: the announcement reports no field trials or yield figures. (Fertilizer Daily, Oct 12, 2026)
Interesting
Executive order lets dyed diesel run on highways — An order signed October 5 gives temporary tax deferral and penalty relief for using red-dyed diesel in highway vehicles through the end of the year. The federal tax on road diesel is 24.4 cents a gallon. USDA's secretary put the combined federal and state savings at about $640 million. (USDA AMS Grain Transportation Report, Oct 8, 2026)
A container ship fuels up on corn ethanol — Maersk said on September 28 that it had bunkered the dual-fuel Tangier Maersk at Houston with 100% U.S.-produced corn ethanol, a first in the United States. A national laboratory report counts 112 to 120 methanol-capable vessels in service and 300 to 350 on order. Whether that becomes corn demand depends on U.S. ethanol bunkering infrastructure developing. (USDA AMS Grain Transportation Report, Oct 8, 2026)
Some pricey 'Sidra' coffee seed was Kenyan Batian — DNA tests on one Ecuadorian farm found four plant types grown from seed sold as Sidra and Gesha, and only two matched the label. The seed had been bought without certification, and the plants grew for about three years before anyone checked. It is one farm; the authors cannot say how common the problem is. (Frontiers in Plant Science, via Phys.org, Oct 9, 2026)
An Italian rice farm gives a third to marsh — On 110 hectares between Milan and Turin, Alice Cerutti has turned 25 hectares into wetland and planted more than 10,000 trees. Her Carnaroli Classico gets no chemical fertilizer; fertility comes from green manure, legumes and about 1,200 grazing sheep. The farm group Coldiretti estimates heat may cost Italy about 25% of its rice this year. (AFP, via Phys.org, Oct 12, 2026)
Off the Wall Discovery
Spinach parts help failing rat hearts pump — Researchers in Wuhan injected nanoparticles made from spinach's light-harvesting membranes into rat hearts, then shone red light through the chest for 10 minutes. Treated hearts pumped better and scarred less. Preclinical and a long way from anything: four groups of six rats, injection straight into the heart, and no answer for how light reaches a human one. (Small, via Phys.org, Oct 11, 2026)
Kitchen fruit flies lead to a blueberry-pest repellent — Common fruit flies invaded a Rutgers lab's colonies of spotted-wing drosophila and the colonies died off. Researchers traced it to a yeast the invaders left behind, which repelled the pest and cut its egg-laying in lab tests. Lab result: field testing is still ahead, and the authors say approval can take years. (Applied and Environmental Microbiology, via Phys.org, Oct 5, 2026)
Twelve Days Into the Quarter, Tampa Sulfur Is Still Unsettled at $705. Gulf Producers Cut October Prices $45 to $70, and a $50 Cut Is Worth $18 on a Ton of DAP.
No fourth-quarter Tampa price is public as of October 12. The $705 contract already sits $128 to $199 a long ton under Middle East fob posts, yet the trade expects it to fall. A $50 cut takes $18 off the sulfur in a short ton of DAP and $11 off ammonium sulfate, reaches product in spring 2027, and changes nothing in this fall's retail price.
The fourth-quarter contract for molten sulfur delivered into Tampa has still not been published. Green Markets' public sulfur listing dated October 9 opens with the words "Negotiations for the fourth-quarter contract price of molten sulfur," and the rest sits behind its paywall [1]. Argus, which reported the third-quarter record of $705 per long ton delivered on July 13 [2], carried no public Tampa headline through this morning. So the assignment for this piece, to report what the fourth quarter settled at, cannot be met honestly. There is no number. What exists is twelve days of new evidence about where it is heading: three Gulf producers cut their October posted prices by $45 to $70 a tonne [3][4][5], and trade reporting says buyers now expect Tampa to come in below $705 [6]. This piece sets that evidence out, converts the likely outcomes into dollars per ton of fertilizer, and corrects the range we published on October 1 [19].
1. What is and is not public on October 12
What's new: The settlement is late by the calendar but not by this year's standard. The third-quarter price was reported on July 13, the thirteenth day of that quarter [2]. Today is the twelfth day of this one.
Evidence: The public record of the contract is four settlements long and has not grown since July.
| Tampa molten sulfur contract | $/lt delivered | Change on quarter | Status on Oct 12, 2026 |
|---|---|---|---|
| Q4 2025 | 310 | — | Settled |
| Q1 2026 | 495.69 | +185.69 | Settled |
| Q2 2026 | 655 | +159.31 | Settled |
| Q3 2026 | 705 | +50 | Settled; reported Jul 13 |
| Q4 2026 | Not published | — | Under negotiation as of Oct 9 |
Source: Argus Media, Dec 30, 2025 (Q4 2025) [16]; Green Markets, Mar 6, 2026 (Q1 2026, quoted CFR) [17]; Argus Media, Jul 13, 2026 (Q2 and Q3 2026) [2]; Green Markets, Oct 9, 2026 (Q4 status, headline only) [1]. Changes are Crop Root Zone arithmetic. Basis: long tons, molten sulfur, delivered Tampa.
Three things we could not establish. We could not read the body of the Green Markets post, so we do not know what bid and offer levels it reports. We could not open the ICIS article of October 2 that describes buyer expectations; the page returned no text, and what we cite from it comes from a search-result summary [6]. And we found no public statement of what price October deliveries are being invoiced at while the talks continue.
That ICIS summary says early talk of a rollover at $705 has been set aside, that participants expect a drop of at least $50, and that European buyers are waiting on Tampa before settling their own fourth-quarter contracts [6]. Treat the $50 as a reported expectation relayed second-hand, not as a quote.
2. The outside evidence: three Gulf producers cut October prices
What's new: The monthly posted prices we said on October 1 were the cleanest outside reference [19] are now in. All three fell.
Evidence: QatarEnergy set its October price at $835 a tonne fob Ras Laffan/Mesaieed, down $45 from September (Argus Media, Sep 30, 2026) [3]. Kuwait's KPC followed at $820 fob Kuwait, also down $45 (Argus Media, Oct 5, 2026) [4]. Abu Dhabi's Adnoc cut its price for the Indian subcontinent by $70 to $890 fob Ruwais (Argus Media, Oct 2, 2026) [5]. The July and August figures come from Argus and Fertilizer Daily [7][8][9].
| Posted price, $/tonne fob | Jul 2026 | Aug 2026 | Sep 2026 | Oct 2026 | Sep to Oct | Jul to Oct |
|---|---|---|---|---|---|---|
| Kuwait (KPC), fob Kuwait | 950 | 865 | 865 | 820 | −5.2% | −13.7% |
| Qatar (QatarEnergy), fob Ras Laffan/Mesaieed | 890 | 890 | 880 | 835 | −5.1% | −6.2% |
| Abu Dhabi (Adnoc), fob Ruwais, Indian subcontinent | 1,000 | Not retrieved | 960 | 890 | −7.3% | −11.0% |
Source: Fertilizer Daily, Jul 9, 2026 (July prices) [9]; Argus Media, Aug 4, 2026 (Kuwait August) [8]; Argus Media, Aug 31, 2026 (Qatar August and September) [7]; Argus Media, Sep 30, Oct 2 and Oct 5, 2026 (October prices and the September levels they were cut from) [3][5][4]. Percent changes are Crop Root Zone arithmetic. Basis: solid sulfur, metric tonnes, fob.
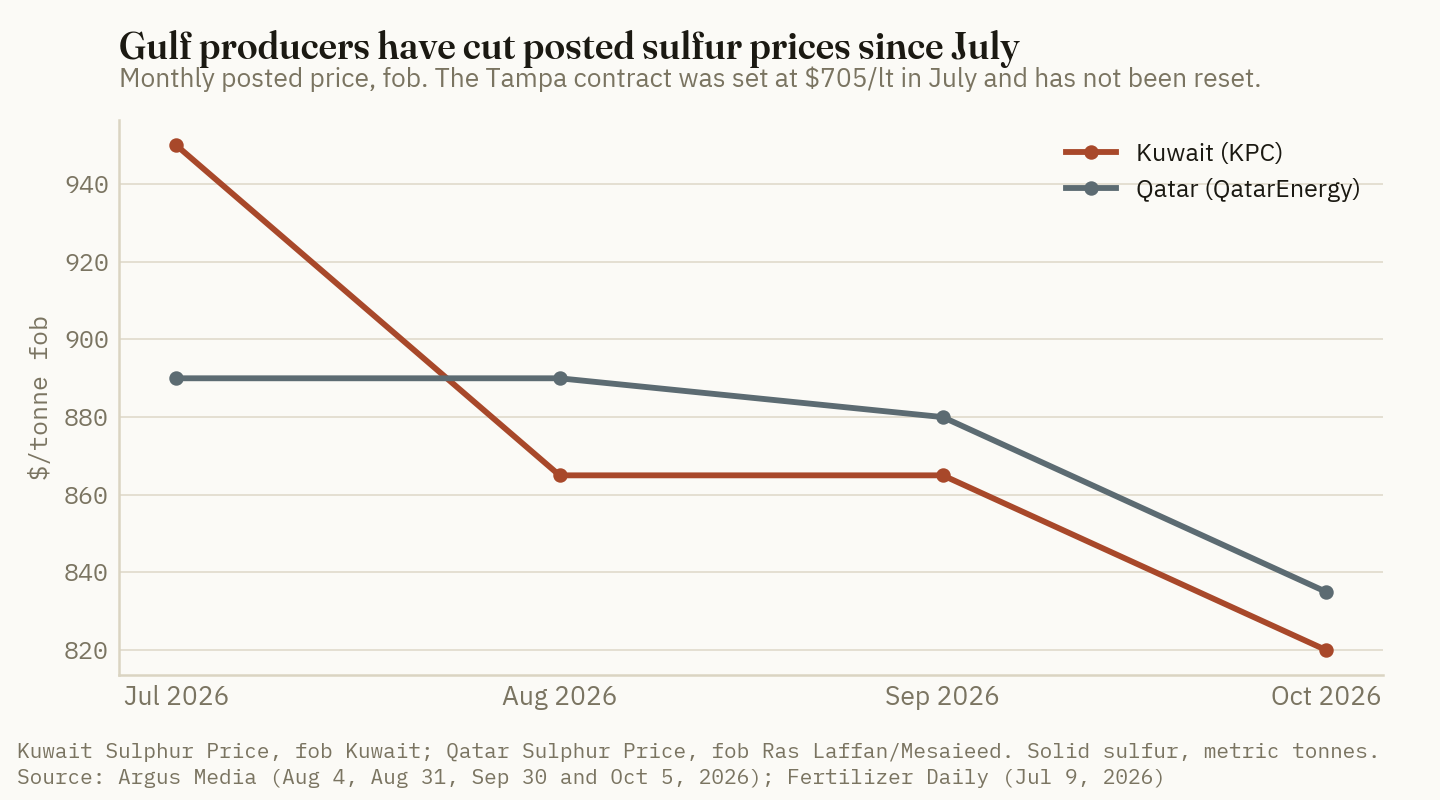
Argus gave the reason in its Kuwait report: demand destruction, as fertilizer and chemical buyers step back from raw material costs they cannot recover. Delivered granular sulfur into China fell about 8%, from a $1,050 midpoint on August 6 to $965 a tonne on October 1 [4]. Chinese domestic sulfur stood at 7,319 yuan a tonne this morning, down 7% on the month and still up 174% on the year (Trading Economics, Oct 12, 2026) [15].
This is a demand story, not a supply recovery. Argus put sulfur traffic through the Strait of Hormuz at one to three vessels a week in late September, and freight from inside the strait to China at $150 to $160 a tonne [3][4]. Prices are falling because buyers stopped buying. Nothing in these reports says the lost tonnes have come back.
The Tampa contract was set in July, when Kuwait posted $950 and Qatar $890. If it simply tracked those posts down, a $705 contract would become $609 to $661* a long ton. That is our arithmetic and a rough guide only. It brackets the $50 cut the trade is said to expect.
3. Tampa is already the cheapest sulfur on the board
What's new: A cut would widen a discount that already exists. The $705 contract is below every spot reference we could find, on any basis.
Evidence: A long ton is 1.016 metric tonnes, so $705 a long ton is about $694 a tonne, delivered. The Gulf producers' October posts are $820 to $890 before a dollar of freight.
| Sulfur price reference | Date | $/tonne | $/lt equivalent | Above Tampa $705/lt | Basis |
|---|---|---|---|---|---|
| Tampa Q3 contract | Jul 13 | 694* | 705 | — | Molten, delivered Tampa |
| Kuwait, October post | Oct 5 | 820 | 833* | +18% | Solid, fob Kuwait |
| Qatar, October post | Sep 30 | 835 | 848* | +20% | Solid, fob Ras Laffan/Mesaieed |
| Adnoc, October post | Oct 2 | 890 | 904* | +28% | Solid, fob Ruwais |
| China granular | Oct 1 | 965 | 981* | +39% | Solid, cfr China |
| Vancouver | Aug 27 | 1,050–1,200 | 1,067–1,219* | +51% to +73% | Solid, fob Vancouver; six weeks old |
| US Gulf export spot | Jul 9 | 1,100–1,150 | 1,118–1,168* | +59% to +66% | Fob US Gulf; three months old |
Source: Argus Media, Jul 13, 2026 [2]; Oct 5, 2026 [4]; Sep 30, 2026 [3]; Oct 2, 2026 [5]; Aug 31, 2026 (Vancouver assessed Aug 27) [7]. *Crop Root Zone conversions at 1.01605 tonnes per long ton. Fob, cfr and delivered prices are not like for like, and molten and solid sulfur are different products; the table shows order of magnitude, not an arbitrage.
The Vancouver and US Gulf rows are stale, and we could not find a public October assessment for either. The ICIS summary mentions recent Canadian sales into Indonesia near $950 a tonne cfr [6]. Against the $40 to $45 freight Argus assessed for that route on August 27 [7], that would imply roughly $905 to $910 fob Vancouver*, well under August's range. It is an estimate built on a second-hand number and we give it no more weight than that.
So refiners are being asked to cut a price that is already $128 to $199 a long ton under what Gulf producers post for export. The buyer's case does not rest on sulfur being cheap elsewhere. It rests on what a phosphate plant can pay. On October 1 we estimated that a US producer's cash cost of DAP meets its realized price at a contract near $1,050 a long ton [19]. That set a ceiling. It did not say where below the ceiling the price would land, and the plants were already curtailed at $705: Mosaic's Faustina idle and Bartow at 40% of its target rate (Mosaic, Aug 4, 2026) [10].
Ground Truth: We got the direction wrong on October 1. We gave a realistic range of a rollover to the mid-$800s and called a settlement under $705 the outcome that would be new information [19]. The evidence since then points below $705, and we now read the range as roughly $605 to $705, centered near $655. The reason matters for a buyer. A contract that falls while sitting under every spot price is being set by the customer's distress, not by the sulfur market. Refiners do have an export outlet, as July's Gulf spot assessment showed [2]. Our inference, which we could not source, is that most contract molten volume cannot be redirected to it quickly, so a refiner that prices its main customer into another idled plant has a disposal problem. A cut is therefore a sign that US phosphate plants are short of margin, and curtailed plants are what keeps domestic DAP and MAP tight. Read a lower Tampa number as confirmation that supply stays thin, not as a price cut on its way to the dealer.
4. What a cut is worth in a ton of DAP, MAP and ammonium sulfate
What's new: The conversion we published on October 1 holds: each $100 a long ton is $36 on a short ton of DAP [19]. Here it is for the outcomes now in view.
Evidence: Phosphate takes about 0.405 tonnes of sulfur per tonne of DAP and 0.458 per tonne of MAP. Those are our engineering estimates, and they agree with the trade rule of thumb of 4 tonnes of sulfur per 10 tonnes of DAP or MAP (Global Agriculture, Sep 24, 2026) [18]. For ammonium sulfate (24.3% sulfur) and ATS (26%) we use the sulfur in the analysis. Per short ton of product that is 0.362, 0.409, 0.217 and 0.232 long tons. As a cross-check, Argus estimated in December that a contract rise of $165 to $210 a long ton would add $40 to $50 a short ton to ammonium sulfate costs [16]. That is about $24 per $100. Ours is $22.
| Sulfur cost inside a short ton, $ | Q4 2025 ($310) | $100 cut ($605) | $50 cut ($655) | Rollover ($705) | Saved by a $50 cut | Saved by a $100 cut |
|---|---|---|---|---|---|---|
| DAP 18-46-0 | 112 | 219 | 237 | 255 | 18 | 36 |
| MAP 11-52-0 | 127 | 247 | 268 | 288 | 20 | 41 |
| Ammonium sulfate | 67 | 131 | 142 | 153 | 11 | 22 |
| ATS 12-0-0-26S | 72 | 140 | 152 | 164 | 12 | 23 |
Source: Crop Root Zone model. Contract levels from Argus Media, Dec 30, 2025 [16] and Jul 13, 2026 [2]; the $605 and $655 columns are scenarios, not forecasts. All values are estimates in $ per short ton of product, sulfur priced at the Tampa contract in long tons. For ammonium sulfate and ATS this is an opportunity cost: much of that supply is made from byproduct streams that do not pay Tampa prices.
$18 a short ton
What a $50 a long ton cut in the Tampa contract takes off the sulfur cost inside a ton of DAP. On a 100 lb P2O5 program that is about $1.97 an acre. (Crop Root Zone model on Argus Media contract prints, Jul 13, 2026)
Two comparisons put those numbers in scale. First, even the $100 cut leaves the sulfur in a ton of DAP at $219, almost double the $112 of a year ago. Second, the saving is small for the producer too. At 0.399 long tons of sulfur per tonne of DAP, a $50 cut is about $20 a tonne. Across the 1.1 to 1.4 million tonnes of phosphate Mosaic guided for third-quarter sales [10], that is roughly $22 million to $28 million a quarter*, treating every tonne as DAP. Its phosphate segment carried $60 million of idle and turnaround cost in the second quarter alone [10]. A $50 cut does not by itself restart a plant.
5. When it reaches the retail counter
What's new: Retail phosphate rose again into October while sulfur spot prices fell. The two are on different clocks.
Evidence: DTN's national retail average for the week of September 28 to October 2 was $934 a ton for DAP and $974 for MAP, up $15 each in four weeks and up 3% and 6% on the year (DTN/Progressive Farmer, Oct 7, 2026) [12]. USDA's distributor reports for the week ending October 2 showed DAP up $3.75 in Oklahoma and $0.72 in Illinois, with ammonium sulfate and ATS unchanged [13][14].
| Product and series | $/st | Year ago or prior report | Sulfur at $705 contract, $/st* | Share of price* | A $50 cut as % of price* |
|---|---|---|---|---|---|
| DAP, national retail | 934 | 906 a year ago | 255 | 27% | 1.9% |
| MAP, national retail | 974 | 921 a year ago | 288 | 30% | 2.1% |
| DAP, Oklahoma distributor ask | 959.55 | +3.75 on prior report | 255 | 27% | 1.9% |
| DAP, Illinois distributor ask | 929.29 | +0.72 on prior report | 255 | 27% | 1.9% |
| Ammonium sulfate, Oklahoma ask | 553.00 | unchanged | 153 | 28% | 2.0% |
| ATS, Oklahoma ask | 415.00 | unchanged | 164 | 39% | 2.8% |
Source: DTN/Progressive Farmer, Oct 7, 2026 (survey of Sep 28–Oct 2, 2026, with year-earlier row; national average retail) [12]; USDA AMS Oklahoma and Illinois Production Cost Reports, week ending Oct 2, 2026 (distributor ask, f.o.b.) [13][14]. *Crop Root Zone model values from the table above.
The clock is on the record. Mosaic said its $705 third-quarter contract would show up primarily in fourth-quarter operating results [10]. Its realized sulfur cost was $379 a long ton in the first quarter against a $495.69 contract, and $522 in the second against $655 [11][10][17][2]. Costs run about a quarter behind the contract. Phosphate made this fall carries the July price. Whatever is settled this month reaches cost of goods in January to March and reaches a dealer's bin for spring.
The pass-through so far is also on the record. Between the fourth-quarter 2025 contract and today's, the sulfur inside a ton of DAP rose by about $143*. Retail DAP rose $28 over the same year [12]. Producers and the channel absorbed most of the difference, through margin and through idled capacity. Ammonia and rock moved too, so this is a comparison and not a full cost reconciliation.
Ground Truth: Do not wait on the Tampa settlement to buy fall phosphate. A $50 cut is under 2% of a retail ton, it arrives in spring product, and the producers who absorbed about $115 a ton of sulfur cost the retail price never showed have first claim on it. For spring 2027 the settlement matters in a different way from the one most buyers assume. A price near $655 with no restart announcement means plants stay curtailed and spring DAP and MAP are priced on tight supply. A price near $605, or a restart at Faustina or Bartow, is the combination that would loosen spring phosphate. For ammonium sulfate and ATS the settlement barely registers: $11 to $12 a ton, on products whose asks did not move in the latest report.
What to watch, in order:
- The settlement itself, and how it is described. A rollover would mean refiners held. Anything at $655 or below confirms the buyer set the price.
- Mosaic's third-quarter results. They will give the first realized sulfur cost near $705 and any change in operating rates. We did not find a published date for the release.
- November posted prices from Qatar, Kuwait and Adnoc, due around the turn of the month. A third straight cut would say demand destruction is still running.
- A current Vancouver or US Gulf export assessment. The latest public figures we could find are from August 27 and July 9.
References
- Green Markets (Bloomberg), "Sulfur," public headline: "Tampa: Negotiations for the fourth-quarter contract price of molten sulfur," Oct 9, 2026 (headline only; body restricted to members). https://fertilizerpricing.com/sulfur-546/
- Argus Media, "Tampa 3Q liquid sulphur price hits record $705/lt," Jul 13, 2026 (includes Jul 9 US Gulf export spot assessment). https://www.argusmedia.com/en/news-and-insights/latest-market-news/2851577-tampa-3q-liquid-sulphur-price-hits-record-705-lt
- Argus Media, "QatarEnergy drops October sulphur price by $45/t," Sep 30, 2026. https://www.argusmedia.com/en/news-and-insights/latest-market-news/2884718-qatarenergy-drops-october-sulphur-price-by-45-t
- Argus Media, "Kuwait's KPC cuts Oct sulphur price by $45/t," Oct 5, 2026. https://www.argusmedia.com/en/news-and-insights/latest-market-news/2886522-kuwait-s-kpc-cuts-oct-sulphur-price-by-45-t
- Argus Media, "Abu Dhabi's Adnoc cuts Oct sulphur price by $70/t," Oct 2, 2026. https://www.argusmedia.com/en/news-and-insights/latest-market-news/2885834-abu-dhabi-s-adnoc-cuts-oct-sulphur-price-by-70-t
- ICIS, "Sulphur outlook softens as buyers gain leverage ahead of Q4 settlements," Oct 2, 2026 (cited from a search-result summary; the page itself returned no text when opened, and the date is taken from the URL). https://www.icis.com/explore/resources/news/2026/10/02/11235938/sulphur-outlook-softens-as-buyers-gain-leverage-ahead-of-q4-settlements/
- Argus Media, "QatarEnergy drops Sept sulphur price by $10/t," Aug 31, 2026 (includes Vancouver fob and freight assessments of Aug 27). https://www.argusmedia.com/en/news-and-insights/latest-market-news/2871660-qatarenergy-drops-sept-sulphur-price-by-10-t
- Argus Media, "Kuwait's KPC drops August sulphur price by $85/t," Aug 4, 2026. https://api.argusmedia.com/articles/2860769
- Fertilizer Daily, report on Kuwait, Adnoc and QatarEnergy July 2026 sulphur prices, Jul 9, 2026 (date from the URL). https://www.fertilizerdaily.com/20260709-kuwait-kpc-sulphur-price-record/
- The Mosaic Company, "The Mosaic Company Reports Second Quarter 2026 Results," Form 8-K Exhibit 99.1, Aug 4, 2026. https://www.sec.gov/Archives/edgar/data/0001285785/000128578526000109/pressreleaseq22026-ex991.htm
- The Mosaic Company, first quarter 2026 results, Form 8-K Exhibit 99.1, May 11, 2026. https://www.sec.gov/Archives/edgar/data/0001285785/000128578526000063/pressreleaseq12026-ex991.htm
- DTN/Progressive Farmer, "UAN32 Leads Fertilizer Prices Higher," Oct 7, 2026 (retail survey Sep 28–Oct 2, 2026, with year-earlier row). https://www.dtnpf.com/agriculture/web/ag/crops/article/2026/10/07/uan32-leads-fertilizer-prices-higher
- USDA AMS, Oklahoma Production Cost Report (Bi-Weekly), week ending Oct 2, 2026. https://www.ams.usda.gov/mnreports/ams_3621.pdf
- USDA AMS, Illinois Production Cost Report (Bi-weekly), week ending Oct 2, 2026. https://www.ams.usda.gov/mnreports/ams_3195.pdf
- Trading Economics, "Sulfur — Price, Chart, Historical Data," accessed Oct 12, 2026. https://tradingeconomics.com/commodity/sulfur
- Argus Media, "Viewpoint: Sulfur costs to support amsul prices in 2026," Dec 30, 2025. https://www.argusmedia.com/en/news-and-insights/latest-market-news/2770651-viewpoint-sulfur-costs-to-support-amsul-prices-in-2026
- Green Markets (Bloomberg), "Sulfur," public excerpt: first-quarter Tampa molten contracts valued at $495.69/lt CFR, Mar 6, 2026. https://fertilizerpricing.com/sulfur-515/
- Global Agriculture, "Sulphur Prices Ease, but Hormuz Keeps Supply Tight," Sep 24, 2026. https://www.global-agriculture.com/global-agriculture/sulphur-prices-ease-but-hormuz-keeps-supply-tight/
- Crop Root Zone, "The Fourth-Quarter Sulfur Price Is Not Public Yet. Every $100 a Long Ton It Settles Adds $36 to a Ton of DAP — and Lands on Spring 2027, Not This Fall," Oct 1, 2026.
Disclosures
Crop Root Zone is an independent publication. Nothing here is investment advice. Market calls, where included, reflect the editors' own read and are not a recommendation to buy or sell any security.
Henry Hub's Winter Strip Is $3.37. That Puts $110 of Gas in a $494 Ton of Tampa Ammonia and $80 in a $425 Ton of Gulf Urea. Europe's Gas Costs $25.85.
At the November-to-March futures strip a US plant's cash cost is about $172 a short ton for ammonia and $166 for urea. Gulf prices could fall 61% to 65% before those plants lose cash, so no North American cost floor sits under winter fill. Europe's gas bill alone is above the market, which supports prices through import demand, not through a floor.
Henry Hub futures for November through March settled Thursday at an average of $3.37 per MMBtu, with November at $3.168 and January the high month at $3.909 (Farmbucks, data stamped Oct 9, 2026) [1]. At 32.7 MMBtu a short ton, that is $110 of gas in a ton of ammonia. The October Tampa contract is an implied $545 a tonne, or $494 a short ton [14]. Gulf urea futures for October closed at $425.25 a short ton (Farmbucks, data stamped Oct 8, 2026) [12], and a ton of urea carries about $80 of gas. The assignment for this piece was to find the cost floor under winter and spring fill. The numbers say there is none within reach. A US plant's cash cost is about a third of the selling price, and the European plants that set the top of the cost curve a year ago are now paying more for gas than a ton of nitrogen sells for.
1. The gas in a ton of nitrogen
What's new: The winter strip is $3.37. That is 13 cents above Thursday's spot price and $1.12 below what Henry Hub actually averaged last winter.
Evidence: Thursday's settlements were November $3.168, December $3.495, January $3.909, February $3.522 and March $2.759 [1]. The simple average is $3.371. Henry Hub spot was $3.24 on October 8 (EIA, Oct 9, 2026) [2]. A year ago the November contract was $3.333 and spot was $3.33 (EIA, Oct 9, 2025) [3]. We could not retrieve the November-to-March strip as it stood in October 2025, so the year-ago comparison below uses the front month in both years. What the last winter delivered is known: monthly spot averages of $3.79, $4.26, $7.72, $3.62 and $3.04 from November through March, a five-month average of $4.49 (EIA, Oct 7, 2026) [4].
The conversion factors are Yara's, sourced by Yara to Blue Johnson & Associates: 36 MMBtu of gas per metric tonne of ammonia, 0.58 tonnes of ammonia per tonne of urea, and a further 5.2 MMBtu of process gas per tonne of urea (Yara, accessed Oct 9, 2026) [6]. Divided by 1.10231, that is 32.66 MMBtu per short ton of ammonia and 23.66 per short ton of urea.
| Gas price case | $/MMBtu | Gas in ammonia, $/st | Gas in urea, $/st |
|---|---|---|---|
| Henry Hub spot, Oct 8, 2026 | 3.24 | 105.81 | 76.66 |
| November 2026 futures | 3.168 | 103.46 | 74.95 |
| Winter strip, Nov 2026 to Mar 2027 | 3.371 | 110.08 | 79.75 |
| January 2027 futures, the high month | 3.909 | 127.66 | 92.48 |
| November 2025 futures on Oct 8, 2025 | 3.333 | 108.85 | 78.86 |
| Last winter as delivered, Nov 2025 to Mar 2026 | 4.486 | 146.51 | 106.14 |
| January 2026 spot average | 7.72 | 252.13 | 182.65 |
Source: Farmbucks futures chain, data stamped Oct 9, 2026 (Oct 8 settlements, taken as the displayed price less the displayed change); EIA daily prices, Oct 9, 2026; EIA Natural Gas Weekly Update, Oct 9, 2025; EIA Henry Hub monthly spot series, released Oct 7, 2026. Gas per ton is a Crop Root Zone calculation at 32.66 and 23.66 MMBtu per short ton (Yara). Basis: Henry Hub, before pipeline basis and transport to the plant.
Each $1 move in Henry Hub is $32.66 on a ton of ammonia and $23.66 on a ton of urea. That is 2.0 cents and 2.6 cents a pound of nitrogen. If the strip is right, a plant's gas bill this winter runs $36 a ton of ammonia below last winter's.
The Energy Information Administration expects no drama. Its October outlook has Henry Hub averaging $3.16 in 2027, 9% below 2026, on inventories that stay above average (EIA, Oct 6, 2026) [5]. Our September 29 piece quoted the September outlook at $3.28 for 2027 [23]; the agency has since cut it.
2. The margin, and how it compares with a year ago
What's new: Cash margins are about $329 a short ton on Tampa ammonia and $264 on Gulf urea at the front-month gas price. A year ago they were about $364 and $218. Ammonia's margin narrowed and urea's widened, and gas explains almost none of either move.
Evidence: Gas is not the whole cash cost. We add a non-gas cash cost of $62 a short ton for ammonia and $86 for urea, both estimates, built as follows. Argus put US Gulf Coast ammonia production cost at about $175 a tonne on September 29 (Argus Media, Sep 29, 2026) [7]. September Henry Hub averaged $2.95 [4]. Taking out 36 MMBtu at $2.95 leaves $68.80 a tonne, or $62 a short ton. For urea we use CF Industries' first-half results: cost of sales of $240 a ton, less $59 of depreciation and amortization, less 23.66 MMBtu at the company's realized $4.01 gas cost, leaves $86 (CF Industries, Aug 5, 2026) [8]. That figure includes distribution cost and so overstates the cost at the plant gate. For a full-cost line we add CF's reported depreciation of $61 a ton of ammonia and $59 a ton of urea [8].
Selling prices are the October Tampa contract at an implied $545 a tonne CFR, down $10 from September's $555 (Quantum Commodity Intelligence, accessed Sep 29, 2026; Fertilizer Daily, Sep 10, 2026) [14][15], against $590 for October 2025 (Profercy, Sep 30, 2025) [16]. Urea is the front-month Gulf futures close: $425.25 on October 8, 2026 [12] and $382.75 on October 8, 2025 (Yahoo Finance, CME front-month series) [13]. Thursday's piece used $424.75, the October 7 reading [23]; the board added 50 cents the next day.
| $/short ton | Ammonia, Oct 2025 | Ammonia, Oct 2026 | Change | Urea, Oct 2025 | Urea, Oct 2026 | Change |
|---|---|---|---|---|---|---|
| Price | 535.24 | 494.42 | −40.82 | 382.75 | 425.25 | +42.50 |
| Gas at front-month Henry Hub | 108.85 | 103.46 | −5.39 | 78.86 | 74.95 | −3.91 |
| Non-gas cash cost | 62.00* | 62.00* | 0.00 | 86.00* | 86.00* | 0.00 |
| Cash margin | 364.39* | 328.96* | −35.43 | 217.89* | 264.30* | +46.41 |
| Price, cents per lb N | 32.6 | 30.1 | −2.5 | 41.6 | 46.2 | +4.6 |
Source: prices as cited in the text; Tampa converted at 1.10231 short tons per tonne. Basis: ammonia CFR Tampa contract, urea FOB US Gulf front-month futures, gas at the November contract on Oct 8 of each year. *Crop Root Zone estimates: non-gas cash cost derived from Argus Media, Sep 29, 2026, and CF Industries, Aug 5, 2026, and held flat across both years; margins follow from it. Tampa is a delivered import price, not any producer's netback, and an inland plant nets more. Nitrogen at 1,640 lb per ton of ammonia and 920 lb per ton of urea.
Gas moved the margin by $4 to $5 a ton. Price moved it by $41 and $43, in opposite directions.
The split shows up in the upgrade. A ton of urea takes 0.58 tons of ammonia and 4.7 MMBtu of process gas. At Tampa value and the winter strip that is $303 of inputs in a $425 ton, leaving about $123 before other costs. A year ago the same sum left $57. Ammonia made in a plant that can also make urea is worth more as urea than it was last October. That fits what is on the supply side: two new Texas plants that make ammonia only [23], and a Middle East urea shortfall that CF's management put at 4.0 to 4.5 million tonnes against about 1 million tonnes of ammonia [8].
Inland prices sit far above either benchmark. Illinois distributors asked $835 to $1,050 a ton for anhydrous, averaging $945 f.o.b., in the week ending October 2 (USDA AMS, Oct 2, 2026) [17]. DTN's national retail average was $979, against $813 a year earlier (DTN/Progressive Farmer, Oct 7, 2026) [18]. Retail anhydrous is up 20% in a year in which the Tampa contract fell 8%. Those prices carry terminals, freight and dealer margin, and we do not treat them as producer netbacks. We could not find a public Gulf ammonia barge price or a Corn Belt terminal price for this week.
3. How far the Gulf could fall before a US plant feels it
What's new: At the winter strip, cash cost is about $172 a short ton for ammonia and $166 for urea. Tampa would have to fall 65% and Gulf urea 61% to reach those levels.
Evidence:
| $/short ton, gas at the $3.371 winter strip | Ammonia | Urea |
|---|---|---|
| Current price | 494.42 | 425.25 |
| Gas | 110.08 | 79.75 |
| Cash cost, gas plus non-gas | 172.08* | 165.75* |
| Full cost, adding depreciation | 233.08* | 224.75* |
| Fall to reach cash cost | 322.34* | 259.50* |
| Fall to reach cash cost, % | 65%* | 61%* |
| Fall to reach full cost, % | 53%* | 47%* |
| Henry Hub at which cash margin is zero, $/MMBtu | 13.24* | 14.34* |
Source: Crop Root Zone calculation from the prices, factors and cost estimates above. *Estimates. Depreciation of $61 and $59 a ton is CF Industries' reported first-half 2026 figure for its ammonia and granular urea segments (Aug 5, 2026), used here as a stand-in for the industry.
$13.24 per MMBtu
The Henry Hub price at which a US ammonia plant's cash margin on a $545 Tampa ton reaches zero, by our estimate. The winter strip is $3.37. January 2026 averaged $7.72. (Crop Root Zone calculation from Yara, accessed Oct 9, 2026; Argus Media, Sep 29, 2026; EIA, Oct 7, 2026)
Last January is the stress test. Henry Hub averaged $7.72 for the month [4]. At that gas price our cash cost is $314 for ammonia and $269 for urea, still below today's prices for both. Gas is 22% of the Tampa price and 19% of the urea price at the strip. No plausible winter in the gas market turns a US nitrogen plant into the high-cost producer.
Ground Truth: A buyer waiting for a cost floor to appear under fill prices is waiting for something that is $260 to $320 a ton away. That works in both directions. No gas rally this winter gives a producer a cost reason to raise a fill price: a $1 jump in Henry Hub is two to two and a half cents a pound of nitrogen. And no North American plant will slow down to defend a price, because every ton it makes at $425 or $494 pays. If the world price cracks, the domestic industry can follow it down a long way and keep running. Treat any fill offer justified by "higher winter gas" as a price the seller wants, not a cost the seller has.
4. Where the marginal tonne sits now
What's new: A year ago Europe's gas cost sat under the ammonia price. Today it is far over it. European plants are no longer the marginal sellers that hold the market up from below. They are buyers.
Evidence: The front-month TTF contract closed at €78.85 per MWh on October 8, against €32.70 a year earlier (Yahoo Finance, ICE Endex front-month series) [9]. Trading Economics showed €79.49 on Friday, up 147% on the year, and tied recent moves to the conflict with Iran (Trading Economics, Oct 9, 2026) [10]. At the European Central Bank's reference rates of $1.1186 and $1.1627 [11] and 3.412 MMBtu per MWh, that is $25.85 per MMBtu now and $11.14 a year ago. The gap to Henry Hub has gone from $7.81 to $22.68.
| Gas in a metric tonne of ammonia, at 36 MMBtu | Oct 8, 2025 | Oct 8, 2026 |
|---|---|---|
| Europe, at front-month TTF, $/t | 401* | 931* |
| United States, at front-month Henry Hub, $/t | 120* | 114* |
| European disadvantage, $/t | 281* | 817* |
| Tampa contract for October, $/t CFR | 590 | 545 |
| Tampa less Europe's gas bill, $/t | +189* | −386* |
Source: TTF and Henry Hub as cited in the text; Tampa from Profercy, Sep 30, 2025, and Quantum Commodity Intelligence, accessed Sep 29, 2026. *Crop Root Zone calculation. Gas only, with no other operating cost, carbon cost or freight.
Argus reached the same place on September 29. It put European baseline production cost near $970 a tonne, delivered ammonia into northwest Europe at about $675 CFR, and said some producers had cut run rates while others were weighing it (Argus Media, Sep 29, 2026) [7]. Our gas-only figure of $931 plus a modest operating cost lands on its number.
So the ladder for urea, in short tons, looks like this.
| Urea cost or price | $/st | |
|---|---|---|
| Europe, gas only, at TTF | 612* | ██████████ |
| Gulf futures, October | 425 | ███████░░░ |
| China, gas-based, factory cost | 268* | ████░░░░░░ |
| China, fixed-bed coal, factory cost | 259* | ████░░░░░░ |
| United States, full cost at the winter strip | 225* | ████░░░░░░ |
| China, coal-water slurry, factory cost | 207* | ███░░░░░░░ |
| United States, cash cost at the winter strip | 166* | ███░░░░░░░ |
Source: Farmbucks, data stamped Oct 8, 2026 (Gulf futures). *Crop Root Zone estimates. Europe is 26.08 MMBtu per tonne at $25.85, converted to short tons. China is SunSirs' total production cost by process as of Dec 26, 2025 (1,978, 1,917 and 1,526 yuan a tonne), converted at 6.70 yuan per dollar from European Central Bank reference rates of Oct 8, 2026, and to short tons; those costs are nine months old and exclude export charges and freight. Bars scale to $612 at ten blocks.
Between the Gulf price and the next cost-based number below it there is a gap of about $160 a ton. Chinese plants, costed by SunSirs at 1,526 to 1,978 yuan a tonne depending on process (SunSirs, Jan 14, 2026) [19], are the nearest thing to a floor, and they reach the world market only as far as Beijing's export quotas allow. The lowest offers in India's tender this week were $352.10 a tonne delivered (Bloomberg, Oct 8, 2026) [20], against Chinese prilled urea near $380 FOB two weeks earlier (Profercy, Sep 23, 2026) [21]. Thursday's piece worked through that tender [23]. One more public signal arrived Friday: a Quantum headline reported that the US became a net exporter of urea in August (Quantum Commodity Intelligence, Oct 9, 2026) [22]. We could read only the headline. If it holds, the Gulf is pricing at times off what an export ton fetches, which is a lower anchor than the cost of importing one.
5. What it means for winter and spring fill
What's new: The cost curve gives a ceiling story and a support story, and no floor.
Evidence: The support is real. Every European plant that cuts output at $25.85 gas becomes a buyer of imported ammonia at about $675 a tonne, $130 over Tampa [7]. That demand, plus the lost Middle East tonnes [8], is why a product that costs $172 to make sells for $494. But support from demand can be withdrawn by events. A cost floor cannot, and the cost floors are at $166 to $270.
Ground Truth: Winter fill will be priced by three things outside North America and one inside it. Outside: whether Gulf shipping normalizes, how many tonnes China lets out, and whether TTF stays high enough to keep Europe importing. Inside: the November Tampa settlement, due in about three weeks. The Henry Hub strip is not on the list. A buyer should size fill purchases on those four, and should assume the downside is open-ended in a way it was not a year ago, when, by our estimate, a Tampa price under about $450 would have started closing European plants and tightening supply. That brake is gone because those plants are already uneconomic. The ammonia side is the more exposed of the two: its margin has narrowed, new Gulf capacity makes only ammonia, and its buyer of last resort is a European industry that will switch back to its own plants the week TTF breaks. We would stage ammonia fill and not chase it.
What to watch:
- The November Tampa settlement. A second cut says the import pull from Europe is not enough to hold $545.
- TTF against $15 per MMBtu. At 36 MMBtu a tonne, European gas cost equals today's Tampa price at about $15, or roughly €46 per MWh at today's exchange rate. That is our calculation. Above it Europe imports. Below it Europe competes.
- Producer fill programs. With cash cost near $170, a fill price is a statement about expected demand. A program priced well under the Gulf board would be the first sign producers see the same downside.
- Chinese export quotas. They decide whether the $207 to $268 cost band has any bearing on the price outside China.
- Henry Hub, last. A cold January moved gas to $7.72 last winter and did not threaten a US margin.
Two limits on this analysis. The non-gas costs are estimates from two public sources, and a plant with higher fixed cost or a poor gas basis will sit above them. And Tampa and the Gulf urea board are benchmarks. Neither is the price a Corn Belt buyer pays, as the $945 Illinois ask shows.
References
- Farmbucks, "Natural Gas (Henry Hub) Futures" contract chain, data stamped Oct 9, 2026, 8:03 a.m. Central; Oct 8 settlements taken as displayed price less displayed change. https://farmbucks.com/futures/energy/natural-gas
- U.S. Energy Information Administration, Today in Energy, daily prices, Oct 9, 2026 (Henry Hub spot for Oct 8, 2026). https://www.eia.gov/todayinenergy/prices.php
- U.S. Energy Information Administration, Natural Gas Weekly Update, for week ending Oct 8, 2025, released Oct 9, 2025. https://www.eia.gov/naturalgas/weekly/archivenew_ngwu/2025/10_09/
- U.S. Energy Information Administration, Henry Hub Natural Gas Spot Price, monthly, released Oct 7, 2026. https://www.eia.gov/dnav/ng/hist/rngwhhdm.htm
- U.S. Energy Information Administration, Short-Term Energy Outlook, Oct 6, 2026. https://www.eia.gov/outlooks/steo/
- Yara International, "Ammonia cash cost build-up" and urea cash cost calculator, factors sourced to Blue Johnson & Associates, accessed Oct 9, 2026. https://www.yara.com/investor-relations/analyst-information/calculators/ammonia-and-urea-cash-cost
- Argus Media, "Europe's ammonia market hit by rising gas prices," Sep 29, 2026. https://www.argusmedia.com/en/news-and-insights/market-opinion-and-analysis-blog/europe-ammonia-market-rising-gas-prices
- CF Industries Holdings, second quarter and first half 2026 results, Form 8-K exhibit 99.1, Aug 5, 2026. https://www.sec.gov/Archives/edgar/data/0001324404/000132440426000017/cf-08052026_ex991xearnings.htm
- Yahoo Finance, Dutch TTF Natural Gas front-month futures, daily closes for Oct 8, 2025 and Oct 8, 2026, accessed Oct 9, 2026. https://finance.yahoo.com/quote/TTF=F/history/
- Trading Economics, EU Natural Gas (TTF), Oct 9, 2026. https://tradingeconomics.com/commodity/eu-natural-gas
- European Central Bank, euro foreign exchange reference rates, Oct 8, 2025 and Oct 8, 2026 (US dollar and Chinese yuan). https://www.ecb.europa.eu/stats/policy_and_exchange_rates/euro_reference_exchange_rates/html/index.en.html
- Farmbucks, "Urea (US Gulf) Futures" contract chain, data stamped Oct 8, 2026, 3:19 p.m. Central. https://farmbucks.com/futures/fertilizer/urea-us-gulf
- Yahoo Finance, Urea (Granular) FOB US Gulf front-month futures, daily close for Oct 8, 2025, accessed Oct 9, 2026. https://finance.yahoo.com/quote/UFV=F/history/
- Quantum Commodity Intelligence, "Tampa ammonia falls $10/mt for October," accessed Sep 29, 2026 (headline and summary). https://www.qcintel.com/ammonia/article/tampa-ammonia-falls-10-mt-for-october-74032.html
- Fertilizer Daily, "Tampa ammonia price drops to $555/t in September," Sep 10, 2026. https://www.fertilizerdaily.com/20260910-tampa-ammonia-price-555-september-2026-fourth-monthly-decline/
- Profercy, "International ammonia prices maintain upward march on capacity constraints," Sep 30, 2025. https://www.profercy.com/insights/international-ammonia-prices-maintain-upward-march-on-capacity-constraints
- USDA AMS, Illinois Production Cost Report (Bi-weekly), week ending Oct 2, 2026. https://www.ams.usda.gov/mnreports/ams_3195.pdf
- DTN/Progressive Farmer, "UAN32 Leads Fertilizer Prices Higher," Oct 7, 2026 (retail survey Sep 28–Oct 2, 2026, with year-earlier row). https://www.dtnpf.com/agriculture/web/ag/crops/article/2026/10/07/uan32-leads-fertilizer-prices-higher
- SunSirs, "Urea Market to Remain Range-Bound in 2026 Amid Persistent Supply Oversupply," Jan 14, 2026 (production cost by process as of Dec 26, 2025). https://www.sunsirs.com/uk/detail_news-29688.html
- Bloomberg, "India Urea Offers Fall in Sign of Easing Global Fertilizer Costs," Oct 8, 2026 (headline and public summary). https://www.bloomberg.com/news/articles/2026-10-08/india-urea-offers-fall-in-sign-of-easing-global-fertilizer-costs
- Profercy, "Urea: Chinese prilled availability to be tested as India returns with fresh tender," Sep 23, 2026 (public insight summary). https://www.profercy.com/insights/urea-chinese-prilled-availability-to-be-tested-as-india-returns-with-fresh-tender
- Quantum Commodity Intelligence, "US shifts to net-exporter of urea in August," Oct 9, 2026 (headline only; full text not read). https://www.qcintel.com/ammonia/
- Crop Root Zone, "The Tampa Ammonia Contract Fell $10 for October. In the Last Two Falls It Rose $30 and $50, and Retail Anhydrous Followed It Up," Sep 29, 2026 (Texas ammonia plants, September outlook for Henry Hub); "India's Lowest Urea Offers Came In at $352.10 East and $356.25 West, Nearly 10% Under August," Oct 8, 2026 (India tender, Oct 7 Gulf urea reading).
Disclosures
Crop Root Zone is an independent publication. Nothing here is investment advice. Market calls, where included, reflect the editors' own read and are not a recommendation to buy or sell any security.
India's Lowest Urea Offers Came In at $352.10 East and $356.25 West, Nearly 10% Under August. No Offer on Either Coast Reached Our $475 Threshold. The Gulf Barge Fell to $424.75 and Retail Rose to $683.
Bloomberg's offer ranges are the only public result from Indian Potash's October 7 tender; volumes, sellers and counter-bids are not out. We test Tuesday's thresholds against them, correct our $390 floor, and show retail urea now sits $258 over a barge that has dropped $10 since Tuesday.
India's urea tender produced a price on Wednesday, and it was lower than anyone had said in public beforehand. Indian Potash Limited (IPL) received offers for the east coast between $352.10 and $465 a ton and for the west coast between $356.25 and $416.50, and the low end is nearly 10% under what India paid in August (Bloomberg, Oct 8, 2026) [1]. That is everything about the result we could verify. The total tonnage offered, the names behind the lowest offers, the grade of urea in them and the state of any counter-bid were not in any open source we could reach by Thursday morning. On Tuesday this desk published thresholds for reading the result and relayed an expectation that the lowest offer would be no cheaper than August's $390 [14]. That floor was wrong by $38 a tonne. The thresholds can be tested against a price range and nothing more, and we do that below. The US side has moved too. The October Gulf urea contract fell $10 from Tuesday's reading to $424.75 a short ton (Farmbucks, data stamped Oct 7, 2026) [8], and DTN's retail average rose $8 to $683 (DTN/Progressive Farmer, Oct 7, 2026) [9].
1. What is public from the tender, and what is not
What's new: One wire report gives the offer range on each coast. Nothing else is public.
Evidence: The tender sought 1.7 million tonnes, 1.0 million for the west coast and 0.7 million for the east, prilled or granular, with bids due October 7, offers valid to 8 p.m. on October 15 and sailing by December 1 (Fertilizer Daily, Sep 29, 2026; Rural Voice, Sep 26, 2026) [2][3]. Bloomberg's report says "a ton." Indian tenders are quoted in metric tonnes on a cost-and-freight basis [2][3], and we read the figures that way.
| Coast | August lowest, $/t CFR | October lowest, $/t CFR | Change, $/t | Change | October highest, $/t CFR | October lowest, $/st* |
|---|---|---|---|---|---|---|
| East | 390.25 | 352.10 | −38.15 | −9.8% | 465.00 | 319 |
| West | 393.65 | 356.25 | −37.40 | −9.5% | 416.50 | 323 |
Source: Bloomberg, Oct 8, 2026 (October range); Profercy, Aug 13, 2026 (August lowest offers). Basis: $/metric tonne CFR Indian ports. *Changes and short-ton values are Crop Root Zone calculations at 1.10231 short tons per tonne; the short-ton column is a unit conversion only, with no freight adjustment.
Our own arithmetic matches Bloomberg's "nearly 10%." August's lowest offers were both from one trading firm, at $390.25 east and $393.65 west (Profercy, Aug 13, 2026) [4].
The list of what we could not find is longer than the list of what we found.
| Item | Status on Oct 8 | Why it matters |
|---|---|---|
| Lowest and highest offer by coast | Public [1] | Sets the counter-bid level |
| Total tonnes offered | Not public | Shows whether India can fill 1.7 Mt |
| Tonnes offered near the low | Not public | In August, 1.336 Mt was offered under $400 [4] |
| Names of the low sellers | Not public | Identifies origin |
| Prilled or granular | Not public | Decides whether the price says anything about the US market |
| Counter-bid | Not public | Offers are valid to Oct 15 [2] |
| Booked volume | Not possible yet | The actual result |
Source: Crop Root Zone search of open pages at Bloomberg, Profercy, Argus Media, Fertilizer Daily, Rural Voice and others, Oct 8, 2026. The full Bloomberg article returned an access error to us; we rely on its headline and public summary.
Profercy's public page had no post-tender note when we checked; its latest was dated October 6 [7]. Argus's open news pages showed nothing on this tender. Fertilizer Daily's most recent tender item was still the September 29 preview [2].
The procedure from here is known from the last time IPL ran a tender. In November 2025 IPL sought 2.5 million tonnes, the lowest offers were $418.40 east and $419.90 west, both from one trading firm for 40,000 and 45,000 tonnes (Argus Media, Nov 20, 2025) [11]. IPL then countered every other seller at those prices and confirmed 1,560,150 tonnes eight days later (Argus Media, Nov 28, 2025) [12]. A lowest offer is often a small parcel. The number that decides the market is how many tonnes agree to match it.
2. Tuesday's thresholds against the range, and one correction
What's new: No offer on either coast reached $475. The floor we relayed, $390, was $38 too high. The conversion itself is arithmetic and the tender neither confirms nor refutes it.
Evidence: Tuesday's piece converted a west coast granular price into a Gulf barge by subtracting an estimated $25 a tonne of freight to reach a Middle East netback, adding an estimated $30 to reach the US Gulf, and dividing by 1.10231 [14]. On that basis $475 CFR equalled the $434.75 barge, and $490 equalled a Middle East producer holding $465 FOB. Both freights were our estimates and remain so.
Here is each statement from that piece against what printed.
| Tuesday's statement [14] | What printed | Verdict |
|---|---|---|
| Lowest offer "no cheaper than August's $390," relayed from Profercy's pre-tender note | $352.10 east, $356.25 west [1] | Wrong by about $38/t |
| Our table's lowest row was $390 | Low is under the table | Table floor too high; corrected below |
| Granular at $490 or more would show producers holding $465 FOB | Highest offer anywhere is $465, east coast [1] | Did not happen |
| Granular near $475 would match the barge | Highest west coast offer is $416.50 [1] | Did not happen |
| Granular under $460 would put replacement cost under the barge | Every west coast offer is under $460; grade unknown | Cannot be tested until the offer list is public |
| $475 CFR equals a $434.75 barge | Barge is now $424.75 [8] | Arithmetic; equivalent is now about $463* |
| The headline low will be a prill price | Grade and origin not reported | Unverified |
Source: Crop Root Zone. *$424.75 × 1.10231 = $468 a tonne, less the net $5 of freight estimates from our Oct 6 piece.
The correction first. We wrote that the lowest offer would "almost certainly" be Chinese prilled urea "no cheaper than August's $390," citing Profercy's October 2 note that prevailing Chinese quotes suggested offers "may be no better" than August's (Profercy, Oct 2, 2026) [6]. We presented a third party's expectation with our own adverb attached, and built a table whose lowest row was $390. The result is $352.10. The table should have run lower, and the two rows that follow extend it on the same method.
| India price, $/t CFR | What it is | Gulf barge equivalent, $/st* | vs. $424.75 barge, $/st |
|---|---|---|---|
| 352.10 | Lowest offer, east | 324 | −101 |
| 356.25 | Lowest offer, west | 328 | −97 |
| 416.50 | Highest offer, west | 382 | −43 |
| 465.00 | Highest offer, east | 426 | +1 |
Source: Crop Root Zone calculation from Bloomberg, Oct 8, 2026, and Farmbucks, data stamped Oct 7, 2026. *Estimated: India price plus a net $5/t (our $30 US Gulf freight estimate less our $25 west coast India freight estimate), divided by 1.10231. The freight estimates were built for the west coast; applying them to east coast offers overstates the equivalent by whatever the east coast freight premium is, which we could not source. Rows are conversions, not forecasts.
The top and bottom rows carry the two findings. The single highest offer in the tender, converted with freight estimates that flatter it, lands at about the barge. Every other offer is below it. The lowest offers convert to $324 to $328 a short ton, and as we said on Tuesday that figure is not a route by which the barge gets there [14]. If the low offers are Chinese prills, as Profercy expected [6], they describe a product the US does not buy.
The inference we can draw from the low is about China. Profercy put Chinese prilled urea at roughly $380 a tonne FOB on September 23 (Profercy, Sep 23, 2026) [5]. A delivered India price of $352 to $356 nets the seller less than that before any ocean freight is paid. Either the prill price has fallen at least $25 to $30 a tonne in two weeks, which a fourth round of export quotas above 1.5 million tonnes would explain [6], or a trader has sold short and expects to cover lower. Both readings point down for prills. Neither is confirmed.
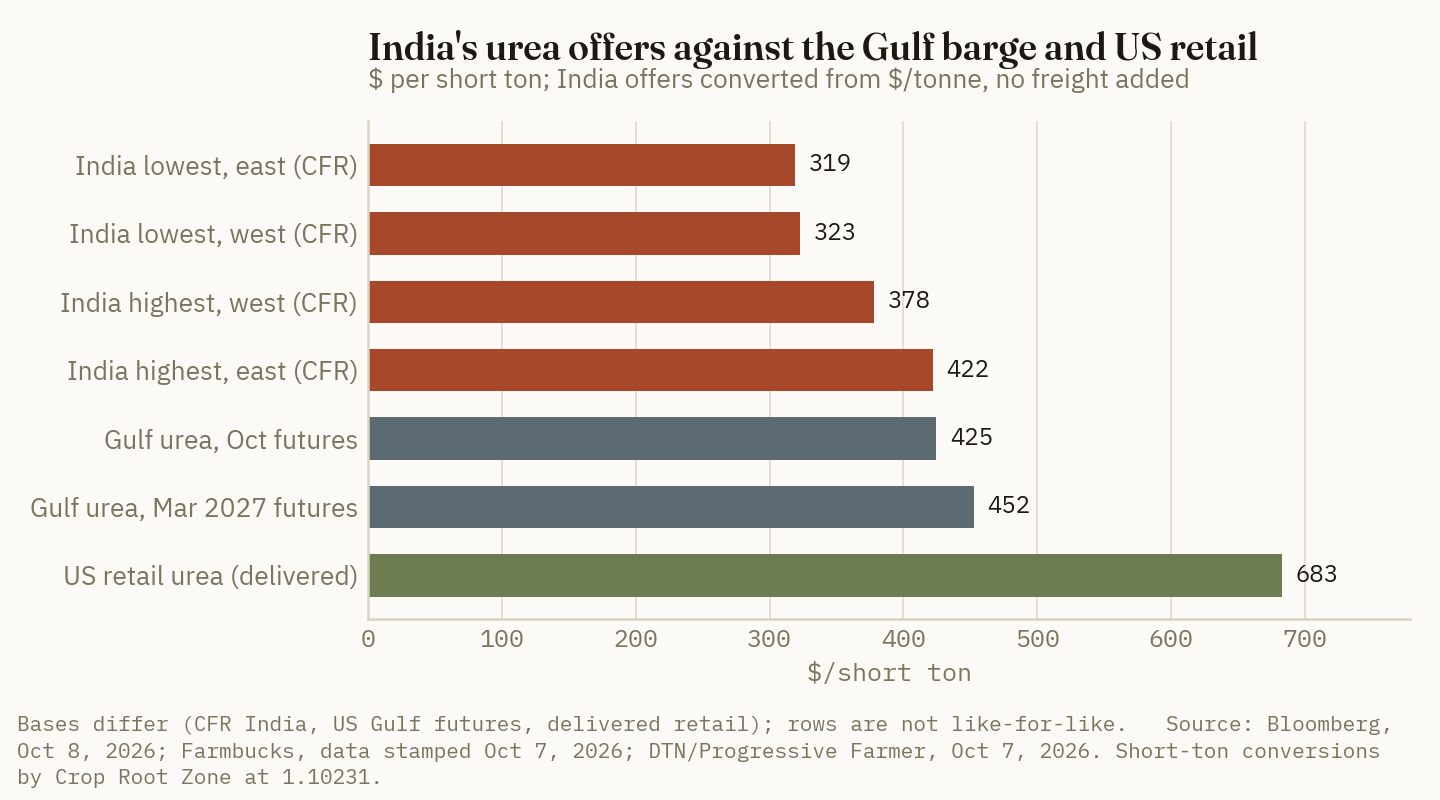
3. The Gulf fell the same day
What's new: Every Gulf urea contract through February was lower on the day the bids opened. November fell most.
Evidence: Farmbucks showed the October contract at $424.75 a short ton, down $8.00 on the day, with November at $422.00, down $13.00 (Farmbucks, data stamped Oct 7, 2026, accessed Oct 8) [8].
| Contract month | Our Oct 6 reading, $/st | Oct 7, $/st | Change from reading | Change shown on the day |
|---|---|---|---|---|
| October 2026 | 434.75 | 424.75 | −10.00 | −8.00 |
| November 2026 | 440.00 | 422.00 | −18.00 | −13.00 |
| December 2026 | 439.00 | 430.00 | −9.00 | −5.00 |
| January 2027 | — | 435.00 | — | −3.00 |
| February 2027 | — | 442.50 | — | −2.50 |
| March 2027 | 462.50 | 452.50 | −10.00 | 0.00 |
| April 2027 | — | 447.50 | — | 0.00 |
Source: Farmbucks contract chain, data stamped Oct 7, 2026, accessed Oct 8; Oct 6 readings as printed in our Oct 6 piece. Basis: US Gulf urea futures, $/short ton. The two change columns disagree because our Oct 6 readings were taken during the session and the day change is measured from the prior settlement. March shows no change on the day but is $10 under our reading; we cannot tell from the page whether March settled lower late on Oct 6 or did not trade on Oct 7.
Two cautions. The futures fell on the day of the tender, and we have no source that says the tender is why. And the barge was already sliding: Profercy had it in the $430s in the middle of last week against vessel business at $500 a tonne CFR [6].
The gap to replacement has widened on paper. Tuesday's piece put a Middle East cargo at $449 a short ton landed in the Gulf, from $465 FOB on September 25 plus our $30 freight estimate [14]. The barge is now about $24 under that figure, up from $14. We could not find a Middle East FOB price dated this week, so the $465 is two weeks old and the $24 should be read as a stale comparison. A top offer of $465 delivered to east coast India suggests that some seller's netback is well under $465 FOB, though the origin of that offer is not public either.
What has not changed is the supply picture outside China. Brazil needs more than 4 million tonnes in the fourth quarter, and the Middle East, normally 37% of Brazil's fourth-quarter arrivals, remains disrupted (Profercy, Oct 6, 2026) [7]. Nutrien made its Trinidad shutdown indefinite on October 5; the site produced about 55,000 tonnes of urea a month and has been offline since October 23, 2025, so the announcement removes a hope of supply and no current tonnes (Fertilizer Daily, Oct 8, 2026) [13]. Non-Chinese granular sellers were unwilling to quote Brazil under $490 to $500 CFR last week [6]. Those sellers have not been shown to have cut a price. All the tender has shown is that they did not offer India one above $465.
4. Retail went the other way
What's new: DTN's retail urea average rose to $683 a ton in the week the barge lost ground. The spread between the two is the widest this desk has measured.
Evidence: For September 28 to October 2, DTN's survey put urea at $683, up from $675 a week earlier and $655 a month earlier, and 12% above a year ago [9][10]. Against the $424.75 October contract, that is $258.25.
$258 a short ton
Retail urea at $683 less the October Gulf contract at $424.75. Three spring readings this year ran $136 to $167. (Crop Root Zone calculation from DTN/Progressive Farmer, Oct 7, 2026, and Farmbucks, data stamped Oct 7, 2026)
| Retail urea less Gulf barge | $/st | |
|---|---|---|
| Spring 2026, low reading | 136 | █████░░░░░ |
| Spring 2026, high reading | 167 | ██████░░░░ |
| Sep 21–25 retail vs. prompt barge | 222.50 | █████████░ |
| Sep 21–25 retail vs. Oct 6 futures reading | 240 | █████████░ |
| Sep 28–Oct 2 retail vs. Oct 7 futures | 258 | ██████████ |
Source: Crop Root Zone calculation. Retail from DTN/Progressive Farmer, Sep 30 and Oct 7, 2026; futures from Farmbucks; spring readings and the $222.50 figure from our Oct 5 and Oct 6 pieces. Basis: delivered retail $/ton less US Gulf barge or futures $/short ton. Bars scale to $258 at ten blocks. The retail survey week ends five days before the futures date, so the last row compares a lagging price with a current one.
That lag is the main caveat and it is partly the point. Retail surveys trail the barge by weeks, and the tons in a dealer's shed in October were bought when the barge was higher. Tuesday's piece found that $675 retail matched a barge of $449 to $452 [14]. By the same $222.50 spread, $683 matches a barge of about $460. The barge is $36 under that.
Nitrogen at retail, by product, is where the fall decision sits.
| Product | Retail, $/ton | Month ago, $/ton | Change | vs. year ago | $/lb N |
|---|---|---|---|---|---|
| Anhydrous | 979 | 938 | +4.4% | +20% | 0.60 |
| Urea | 683 | 655 | +4.3% | +12% | 0.74 |
| UAN32 | 483 | 455 | +6.2% | +4% | 0.75 |
| UAN28 | 430 | 423 | +1.7% | +3% | 0.77 |
Source: DTN/Progressive Farmer, Oct 7, 2026, retail survey for Sep 28–Oct 2, 2026. Basis: delivered to farm, national average, $/short ton; $/lb N as published by DTN.
Anhydrous is 14 cents a pound of nitrogen under urea. At 180 pounds an acre that is $25.20 an acre by our arithmetic, before application cost and before any difference in loss. An India tender moves neither side of that comparison this fall. Anhydrous is priced off ammonia, which the tender does not touch, and retail urea has not followed its own barge down.
5. What a Corn Belt buyer does with it
What's new: The tender removed the outcome that would have argued for buying urea now. It did not hand the buyer a lower price.
Evidence: On Tuesday the case for locking a spring urea ton rested on one outcome: Middle East granular offered into India at $490 or better and accepted [14]. No offer at that level exists [1]. The curve has also moved against the prepay. March futures are $452.50 and April $447.50 [8]. At the $136 to $167 spring spread [14], March futures imply spring retail of about $589 to $620 a ton, which is $63 to $94 under today's $683, or roughly $12 to $18 an acre at 180 pounds of nitrogen. That range is our calculation and it assumes the spread returns to its spring range, which it has not yet begun to do.
Ground Truth: The tender is being read as cheaper nitrogen, and for a US buyer it is not yet anything of the kind. What it did was close off the bullish case: no seller asked India for a price that would have made a $425 barge look cheap. The bearish case for retail urea was already in place and comes from here, in a $258 spread over a barge that has fallen for three weeks. A grower holding a $683 urea quote for spring is being asked to pay for a barge near $460, and the board says March is $452.50 and October is $424.75. The honest question for the retailer is the replacement cost of the next ton, and the answer is about $36 lower than the quote assumes. For nitrogen going on this fall the tender changes nothing: anhydrous at 60 cents a pound of N was the cheaper source before Wednesday and still is. The piece of the result that could change our mind is the counter-bid. If India books close to 1.7 million tonnes near $352, China's prill surplus has a home and granular loses nothing; if sellers refuse the counter and India books well short, another tender follows before spring and today's lows were a parcel and not a market.
The practical steps follow from what is still unknown.
- Wait for the counter-bid before treating $352 as the price. Offers are valid to October 15 [2]. In November 2025 confirmation took eight days from the offers [11][12].
- Ask which barge a urea quote is built on. Subtract $136 to $167 from a spring quote [14]. A $640 quote assumes a barge of $473 to $504. March futures are $452.50 [8].
- Price fall nitrogen on its own terms. At DTN's averages, anhydrous is 14 cents a pound of N under urea [9]. The tender does not alter that.
- Watch for the grade. If the offer list shows granular from the Middle East or North Africa under $420 CFR, the replacement cost in section 3 is wrong and lower. If it shows only Chinese prills at the low end, the granular market has learned little.
- Check the next DTN survey. A second week of retail rising against a falling barge would widen the spread again. A retail decline would be the first sign the lag is closing.
We will report the offered volume, the sellers and the booked tonnage when they are public, and we will say then whether the "under $460" row applied.
References
- Bloomberg, P. Parija, "India Urea Offers Fall in Sign of Easing Global Fertilizer Costs," Oct 8, 2026 (headline and public summary; the full article was not accessible to us). https://www.bloomberg.com/news/articles/2026-10-08/india-urea-offers-fall-in-sign-of-easing-global-fertilizer-costs
- Fertilizer Daily, K. Clarksen, "India urea tender: IPL seeks 1.7 million tonnes, pulls key shipment deadline forward to December 1," Sep 29, 2026. https://www.fertilizerdaily.com/20260929-india-urea-tender-ipl-1-7-million-tonnes-december/
- Rural Voice, "IPL Floats Tender for 17 Lakh Tonnes of Urea, Sets December 1 Shipment Deadline," Sep 26, 2026. https://eng.ruralvoice.in/national/ipl-floats-tender-for-17-lakh-tonnes-of-urea-sets-december-1-shipment-deadline.html
- Profercy, "Urea: Chinese supply sees offers into India below $400pt cfr across both coasts in latest tender," Aug 13, 2026 (public insight summary). https://www.profercy.com/insights/urea-chinese-supply-sees-urea-offers-into-india-below-400pt-cfr-across-both-coasts
- Profercy, "Urea: Chinese prilled availability to be tested as India returns with fresh tender," Sep 23, 2026 (public insight summary). https://www.profercy.com/insights/urea-chinese-prilled-availability-to-be-tested-as-india-returns-with-fresh-tender
- Profercy, "Urea price rally stalls on sluggish Brazilian demand as market awaits India's latest tender," Oct 2, 2026 (public insight summary). https://www.profercy.com/insights/urea-price-rally-stalls-on-sluggish-brazilian-demand-as-market-awaits-indias-latest-tender
- Profercy, "Brazilian demand in doubt amid difficult global nitrogen supply environment," Oct 6, 2026 (public insight summary; latest item on the insights page when checked Oct 8, 2026). https://www.profercy.com/insights/brazilian-demand-in-doubt-amid-difficult-global-nitrogen-supply-environment
- Farmbucks, "Urea (US Gulf) Futures" contract chain, data stamped Oct 7, 2026, 2:49 p.m.; accessed Oct 8, 2026. https://farmbucks.com/futures/fertilizer/urea-us-gulf
- DTN/Progressive Farmer, "UAN32 Leads Fertilizer Prices Higher," Oct 7, 2026 (retail survey Sep 28–Oct 2, 2026). https://www.dtnpf.com/agriculture/web/ag/crops/article/2026/10/07/uan32-leads-fertilizer-prices-higher
- DTN/Progressive Farmer, "Anhydrous Leads Fertilizer Prices Higher, Up 25% From a Year Ago," Sep 30, 2026 (retail survey Sep 21–25, 2026). https://www.dtnpf.com/agriculture/web/ag/crops/article/2026/09/30/anhydrous-leads-fertilizer-prices-25
- Argus Media, "Lowest urea offer at $418.40/t cfr EC to India's IPL," Nov 20, 2025. https://www.argusmedia.com/en/news-and-insights/latest-market-news/2756286-lowest-urea-offer-at-418.40-t-cfr-ec-to-india-s-ipl
- Argus Media, "India's IPL confirms 1.56mn t of urea in tender: Update," Nov 28, 2025. https://www.argusmedia.com/en/news-and-insights/latest-market-news/2759724-india-s-ipl-confirms-1.56mn-t-of-urea-in-tender-update
- Fertilizer Daily, K. Clarksen, "Nutrien Trinidad shutdown turns indefinite as gas shortage halts key 85,000 t/month ammonia site," Oct 8, 2026. https://www.fertilizerdaily.com/20261008-nutrien-trinidad-nitrogen-shutdown-indefinite/
- Crop Root Zone, "India Opens Bids for 1.7 Million Tonnes of Urea at 2 a.m. Central on Wednesday. A Granular Price Near $475 CFR Equals Today's $435 Gulf Barge. Each $10 Above or Below Is a Cent a Pound of Nitrogen," Oct 6, 2026 (thresholds, freight estimates, Middle East FOB of Sep 25, Oct 6 futures readings; corrected here); "A $675 Urea Prepay Costs $25.50 a Ton in Interest by April. The Gulf Curve Charges the Same $25.50 From October to March. Locking Wins Only if April Retail Tops $700," Oct 5, 2026 (retail-to-barge spreads).
Disclosures
Crop Root Zone is an independent publication. Nothing here is investment advice. Market calls, where included, reflect the editors' own read and are not a recommendation to buy or sell any security.
India Opens Bids for 1.7 Million Tonnes of Urea at 2 a.m. Central on Wednesday. A Granular Price Near $475 CFR Equals Today's $435 Gulf Barge. Each $10 Above or Below Is a Cent a Pound of Nitrogen.
Indian Potash Limited's tender closes October 7 and no offer is public yet. We convert any India CFR price into a Gulf barge and a retail ton: about $475 matches today's $435 barge, $490 matches Middle East replacement near $449, and Chinese prills near $390 say little about either.
India's next urea tender closes tomorrow, and nothing about its result is public as this is written. Indian Potash Limited (IPL) is seeking 1.7 million tonnes, 1.0 million for the west coast and 0.7 million for the east, with bids due at 11:30 a.m. India time on October 7 and price bids opened at 12:30 p.m. (Fertilizer Daily, Sep 29, 2026; Rural Voice, Sep 26, 2026) [1][2]. That is 2:00 a.m. Central by our conversion, so the lowest offers should be circulating before a Corn Belt retailer opens on Wednesday. Offers stay valid to 8 p.m. on October 15, and cargoes must sail by December 1, a date moved up from December 15 by amendment [1][2]. We reported the date and volume in yesterday's prepay piece [14]. This piece does the other half of the job. It converts an India price into a Gulf barge, a retail ton and a pound of nitrogen, so that the number can be read the morning it prints. We do not forecast the result.
1. What IPL asked for, and how it differs from August
What's new: The tender is the same size as the last one and has a longer shipment window. The market it lands in has split by grade: granular urea has rallied since August and prilled urea has not.
Evidence: IPL issued the tender on September 23 on behalf of India's Department of Fertilizers. It accepts prilled or granular product at 46% nitrogen minimum, on FOB or CFR terms (Fertilizer Daily, Sep 29, 2026) [1]. The previous tender, run by Rashtriya Chemicals and Fertilizers (RCF), closed on August 11 with lowest offers of $390.25 a tonne CFR on the east coast and $393.65 on the west, and 1.336 million tonnes offered below $400 (Profercy, Aug 13, 2026) [10].
| India tender | Issuer | Sought, Mt | Lowest offers, $/t CFR | Shipment by | Result |
|---|---|---|---|---|---|
| April (emergency) | IPL | 2.5 | 935–959 | — | Booked at record prices |
| June | NFL | 1.7 | 444–449 | — | Booked |
| August 11 | RCF | 1.7 | 390.25 east, 393.65 west | Sep 24 | 1.799 Mt booked, about 1.6 Mt Chinese |
| October 7 | IPL | 1.7 | not yet public | Dec 1 | Bids open Oct 7, valid to Oct 15 |
Source: Fertilizer Daily, Sep 28 and Sep 29, 2026; Profercy, Aug 13 and Sep 23, 2026. Basis: $/metric tonne CFR Indian ports, lowest offer by coast. NFL is National Fertilizers Limited.
Two corrections to our own earlier copy belong here. Our September 11 article called the RCF round the "September tender" and said China would supply "at least 1.2 million tonnes" of 1.7 million [14]. The tender closed on August 11 and shipped in September, and the 1.2 million was the floor reported on September 7 (Fertilizer Daily, Sep 7, 2026) [13]. Profercy's later count is 1.799 million tonnes booked, of which Chinese suppliers committed about 1.6 million, with the Middle East and Malaysia supplying the rest (Profercy, Sep 23, 2026) [3]. The Chinese share was closer to nine-tenths than two-thirds.
Since then the two grades have parted. Chinese granular rose from under $390 a tonne FOB in mid-August to $450–455. Chinese prilled gained about $30, to roughly $380, because most Chinese output is prilled and it has few outlets besides India [3]. Middle East granular was about $465 FOB on September 25 (Fertilizer Daily, Sep 28, 2026) [6], inside a $450–470 range reported for the same date (Advanced Turf Solutions, Sep 28, 2026) [7]. Chinese exports ran about 403,000 tonnes in July and 520,000 in August (SunSirs, accessed Oct 6, 2026) [12], and a fourth round of export quotas covering more than 1.5 million tonnes has emerged (Profercy, Oct 2, 2026) [4]. Public counts of China's total 2026 allowance range from 3.3 million tonnes [1] to 5–6 million [12]. We cannot reconcile them and do not use either.
Profercy's pre-tender read is the only public price idea we found. Prevailing Chinese quotes "suggest that offers may be no better than those seen in the 11 August tender," Chinese prills are expected to lead on price, and few commitments are expected from other origins [4]. No offer level for October 7 has been published.
2. The Gulf barge is already below Middle East replacement
What's new: The barge fell again last week. At about $435 a short ton it is priced under what a Middle East cargo at current FOB values would cost to land, and under what Brazil is paying.
Evidence: NOLA barges traded at $450–455 a short ton on September 25, down from $458–478 a week earlier [7]. Profercy reported barge values in the $430s by the middle of last week and said the Gulf "has been unwilling to compete for tonnes" against vessel business concluded at $500 a tonne CFR [4], a level Profercy separately gives for Brazil in mid to late September (Profercy, Oct 6, 2026) [5]. The October futures contract showed $434.75 when we checked on October 6, with November at $440.00, December at $439.00 and March 2027 at $462.50 (Farmbucks, accessed Oct 6, 2026) [8]. That is $2.25 to $8.00 lower on the nearby months than the October 2 settlements in yesterday's piece [14].
In Brazil, Chinese granular has been offered at or below $470 CFR, and suppliers of other origins have been unwilling to quote under $490–500 [4]. Brazil needs more than 4 million tonnes in the fourth quarter and has been slow to buy (Profercy, Oct 6, 2026) [5].
Put every marker in short tons and the order is plain.
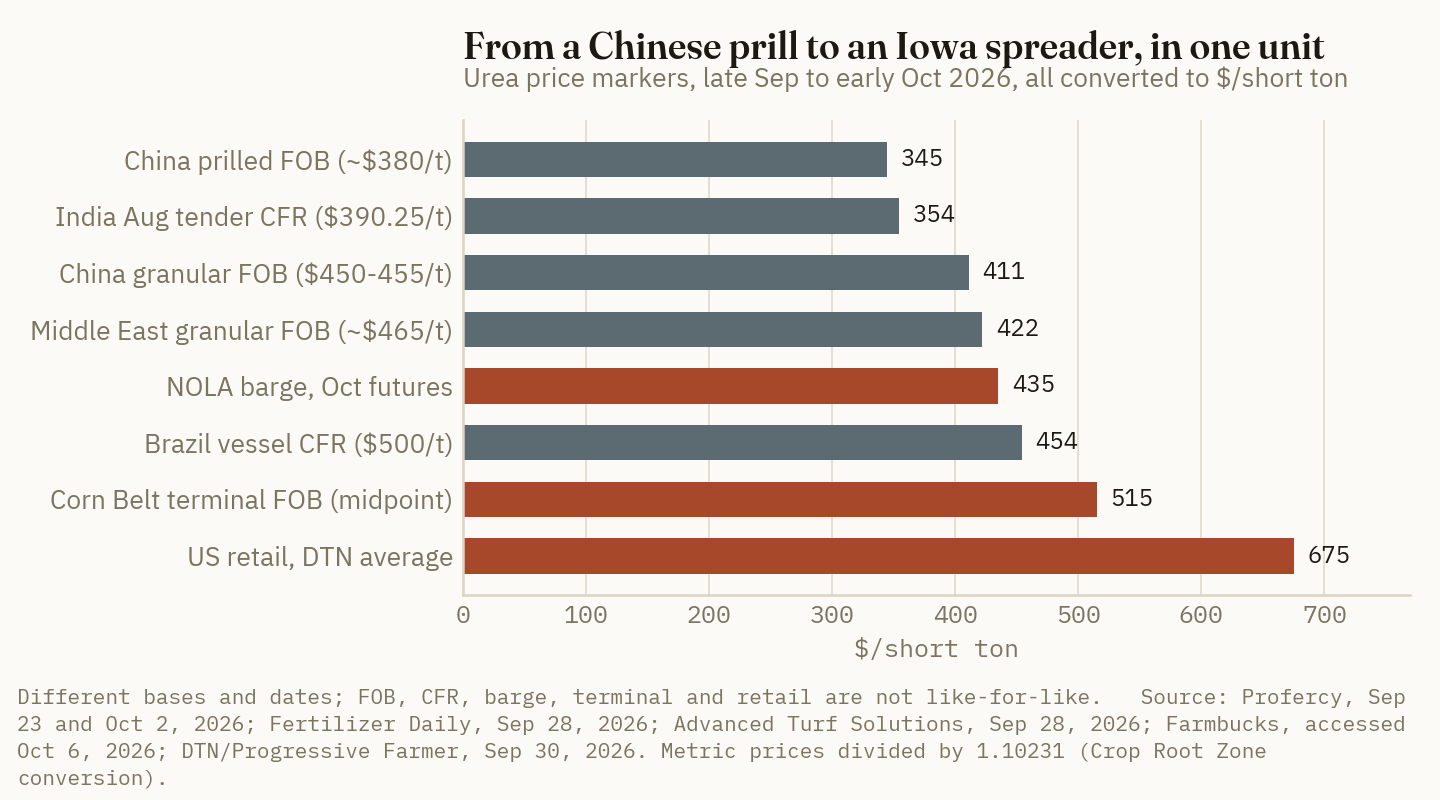
| Marker | Quoted | $/st | Basis and date |
|---|---|---|---|
| China prilled | ~$380/t | 345 | FOB China, Sep 23 |
| India, August tender | $390.25/t | 354 | CFR east coast India, Aug 11 |
| China granular | $450–455/t | 411 | FOB China, Sep 23 |
| Middle East granular | ~$465/t | 422 | FOB, Sep 25 |
| NOLA barge | $434.75/st | 435 | October futures, accessed Oct 6 |
| Brazil vessel business | $500/t | 454 | CFR Brazil, mid to late September |
| Corn Belt terminal | $500–530/st | 515 | FOB terminal, Sep 25 (midpoint) |
| US retail | $675/st | 675 | Delivered to farm, Sep 21–25 |
Source: Profercy, Sep 23, Oct 2 and Oct 6, 2026; Fertilizer Daily, Sep 28, 2026; Advanced Turf Solutions, Sep 28, 2026; Farmbucks, accessed Oct 6, 2026; DTN/Progressive Farmer, Sep 30, 2026. Short-ton values for metric quotes are Crop Root Zone conversions at 1.10231 short tons per tonne, rounded. Bases and dates differ and the rows are not like-for-like.
The barge at $434.75 a short ton is $479 a metric tonne. A Middle East producer selling at $465 FOB needs the buyer to cover ocean freight on top. We could not find a public freight quote for the Middle East to the US Gulf this month. Brazil's $490–500 CFR asks against $465 FOB imply $25–35 a tonne for freight and trader margin on that route, and we use $30 for the US Gulf as our own estimate. On that estimate a replacement cargo lands at $495 a tonne, or $449 a short ton, before the cost of moving it from vessel to barge. The barge is about $14 under that.
$14 a short ton
The amount by which the October Gulf barge ($434.75) sits below the landed cost of Middle East granular at $465 FOB plus an estimated $30 freight, before vessel-to-barge transfer. (Crop Root Zone estimate from Fertilizer Daily, Sep 28, 2026, Profercy, Oct 2, 2026, and Farmbucks, accessed Oct 6, 2026)
A market priced under replacement does not attract new cargoes. It either rises to meet the import cost or stays low because enough product is already in the system. The tender is the next piece of evidence on which.
3. The conversion: India CFR to barge to retail
What's new: Three steps turn an India price into a Corn Belt number. Each step uses one figure that is an estimate, and we mark them.
Evidence: The steps are these.
- India CFR to Middle East FOB. Subtract freight. A trade estimate from April put Oman to west coast India at $20–30 a tonne (Afriqom, Apr 16, 2026) [11]. That was a wartime figure and may be high today. We use $25.
- Middle East FOB to NOLA. Add our $30 estimate from section 2. The two freights nearly cancel, so the Gulf equivalent of an India price is that price plus about $5 a tonne.
- Metric to short tons. Divide by 1.10231.
A granular price of $490 CFR west coast India therefore nets $465 FOB, which is where the Middle East stood on September 25 [6]. It lands in the Gulf at $495 a tonne, or $449 a short ton. Working backward from today's barge, $434.75 a short ton is $479 a tonne, which nets a Middle East seller $449 FOB and equals an India price of about $475 CFR.
To reach retail, add a spread. Yesterday we measured retail urea at $222.50 over the prompt barge, against $136 to $167 at three spring readings [14]. Against the October contract the same $675 retail average (DTN/Progressive Farmer, Sep 30, 2026) [9] is now $240 over. The table uses $222.50.
| India granular price, $/t CFR west coast | Middle East netback, $/t FOB* | Gulf barge equivalent, $/st* | vs. $434.75 barge, $/st | Retail equivalent, $/ton* | $/lb N | |
|---|---|---|---|---|---|---|
| 390 | 365 | 358 | −76 | 581 | 0.631 | ████████░░ |
| 420 | 395 | 386 | −49 | 608 | 0.661 | ████████░░ |
| 450 | 425 | 413 | −22 | 635 | 0.691 | █████████░ |
| 475 | 450 | 435 | +1 | 658 | 0.715 | █████████░ |
| 490 | 465 | 449 | +14 | 672 | 0.730 | ██████████ |
| 510 | 485 | 467 | +32 | 690 | 0.750 | ██████████ |
Source: Crop Root Zone calculation. *Estimated: netback subtracts $25/t freight to west coast India (midpoint of Afriqom's $20–30, Apr 16, 2026); barge equivalent adds our $30/t freight estimate to the US Gulf and divides by 1.10231, with no vessel-to-barge transfer cost or duty included; retail equivalent adds the $222.50 retail-to-barge spread from our Oct 5 piece. $/lb N at 920 lb N per ton. Bars scale the barge equivalent, with $467 at ten blocks. Rows are price levels, not predicted outcomes.
Three sensitivities fit on one line each. A $5 error in either freight moves the barge equivalent $4.54 a short ton. Each $10 a tonne on the India price is $9.07 a short ton, 0.99 cents a pound of nitrogen, or $1.77 an acre at 180 pounds, if it passes through in full [14]. This desk measured retail capturing under a third of a large international move this summer [14], which makes $10 worth about 59 cents an acre in practice.
One coincidence in the table is worth noting. The $490 row, which is the Middle East at its September 25 price, produces a retail equivalent of $672. DTN's survey average is $675 [9]. Retail urea is priced as though the barge under it were $449–452, the level of September 25. The barge has since fallen about $15 to $20.
4. Three numbers to read on Wednesday
What's new: The headline will be the lowest offer. For a US buyer it is the least useful of the three numbers the tender produces.
Evidence: The lowest offer will almost certainly be Chinese prilled urea, which Profercy expects no cheaper than August's $390 [4]. US agriculture runs on granular. A prilled price near $390–400 CFR nets a Chinese prill producer about what it nets today and says nothing about what a Middle East granular producer will accept. The first two rows of the table above are arithmetic, not a path by which the barge reaches $358.
The numbers that carry information are these.
| What prints | Reading | Effect on US replacement cost |
|---|---|---|
| Lowest offer near $390–400, most volume Chinese | Prills cleared, as in August | Little direct effect. Granular is left to find Brazil and the Gulf. |
| Middle East or other granular offered at $490 or more | Producers hold $465 FOB | Supports $449 a short ton or higher. The barge is $14 low. |
| Granular offered near $475 | Producers accept about $450 FOB | Matches today's barge. No change. |
| Granular offered under $460 | Producers discount below $435 FOB | Replacement cost falls under the barge. Retail has more to give back. |
| Booked volume well short of 1.7 Mt | India rejects price or supply is thin | Another tender follows sooner, inside the sailing window to spring. |
Source: Crop Root Zone reading of the conversion in section 3. Price thresholds carry the freight estimates stated there.
The volume from non-Chinese origins matters as much as its price. In August the Middle East and Malaysia supplied only about 0.2 million of 1.8 million tonnes [3]. If that repeats, roughly 1.5 million tonnes of prills leave China for India and the granular market gets no help from the largest buyer in the world. Those tonnes then need Brazil, which is hesitating [5], or the Gulf, which is bidding $14 under their cost.
Ground Truth: A low headline price on Wednesday is not good news for a urea buyer and a high one is not bad news, because the headline will be a prill price. The line to find is how many tonnes the Middle East offered and at what price. If Gulf producers offer granular into India at $490 or better and India takes it, the barge at $435 is too cheap and the two-week slide is over; a spring quote built on $450 will not improve. If they are absent or priced out, their fourth-quarter tonnes have two homes left, and one of them is New Orleans. In that case the barge has no reason to rise, and retail at $675 is carrying about $15 to $20 of barge value that no longer exists. Ask the retailer which barge the quote is built on before asking for the price.
Two things could override this reading. Profercy refers to ongoing supply disruption in the Middle East [4], and a producer with less to sell does not need India or the Gulf. And the offers are valid to October 15 [1], so counter-offers and final volumes will take a week. The lowest offers on Wednesday open the result and do not close it.
5. What a Corn Belt buyer does with it
What's new: The tender prints inside most spring quote windows, and the conversion above says which outcomes change a quote.
Evidence: Yesterday's piece put the April break-even for a $675 prepay at $700.50 at 7% money [14]. From the table in section 3, an April retail price of $700 at a normal spring spread of $136 to $167 needs a spring barge of $534 to $565. That is $99 to $130 above the current barge and equals an India granular price of roughly $585 to $620 CFR on our freight estimates. The highest granular price quoted anywhere in this piece is $500.
The practical uses are narrower.
- Hold the quote through October 15. Offer validity ends then [1]. A quote that expires Wednesday morning is priced before the retailer knows the answer.
- Compare the quote to the barge it implies. Subtract $136 to $167 from a spring urea quote to get the barge it assumes at a normal spring spread [14]. A $640 quote assumes $473 to $504. March futures are $462.50 [8].
- Watch Corn Belt terminals. They were $500–530 a short ton FOB on September 25 [7], $45 to $80 over the barge of that day. Terminal prices move before retail surveys do.
- Check DTN's survey for September 28 to October 2, due this week. Retail rose $16 the week the barge fell [14].
The tender does not settle spring. It sets the price of the Chinese prill and shows whether the Middle East is selling east. Both are worth knowing before a spring ton is paid for.
References
- Fertilizer Daily, K. Clarksen, "India urea tender: IPL seeks 1.7 million tonnes," Sep 29, 2026. https://www.fertilizerdaily.com/20260929-india-urea-tender-ipl-1-7-million-tonnes-december/
- Rural Voice, "IPL Floats Tender for 17 Lakh Tonnes of Urea, Sets December 1 Shipment Deadline," Sep 26, 2026. https://eng.ruralvoice.in/national/ipl-floats-tender-for-17-lakh-tonnes-of-urea-sets-december-1-shipment-deadline.html
- Profercy, "Urea: Chinese prilled availability to be tested as India returns with fresh tender," Sep 23, 2026 (public insight summary). https://www.profercy.com/insights/urea-chinese-prilled-availability-to-be-tested-as-india-returns-with-fresh-tender
- Profercy, "Urea price rally stalls on sluggish Brazilian demand as market awaits India's latest tender," Oct 2, 2026 (public insight summary). https://www.profercy.com/insights/urea-price-rally-stalls-on-sluggish-brazilian-demand-as-market-awaits-indias-latest-tender
- Profercy, "Brazilian demand in doubt amid difficult global nitrogen supply environment," Oct 6, 2026 (public insight summary). https://www.profercy.com/insights/brazilian-demand-in-doubt-amid-difficult-global-nitrogen-supply-environment
- Fertilizer Daily, "India opens 1.7m tonne urea tender as Q4 prices rebound," Sep 28, 2026 (prices as of Sep 25, 2026). https://www.fertilizerdaily.com/20260928-india-opens-1-7m-tonne-urea-tender-as-q4-prices-rebound/
- Advanced Turf Solutions, "U.S. Fertilizer Market Summary," Sep 28, 2026 (prices as of Sep 25, 2026). https://www.advancedturf.com/wp-content/uploads/2026/04/ATS-Fertilizer-Market-Update-9_28_2026.pdf
- Farmbucks, "Urea (US Gulf) Futures (CBOT UFV)" contract chain, data from DTN, CME Group and ICE; accessed Oct 6, 2026. https://farmbucks.com/futures/fertilizer/urea-us-gulf
- DTN/Progressive Farmer, "Anhydrous Leads Fertilizer Prices Higher, Up 25% From a Year Ago," Sep 30, 2026 (retail survey Sep 21–25, 2026). https://www.dtnpf.com/agriculture/web/ag/crops/article/2026/09/30/anhydrous-leads-fertilizer-prices-25
- Profercy, "Urea: Chinese supply sees offers into India below $400pt cfr across both coasts in latest tender," Aug 13, 2026 (public insight summary). https://www.profercy.com/insights/urea-chinese-supply-sees-urea-offers-into-india-below-400pt-cfr-across-both-coasts
- Afriqom, "India IPL urea tender sets record at $935/t WCI and $959/t ECI," Apr 16, 2026 (freight estimate, Oman to west coast India). https://www.afriqom.com/insights/india-urea-prices-hit-record-highs-amid-tight-supply
- SunSirs, "Review of the Global Urea Market (First Three Quarters of 2026) and Outlook for the Fourth Quarter," accessed Oct 6, 2026 (publication date not shown in the copy we read). https://www.sunsirs.com/commodity-news/petail-36560.html
- Fertilizer Daily, K. Clarksen, "China to ship 1.2 million tonnes of urea to India as prices plunge 58% from April's $935 peak," Sep 7, 2026. https://www.fertilizerdaily.com/20260907-china-urea-india-tender-1-2-million-tonnes-2026/
- Crop Root Zone, "A $675 Urea Prepay Costs $25.50 a Ton in Interest by April. The Gulf Curve Charges the Same $25.50 From October to March. Locking Wins Only if April Retail Tops $700," Oct 5, 2026 (tender date, Oct 2 futures, retail-to-barge spreads, $700.50 break-even, per-$10 conversion, pass-through); "China Is Supplying Two-Thirds of India's Urea Tender at $390. The Same Buyer Paid $935 in April," Sep 11, 2026 (August tender, corrected here).
Disclosures
Crop Root Zone is an independent publication. Nothing here is investment advice. Market calls, where included, reflect the editors' own read and are not a recommendation to buy or sell any security.
A Ton of Potash Costs About 102 Bushels of Corn, Back to Its 2019–20 Level. DAP Still Takes About 190, More Than at the 2022 Peak.
Iowa cash corn is up 26% on the year while retail potash is up 1%, so a ton of potash now costs about 25 fewer bushels than last September, a 20% drop and the largest of the four major nutrients. Anhydrous rose 22% and absorbed almost all of the rally, improving only 3%. Measured against its 2019–20 level, potash is back to normal; DAP and anhydrous still cost almost half as many bushels again, and DAP costs more corn per ton than it did in September or May 2022.
It took about 102 bushels of corn to buy a ton of potash in the second week of September. DTN's survey for Sep 7–11 put retail potash at $494 a ton (DTN/Progressive Farmer, Sep 16, 2026), and the six Iowa country-elevator regions USDA reports averaged about $4.86 a bushel on Sep 15 (USDA AMS Iowa Daily Cash Grain Bids, Sep 15, 2026). A year earlier the same ton took about 127 bushels. In the Septembers of 2019 and 2020 it took 101 and 102. The farm-gate exchange rate for potash has returned to where it was before the 2021–22 price spike, and this happened without potash getting cheaper. Corn went up. The same rally did much less for the other nutrients. DAP still costs about 190 bushels a ton, half as many again as in 2019–20 and more than at any point this desk checked in 2022. Anhydrous costs about 193, almost unchanged on the year, because its retail price rose nearly as fast as corn did. The ratio is a quick screen, not a budget. Read one nutrient at a time, though, it shows where this year's grain rally has made inputs more affordable and where it has not.
1. A 26% corn rally did the work, and fertilizer prices mostly stood still
What's new: In one year, cash corn in Iowa rose about $1.02 a bushel while three of the four major nutrients moved less than 8% at retail. Measured in bushels, urea, DAP and potash each got 15–20% cheaper. Anhydrous got 3% cheaper.
Evidence: USDA's Sep 15 Iowa report shows current bids for six country-elevator regions of $4.80 to $4.91 a bushel, with year-ago bids of $3.79 to $3.89 (USDA AMS Iowa Daily Cash Grain Bids, Sep 15, 2026). The simple averages are $4.86 and $3.85, a 26.4% rise. December corn settled at $5.3575 on Sep 15 (USDA AMS Illinois Grain Bids, Sep 15, 2026). The rally followed falling crop ratings: only 56% of corn was rated good-to-excellent at the start of September, the lowest opening September reading in three years (DTN/Progressive Farmer, Sep 9, 2026). USDA's Sep 11 WASDE then cut the national yield by 2.2 bushels to 178.5 bushels an acre, lowered projected 2026/27 ending stocks by 86 million bushels to 1.6 billion, and raised the season-average farm price by $0.30 to $4.80 (USDA WASDE, Sep 11, 2026).
DTN's retail table for the same week a year apart shows how little the nutrients moved over the same period:
| Nutrient | Retail, Sep 8–12 2025 ($/ton) | Retail, Sep 7–11 2026 ($/ton) | Retail change | Bu corn/ton, 2025 | Bu corn/ton, 2026 | Change, bu | Change, % |
|---|---|---|---|---|---|---|---|
| Anhydrous | 768 | 938 | +22.1% | 199.6 | 192.9 | −6.7 | −3.4% |
| DAP | 862 | 923 | +7.1% | 224.0 | 189.8 | −34.2 | −15.3% |
| Urea | 631 | 658 | +4.3% | 164.0 | 135.3 | −28.7 | −17.5% |
| Potash | 488 | 494 | +1.2% | 126.8 | 101.6 | −25.2 | −19.9% |
Source: DTN/Progressive Farmer, Sep 16, 2026 (delivered retail survey averages, $/ton). Corn: USDA AMS Iowa Daily Cash Grain Bids, Sep 15, 2026, simple average of six country-elevator regional bids, current delivery ($4.8632 now; $3.8481 in the year-ago column). Bushels per ton and changes are Crop Root Zone estimates.
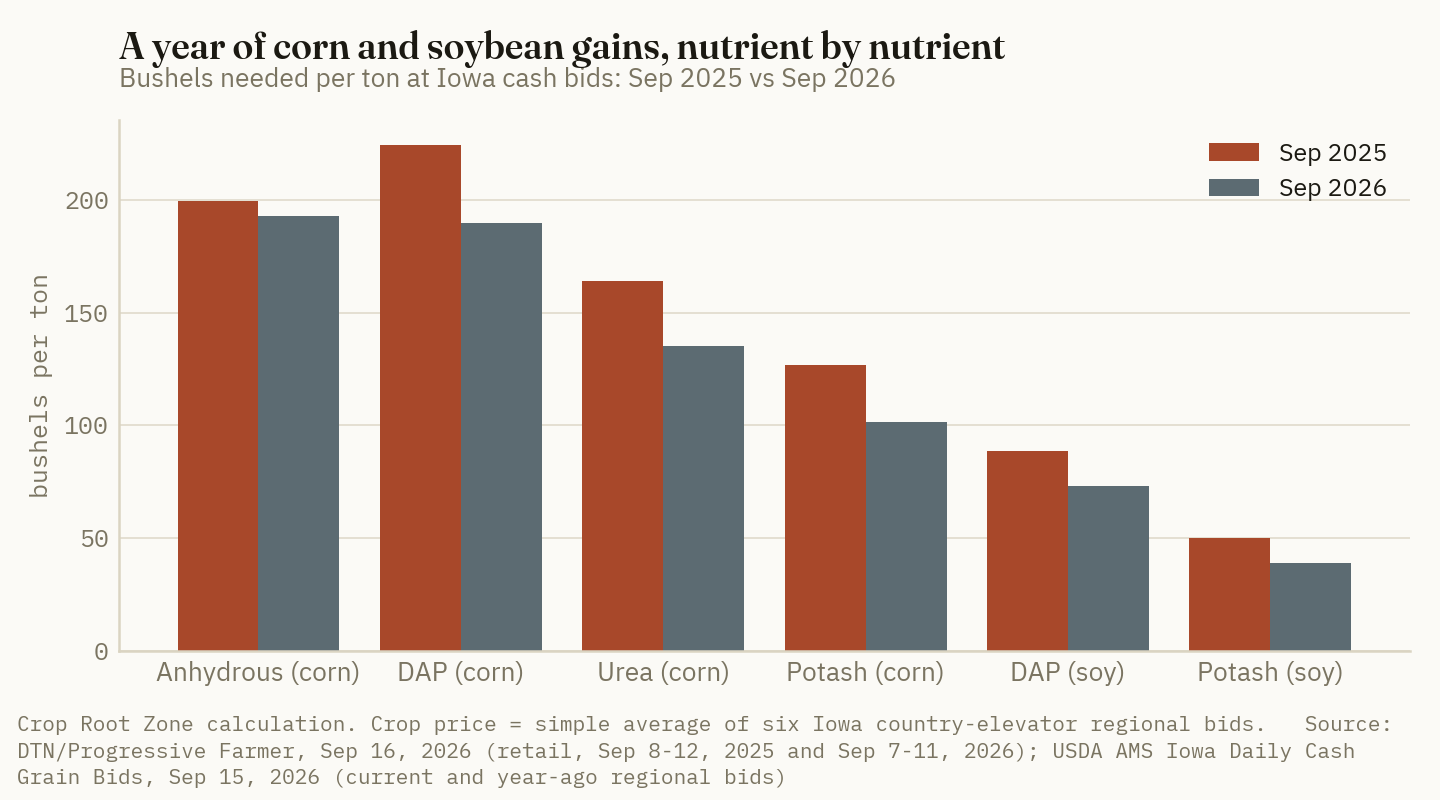
The change in a bushels-per-ton ratio is the change in the nutrient's price divided by the change in the crop's price. With corn up 26.4%, a nutrient whose price was flat becomes about 21% cheaper in bushels. Potash, up 1.2% at retail, comes close to that. Anhydrous, up 22.1%, used up nearly all of the corn gain. None of the four is cheaper in dollars than a year ago. Every row's improvement comes from the crop side.
Ground Truth: A ratio that improves because the crop price rose is weaker than one that improves because the input price fell. Crop prices can fall back before the crop is sold, and the input bill stays where it is. Most of the move came in a few weeks of weather-driven trade after the August WASDE (DTN/Progressive Farmer, Sep 9, 2026). For a grower who still owns unpriced bushels, today's ratios are a mark-to-market figure, not a locked-in exchange rate. They become real only for the bushels that are actually sold against the tons that are actually booked.
2. Potash moved most, and it is the only nutrient back at its pre-2021 exchange rate
What's new: On a consistent mid-September basis back to 2019, potash is the one nutrient whose bushel cost has returned to its 2019–20 level. It also moved the most in percentage terms over the past year.
Evidence: The history below uses DTN's second-week-of-September retail average (first week for 2020) divided by USDA's national September price received for corn. For 2026, when the September national price has not yet been published, the Iowa cash average is used instead.
| Mid-September | Corn, $/bu | Anhydrous, bu/ton | DAP, bu/ton | Urea, bu/ton | Potash, bu/ton |
|---|---|---|---|---|---|
| 2019 | 3.80 | 135.8 | 127.9 | 107.1 | 101.3 |
| 2020 | 3.40 | 128.2 | 126.8 | 106.2 | 102.4 |
| 2021 | 5.47 | 139.3 | 128.3 | 104.6 | 109.3 |
| 2022 | 7.09 | 193.1 | 134.3 | 114.0 | 123.7 |
| 2023 | 5.21 | 133.6 | 136.3 | 106.3 | 96.0 |
| 2024 | 3.97 | 172.3 | 185.1 | 123.2 | 116.9 |
| 2025 | 4.00 | 192.0 | 215.5 | 157.8 | 122.0 |
| 2026* | 4.86 | 192.9 | 189.8 | 135.3 | 101.6 |
| 2019–20 average | 132.0 | 127.3 | 106.6 | 101.9 | |
| 2019–25 average | 156.3 | 150.6 | 117.0 | 110.2 |
Sources: Retail — DTN/Progressive Farmer, Sep 18, 2019 (Sep 9–13); Sep 9, 2020 (Aug 31–Sep 4); Sep 21, 2022 (Sep 13–17, 2021 and Sep 12–16, 2022); Sep 20, 2023 (Sep 11–15); Sep 18, 2024 (Sep 9–13); Sep 17, 2025 (Sep 8–12); Sep 16, 2026 (Sep 7–11). Corn — USDA NASS Agricultural Prices, Jan 29, 2021 (Sep 2019, Sep 2020); Oct 31, 2023 (Sep 2021–Sep 2023); Aug 31, 2026 (Sep 2024, Sep 2025), US September price received. *2026 corn is the Iowa country-elevator average from USDA AMS, Sep 15, 2026, a different basis. In 2025 the two bases differed by about 4% ($4.00 national September price against $3.85 in Iowa year-ago bids), so the 2026 row may overstate bushels a little against earlier rows. All ratios and averages are Crop Root Zone estimates.
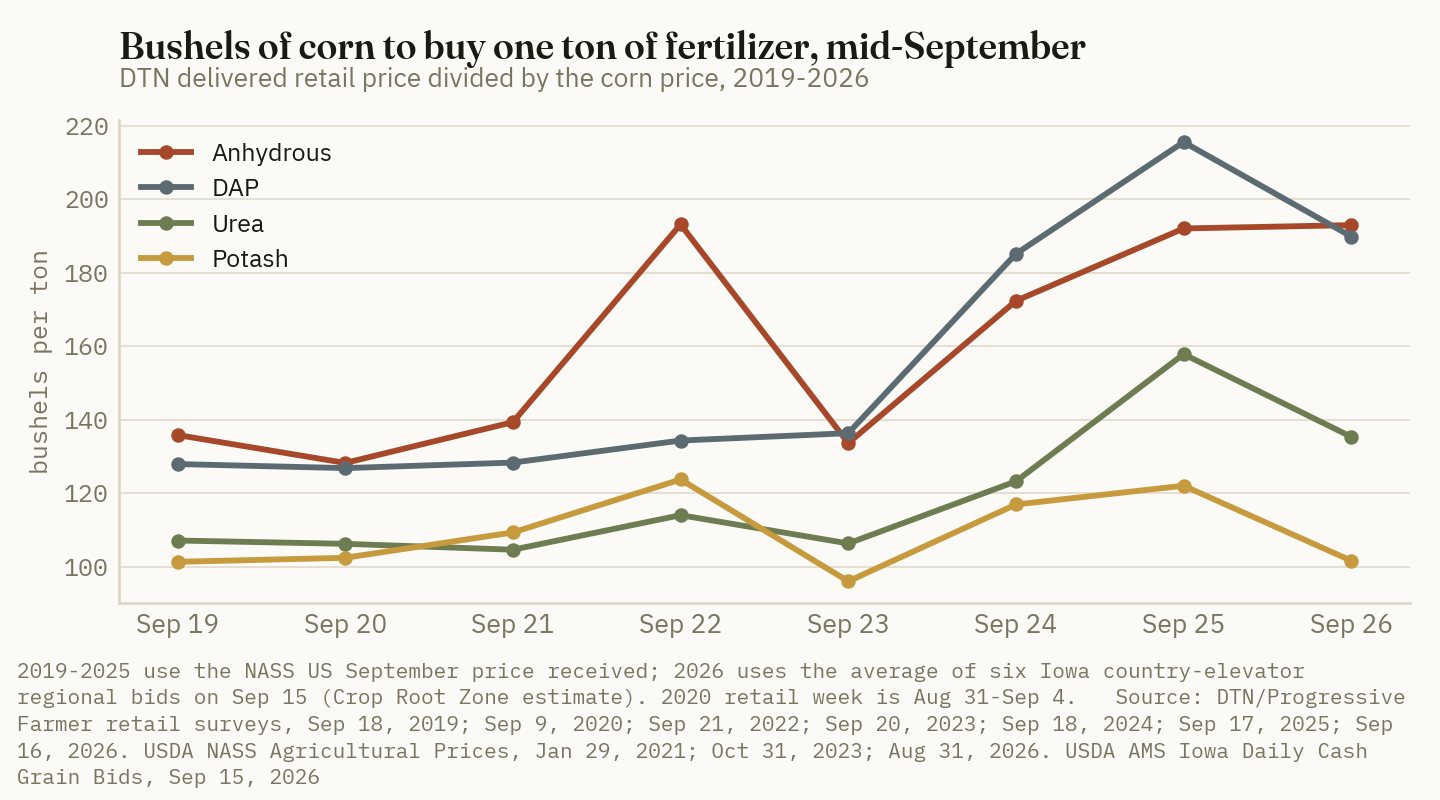
101.6 bushels
Corn needed to buy one ton of retail potash in mid-September 2026, against 126.8 a year earlier and a 2019–20 average of 101.9. (Crop Root Zone estimate from DTN/Progressive Farmer, Sep 16, 2026; USDA AMS Iowa Daily Cash Grain Bids, Sep 15, 2026; USDA NASS Agricultural Prices, Jan 29, 2021)
Potash got there because its price has barely moved. Retail potash printed between $484 and $495 a ton in every monthly row DTN published from October 2025 to September 2026, through a spring in which anhydrous rose above $1,100 and urea above $860 (DTN/Progressive Farmer, Sep 16, 2026). Since the first week of September 2020 the potash price is up 42%, from $348 to $494, and corn is up about 43%, from $3.40 to $4.86. The two have moved almost exactly together over six years. The Illinois data give the same answer. The Sep 4 Illinois Production Cost Report had the average distributor potash ask at $500.42 a ton FOB (USDA AMS Illinois Production Cost Report, Sep 4, 2026). At the $5.01 central Illinois country-elevator corn average on Sep 15 (USDA AMS Illinois Grain Bids, Sep 15, 2026), that is about 100 bushels, a Crop Root Zone estimate that mixes report dates eleven days apart.
Ground Truth: Potash is the one nutrient where this year's number looks like the old normal, and that changes what a fall potash decision is about. When the exchange rate is historically ordinary, the price is not the reason to cut the rate. The reason is the soil test. Where exchangeable K is below the maintenance range, a ton of potash at about 100 bushels is about as cheap as in any September since 2019. Where soil K is well above that range, the ratio is no reason to apply it. Potash affordability is now a soil-test question, not a market one.
3. DAP improved by the most bushels but remains the least affordable nutrient against its own history
What's new: DAP's bushel cost fell by 34, the largest absolute drop of the four. At about 190 bushels a ton it is still 49% above its 2019–20 level, the widest gap of any nutrient, and above both its September 2022 and May 2022 readings.
Evidence: The multiple of each nutrient's current bushel cost over its 2019–20 average:
| Nutrient | 2026 bu/ton | 2019–20 avg bu/ton | Multiple | |
|---|---|---|---|---|
| DAP | 189.8 | 127.3 | 1.49× | ██████████ |
| Anhydrous | 192.9 | 132.0 | 1.46× | ██████████ |
| Urea | 135.3 | 106.6 | 1.27× | █████████░ |
| Potash | 101.6 | 101.9 | 1.00× | ███████░░░ |
Crop Root Zone estimate from the history table in section 2. Bars scale 1.49× to ten blocks.
The 2022 comparison is the notable one. DTN's mid-September 2022 DAP price was $952 a ton, and the September 2022 national corn price was $7.09, which works out to 134 bushels (DTN/Progressive Farmer, Sep 21, 2022; USDA NASS Agricultural Prices, Oct 31, 2023). DAP's highest monthly print in DTN's 2021–22 table was $1,056 in May 2022, when corn averaged $7.26, or 145 bushels. Today's 190 is higher than both. In 2022 phosphate was expensive in dollars and affordable in corn. In 2026 it is somewhat cheaper in dollars and considerably less affordable in corn. The cause is the gap between two price paths. From the first week of September 2020 to now, retail DAP rose 114%, from $431 to $923. Corn rose 43% over the same span.
Last year made the gap worse, and this year only partly reversed it. DAP rose from $735 in September 2024 to $862 in September 2025 while national corn was nearly flat at $3.97 and $4.00, which pushed the ratio from 185 to 216 bushels (DTN/Progressive Farmer, Sep 17, 2025; USDA NASS Agricultural Prices, Aug 31, 2026). Since then DAP has kept rising, from $847 at the turn of the year to $923 now (DTN/Progressive Farmer, Sep 16, 2026). That is why DAP's percentage improvement, 15.3%, trails potash and urea even though its bushel drop is largest. The Illinois cross-check is similar: a $921.11 average distributor DAP ask on Sep 4 against $5.01 central Illinois corn is about 184 bushels (USDA AMS Illinois Production Cost Report, Sep 4, 2026; USDA AMS Illinois Grain Bids, Sep 15, 2026; Crop Root Zone estimate).
Ground Truth: A "P&K" program is two separate decisions this fall, not one. In bushels, K is priced like 2019 and P is priced 50% above it. Where both are applied as a blend at a maintenance rate, the phosphate share is where almost all of the above-normal cost sits. On fields testing well above the P maintenance range, drawing down P for a year saves roughly half as many bushels again as the same drawdown did before 2021. It would still leave the cheaper K on the field. The agronomy sets whether that is sensible field by field. The ratio shows that the saving from a P drawdown is now large and the saving from a K drawdown is not.
4. Anhydrous rose with corn, and its nitrogen price ratio is where it was in September 2022
What's new: Anhydrous is the only major nutrient whose bushel cost barely changed on the year: 192.9 bushels a ton now against 199.6. Its retail price rose 22%, and the nitrogen-to-corn price ratio that agronomists use to set N rates is roughly where it stood in September 2022.
Evidence: Rate calculators such as the maximum return to nitrogen (MRTN) approach use the price of a pound of N divided by the price of a bushel of corn, not the price per ton. University of Minnesota Extension puts the 20-year norm for that ratio at about 0.1, says it recently peaked at 0.2, and puts fall 2026 at "just over 0.1," using an $865-a-ton anhydrous price ($0.53 a pound of N) and southern Minnesota corn above $5 (University of Minnesota Extension, Aug 17, 2026). On DTN's national prices, the September readings are:
| Mid-September | Anhydrous, $/lb N | Urea, $/lb N | Corn, $/bu | Anhydrous N:corn ratio | Urea N:corn ratio |
|---|---|---|---|---|---|
| 2019 | 0.31 | 0.44 | 3.80 | 0.082 | 0.116 |
| 2020 | 0.27 | 0.39 | 3.40 | 0.079 | 0.115 |
| 2022 | 0.83 | 0.88 | 7.09 | 0.117 | 0.124 |
| 2023 | 0.42 | 0.60 | 5.21 | 0.081 | 0.115 |
| 2024 | 0.42 | 0.53 | 3.97 | 0.106 | 0.134 |
| 2025 | 0.47 | 0.69 | 3.85* | 0.122 | 0.179 |
| 2026 | 0.57 | 0.72 | 4.86* | 0.117 | 0.148 |
Sources: $/lb N — DTN/Progressive Farmer, Sep 18, 2019; Sep 9, 2020; Sep 21, 2022; Sep 20, 2023; Sep 18, 2024; Sep 17, 2025; Sep 16, 2026. Corn — USDA NASS Agricultural Prices (Jan 29, 2021; Oct 31, 2023; Aug 31, 2026), US September price received. *2025 and 2026 use the Iowa country-elevator averages from USDA AMS, Sep 15, 2026, so the two rows are on the same basis. Ratios are Crop Root Zone estimates.
The 2019, 2020 and 2023 readings clustered near 0.08 for anhydrous. The current 0.117 matches September 2022 exactly. In 2022 that ratio came with $7.09 corn; in 2026 it comes with $4.86 corn. The farmdoc daily team reported Illinois anhydrous at $915.50 a ton on Aug 7, 16% above August 2025, and noted that anhydrous held above $1,100 from April through mid-June (farmdoc daily, Aug 11, 2026). The fall price is lower than the spring peak but still well above last fall's.
Urea is the other side of the nitrogen story. Its ratio improved from 0.179 to 0.148, and its bushel cost from 164 to 135, because urea retail rose only 4% on the year. Anhydrous kept its per-pound discount to urea: $0.57 against $0.72 a pound of N (DTN/Progressive Farmer, Sep 16, 2026). That discount is smaller in relative terms than a year ago, when it was $0.47 against $0.69.
Ground Truth: For the N rate itself, the ratio's move from 0.122 to 0.117 is too small to change an MRTN recommendation in any meaningful way. The bigger point is that anhydrous has not given growers the relief the grain rally gave on P, K and urea. A grower who assumed that $5 corn would make fall N cheap, as it appeared to in September 2021, is working from the wrong analogy. In September 2021, at $5.47 corn, anhydrous cost 139 bushels. At $4.86 corn it costs 193. Anhydrous affordability now depends on whether the retail price comes down, not on whether corn keeps rising.
5. In soybeans, potash is cheaper than its 2019–20 level, and the corn price used changes the answer by about 20%
What's new: Priced in soybeans, potash affordability has improved beyond its 2019–20 level, because soybean bids rose even more than corn. The corn-based ratios are also sensitive to which corn price is used, and the range across today's public prices is wide enough to matter.
Evidence: Iowa soybean bids averaged about $12.64 on Sep 15 against about $9.73 in the year-ago column, a 29.8% rise (USDA AMS Iowa Daily Cash Grain Bids, Sep 15, 2026). USDA raised its 2026/27 season-average soybean price by $0.60 to $12.00 and cut ending stocks by 10 million bushels to 310 million (USDA WASDE, Sep 11, 2026).
| Crop and nutrient | Sep 2019 | Sep 2020 | Sep 2022 | Sep 2025 | Sep 2026 | 2019–25 avg |
|---|---|---|---|---|---|---|
| DAP, bu soybeans/ton | 58.2 | 46.6 | 67.0 | 88.6* | 73.1* | 63.3 |
| Potash, bu soybeans/ton | 46.1 | 37.7 | 61.8 | 50.1* | 39.1* | 46.8 |
Sources: Retail — DTN/Progressive Farmer (dates as in section 2). Soybeans — USDA NASS Agricultural Prices (Jan 29, 2021; Oct 31, 2023; Aug 31, 2026), US September price received ($8.35, $9.24, $14.20; 2021 $12.20, 2023 $13.20, 2024 $10.20 and 2025 $9.85 are used in the average). *2025 and 2026 columns use Iowa country-elevator soybean averages from USDA AMS, Sep 15, 2026 ($9.73 and $12.64); the 2019–25 average uses the NASS September price for 2025 (49.5 bu potash, 87.5 bu DAP). All ratios are Crop Root Zone estimates.
A ton of potash now costs about 39 bushels of soybeans, below the 2019–25 average of 47 and close to the 2020 and 2023 lows. DAP costs about 73 bushels, 17.5% fewer than a year ago but still above the 2019–25 average and 40% above its 2019–20 average of 52.
The corn ratios need one more caution. They depend on which corn price the reader has in hand:
| Corn price used | $/bu | Anhydrous, bu/ton | DAP, bu/ton | Urea, bu/ton | Potash, bu/ton |
|---|---|---|---|---|---|
| NASS US price received, July 2026 | 4.26 | 220 | 217 | 154 | 116 |
| WASDE 2026/27 season-average price | 4.80 | 195 | 192 | 137 | 103 |
| Iowa country-elevator average, Sep 15 | 4.86 | 193 | 190 | 135 | 102 |
| Central Illinois country-elevator average, Sep 15 | 5.01 | 187 | 184 | 131 | 99 |
| CBOT December 2026 settlement, Sep 15 | 5.36 | 175 | 172 | 123 | 92 |
Sources: USDA NASS Agricultural Prices, Aug 31, 2026; USDA WASDE, Sep 11, 2026; USDA AMS Iowa Daily Cash Grain Bids and Illinois Grain Bids, Sep 15, 2026 (December settlement $5.3575). Retail prices from DTN/Progressive Farmer, Sep 16, 2026. Bushels per ton are Crop Root Zone estimates.
The spread between the July national cash price and December futures is 45 bushels a ton for anhydrous and 24 for potash. The conclusions from the earlier sections hold across the whole range. Potash sits between 92 and 116 bushels, around its 2019–20 level of 102. DAP sits between 172 and 217 bushels, well above its 2019–20 level of 127 at every price shown.
Ground Truth: The right corn price for this ratio is the one a grower can actually get for the bushels that will pay the fertilizer bill. For most operations that is a harvest or deferred cash bid, not the futures board. Two consequences follow. First, a fall potash ratio of about 100 bushels holds only as long as harvest basis and futures hold. A grower who prices fall P&K without pricing any grain has taken on the crop side of the ratio in full. Second, rotation shifts the bill. Soybeans are carrying potash at its lowest soybean exchange rate since 2023, and at 73 bushels DAP is still dear. A rotation weighted toward soybeans next year, which the farmdoc daily team raised as one response to high fertilizer costs (farmdoc daily, Aug 11, 2026), would lean on the cheaper nutrient and the crop that currently buys it most cheaply.
References
- DTN/Progressive Farmer, Russ Quinn, "Fertilizer Prices Continue Lower for 6 of 8 Major Nutrients," Sep 16, 2026 (retail survey Sep 7–11, 2026; monthly table from Sep 8–12, 2025) — https://www.dtnpf.com/agriculture/web/ag/news/crops/article/2026/09/16/fertilizer-prices-continue-lower-6-8
- DTN/Progressive Farmer, Russ Quinn, "DAP Leads Fertilizer Prices Up Again," Sep 17, 2025 (retail survey Sep 8–12, 2025; monthly table from Sep 9–13, 2024) — https://www.dtnpf.com/agriculture/web/ag/crops/article/2025/09/17/dap-leads-fertilizer-prices
- DTN/Progressive Farmer, Russ Quinn, "3 Fertilizer Prices Down Significantly in Second Week of September," Sep 18, 2024 (retail survey Sep 9–13, 2024) — https://www.dtnpf.com/agriculture/web/ag/crops/article/2024/09/18/3-fertilizer-prices-significantly
- DTN/Progressive Farmer, Russ Quinn, "Anhydrous Price Climbs While Other Retail Fertilizer Prices Continue to Fall," Sep 20, 2023 (retail survey Sep 11–15, 2023) — https://www.dtnpf.com/agriculture/web/ag/crops/article/2023/09/20/anhydrous-price-climbs-retail-prices
- DTN/Progressive Farmer, Russ Quinn, "Retail Fertilizer Prices Mixed in Mid-September 2022," Sep 21, 2022 (retail survey Sep 12–16, 2022; monthly table from Sep 13–17, 2021) — https://www.dtnpf.com/agriculture/web/ag/crops/article/2022/09/21/retail-fertilizer-prices-mixed-mid
- DTN/Progressive Farmer, Russ Quinn, "Retail Fertilizer Prices Posting Mixed Moves," Sep 9, 2020 (retail survey Aug 31–Sep 4, 2020) — https://www.dtnpf.com/agriculture/web/ag/crops/article/2020/09/09/retail-fertilizer-prices-posting
- DTN/Progressive Farmer, Russ Quinn, "Fertilizer Prices Still Trending Lower," Sep 18, 2019 (retail survey Sep 9–13, 2019) — https://www.dtnpf.com/agriculture/web/ag/crops/article/2019/09/18/fertilizer-prices-still-trending-2
- USDA AMS, Iowa Daily Cash Grain Bids, Sep 15, 2026 (current and year-ago regional corn and soybean bids) — https://www.ams.usda.gov/mnreports/ams_2850.pdf
- USDA AMS, Illinois Grain Bids, Sep 15, 2026 (central Illinois averages; CBOT settlements) — https://www.ams.usda.gov/mnreports/ams_3192.pdf
- USDA AMS, Illinois Production Cost Report (Bi-weekly), Sep 4, 2026 — https://www.ams.usda.gov/mnreports/ams_3195.pdf
- USDA NASS, Agricultural Prices, released Aug 31, 2026 (monthly corn and soybean prices received, 2024–2026) — https://esmis.nal.usda.gov/sites/default/release-files/796040/agpr0826.pdf
- USDA NASS, Agricultural Prices, released Oct 31, 2023 (monthly prices received, 2021–2023) — https://esmis.nal.usda.gov/sites/default/release-files/c821gj76b/p5549c237/z603sj291/agpr1023.pdf
- USDA NASS, Agricultural Prices, released Jan 29, 2021 (monthly prices received, 2018–2020) — https://esmis.nal.usda.gov/sites/default/release-files/c821gj76b/6969zt09z/8910km52d/agpr0121.txt
- USDA World Agricultural Outlook Board, World Agricultural Supply and Demand Estimates (WASDE-675), Sep 11, 2026 — https://www.usda.gov/oce/commodity/wasde/wasde0926.pdf
- DTN/Progressive Farmer, Rhett Montgomery, "After Historic Late-August Price Rallies, USDA Returns With New Forecasts," Sep 9, 2026 — https://www.dtnpf.com/agriculture/web/ag/news/article/2026/09/09/historic-late-august-price-rallies
- farmdoc daily, University of Illinois, "Fertilizer and Fuel Prices Higher Heading into Fall 2026," Aug 11, 2026 — https://farmdocdaily.illinois.edu/2026/08/fertilizer-and-fuel-prices-higher-heading-into-fall-2026.html
- University of Minnesota Extension, Brad Carlson, "Why anhydrous ammonia is (still) an excellent nitrogen fertilizer source for corn," Aug 17, 2026 — https://blog-crop-news.extension.umn.edu/2026/08/why-anhydrous-ammonia-is-still.html
Disclosures
Crop Root Zone is an independent publication. Nothing here is investment advice. Market calls, where included, reflect the editors' own read and are not a recommendation to buy or sell any security.
USDA Put 282 Million More Bushels in the Corn Carryout, 172 Million Over the Trade. Nebraska Supplied 106 Million of the Crop Increase. Soybeans' 2027 Edge on an Illinois Acre Widens From $50 to About $100.
October's WASDE raised corn yield 2.7 bushels to 181.2 and ending stocks to 1.849 billion (11.3% of use), cut the price 10 cents to $4.70 and left soybeans at 315 million and $12.00. USDA raised 2026/27 corn feed use where we expected a cut. On farmdoc's 2027 budget, corn needs $5.20 cash to match $12.00 soybeans.
USDA raised the 2026 U.S. corn yield 2.7 bushels to 181.2 bushels per acre on Friday, October 9, lifted the crop 234 million bushels to 16.034 billion, and carried in the 2.095 billion bushels of old-crop corn that NASS counted on September 1 (USDA WASDE-676, Oct 9, 2026) [1]. Total 2026/27 supply rose 407 million bushels. Use rose 125 million. Ending stocks went up 282 million, to 1.849 billion, and the season-average farm price came down 10 cents to $4.70 [1]. The trade had expected a yield of 177.6 and a carryout of 1.677 billion (DTN/Progressive Farmer, Oct 7, 2026) [3]. December corn traded limit-down for a time and settled at $4.79¾, down 20½ cents (DTN/Progressive Farmer, Oct 9, 2026; Brownfield Ag News, Oct 9, 2026) [5][6]. Soybeans barely moved: yield up 0.3 bushel to 53.1, ending stocks up 5 million to 315 million, price unchanged at $12.00 [1].
This is the first balance sheet built on the September 30 stocks count. It answers the two questions we left open on September 14 and October 1 [10][11], and it answers one of them the opposite way from what we wrote.
1. Corn: 407 million bushels of new supply, 282 million of it left over
What's new: Every corn line that could move up did. Beginning stocks rose 173 million bushels on the stocks count, production rose 234 million, and each use category was raised: feed and residual 50 million, ethanol 50 million, exports 25 million [1].
Evidence:
| Corn (million bu) | 2025/26 est. | 2026/27 Sept. | 2026/27 Oct. | Oct. vs. Sept. |
|---|---|---|---|---|
| Harvested area (mil acres) | 90.9 | 88.5 | 88.5 | 0.0 |
| Yield (bu/acre) | 186.5 | 178.5 | 181.2 | +2.7 |
| Beginning stocks | 1,551 | 1,922 | 2,095 | +173 |
| Production | 16,964 | 15,800 | 16,034 | +234 |
| Imports | 31 | 25 | 25 | 0 |
| Total supply | 18,546 | 17,747 | 18,154 | +407 |
| Feed and residual | 6,119 | 5,950 | 6,000 | +50 |
| Food, seed and industrial | 6,903 | 6,955 | 7,005 | +50 |
| — of which ethanol and by-products | 5,547 | 5,600 | 5,650 | +50 |
| Exports | 3,429 | 3,275 | 3,300 | +25 |
| Total use | 16,451 | 16,180 | 16,305 | +125 |
| Ending stocks | 2,095 | 1,567 | 1,849 | +282 |
| Stocks-to-use* | 12.7% | 9.7% | 11.3% | +1.7 pt |
| Season-average farm price ($/bu) | 4.16 | 4.80 | 4.70 | −0.10 |
Basis: U.S. marketing year beginning September 1; million bushels unless noted. Source: USDA WASDE-676, Oct 9, 2026 [1]. *Stocks-to-use is a Crop Root Zone calculation (ending stocks ÷ total use); the change is taken on unrounded ratios.
69%
Share of October's 407 million bushels of added corn supply that USDA left in ending stocks (282 ÷ 407). In September, 64% of a 236-million-bushel supply cut was absorbed by lower use. (Crop Root Zone calculation from USDA WASDE-676, Oct 9, 2026 [1], and TRZ-0189 [10])
Against the trade, the report was a miss on the crop, not on the carry-in. The stocks count had been public for nine days and DTN's preview said outright that beginning stocks would go to 2.095 billion [3].
| 2026/27 | Sept. WASDE | Trade avg. | Trade range | Oct. WASDE | vs. trade avg. | vs. Sept. |
|---|---|---|---|---|---|---|
| Corn yield (bu/acre) | 178.5 | 177.6 | 173.2–182.1 | 181.2 | +3.6 | +2.7 |
| Corn production (mil bu) | 15,800 | 15,716 | 15,344–16,115 | 16,034 | +318 | +234 |
| Corn ending stocks (mil bu) | 1,567 | 1,677 | 1,522–1,895 | 1,849 | +172 | +282 |
| Soybean yield (bu/acre) | 52.8 | 52.9 | 51.4–54.1 | 53.1 | +0.2 | +0.3 |
| Soybean production (mil bu) | 4,535 | 4,541 | 4,415–4,648 | 4,562 | +21 | +27 |
| Soybean ending stocks (mil bu) | 310 | 311 | 245–358 | 315 | +4 | +5 |
Source: USDA WASDE-676, Oct 9, 2026 [1]; pre-report survey as published by DTN/Progressive Farmer, Oct 7 and Oct 9, 2026 [3][4]. Difference columns are Crop Root Zone calculations.
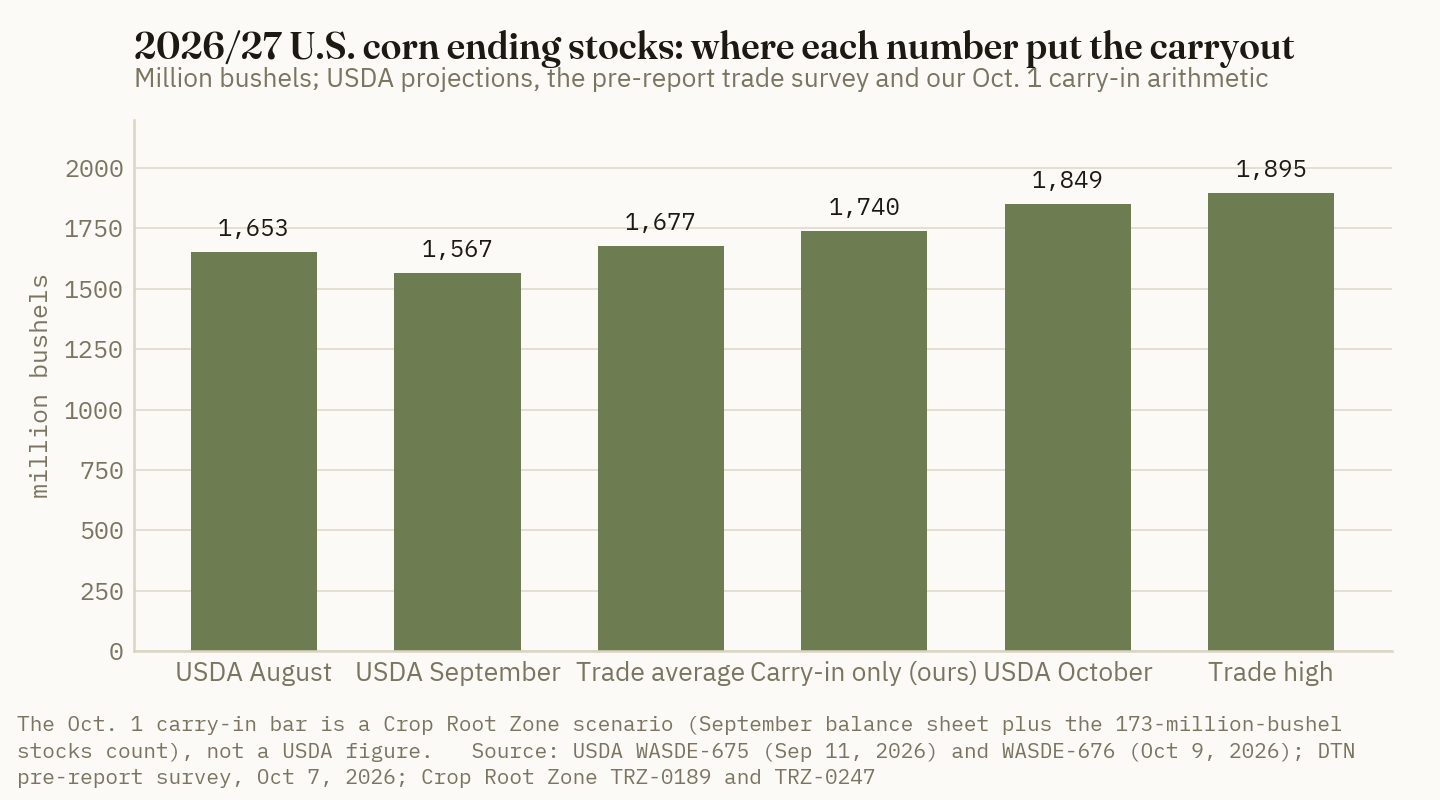
The trade average of 1.677 billion was only 110 million above September, less than the 173 million of carry-in already known. The survey was counting on a smaller crop to give some of it back. The crop went the other way.
The price line deserves a second look. In August USDA projected a 1.653-billion-bushel carryout and a $4.50 price; in September, 1.567 billion and $4.80 [10]. October's carryout is 196 million bushels above August's and the price forecast is 20 cents higher than August's [1][10].
Ground Truth: $4.70 is not what the balance sheet alone would give. It is roughly what the board's forward curve gives less a normal basis. On October 12 the December, March, May and July corn contracts were quoted at $4.81½, $4.95¾, $5.03 and $5.08½ [9]. Their simple average is $4.97, so a $4.70 farm price implies an average basis near 27 cents under across the year (our arithmetic, not USDA's method). A grower delivering across the scale this month, at harvest basis against the lowest contract on that curve, is not selling the $4.70 crop. The season-average number belongs to bushels that are stored and sold later, and it will come down another step if the curve does.
2. The yield: one state carried nearly half of it
What's new: NASS raised Nebraska's corn yield 11 bushels, from 177 to 188. It left Iowa at 219, Minnesota at 195, Indiana at 200 and Missouri at 181, and cut Illinois one bushel to 208 (USDA NASS Crop Production, Oct 9, 2026) [2].
Evidence: Nebraska's forecast production rose from 1.701 billion bushels in September [10] to 1.807 billion [2]. That is 106 million bushels, or 45% of the national increase.
| State | Sept. 1 yield | Oct. 1 yield | Change | Bushels added (mil)* | |
|---|---|---|---|---|---|
| Nebraska | 177 | 188 | +11 | 105.7 | ██████████ |
| South Dakota | 145 | 151 | +6 | 35.0 | ███░░░░░░░ |
| Kansas | 121 | 125 | +4 | 26.2 | ██░░░░░░░░ |
| Ohio | 194 | 200 | +6 | 19.4 | ██░░░░░░░░ |
| Texas | 114 | 122 | +8 | 17.0 | ██░░░░░░░░ |
| Michigan | 173 | 180 | +7 | 13.7 | █░░░░░░░░░ |
| North Dakota | 130 | 132 | +2 | 8.9 | █░░░░░░░░░ |
| Wisconsin | 180 | 182 | +2 | 6.2 | █░░░░░░░░░ |
| Iowa | 219 | 219 | 0 | 0.0 | |
| Minnesota | 195 | 195 | 0 | 0.0 | |
| Indiana | 200 | 200 | 0 | 0.0 | |
| Illinois | 209 | 208 | −1 | −10.9 | |
| United States | 178.5 | 181.2 | +2.7 | 234 |
Basis: corn for grain, bushels per harvested acre. Source: USDA NASS Crop Production, Oct 9, 2026 [2]. *Crop Root Zone calculation: yield change × October harvested area, which assumes each state's harvested area is unchanged from September (confirmed for Nebraska, Iowa and Kansas against the September production figures in TRZ-0189 [10]; the national figure is unchanged at 88.5 million acres). The U.S. row is USDA's production change. Bars scaled to Nebraska; states with no increase carry no bar.
September's report was a western and northern loss: Nebraska, South Dakota, Kansas and North Dakota took cuts of 5 to 12 bushels [10]. October handed back 176 million of those bushels across the same four states (our sum from the table). The I-states did not participate.
The survey caveat is real. Corn was 23% harvested on October 4, four points behind the five-year average, and soybeans 25% against 33%; DTN described Iowa and Nebraska as well behind normal after a wet second half of September (DTN/Progressive Farmer, Oct 5, 2026) [7]. DTN's own model yield is 179.5 [4], and its analyst wrote after the report that there are "serious questions post-report about yields for both Nebraska and Iowa" (D. Mantini, DTN, Oct 9, 2026) [5]. We could not read the objective-yield tables in the NASS release this session, so we have no ear-count detail to add.
Ground Truth: The bushels USDA found are the ones least far along. An 11-bushel revision in a state DTN describes as well behind on harvest rests more on field counts and farmer reports than on scale tickets. That argues for treating Nebraska's 188 as the number most likely to move again on November 10, in either direction. It also undoes part of the basis read we gave in September. We wrote that western feeders and ethanol plants would reach east for corn [10]. With 106 million bushels put back in Nebraska and 61 million in South Dakota and Kansas, that pull is weaker, and the Iowa-to-Plains basis spread should narrow from the Plains side.
3. The feed line: the old year was cut as we said, the new year was not
What's new: USDA lowered 2025/26 feed and residual use from 6.350 billion bushels to 6.119 billion, a cut of 231 million [1][11]. It then raised the 2026/27 figure 50 million, to 6.000 billion [1].
Evidence: On October 1 we estimated the old-year figure would fall to about 6.120 billion. That held. We also wrote that we thought "October's revision will reach the new-crop year," meaning a lower 2026/27 feed figure, and showed scenarios with cuts of 100 and 215 million bushels [11]. USDA moved the line up. That call was wrong.
| Feed and residual | 2025/26 | 2026/27 | 2026/27 as share of 2025/26 | 2026/27 share of production |
|---|---|---|---|---|
| September WASDE | 6,350 | 5,950 | 93.7% | 37.7% |
| October WASDE | 6,119 | 6,000 | 98.1% | 37.4% |
| September's year-to-year ratio on October's base* | 6,119 | 5,734* | 93.7% | 35.8%* |
Basis: million bushels. Source: USDA WASDE-676, Oct 9, 2026 [1]; September values as published in TRZ-0189 and TRZ-0247 from WASDE-675 [10][11]. Ratios are Crop Root Zone calculations. *Scenario, not a forecast: 6,119 × (5,950 ÷ 6,350).
USDA's logic is internally consistent. It held feed and residual near 37.5% of the crop, as it did in September, and a larger crop therefore got a larger feed number. The inconsistency is with the year just closed: the 2025 crop was 16.964 billion bushels and only 36.1% of it (6,119 ÷ 16,964) went to feed and residual once the stocks were counted [1]. The 2026 crop is 5.5% smaller than 2025's and USDA has feed use falling 1.9%.
Our September rule of thumb also needs correcting. We wrote that USDA's pattern implied 60–65% of each lost bushel would come off feed and residual [10]. On the way up, feed and residual took 50 of 234 added bushels of production, or 21%. The rule held for a cut and did not hold for an increase.
Ground Truth: The 1.849 billion has more room above it than below it on the demand side. If USDA's 2026/27 feed figure kept September's relationship to the prior year, it would be about 5.73 billion, and the carryout would be about 2.115 billion, or 13.2% of use (1,849 + 266, against use of 16,039; our scenario). The first test is the December 1 Grain Stocks report in January. Until then the projection that matters most to the corn price is a 6.0-billion-bushel estimate set as a share of a crop that is itself 23% harvested.
4. Soybeans: three small changes and no price change
What's new: Beginning stocks fell 10 million bushels on the stocks count, production rose 27 million on the yield, exports rose 10 million, and ending stocks rose 5 million to 315 million. The season-average price stayed at $12.00, soybean meal at $340 per short ton and soybean oil at 70 cents per pound [1].
Evidence:
| Soybeans (million bu) | 2025/26 est. | 2026/27 Sept. | 2026/27 Oct. | Oct. vs. Sept. |
|---|---|---|---|---|
| Yield (bu/acre) | 53.0 | 52.8 | 53.1 | +0.3 |
| Beginning stocks | 325 | 325 | 315 | −10 |
| Production | 4,261 | 4,535 | 4,562 | +27 |
| Imports | 22 | 25 | 25 | 0 |
| Total supply | 4,608 | 4,885 | 4,902 | +17 |
| Crushings | 2,646 | 2,780 | 2,780 | 0 |
| Exports | 1,515 | 1,685 | 1,695 | +10 |
| Seed | 75 | 73 | 73 | 0 |
| Residual | 57 | 38 | 39 | +1 |
| Total use | 4,293 | 4,575 | 4,587 | +12 |
| Ending stocks | 315 | 310 | 315 | +5 |
| Stocks-to-use* | 7.3% | 6.8% | 6.9% | +0.1 pt |
| Season-average farm price ($/bu) | 10.50 | 12.00 | 12.00 | 0.00 |
Basis: U.S. marketing year beginning September 1. Source: USDA WASDE-676, Oct 9, 2026 [1]. *Crop Root Zone calculation.
On October 1 we carried the 10-million-bushel stocks shortfall forward one-for-one and put the 2026/27 carryout near 300 million, or 6.6% of use [11]. The yield increase more than covered it. Illinois went from 66 to 68 bushels and Ohio from 59 to 62; Iowa, Nebraska, Kansas and Missouri were each cut 1 to 2 bushels [2].
Two details matter more than the 5 million. First, USDA closed the old year by lowering 2025/26 crush to 2.646 billion and exports to 1.515 billion, from the 2.655 billion and 1.520 billion it carried in September [1][12]. Lower measured use and lower stocks can only be reconciled in the residual, which is 57 million bushels for 2025/26 against 14 million the year before [1]. Second, DTN reports export commitments running 80% ahead of a year ago, largely on Chinese buying [5], and USDA added only 10 million bushels to exports.
The price relationship moved without the soybean price moving. USDA's season-average prices now stand at 2.55 bushels of corn per bushel of soybeans ($12.00 ÷ $4.70), up from 2.50 in September [1]. November soybeans settled Friday at $12.92 by Brownfield's close and $12.94 by DTN's, up 4½ cents on a day December corn lost 20½ [5][6].
5. What it means for 2026 bushels and the 2027 corn-versus-soybean decision
What's new: The old-crop board took the report in one session. The 2027 board mostly did not. December 2027 corn was quoted at $5.12 on October 12, against $5.17¼ on October 8, and November 2027 soybeans at $12.62 against $12.59 (FXEmpire delayed quotes, Oct 12, 2026) [9][13].
Evidence, 2026: At USDA's 181.2-bushel national yield, Friday's 20½-cent loss is about $37 an acre on unpriced corn (0.205 × 181.2 = $37.15). December corn has now fallen 57 cents from its September 22 settlement of $5.36¾ [6][11]. farmdoc's 2026 budget for central Illinois high-productivity farmland uses 240 bushels and a $4.95 corn price for a farmer return of $59 an acre after $321 of cash rent, with a break-even of $4.82 before government and insurance payments (farmdoc daily, Sep 1, 2026) [8]. Every 10 cents on that acre is $24. A realized price of $4.70 instead of $4.95 takes the return from $59 to −$1 (our arithmetic on farmdoc's budget, holding its $27 of ARC/PLC and insurance proceeds fixed). The 2026 projected insurance price of $4.62, as we reported on October 1 from a February DTN article we did not reopen for this piece [11], is now about 18 cents under Friday's December settlement, and October is the averaging month.
The carry is the one piece of the old-crop market that improved for the seller with a bin. July corn was quoted 27 cents over December on October 12, and March 14¼ cents over [9]. Our October 1 storage table put on-farm cost to March at 18 to 23 cents a bushel, on our own storage-cost assumptions [11].
Evidence, 2027: farmdoc's 2027 budget for the same farmland assumes 245 bushels of corn at $5.00 and 77 bushels of soybeans at $12.00, non-land costs of $885 and $534, cash rent of $321 and a $17 ARC/PLC payment on each [8]. Its farmer returns are $36 for corn and $86 for soybeans.
| 2027, central Illinois high-productivity farmland | Corn price ($/bu) | Corn return ($/acre) | Soybean price ($/bu) | Soybean return ($/acre) | Soybeans minus corn ($/acre) |
|---|---|---|---|---|---|
| farmdoc budget, Sept. 1 | 5.00 | 36.00 | 12.00 | 86.00 | 50.00 |
| Oct. 12 board less assumed basis* | 4.87 | 4.15 | 12.27 | 106.79 | 102.64 |
| USDA's 2026/27 corn price applied to 2027* | 4.70 | −37.50 | 12.00 | 86.00 | 123.50 |
| Corn price that ties $12.00 soybeans* | 5.20 | 86.00 | 12.00 | 86.00 | 0.00 |
Basis: $/acre after all costs including cash rent. Source: farmdoc daily, Sep 1, 2026, Tables 1 and 2 [8]; FXEmpire delayed quotes, Oct 12, 2026 [9]. *Crop Root Zone scenarios. Corn return = 245 × price + 17 − 885 − 321; soybean return = 77 × price + 17 − 534 − 321. The basis row subtracts 25 cents from December 2027 corn and 35 cents from November 2027 soybeans, the assumption we used in TRZ-0263 [13]; it is an assumption, not a posted bid, and we could not re-verify the university convention behind it this session. The tie price is 5.204 before rounding. USDA has published no 2027/28 price; the third row is a what-if.
farmdoc's break-evens to cover all costs are $4.92 for corn and $11.10 for soybeans [8]. Corn at the October 12 board less our assumed basis sits 5 cents under its break-even. Soybeans sit $1.17 over theirs. The corn acre also carries $263 of fertilizer against $77 for soybeans [8], and most of that $186 difference is committed when fall nitrogen goes on.
Ground Truth: October's report moved the 2027 decision more than the 2027 board shows. December 2027 corn gave up 5¼ cents while December 2026 gave up 20½ in a session, so the deferred contract is still pricing a corn balance sheet tighter than the one USDA just published. A grower with rotation acres that could go either way has two things to do with that gap, and they pull the same direction. One is to treat any December 2027 price that nets above $4.92 at the farm as corn's break-even being offered, which on a 25-cent basis means about $5.17 on the board, 5 cents above the October 12 quote. The other is to hold fall nitrogen on the marginal corn acres until that price is available, because anhydrous applied this month commits those acres to the crop that needs $5.20 to tie. Nothing in the soybean balance sheet, at 6.9% of use with exports raised only 10 million against an 80% lead in commitments, argues the other way.
What to watch: the November 10 Crop Production and WASDE, with Nebraska's 188 first [2]; the October average of December corn against $4.62; weekly soybean export sales against a 1.695-billion-bushel forecast; and the December 1 Grain Stocks count in January, the first measure of whether 6.0 billion bushels of feed and residual is real.
References
- USDA World Agricultural Outlook Board, World Agricultural Supply and Demand Estimates, WASDE-676, Oct 9, 2026 (narrative; U.S. Feed Grain and Corn Supply and Use, p. 12; U.S. Soybeans and Products Supply and Use, p. 15) — https://www.usda.gov/oce/commodity/wasde/wasde1026.pdf
- USDA National Agricultural Statistics Service, Crop Production, released Oct 9, 2026 (forecasts as of Oct 1, 2026; corn and soybean state tables read, objective-yield tables not read; next release listed for Nov 10, 2026) — https://esmis.nal.usda.gov/sites/default/release-files/796101/crop1026.txt
- DTN/Progressive Farmer, R. Montgomery, "US Harvests Delayed, USDA to Gauge Crop Sizes" (USDA Reports Preview; pre-report estimate tables), Oct 7, 2026 — https://www.dtnpf.com/agriculture/web/ag/news/article/2026/10/07/us-harvests-delayed-usda-gauge-crop
- DTN/Progressive Farmer, DTN Staff, "USDA Raises Corn Yield 2.7 BPA to 181.2 BPA" (USDA Reports Summary), Oct 9, 2026 — https://www.dtnpf.com/agriculture/web/ag/news/article/2026/10/09/usda-raises-corn-yield-2-7-bpa-181-2
- DTN/Progressive Farmer, D. Mantini, "October WASDE's Shocking Rise in Corn Yield, Production Sends Futures Briefly Limit Down" (USDA Reports Review), Oct 9, 2026 — https://www.dtnpf.com/agriculture/web/ag/news/article/2026/10/09/october-wasdes-shocking-rise-corn
- Brownfield Ag News, "Closing Grain and Livestock Futures: October 9, 2026," Oct 9, 2026 — https://www.brownfieldagnews.com/market-news/closing-grain-and-livestock-futures-october-9-2026/
- DTN/Progressive Farmer, E. Reiff, "USDA Crop Progress: Corn 23% Harvested, Soybeans 25% Harvested as of Oct. 4," Oct 5, 2026 — https://www.dtnpf.com/agriculture/web/AG/news/article/2026/10/05/usda-crop-progress-corn-23-harvested
- N. Paulson, G. Schnitkey, C. Zulauf and B. Zwilling, "Illinois Crop Budgets for 2027," farmdoc daily (16):157, University of Illinois, Sep 1, 2026 (Tables 1 and 2, read from the PDF edition) — https://farmdocdaily.illinois.edu/2026/09/illinois-crop-budgets-for-2027.html
- FXEmpire, CBOT corn and soybean futures contract tables, delayed quotes stamped 12:44 UTC, Oct 12, 2026 (quotes, not settlements) — https://www.fxempire.com/commodities/zc/contracts and https://www.fxempire.com/commodities/zs/contracts
- Crop Root Zone, TRZ-0189, "USDA Took 236 Million Bushels Out of Corn Supply. 150 Million of Them Came Out of Feed Demand, Not the Carryout.," Sep 14, 2026 (August and September 2026/27 corn balance sheets and September state yields, from USDA WASDE-675 and Crop Production, Sep 11, 2026).
- Crop Root Zone, TRZ-0247, "Old-Crop Corn Counted 2.095 Billion Bushels, 173 Million Over USDA. The Summer Quarter Grew 3.4%, Not the 9.1% USDA's Figure Needed.," Oct 1, 2026 (carry-in scenarios; September 2025/26 feed and residual; September 22 December corn settlement; 2026 projected insurance price; storage costs).
- Crop Root Zone, TRZ-0192, "USDA Raised the Soybean Price 60 Cents on a Crop That Got Bigger. Soybean Meal Did Almost All of the Arithmetic.," Sep 14, 2026 (September 2025/26 soybean crush and exports, from USDA WASDE-675, Sep 11, 2026).
- Crop Root Zone, TRZ-0263, "Financing a 2027 Illinois Corn Acre Costs $35 to $55 in Interest at 7.12%, or 7 to 11 Bushels.," Oct 8, 2026 (October 8 quotes for December 2027 corn and November 2027 soybeans; 25-cent and 35-cent new-crop basis assumption).
Disclosures
Crop Root Zone is an independent publication. Nothing here is investment advice. Market calls, where included, reflect the editors' own read and are not a recommendation to buy or sell any security.
A Ton of Alfalfa Hay Carries Off $27 to $33 of Phosphate and Potash, 13% to 16% of the $206 Farm Price. A Ton of Potash Costs 2.4 Tons of Hay, Down From 3.5 in 2021. On Corn Rent, a 6-Ton Stand Needs $168 Hay to Match Corn.
At DTN's Sep 28–Oct 2 retail prices of $974 for MAP and $499 for potash, five university removal figures put replacement at $26.87 to $32.97 per ton of hay, about two-thirds of it potash. On USDA's August prices that is 10% to 12% of the hay check in Pennsylvania and 21% to 25% in Iowa. On Optimum-testing ground, skipping a year of potash defers about $89 an acre and earns about $14. The trial record puts the risk in low-testing soils and young stands, and finds no case for fall timing as such. Iowa State's budget, with fertilizer repriced, breaks even at $149 a ton for a 6-ton stand on $274 rent.
Every ton of alfalfa hay that leaves a field takes 10 to 13 lb of phosphate and 42 to 51 lb of potash with it. At the retail prices DTN collected for the week of Sep 28–Oct 2, $974 a ton for MAP and $499 for potash (DTN/Progressive Farmer, Oct 7, 2026) [1], putting those pounds back costs $26.87 to $32.97 per ton of hay. USDA's August farm price for alfalfa hay was $206 a ton (USDA NASS, Sep 29, 2026) [2]. Replacement is therefore 13% to 16% of the national hay check, 10% to 12% of it in Pennsylvania and 21% to 25% in Iowa. A corn crop takes about $19 an acre of potash off the field [20]. A 5-ton alfalfa crop takes $89 to $106. That is why the fall question on an established stand is a potash question, and why this piece prices it per ton of hay, per acre, and against corn on the same ground. The trial record changes the question we started with. It does not support fall timing as such. It supports putting potash on low-testing soils and young stands, and it shows that a skipped year on high-testing ground or on a stand in its last season costs little.
1. What a ton removes, and what the pounds cost this week
What's new: Potash at $499 is the highest of the 14 survey weeks in DTN's table, which runs back to $483 in the first week of October 2025. MAP is up 6% on the year, DAP 3% and potash 3% (DTN/Progressive Farmer, Oct 7, 2026) [1]. Our Sep 24 piece on corn used the Sep 14–18 survey: DAP $925, potash $495 [20]. The move since is under 1%.
Evidence: Alfalfa fixes its own nitrogen, so the nitrogen in MAP or DAP earns nothing on an established stand. We price phosphate through MAP, the cheaper source per pound of P2O5, and take no nitrogen credit.
| Product | $/ton | Nutrient, lb/ton | $/lb nutrient | Year-over-year | Basis |
|---|---|---|---|---|---|
| MAP (11-52-0) | 974 | 1,040 P2O5 | 0.937 | +6% | Delivered retail, US avg, Sep 28–Oct 2 |
| DAP (18-46-0) | 934 | 920 P2O5 | 1.015 | +3% | Delivered retail, US avg, Sep 28–Oct 2 |
| Potash (0-0-60) | 499 | 1,200 K2O | 0.416 | +3% | Delivered retail, US avg, Sep 28–Oct 2 |
Source: DTN/Progressive Farmer, Oct 7, 2026 [1]. Per-pound values are Crop Root Zone calculations with no nitrogen credit.
The removal figure depends on which university's number is used and, more than most users notice, on the moisture basis. Wisconsin and the Tri-State bulletin quote removal per ton of dry matter. Iowa State quotes it per ton of hay at 15% moisture. A ton of 15% hay holds 0.85 ton of dry matter, so the dry-matter figures have to be multiplied by 0.85 before they are applied to a scale ticket.
| Source | As published, lb P2O5 / K2O per ton | Per ton of hay at 15% moisture, lb P2O5 / K2O | Phosphate, $/ton hay | Potash, $/ton hay | Total, $/ton hay | Share of $206 hay |
|---|---|---|---|---|---|---|
| Iowa State 2026 crop budget | 13 / 50, per ton removed | 13 / 50 | 12.18 | 20.79 | 32.97 | 16.0% |
| Missouri 2026 alfalfa budget | 50 / 200 on 4 tons | 12.5 / 50 | 11.71 | 20.79 | 32.50 | 15.8% |
| Wisconsin A2809 | 13 / 60, dry matter | 11.1 / 51.0* | 10.35 | 21.21 | 31.56 | 15.3% |
| Iowa State PM 1688 (2013 edition) | 13 / 43, at 15% | 13 / 43 | 12.18 | 17.88 | 30.06 | 14.6% |
| Tri-State Bulletin 974 | 12 / 49, dry matter | 10.2 / 41.7* | 9.55 | 17.32 | 26.87 | 13.0% |
Basis: replacement cost at $0.937/lb P2O5 (MAP) and $0.416/lb K2O, delivered retail, no spreading charge. Sources: Iowa State University, Jan 2026 [3]; University of Missouri Extension, Oct 2025 [7]; University of Wisconsin, A2809 [5]; Iowa State University, PM 1688, Oct 2013 [4]; Tri-State Fertilizer Recommendations, 2020 [6]; prices from DTN/Progressive Farmer, Oct 7, 2026 [1]; hay price from USDA NASS, Sep 29, 2026 [2]. *Crop Root Zone conversion: dry-matter figure × 0.85. Dollar columns and shares are Crop Root Zone calculations. Priced through DAP instead of MAP, the totals run $27.67 to $33.99.
Two cautions on the table. Iowa State's guide says its concentrations sit near the 75th percentile of available data and reflect good-quality hay [4], so they lean high for an average bale. And we could open only the 2013 edition of PM 1688. The February 2023 revision that our Sep 24 piece cited for corn and soybeans [20] may carry different alfalfa figures. Iowa State's own 2026 budget uses 50 lb of K2O per ton, not 43 [3].
$32.97 a ton
Phosphate and potash leaving the field in each ton of alfalfa hay, at Iowa State's budget rate of 13 lb P2O5 and 50 lb K2O and this week's retail MAP and potash. Potash is $20.79 of it. (Crop Root Zone calculation from Iowa State University, Jan 2026 [3] and DTN/Progressive Farmer, Oct 7, 2026 [1])
Potash is 60% to 67% of the bill under every source. Phosphate drove the fall bill ahead of corn [20]. On alfalfa the money is in the potash.
2. Against the hay check
What's new: The U.S. alfalfa hay price was $206 a ton in August, up from $203 in July and $171 in August 2025. Other hay was $152. Premium and Supreme alfalfa in the five largest milk states averaged $243 (USDA NASS, Sep 29, 2026) [2].
Evidence: The removal cost per ton barely changes from state to state. The hay price changes a great deal, so the share does too.
| State | Alfalfa hay, Aug 2026, $/ton | Aug 2025, $/ton | Removal cost as share of Aug 2026 price* | |
|---|---|---|---|---|
| Pennsylvania | 280 | 245 | 9.6%–11.8% | ████░░░░░░ |
| California | 235 | 230 | 11.4%–14.0% | ████░░░░░░ |
| Idaho | 210 | 155 | 12.8%–15.7% | █████░░░░░ |
| United States | 206 | 171 | 13.0%–16.0% | █████░░░░░ |
| Ohio | 205 | 190 | 13.1%–16.1% | █████░░░░░ |
| Illinois | 175 | 160 | 15.4%–18.8% | ██████░░░░ |
| Wisconsin | 151 | 120 | 17.8%–21.8% | ███████░░░ |
| Minnesota | 145 | 97 | 18.5%–22.7% | ███████░░░ |
| Iowa | 131 | 103 | 20.5%–25.2% | ████████░░ |
| Kansas | 127 | 121 | 21.2%–26.0% | ████████░░ |
| Nebraska | 104 | 101 | 25.8%–31.7% | ██████████ |
| South Dakota | 101 | 93 | 26.6%–32.6% | ██████████ |
Basis: prices received by farmers, all grades and bale types, dollars per ton. Source: USDA NASS Agricultural Prices, Sep 29, 2026 [2]. *Crop Root Zone calculation: $26.87 to $32.97 per ton, the low and high rows of the removal table, divided by the state price. Bars scale the high end of the range, with South Dakota at ten blocks.
The NASS figure is an average over every grade and package a state sells, and in the Plains it sits far below what graded hay brings. In eastern Nebraska, Good alfalfa in large squares traded at $200 a ton and Supreme at $275, FOB. In western Nebraska, Good to Premium large squares averaged $286.25 (USDA AMS, Oct 8, 2026) [13]. At the Corsica, South Dakota auction on Oct 5, Good alfalfa in large rounds averaged $225.49 on 70 tons (USDA AMS, Oct 6, 2026) [14]. Those are thin volumes, 25 to 800 tons a line. At $200 hay the removal cost is 13% to 16% of the price. At $286 it is 9% to 12%. A grower should use the price of the hay actually sold, not the state average.
Potash against hay has moved more than potash itself. The table sets national retail potash from DTN's late-September or October survey beside USDA's August alfalfa price for the same year.
| Year | Retail potash, $/ton | US alfalfa hay, August, $/ton | Tons of hay per ton of potash* | Potash in a ton of hay (50 lb K2O), $* | Share of hay price* |
|---|---|---|---|---|---|
| 2021 | 731 | 206 | 3.55 | 30.46 | 14.8% |
| 2022 | 874 | 275 | 3.18 | 36.42 | 13.2% |
| 2023 | 506 | 230 | 2.20 | 21.08 | 9.2% |
| 2024 | 448 | 175 | 2.56 | 18.67 | 10.7% |
| 2025 | 483 | 171 | 2.82 | 20.13 | 11.8% |
| 2026 | 499 | 206 | 2.42 | 20.79 | 10.1% |
Basis: potash is the DTN national retail average for the survey weeks of Oct 25–29, 2021; Sep 26–30, 2022; Oct 9–13, 2023; Oct 7–11, 2024; Sep 29–Oct 3, 2025; and Sep 28–Oct 2, 2026. Sources: DTN/Progressive Farmer, Nov 2, 2022 [17]; Oct 15, 2024 [18]; Oct 7, 2026 [1]. Hay prices from USDA NASS Agricultural Prices, Sep 30, 2021; Sep 27, 2024; Sep 30, 2025; and Sep 29, 2026 [2][15], and for August 2022 from USDA NASS Nevada Hay Prices, Sep 30, 2022 [16]. The 2021 and 2022 hay prices are first prints; later years are as revised in the following year's report. *Crop Root Zone calculations.
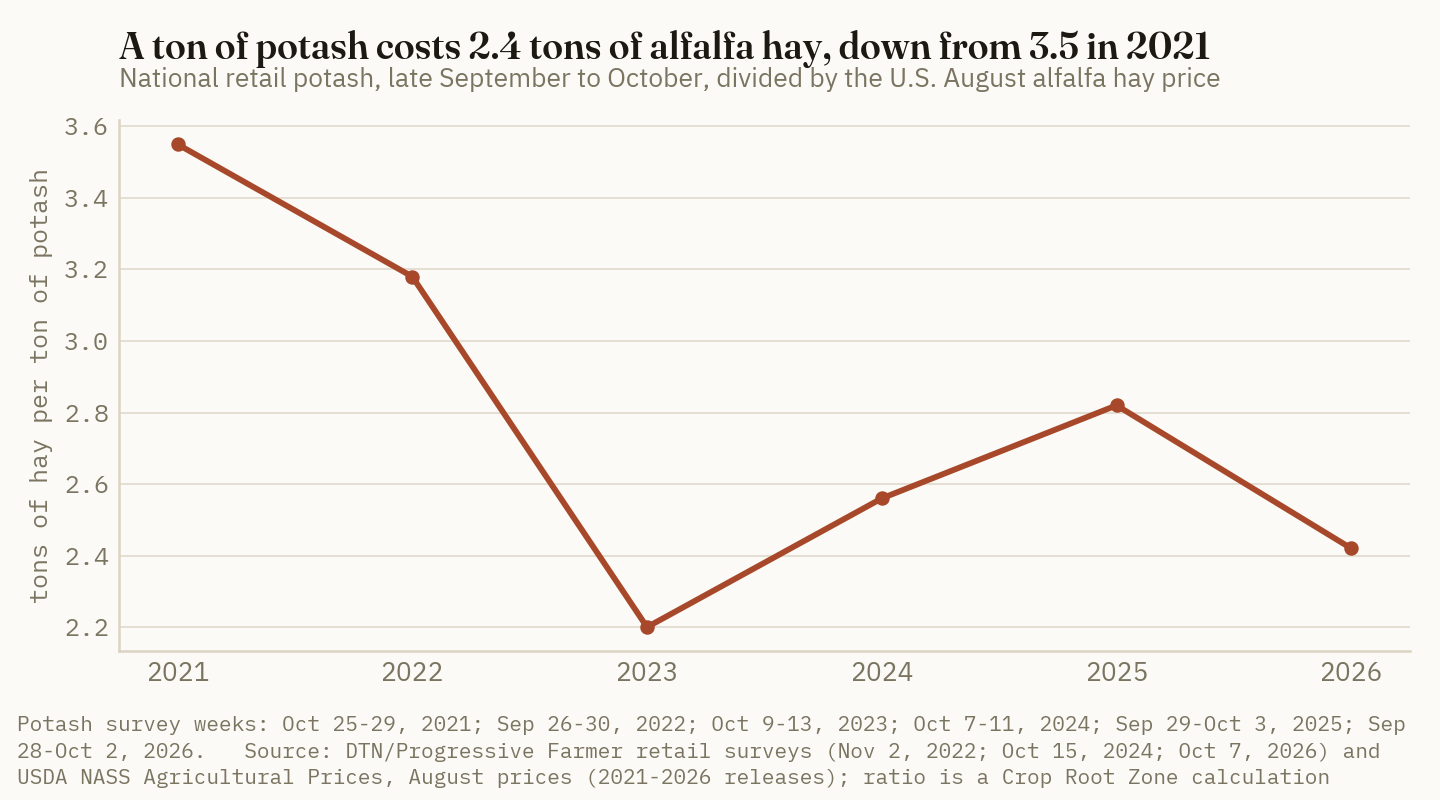
Our Sep 16 piece found potash 15% to 20% cheaper in bushels of corn than a year earlier [22]. In tons of hay it is 14% cheaper: 2.42 against 2.82. Hay rose $35 while potash rose $16.
Ground Truth: The state table is a pricing tool for both sides of a hay sale. In Nebraska and South Dakota, where the all-grade average is near $100, each ton sold carries $27 to $33 of phosphate and potash, a quarter to a third of the check. A seller at those prices who is not replacing the nutrients is selling soil test along with the hay. A buyer who feeds that hay on his own ground is buying fertility with the feed, and much of the potassium passes through the animal to wherever it is fed. Neither side of the trade usually prices that. With removal at 30% of a $100 bale and 10% of a $280 one, the low-priced markets are where it most needs to be priced.
3. What a skipped potash year costs: the trial record
What's new: The two best public trial sets point the same way on rate and soil test and different ways on timing. Neither supports potash applied in the fall because it is fall.
Evidence: Purdue. A seven-year study in west-central Indiana started on soil testing 8 ppm P and 70 ppm K. The highest yields came with 50 lb P2O5 and 300 lb K2O a year, or 100 and 200. Higher rates did not add yield. Adequate P and K slowed the decline in yield as the stand aged, so the advantage widened each year. Plots that received phosphate and no potash yielded less than plots that received nothing, and some of them lost the stand entirely by year seven, while unfertilized plots persisted at low yield. In the study's digestibility table the unfertilized treatment yielded 1,087 lb of forage an acre against 2,324 lb with 50 lb P2O5 and 200 lb K2O; the publication does not say which harvest that table covers. Purdue's advice is a split application after the first and last harvests (Purdue Extension, AY-331-W, Mar 2009) [8].
Minnesota. A four-year study at three sites applied up to 403 kg K/ha (about 433 lb K2O an acre) to eight varieties. At the lowest-testing site potash raised yield up to a plateau at 296 kg K/ha, about 318 lb K2O an acre. At the highest-testing site it did nothing (Jungers et al., Agronomy Journal, Nov 2019) [9]. Those sites tested 35 ppm and 160 ppm. Yields were greatest in one- and two-year-old stands, there was no response in four-year-old stands, and potash did not raise stand or stem density (C. Sheaffer, No-Till Farmer, Aug 2, 2019) [11]. Potash did not extend productive life past the third production year (American Society of Agronomy, Oct 16, 2019) [12]. The university's extension summary of the 2011–2014 work, which ran through some severely cold winters, reported no difference in spring stands between alfalfa that received fall potash and alfalfa that did not. The university's advice is one application during the growing season at the recommended rate, with priority to new seedings and young stands (University of Minnesota Extension, Oct 2019) [10]. Potash also lowered forage quality and raised forage K in both states' work, and Purdue flags forage above 3% K as a milk fever risk [8][9].
Read together: 70 ppm is far below the Tri-State maintenance range of 120 to 170 ppm for alfalfa on loam and clay soils [6], and there a missing potash program cost yield every year and eventually the stand. At 160 ppm it cost nothing measurable in four years.
The table prices one year's potash recommendation for a 5-ton stand and converts it to the yield it has to protect.
| Soil-test K category | Iowa State, lb K2O/acre | Cost, $/acre* | Break-even response at $206 hay, tons/acre* | At $131 hay, tons/acre* | Wisconsin, lb K2O/acre | Cost, $/acre* |
|---|---|---|---|---|---|---|
| Very low | 280 | 116.43 | 0.57 | 0.89 | 355 | 147.62 |
| Low | 240 | 99.80 | 0.48 | 0.76 | 340 | 141.38 |
| Optimum | 215 | 89.40 | 0.43 | 0.68 | 300 | 124.75 |
| High | 0 | 0.00 | — | — | 150 | 62.38 |
| Very high | 0 | 0.00 | — | — | 75 | 31.19 |
Basis: potash at $0.416/lb K2O delivered retail, no spreading charge. Iowa State rates are for 5 tons of hay an acre, with Optimum at 161–200 ppm on dried samples in the 2013 edition (Iowa State University, PM 1688, Oct 2013) [4]. Wisconsin rates are for a 4.6–5.5 ton dry-matter yield goal, which is about 5.4 to 6.5 tons of 15% hay, with Optimum at 111–140 ppm on loamy soils (University of Wisconsin, A2809) [5]. Price from DTN/Progressive Farmer, Oct 7, 2026 [1]; hay prices from USDA NASS, Sep 29, 2026 [2] (US and Iowa). *Crop Root Zone calculations. The break-even response is the Iowa State cost divided by the hay price.
Iowa State expects a yield response to P or K in about 25% of Optimum-testing cases, 65% of Low and 80% of Very Low [4]. At a 25% chance, the average response when one occurs would have to be 1.7 tons an acre, a third of the crop, for the Optimum-rate application to pay back in the same year at $206 hay. That is an estimate from two published numbers, and it says the first-year yield risk of a skip on Optimum ground is small. On Low ground the same arithmetic needs 0.74 ton, 15% of the crop, and Purdue's low-testing plots lost far more than that.
The cost of a skip on Optimum ground arrives later, in three ways.
Replacement. The pounds are still removed. A 5-ton crop takes 215 to 255 lb of K2O at 43 to 51 lb a ton. A skipped Optimum-rate application defers $89.40. At the 7.12% operating rate we used on Oct 8 [21], a year's interest on that is $6.37. Missouri budgets custom dry spreading at $14.74 for two passes [7], so a saved pass is $7.37. The skip earns about $14 an acre if potash costs the same next year.
Soil test. Iowa State puts the average at 8 to 10 lb of K2O per ppm of soil-test K, within a range of 6 to 20 [4]. On that average, one unreplaced 5-ton crop is 22 to 32 ppm, most of a 40 ppm Optimum band. That is our arithmetic, and it is a ceiling. Minnesota measured soil-test K holding steady at removal of 167 to 268 kg K/ha a year, depending on site, and attributed it to potassium released from the soil's own reserves [9]. Wisconsin tells growers to retest every two years under alfalfa for this reason [5].
Stand life. Iowa State charges one-third of a $216 establishment cost to each production year, $72 an acre [3]. Missouri spreads $342.60 over four years, $85.65 [7]. If a stand is taken out a year early, Iowa State's charge becomes $108 and Missouri's $114.20. A lost year of stand life costs $29 to $36 an acre for every year the stand did produce. Wisconsin adds 20% to topdressed K2O where a stand is to be kept more than three years [5].
Ground Truth: The first-year yield arithmetic says an Optimum-ground skip is safe, and the soil-test arithmetic says it is not repeatable. One skipped year can use most of the Optimum band, and the next year's decision is then made at 65% response odds, not 25%. The skip earns about $14 an acre. One lost year of stand life costs $29 to $36 a year across the stand's whole life. Stand age is the variable that sorts it. Minnesota found the yield response in one- and two-year-old stands and none in four-year-old stands. On a stand going into its final season ahead of corn, potash on Optimum or High ground has no stand life left to protect, and corn will ask for only about 63 lb of K2O [3]. That is the acre to skip. A stand seeded in 2025 or 2026 on ground testing Low is the acre that gets potash first, and it should not get phosphate alone: Purdue's dead plots were the ones that received P without K.
4. Alfalfa against corn on the same ground
What's new: No university has published a 2027 alfalfa budget that we could find. The 2027 budgets in print are for grain. farmdoc projects a return of $28 to $36 an acre on corn in northern and central Illinois at $5.00 corn, after cash rent (farmdoc daily, Sep 1, 2026) [19]. The comparison below is therefore built from the one publication that budgets both crops the same way, Iowa State's 2026 edition, with three stated adjustments.
Evidence: Iowa State's January budget puts corn after soybeans at $911.98 an acre for 211 bushels, including $274 of rent, and established alfalfa in large round bales at $803.86 for 6 tons and $596.80 for 4 tons [3]. Its alfalfa budgets assume cheaper land, $206 and $150. We put all three on $274 rent, reprice the fertilizer lines at this week's DTN retail, and price corn at farmdoc's $5.00.
| Per acre | Corn after soybeans, 211 bu | Alfalfa, 6 tons, large rounds | Alfalfa-grass, 4 tons, large rounds |
|---|---|---|---|
| Iowa State 2026 total cost, as published, $ | 911.98 | 803.86 | 596.80 |
| Land charge in that total, $ | 274.00 | 206.00 | 150.00 |
| Fertilizer, as published, $ | 165.72 | 173.16 | 115.44 |
| Fertilizer at Sep 28–Oct 2 retail, $* | 195.10 | 197.80 | 131.87 |
| Total cost on $274 rent, fertilizer repriced, $* | 941.36 | 896.50 | 737.23 |
| Break-even price* | $4.46/bu | $149.42/ton | $184.31/ton |
| Return at $5.00 corn, $* | 113.64 | ||
| Hay price that matches the corn return, $/ton* | 168.36 | 212.72 | |
| Return at Iowa's $131 hay, $* | −110.50 | −213.23 | |
| Return at Illinois' $175 hay, $* | 153.50 | −37.23 | |
| Return at the US $206 hay, $* | 339.50 | 86.77 |
Basis: $/acre, all costs including labor and land, no storage. Source: Iowa State University, Estimated Costs of Crop Production in Iowa 2026, Jan 2026 [3] (alfalfa fertilizer at 13 lb P2O5 and 50 lb K2O per ton removed; corn at 159 lb N, 79 lb P2O5, 63 lb K2O). Fertilizer repriced from DTN/Progressive Farmer, Oct 7, 2026 [1]: $0.937/lb P2O5 (MAP), $0.416/lb K2O, $0.597/lb N (anhydrous at $979). Corn price from farmdoc daily, Sep 1, 2026 [19]. Hay prices from USDA NASS, Sep 29, 2026 [2]. *Crop Root Zone calculations. This is a 2026 budget repriced for fertilizer only, not a 2027 budget. Seed, chemicals, machinery and labor are at January 2026 levels for all three columns.
The corn column comes out well above farmdoc's $28 to $36. Iowa State's cost per bushel is lower than Illinois', its machinery and seed lines predate this year's fuel and input increases, and its rent is lower. A reader who prefers farmdoc's figure can substitute it: against a $36 corn return the 6-ton stand needs $155 hay to match and the 4-ton stand $193. Both are our arithmetic.
Missouri's budget is a second check. It shows a 4-ton stand in large round bales at $175 a ton: $700 of income, $681.88 of total cost, $18.12 over all costs, with fertilizer at $120.50, 18% of the total (University of Missouri Extension, Oct 2025) [7].
On the 6-ton Iowa column, phosphate and potash are $197.80 of $896.50, or 22% of cost. Potash alone is $124.75.
Ground Truth: Alfalfa against corn is decided by the hay price and the yield, not by fertilizer. A $50 move in retail potash changes the 6-ton stand's cost by $12.50 an acre. A $10 move in hay changes its return by $60. At the Iowa all-grade average of $131, a 6-ton stand on corn rent loses $110 an acre and corn makes $114. At $175 the same stand beats corn by $40, and at $206 by $226. The NASS average includes round bales sold at harvest to the nearest cow herd. The grower with dairy-quality hay, a tested lot and a shed is not selling into that average, and the grower without them should run the budget at $131, not $206. Two tons of yield matter as much: the break-even falls from $184 to $149 between 4 and 6 tons, and most of the potash decision in Section 3 is about which of those two stands the field will be in year three.
5. Making the call this fall
Sample by stand, and act on the category. Every number in Section 3 depends on a soil test taken recently enough to trust. Wisconsin's two-year interval under alfalfa [5] is the working rule. A sample pulled before the stand was seeded does not describe it now.
Rank the stands. Low-testing ground under a young stand comes first and gets potash with any phosphate. Optimum ground under a stand with two or more seasons left gets the removal rate, 43 to 51 lb of K2O per ton of expected yield. Optimum or High ground under a stand in its last season is where a skip costs least.
Do not pay for timing. Purdue splits after the first and last cuttings [8]. Minnesota found no stand benefit from fall application and advises one application in the growing season [10]. Neither result supports paying a premium, or accepting a worse price, to get potash on this month in place of after first cutting. Potash has moved $16 in a year [1]. The date on the invoice matters less than the rate and the field.
Price the hay with its nutrients in it. At $27 to $33 a ton, removal is a real line in any standing-hay or by-the-bale sale, and the largest single input cost in a hay budget.
What we could not establish: a published 2027 alfalfa budget, and trial data that isolates the yield cost of one skipped potash year on Optimum-testing ground. The estimates above bracket that cost. They do not measure it.
References
- DTN/Progressive Farmer, Russ Quinn, "UAN32 Leads Fertilizer Prices Higher," Oct 7, 2026 (retail survey Sep 28–Oct 2, 2026) — https://www.dtnpf.com/agriculture/web/ag/crops/article/2026/10/07/uan32-leads-fertilizer-prices-higher
- USDA National Agricultural Statistics Service, Agricultural Prices, released Sep 29, 2026 (August 2026 prices received for hay by type, by state; Premium and Supreme alfalfa) — https://www.nass.usda.gov/Publications/Todays_Reports/reports/agpr0926.pdf
- Iowa State University Extension and Outreach, "Estimated Costs of Crop Production in Iowa – 2026," Ag Decision Maker File A1-20 (FM 1712), revised Jan 2026 — https://www.extension.iastate.edu/agdm/crops/pdf/a1-20.pdf
- Iowa State University Extension and Outreach, PM 1688, "A General Guide for Crop Nutrient and Limestone Recommendations in Iowa," revised Oct 2013 (Tables 1, 2 and 10; the Feb 2023 revision could not be opened for this piece) — https://www.agronext.iastate.edu/soilfertility/info/PM%201688%202013.pdf
- C. Laboski and J. Peters, "Nutrient Application Guidelines for Field, Vegetable, and Fruit Crops in Wisconsin," University of Wisconsin-Extension A2809 (Tables 4.2, 7.2 and 7.4), accessed Oct 9, 2026 — https://cdn.shopify.com/s/files/1/0145/8808/4272/files/A2809.pdf
- Tri-State Fertilizer Recommendations for Corn, Soybean, Wheat, and Alfalfa, Bulletin 974, The Ohio State University, Michigan State University and Purdue University, 2020 (executive summary pages) — https://extensionpubs.osu.edu/content/sample/e974.pdf
- R. Milhollin, C. T. Schnakenberg, C. Roberts, K. Neuner and D. Kientzy, "Alfalfa Hay Planning Budget," University of Missouri Extension G663, revised Oct 2025 (2026 budget) — https://extension.missouri.edu/publications/g663
- S. Lissbrant, W. K. Berg, J. Volenec, S. Brouder, B. Joern, S. Cunningham and K. Johnson, "Phosphorus and Potassium Fertilization of Alfalfa," Purdue Extension AY-331-W, Mar 2009 — https://www.extension.purdue.edu/extmedia/AY/AY-331-W.pdf
- J. M. Jungers, D. E. Kaiser, J. F. S. Lamb, J. A. Lamb, R. L. Noland, D. A. Samac, M. S. Wells and C. C. Sheaffer, "Potassium Fertilization Affects Alfalfa Forage Yield, Nutritive Value, Root Traits, and Persistence," Agronomy Journal 111(6):2843–2852, Nov 2019 (abstract) — https://doi.org/10.2134/agronj2019.01.0011
- P. McDivitt, "Alfalfa doesn't need fall potassium fertilizer application to aid winter hardiness in Minnesota, research shows," University of Minnesota Extension Crop News, Oct 2019 — https://blog-crop-news.extension.umn.edu/2019/10/alfalfa-doesnt-need-fall-potassium.html
- C. Sheaffer, "Alfalfa and Potassium Fertilization: What You Need to Know," No-Till Farmer, Aug 2, 2019 — https://www.no-tillfarmer.com/articles/9010-alfalfa-and-potassium-fertilization-what-you-need-to-know
- American Society of Agronomy, Crop Science Society of America and Soil Science Society of America, news release on Jungers et al., Oct 16, 2019 — https://www.sciencesocieties.org/news/media-releases/releases/2019/1016/1133/
- USDA AMS Livestock, Poultry and Grain Market News, Nebraska Direct Hay Report, Oct 8, 2026 (week ending Oct 9) — https://www.ams.usda.gov/mnreports/ams_2935.pdf
- USDA AMS Livestock, Poultry and Grain Market News, Dakota Hay Auction, Corsica, SD, Oct 6, 2026 (sale of Oct 5) — https://www.ams.usda.gov/mnreports/ams_2245.pdf
- USDA National Agricultural Statistics Service, Agricultural Prices, released Sep 30, 2021; Sep 27, 2024; and Sep 30, 2025 (U.S. alfalfa hay, August prices) — https://www.nass.usda.gov/Publications/Todays_Reports/reports/agpr0921.pdf, agpr0924.pdf and agpr0925.pdf at the same address
- USDA National Agricultural Statistics Service, Pacific Regional Office, "Nevada Hay Prices," released Sep 30, 2022 (August 2022 prices by state and United States) — https://nass.usda.gov/Statistics_by_State/Nevada/Publications/Crop_Releases/Nevada_Hay_Prices/2022/202209NVHAY.pdf
- DTN/Progressive Farmer, "Most Fertilizer Prices Continue Lower," Nov 2, 2022 (price history table, Oct 2021–Oct 2022) — https://www.dtnpf.com/agriculture/web/ag/crops/article/2022/11/02/fertilizer-prices-continue-lower
- DTN/Progressive Farmer, "Most Retail Fertilizer Prices Continue Lower," Oct 15, 2024 (price history table, Oct 2023–Oct 2024) — https://www.dtnpf.com/agriculture/web/ag/crops/article/2024/10/15/retail-fertilizer-prices-continue
- N. Paulson, G. Schnitkey, C. Zulauf and B. Zwilling, "Illinois Crop Budgets for 2027," farmdoc daily (16):157, University of Illinois, Sep 1, 2026 — https://farmdocdaily.illinois.edu/2026/09/illinois-crop-budgets-for-2027.html
- Crop Root Zone, TRZ-0227, "Skipping Fall P&K Ahead of Corn Saves About $87 an Acre. On Ground Testing Optimum, Only About $14 of It Is Real Money.," Sep 24, 2026.
- Crop Root Zone, TRZ-0263, "Financing a 2027 Illinois Corn Acre Costs $35 to $55 in Interest at 7.12%, or 7 to 11 Bushels.," Oct 8, 2026 (7.12% is the Federal Reserve Bank of Chicago's second-quarter 2026 average operating-loan rate).
- Crop Root Zone, TRZ-0199, "A Ton of Potash Costs About 102 Bushels of Corn, Back to Its 2019–20 Level. DAP Still Takes About 190, More Than at the 2022 Peak.," Sep 16, 2026.
Disclosures
Crop Root Zone is an independent publication. Nothing here is investment advice. Market calls, where included, reflect the editors' own read and are not a recommendation to buy or sell any security.
Financing a 2027 Illinois Corn Acre Costs $35 to $55 in Interest at 7.12%, or 7 to 11 Bushels. The Rent Check's Due Date Moves It as Much as the Fertilizer's. Each Month the Line Stays Open Past November Costs $6.28.
On farmdoc's 2027 central Illinois budget, $1,059 of cash costs carries 5.6 to 8.7 months of interest depending on when fertilizer, seed and rent are paid. Soybeans run $23 to $36. Seed cash discounts earn 18% to 43% annualized, and Purdue's and Iowa State's interest lines leave rent out.
A grower lining up 2027 inputs this week is borrowing at a rate nobody has surveyed yet. The Federal Open Market Committee raised its target range a quarter point to 3.75%–4.00% on September 16, by a 12–0 vote (Federal Reserve Board, Sep 16, 2026) [1], and large banks moved the prime rate from 6.75% to 7.00% the next day (Kitco News wire report, Sep 16, 2026) [2]. The newest Federal Reserve district surveys describe the end of June, when Seventh District lenders reported an average operating-loan rate of 7.12% (Federal Reserve Bank of Chicago, Aug 2026) [3]. Our September 16 piece priced each quarter point at about $1.00 an acre on the direct costs of a 2027 Illinois corn crop [17]. This piece asks the other question: how many months of interest the acre carries. On the full cash cost of farmdoc's 2027 central Illinois budget, rent included, the answer runs from 5.6 months to 8.7 depending on three payment dates. That is $35 to $55 an acre for corn and $23 to $36 for soybeans at 7.12%. The date that moves the bill most is not a purchase date at all.
1. What the money costs in October
What's new: Two posted rates have moved since midyear. Prime is 7.00% [2]. USDA's Farm Service Agency set its direct operating loan rate at 5.375% for October, up from 5.250% in September, and its commodity loan rate at 5.250%, up from 5.000% (USDA FSA, Oct 1, 2026) [7][17]. No district survey that postdates the Fed's increase has been published.
Evidence: The surveyed rates are all second-quarter readings.
| Rate | Level | As of | Basis |
|---|---|---|---|
| CCC commodity loan | 5.250% | Oct 1, 2026 | USDA marketing loan on stored grain, under one year |
| FSA direct farm operating loan | 5.375% | Oct 1, 2026 | USDA direct; eligibility and loan limits apply |
| Bank prime rate | 7.00% | Sep 17, 2026 | Index for many variable lines |
| Tenth District survey of loan terms, loans over $100,000 | slightly under 7% | Q2 2026 | Commercial banks, non-real-estate farm loans |
| Seventh District farm operating loans | 7.12% | End Q2 2026 | Chicago Fed survey average |
| Tenth District variable-rate operating loans | 7.39% | Q2 2026 | Kansas City Fed survey, as relayed by Ag Proud |
| Seventh District operating, prime-indexed estimate* | 7.37% | After Sep 17 | 7.12% plus the full 25 basis points |
Sources: USDA FSA, Oct 1, 2026 [7]; Kitco News, Sep 16, 2026 [2]; Federal Reserve Bank of Kansas City, Jul 10, 2026 [5]; Federal Reserve Bank of Chicago, AgLetter, Aug 2026 [3]; Ag Proud, Sep 24, 2026 [6]. *Crop Root Zone estimate for a line that floats with prime. It is not a surveyed rate.
The Kansas City Fed's Tenth District survey described farm loan rates as flat on the quarter, 50 basis points below a year earlier and 120 below mid-2024 (Federal Reserve Bank of Kansas City, Aug 14, 2026) [4]. In the last easing cycle, operating loans in the Chicago survey moved about 77% as far as the policy rate [17]. If that holds on the way up, September's increase is worth roughly 19 basis points on the average new loan and the full 25 on a line indexed to prime.
We use 7.12% as the base rate throughout, because it is the last number a lender survey actually produced, and show 7.37% and one point either side in Section 4. Every per-acre figure below scales in proportion to the rate.
2. Three payment calendars on the same acre
What's new: farmdoc's 2027 budget for corn on central Illinois high-productivity farmland lists $885 of non-land costs and $321 of cash rent (farmdoc daily, Sep 1, 2026) [8]. Strip out machinery and building depreciation, which no one writes a check for, and the budget's own $40 interest line, and $1,059 an acre is paid in cash before the crop is sold. The same exercise on soybeans gives $729. Our September piece financed the $579 of direct costs [17]. This one finances all of it.
Evidence: The three calendars below differ in only three dates. Everything else is held constant: pesticides half in April and half in June, crop insurance in August, drying and storage in October, and $159 of fuel, repairs, machine hire, labor, insurance and miscellaneous overhead drawn evenly from March through November. The line is paid off from grain sales at the end of November 2027, the same convention as our September table [17].
- Front-loaded: all fertilizer paid for in November 2026, seed paid in November for the top cash discount, all rent on March 1.
- Split: half the fertilizer in November and half in April, seed in December, rent half on March 1 and half on November 1.
- Back-loaded: all fertilizer in April, seed paid at spring delivery, rent half and half.
| Corn, per acre | Budget amount, $ | Front-loaded: months / interest, $* | Split: months / interest, $* | Back-loaded: months / interest, $* |
|---|---|---|---|---|
| Fertilizer | 263 | 12 / 18.73 | 12 and 7 / 14.82 | 7 / 10.92 |
| Seed | 134 | 12 / 9.54 | 11 / 8.75 | 7 / 5.57 |
| Pesticides | 119 | 7 and 5 / 4.24 | 7 and 5 / 4.24 | 7 and 5 / 4.24 |
| Crop insurance, drying, storage | 63 | 3 and 1 / 0.79 | 3 and 1 / 0.79 | 3 and 1 / 0.79 |
| Power and overhead paid in cash | 159 | 4.5 avg / 4.25 | 4.5 avg / 4.25 | 4.5 avg / 4.25 |
| Cash rent | 321 | 9 / 17.14 | 9 and 1 / 9.52 | 9 and 1 / 9.52 |
| Total | 1,059 | 54.68 | 42.36 | 35.28 |
| Dollar-weighted months carried | 8.7 | 6.7 | 5.6 |
Basis: $/acre, simple interest at 7.12% to a payoff at the end of November 2027; components may not sum to totals because of rounding. Source: budget amounts from farmdoc daily, Sep 1, 2026 [8] (2027 corn, central Illinois high-productivity farmland; power and overhead exclude $107 of depreciation and the $40 interest line). Rate from Federal Reserve Bank of Chicago, Aug 2026 [3]. *Crop Root Zone calculation. The payment calendars are our assumptions, not farmdoc's. Seed is held at $134 in all three columns to isolate timing; Section 3 adds the discount.
The direct-cost rows of the split column sum to $28.60, the figure we published in September [17]. Rent and cash overhead add $13.77 to it.
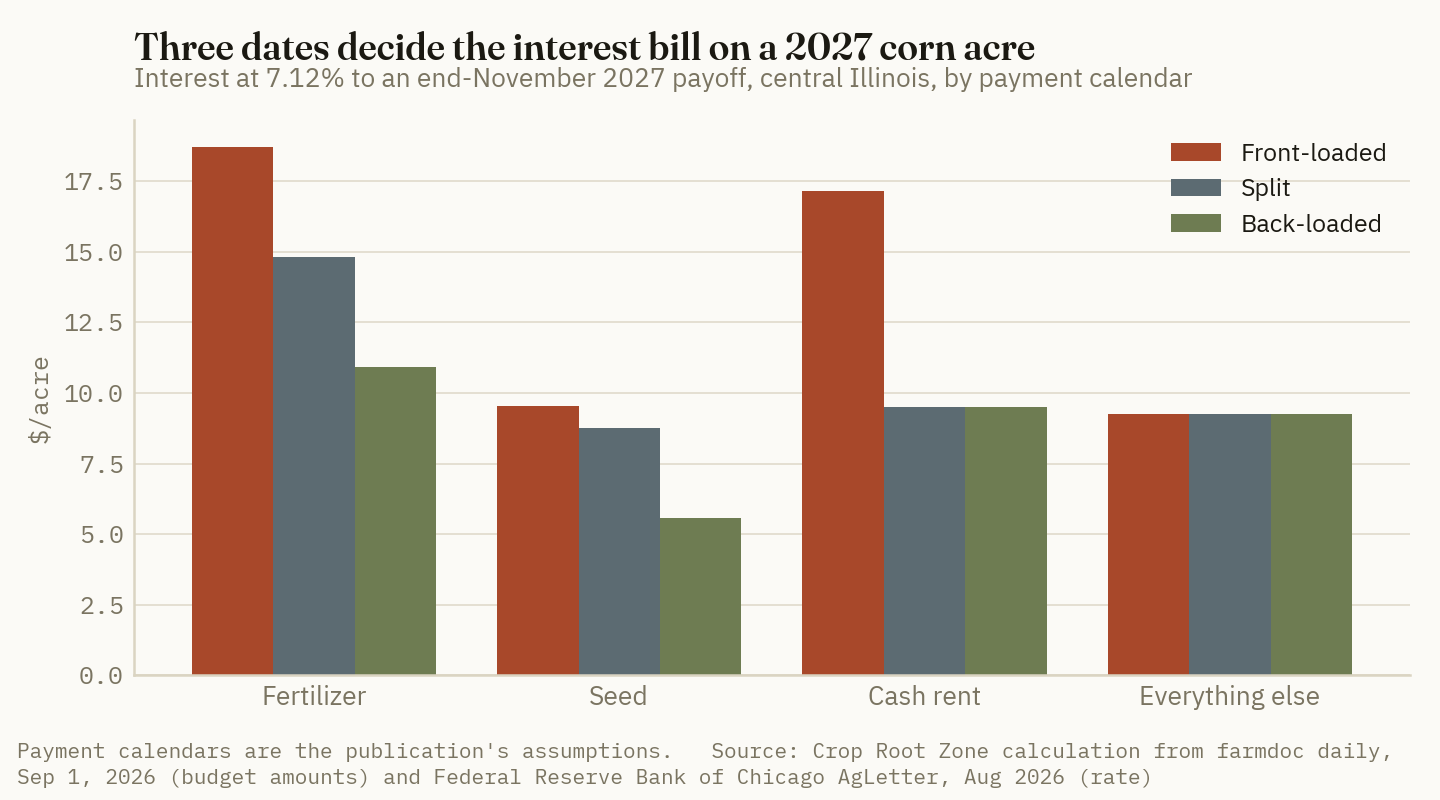
Soybeans carry less money for about as long.
| Soybeans, per acre | Budget amount, $ | Front-loaded interest, $* | Split interest, $* | Back-loaded interest, $* |
|---|---|---|---|---|
| Fertilizer | 77 | 5.48 | 4.34 | 3.20 |
| Seed | 87 | 6.19 | 5.68 | 3.61 |
| Pesticides | 72 | 2.56 | 2.56 | 2.56 |
| Crop insurance and storage | 20 | 0.26 | 0.26 | 0.26 |
| Power and overhead paid in cash | 152 | 4.06 | 4.06 | 4.06 |
| Cash rent | 321 | 17.14 | 9.52 | 9.52 |
| Total | 729 | 35.70 | 26.42 | 23.22 |
Basis and method as in the corn table. Source: farmdoc daily, Sep 1, 2026 [8] (2027 soybeans, central Illinois high-productivity farmland; excludes $93 of depreciation and the $33 interest line); Federal Reserve Bank of Chicago, Aug 2026 [3]. *Crop Root Zone calculation.
| Dollar-weighted months of interest carried* | Months | |
|---|---|---|
| Corn, front-loaded | 8.7 | ██████████ |
| Soybeans, front-loaded | 8.3 | █████████░ |
| Corn, split | 6.7 | ████████░░ |
| Soybeans, split | 6.1 | ███████░░░ |
| Corn, back-loaded | 5.6 | ██████░░░░ |
| Soybeans, back-loaded | 5.4 | ██████░░░░ |
Basis: average balance outstanding × 12 ÷ total cash cost, payoff at end of November 2027. Source: *Crop Root Zone calculation from farmdoc daily, Sep 1, 2026 [8]. Bars are scaled to the largest value.
On the front-loaded soybean acre, rent is 48% of the interest bill. On corn it is 31%.
3. Which date is worth what
What's new: Taken one at a time, the rent date and the fertilizer date are worth almost the same on corn. The seed date is worth half as much in interest and is the only one that pays the borrower back.
Evidence:
| Lever, corn acre at 7.12% | Months moved | Dollars moved, $ | Interest difference, $/acre* | Per point of rate, $/acre* |
|---|---|---|---|---|
| All fertilizer in November instead of April | 5 | 263 | 7.80 | 1.10 |
| All rent on March 1 instead of half on November 1 | 8, on half | 160.50 | 7.62 | 1.07 |
| Seed paid in November instead of April | 5 | 134 | 3.98 | 0.56 |
| All three together | 19.40 | 2.72 | ||
| Soybeans: all fertilizer in November instead of April | 5 | 77 | 2.28 | 0.32 |
Basis: $/acre, simple interest. Source: *Crop Root Zone calculation from the amounts in farmdoc daily, Sep 1, 2026 [8].
Fertilizer. The $7.80 is the financing cost of buying the whole program in the fall. It is the per-acre version of what our October 5 urea piece measured per ton: $25.50 of interest on a $675 ton carried 197 days at 7% [18]. It belongs beside the fall-versus-spring price comparison, not in place of it.
Rent. The University of Illinois lease guide describes the common arrangement as part of the rent on March 1 and the rest on November 1, often 50–50, and notes a shift toward 100% in the spring, "especially on professional managed farms" (University of Illinois Farm Business Management, D. Lattz) [11]. It adds that a rent reduction can be justified when the owner is paid everything up front. At 7.12% that reduction is $7.62 on a $321 rent, or 2.4%. Rent that is due in full before January, which some leases require, carries about 12 months and $22.86.
Seed. No seed company schedule we could find publishes its 2026–27 cash-discount dates in the open. The best public description remains a Cornell study of more than ten company schedules, which put the representative cash discount at 12% on September 15, 10% on November 1, 8% on December 15, 3% on February 1 and zero by March 15 (farmdoc daily, Oct 10, 2019) [12]. Those percentages are seven years old and are used here as a shape, not as this year's offer.
| Per $100 of list seed | Pay early, $ | Pay later, $ | Wait, months | Interest on the early payment at 7.12%, $* | Annualized return on paying early* |
|---|---|---|---|---|---|
| November 1 instead of December 15 | 90 | 92 | 1.5 | 0.80 | 17.8% |
| December 15 instead of February 1 | 92 | 97 | 1.5 | 0.82 | 43.5% |
| February 1 instead of March 15 | 97 | 100 | 1.5 | 0.86 | 24.7% |
| November 1 instead of March 15 | 90 | 100 | 4.5 | 2.40 | 29.6% |
Basis: dollars per $100 of list price. Source: representative discount schedule from farmdoc daily, Oct 10, 2019 [12]. *Crop Root Zone calculation: discount gained ÷ early payment, annualized as simple interest.
Every step returns more than twice the operating rate. If the budget's $134 is a December price net of 8%, list is about $146 and an April payment costs $11.65 more, against $3.18 of interest saved by waiting from December. Both figures are our estimates.
The alternative to borrowing from the bank is borrowing from the seed company. Bayer's Channel brand currently lists fixed 0% financing through John Deere Financial and DLL with the balance due in November 2027, and states that cash and financing programs cannot be used on the same unit of seed (Bayer Crop Science, accessed Oct 8, 2026) [14]. The Cornell authors found that financed purchases typically earned a discount about five points smaller than cash [13]. In 2019, with prime at 5.25%, they concluded that company financing had to be priced near zero to beat an operating loan used to take the cash discount [15].
Ground Truth: At today's rates the seed company's 0% offer narrowly wins. Per $100 of list, a bank-financed November cash purchase costs $90 plus 12 months at 7.12%, or $96.41 by payoff. A 0% financed purchase at a discount five points smaller costs $95. The break-even operating rate is 5.56%. Below it, borrow from the bank and take the cash discount. Above it, take the 0% paper. That is about $2 an acre in the financed program's favor on a $146 list, and the gap widens by 90 cents per $100 for each point of bank rate. It rests on a five-point haircut measured in 2019. The question for the seed dealer is what the financed discount is this year, in points, set beside the cash one. A haircut of six and a half points or more hands the advantage back to the bank at 7.12%.
4. Against the budget lines, in bushels, and by the point
What's new: Purdue's 2027 budget and Iowa State's most recent one charge interest on inputs for eight or nine months and nothing on rent. A cash-rent tenant's bill is larger than either formula produces.
Evidence:
| University budget | Interest line, corn, $/acre | Interest line, soybeans, $/acre | Stated method |
|---|---|---|---|
| Illinois farmdoc, 2027, central high-productivity | 40 | 33 | "Interest (non-land)"; no formula given |
| Illinois farmdoc, 2027, northern | 46 | 38 | Same |
| Purdue ID-166-W, 2027, average soil, rotation | 30 | 17 | 7.5% for 9 months on seed, fertilizer, chemicals; 6 months on half of fuel and repairs and on miscellaneous |
| Iowa State A1-20, 2026 crop, 211 bu corn / 61 bu soybeans | 19.65 | 13.07 | 7.47% for 8 months on preharvest variable costs |
| Crop Root Zone, 2027, split calendar* | 42.36 | 26.42 | 7.12%, actual months, all cash costs including rent |
| Crop Root Zone, 2027, split calendar, inputs only* | 28.60 | 12.64 | 7.12%, actual months, direct costs only |
Sources: farmdoc daily, Sep 1, 2026 [8]; Purdue University, 2027 Crop Cost & Return Guide, Sep 2026 estimates [9]; Iowa State University, Estimated Costs of Crop Production in Iowa 2026, Jan 2026 [10] (the 2027 edition had not been published at writing). *Crop Root Zone calculations; soybean inputs-only figure as published Sep 16 [17].
farmdoc's $40 has risen from $36 in 2025 and $39 projected for 2026, and its authors expect interest charges to keep rising as lower working capital raises demand for operating credit [8]. The article gives no rate-times-months formula for the line, so it does not compare cleanly with ours. Purdue's and Iowa State's do. Our inputs-only figure of $28.60 sits beside Purdue's $30. The $13.77 difference between that and the full split-calendar bill is rent and cash overhead, which neither formula touches.
In bushels, we price the 2027 crop off the board. December 2027 corn was quoted at $5.1725 and November 2027 soybeans at $12.59 at mid-morning on October 8 (FXEmpire delayed quotes, 14:44 UTC, Oct 8, 2026) [16]. Purdue's budget convention of 25 cents under for corn and 35 under for soybeans [9] gives harvest-delivery estimates of $4.92 and $12.24. Those are our estimates of a bid, not posted bids. farmdoc uses $5.00 and $12.00 [8].
| Calendar | 6.12% | 7.12% | 7.37% | 8.12% | Per point | Bushels at 7.12% |
|---|---|---|---|---|---|---|
| Corn, front-loaded | 47.00 | 54.68 | 56.60 | 62.36 | 7.68 | 11.1 |
| Corn, split | 36.41 | 42.36 | 43.85 | 48.31 | 5.95 | 8.6 |
| Corn, back-loaded | 30.33 | 35.28 | 36.52 | 40.24 | 4.96 | 7.2 |
| Soybeans, front-loaded | 30.69 | 35.70 | 36.95 | 40.72 | 5.01 | 2.9 |
| Soybeans, split | 22.71 | 26.42 | 27.35 | 30.14 | 3.71 | 2.2 |
| Soybeans, back-loaded | 19.96 | 23.22 | 24.03 | 26.48 | 3.26 | 1.9 |
Basis: interest in $/acre on the Section 2 calendars; bushels at $4.92 corn and $12.24 soybeans. Source: Crop Root Zone calculations from farmdoc daily, Sep 1, 2026 [8]; Federal Reserve Bank of Chicago, Aug 2026 [3]; FXEmpire, Oct 8, 2026 [16]; Purdue basis convention [9]. Every interest and bushel figure is ours. Rates other than 7.12% are scenarios, not forecasts.
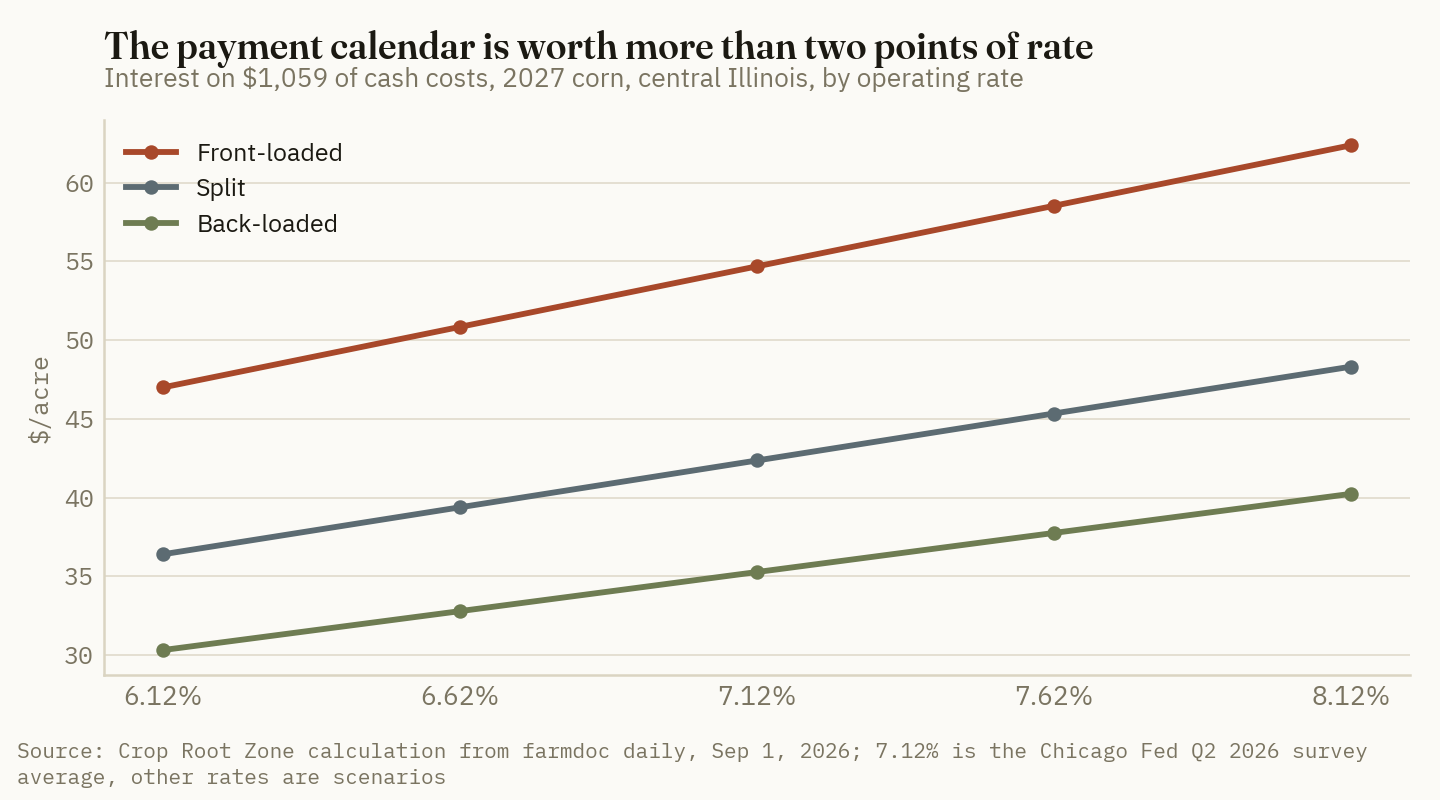
A full point of rate moves the split corn acre by $5.95. Moving from the split calendar to the front-loaded one moves it by $12.32. The calendar is worth two points of rate. The gap between FSA's 5.375% and the Chicago average is worth $10.38 on the split corn acre, for the borrowers who qualify.
5. The payoff date, and what renewal conditions say about it
What's new: Everything above assumes the line is cleared at the end of November 2027. The surveys say a growing share of lines are not being cleared on schedule.
Evidence: The Chicago Fed's index of loan renewals and extensions was 124 in the second quarter, where 100 means no change from a year earlier. Its repayment index was 73. The share of the district's farm loans with "major" or "severe" repayment problems was 3.7%, up from 2.9% and the highest since 2020, and the loan-to-deposit ratio reached a record 80.7% [3]. In the Tenth District, less than 10% of farm loan balances had major or severe repayment problems [4]. USDA's September forecast put the sector's 2026 interest expense at about $33.8 billion, up 2.8%, on debt of $605.1 billion (American Farm Bureau Federation, Sep 3, 2026, relaying USDA ERS) [19].
$6.28 an acre, per month
Interest on the $1,059 of cash costs behind a 2027 central Illinois corn acre for each month the operating line stays open past harvest, at 7.12%. Soybeans: $4.33. (Crop Root Zone calculation from farmdoc daily, Sep 1, 2026 [8] and Federal Reserve Bank of Chicago, Aug 2026 [3])
Five weeks of delay at the back end costs as much as moving the entire fertilizer bill from April to November at the front. The same arithmetic runs on this year's crop. A bushel of soybeans held unsold costs 7.4 cents a month in interest [20], which is another way of saying the 2026 line is still open while the 2027 draws begin. A balance that is renewed instead of repaid carries a full year: each $100 an acre of carryover adds $7.12 to the 2027 bill before a single input is bought.
The CCC commodity loan is the one posted instrument aimed at this window. At 5.250% [7] it is 187 basis points under the Chicago average. Used to clear an operating line while grain is stored, it lowers the monthly cost on the corn acre from $6.28 to $4.63, by our calculation, on whatever share of the balance the loan proceeds cover.
Ground Truth: The dates growers spend October arguing about are the smaller ones. Fall versus spring fertilizer is $7.80 an acre of interest. The seed deadline is $4, and the discount pays it back several times. The two dates that carry real money are set in documents most operators do not reopen each year: the lease, where a 100% March 1 clause is a $7.62 rent increase that does not appear in the rent, and the loan agreement, where the maturity date decides whether stored grain is financed at 7.12% on the operating note or at 5.25% under a marketing loan. With renewals running ahead of last year and repayment behind it, lenders will be setting those maturity dates more tightly this winter. A tenant asked to move to all-spring rent has a number to bring to the table. A borrower planning to store the 2027 crop has a reason to ask now what the line costs in December 2027 and January 2028.
What to watch:
- The Chicago Fed's November AgLetter, the first district survey to report rates set after the September increase and the first to cover fall renewals.
- The Kansas City Fed's third-quarter surveys, for whether the 7.39% variable operating rate moved by the full quarter point.
- FSA's November rates. The direct operating rate was 5.000% in June, 5.250% in September and 5.375% in October [7][17].
- This season's seed financing terms, specifically the gap in points between the cash and financed discounts.
- farmdoc's next budget revision, for whether the $40 and $33 interest lines move again.
References
- Board of Governors of the Federal Reserve System, FOMC statement, Sep 16, 2026 — https://www.federalreserve.gov/newsevents/pressreleases/monetary20260916a.htm
- Kitco News (wire report), "US banks raise prime rate after Fed decision," Sep 16, 2026 — https://www.kitco.com/news/off-the-wire/2026-09-16/us-banks-raise-prime-rate-after-fed-decision
- Federal Reserve Bank of Chicago, E. Kepner and D. Oppedahl, AgLetter No. 2013, Aug 2026 (second-quarter 2026 survey; rates at end of period) — https://www.chicagofed.org/publications/agletter/2025-2029/august-2026
- Federal Reserve Bank of Kansas City, T. Kreitman, "Steady Tightening of Agricultural Credit Conditions Persists," Aug 14, 2026 (second-quarter 2026 Tenth District survey) — https://www.kansascityfed.org/agriculture/ag-credit-survey/steady-tightening-of-agricultural-credit-conditions-persists/
- Federal Reserve Bank of Kansas City, "New Farm Loan Originations Ease Slightly," Jul 10, 2026 (Survey of Terms of Lending to Farmers, second quarter 2026) — https://www.kansascityfed.org/center-for-agriculture-and-the-economy/agricultural-finance/new-farm-loan-originations-ease-slightly/
- Ag Proud (Progressive Publishing), J. Coyne, "Interest rates largely unchanged in Q2 reports," Sep 24, 2026 (roundup of Chicago, Dallas, Kansas City and Minneapolis district surveys) — https://www.agproud.com/articles/64188-interest-rates-largely-unchanged-in-q2-reports
- USDA Farm Service Agency, "USDA Announces October 2026 Lending Rates for Agricultural Producers," Oct 1, 2026 — https://www.fsa.usda.gov/news-events/news/10-01-2026/usda-announces-october-2026-lending-rates-agricultural-producers
- N. Paulson, G. Schnitkey, C. Zulauf and B. Zwilling, "Illinois Crop Budgets for 2027," farmdoc daily (16):157, University of Illinois, Sep 1, 2026 (Tables 1 and 2) — https://farmdocdaily.illinois.edu/2026/09/illinois-crop-budgets-for-2027.html
- M. Langemeier, S. Casteel, D. Quinn and T. Butz, "2027 Purdue Crop Cost & Return Guide, September 2026 Estimates," Purdue Extension ID-166-W, dated Sep 15, 2026 — https://ag.purdue.edu/commercialag/home/resource/2026/09/2027-crop-budget/
- Iowa State University Extension and Outreach, "Estimated Costs of Crop Production in Iowa – 2026," Ag Decision Maker File A1-20 (FM 1712), revised Jan 2026 — https://www.extension.iastate.edu/agdm/crops/pdf/a1-20.pdf
- D. Lattz, "Cash Rent Leases," University of Illinois Farm Business Management Resources fact sheet (2017 edition, as posted) — https://farmdoc.illinois.edu/assets/management/leasing-facts-prices/Cash_Rent_Lease_Fact_Sheet_2017.pdf
- C. Fiechter and J. Ifft, "Seed Corn Costs: How Large Are the Discounts?," farmdoc daily (9):190, Oct 10, 2019 — https://farmdocdaily.illinois.edu/2019/10/seed-corn-costs-how-large-are-the-discounts.html
- C. Fiechter and J. Ifft, "Seed Corn Costs: How Do Discounts Work with Seed Company Financing?," farmdoc daily (9):191, Oct 11, 2019 — https://farmdocdaily.illinois.edu/2019/10/seed-corn-costs-how-do-discounts-work-with-seed-company-financing.html
- Bayer Crop Science, "Channel Seed Financing" (program terms as posted), accessed Oct 8, 2026 — https://cropscience.bayer.us/financing/channel-seed-financing
- C. Fiechter and J. Ifft, "Seed Corn Costs: Cost of Seed Company Financing vs. Traditional Financing," farmdoc daily (9):194, Oct 16, 2019 — https://farmdocdaily.illinois.edu/2019/10/seed-corn-costs-cost-of-seed-company-financing-vs-traditional-financing.html
- FXEmpire, CBOT corn and soybean futures contract tables, delayed quotes at 14:44 UTC, Oct 8, 2026 — https://www.fxempire.com/commodities/zc/contracts and https://www.fxempire.com/commodities/zs/contracts
- Crop Root Zone, TRZ-0200, "A Quarter-Point Rate Move Is Worth About $1 an Acre on a 2027 Illinois Corn Crop. The Budget Projects a $36 Profit.," Sep 16, 2026 (staged direct-cost interest of $28.60 corn and $12.64 soybeans; operating-loan pass-through; September FSA rates).
- Crop Root Zone, TRZ-0254, "A $675 Urea Prepay Costs $25.50 a Ton in Interest by April. The Gulf Curve Charges the Same $25.50 From October to March. Locking Wins Only if April Retail Tops $700.," Oct 5, 2026.
- American Farm Bureau Federation, F. Parum and D. Munch, "USDA Revises Farm Income Higher, but Costs Still Bite," Market Intel, Sep 3, 2026 (relaying the USDA Economic Research Service farm sector income forecast of Sep 3, 2026) — https://www.fb.org/market-intel/usda-revises-farm-income-higher-but-costs-still-bite
- Crop Root Zone, TRZ-0259, "The Board Pays 36¾ Cents to Carry Soybeans to May. Interest on a $12.46 Bushel Is 52. An Owned Bin Breaks Even at Iowa's Average January Basis and Falls Short of It in March and May.," Oct 6, 2026.
Disclosures
Crop Root Zone is an independent publication. Nothing here is investment advice. Market calls, where included, reflect the editors' own read and are not a recommendation to buy or sell any security.
The Board Pays 36¾ Cents to Carry Soybeans to May. Interest on a $12.46 Bushel Is 52. An Owned Bin Breaks Even at Iowa's Average January Basis and Falls Short of It in March and May.
At October 5 settlements the soybean carry covers about three-quarters of operating-loan interest in every window. An owned bin needs roughly Iowa's five-year average January basis to break even, 17 to 24 cents better than average in March, 7 to 14 in May. Commercial storage needs more.
November soybeans settled at $12.8075 on Monday, October 5. January was 16¾ cents higher, March 27¼, May 36¾ and July 42¾ (CBOT settlements via USDA AMS Illinois Grain Bids, Oct 5, 2026 [1]). Central Illinois country elevators averaged $12.46, or 34 under November [1]. Iowa's state average was $12.20, 61 under (USDA AMS Iowa Daily Cash Grain Bids, Oct 5, 2026 [2]). At the 7.12% average operating-loan rate Chicago Fed lenders reported at midyear [3], the money tied up in a $12.46 bushel costs 7.4 cents a month. The carry to May pays 36¾ cents. The interest to May is about 52. This library has priced the corn storage decision several times and never the soybean one. The arithmetic is different because the bushel is worth 2.7 times as much as the corn bid at the same elevators.
1. The carry pays three-quarters of the interest and nothing else
What's new: The soybean carry has widened as harvest arrived, but it still does not cover the interest on the bushel in any window from January to July.
Evidence: On September 21 the November-to-May spread was 30 cents; a year earlier it was 47¼ (Crop Root Zone, TRZ-0215, Sep 21, 2026 [19]). It is now 36¾, on a November contract that has fallen 47 cents in two weeks.
| CBOT soybeans, Oct 5 settlement | Price ($/bu) | Carry from November (¢/bu) | Months from Oct 6 | Interest on $12.46 at 7.12% (¢/bu)* | Carry as share of interest* |
|---|---|---|---|---|---|
| November 2026 | 12.8075 | — | — | — | — |
| January 2027 | 12.9750 | 16.75 | 3 | 22.2 | 76% |
| March 2027 | 13.0800 | 27.25 | 5 | 37.0 | 74% |
| May 2027 | 13.1750 | 36.75 | 7 | 51.8 | 71% |
| July 2027 | 13.2350 | 42.75 | 9 | 66.5 | 64% |
Basis: CBOT settlements, cents and dollars per bushel; cash price is the central Illinois country elevator average. Source: USDA AMS Illinois Grain Bids, Oct 5, 2026 [1]; interest rate from the Chicago Fed's second-quarter survey as reported in Crop Root Zone TRZ-0200, Sep 16, 2026 [3]. *Crop Root Zone calculation: cash price × 7.12% × months/12, for sale in the first days of the contract month.
November was quoted about 12 cents higher at mid-morning Tuesday with the January, March and May spreads within a cent and a half of Monday's (FXEmpire delayed quotes, 15:31 UTC, Oct 6, 2026 [18]). We use the settlements.
Corn on the same report shows why beans need their own arithmetic. December corn settled at $4.9725 with March 14¼ cents higher and May 21¼; central Illinois corn averaged $4.62 [1]. Interest on that bushel is 2.7 cents a month.
| Carry as a share of interest on the cash bushel, Oct 5 | %* | |
|---|---|---|
| Corn, December to May | 111 | ██████████ |
| Corn, December to March | 104 | █████████░ |
| Soybeans, November to January | 76 | ███████░░░ |
| Soybeans, November to March | 74 | ███████░░░ |
| Soybeans, November to May | 71 | ██████░░░░ |
Basis: futures carry divided by interest at 7.12% on the central Illinois cash price, storage from Oct 6 to the first days of the later contract month. Source: USDA AMS [1]; rate via [3]. *Crop Root Zone calculations. Bars are scaled to the largest value.
Two notes on the rate. Our September export piece put harvest-to-May interest at about 53 cents on a $12.94 bushel at an assumed 7% [19]; the figure here is 52 because the cash price is 48 cents lower and the rate is the surveyed one. And the 7.12% is a borrower's rate. The University of Illinois series prices storage interest at a Treasury bill rate (farmdoc daily, Oct 2, 2025 [9]). A grower with no operating debt who values cash at 4%, which is our illustrative assumption and not a sourced rate, has 20.8 cents of interest to March. For that grower the 27¼-cent carry covers the money and leaves 6½ cents for the bin.
2. The full bill: an owned bin, an elevator, and the moisture meter
What's new: Posted 2026 commercial rates for soybeans are only a cent or two above corn's. The costs that scale with price are 2.7 times corn's.
Evidence: Topflight Grain Cooperative in Illinois charges soybeans 14 cents in and 4.5 cents a month prorated daily, against 13 cents in for corn (Topflight Grain, accessed Oct 6, 2026 [6]). Cooksville Grain charges 22 cents through January 1 and 4 cents a month after, against 20 and 3 for corn (Cooksville Grain, accessed Oct 6, 2026 [7]). Iowa State's guide range is 9 to 16 cents for the first three months and 2 to 4 cents for each month after (ISU Ag Decision Maker C2-24, Aug 2024 [5]).
For a bin that is already standing, Iowa State counts only the costs that storing creates: interest, 2.0 to 2.5 cents of extra handling, 0.2 to 0.3 cents of aeration, and 0.5% to 1% of the grain lost moving in and out and in store (ISU Ag Decision Maker A2-33, May 2023 [4]). Ownership costs run whether the bin is filled or not. The guide's worked example is corn. Applied to a $12.46 bushel, the 0.5% to 1% is 6.2 to 12.5 cents.
| Central Illinois, $12.46 soybeans, from Oct 6 | To early January | To early March | To early May |
|---|---|---|---|
| Futures carry paid | 16.75 | 27.25 | 36.75 |
| Interest at 7.12%* | 22.2 | 37.0 | 51.8 |
| Owned bin: interest, handling, aeration, 0.5–1% loss* | 30.6–37.4 | 45.4–52.2 | 60.2–67.0 |
| Elevator, ISU guide range, plus interest* | 31.2–38.2 | 50.0–61.0 | 68.8–83.8 |
| Elevator, Cooksville rate, plus interest* | 44.2 | 67.0 | 89.8 |
| Elevator, Topflight rate, plus interest* | 49.7 | 73.5 | 97.3 |
| Break-even cash price, owned bin ($/bu)* | 12.77–12.83 | 12.91–12.98 | 13.06–13.13 |
| Break-even cash price, Cooksville ($/bu)* | 12.90 | 13.13 | 13.36 |
Basis: cents per bushel unless marked; soybeans delivered at or below 13% moisture, so no elevator shrink. Source: USDA AMS [1]; ISU A2-33 [4] and C2-24 [5]; Topflight [6] and Cooksville [7] rate sheets; rate via [3]. *Crop Root Zone estimates. Topflight's monthly charge is assumed to accrue from delivery. Bin ownership cost is excluded.
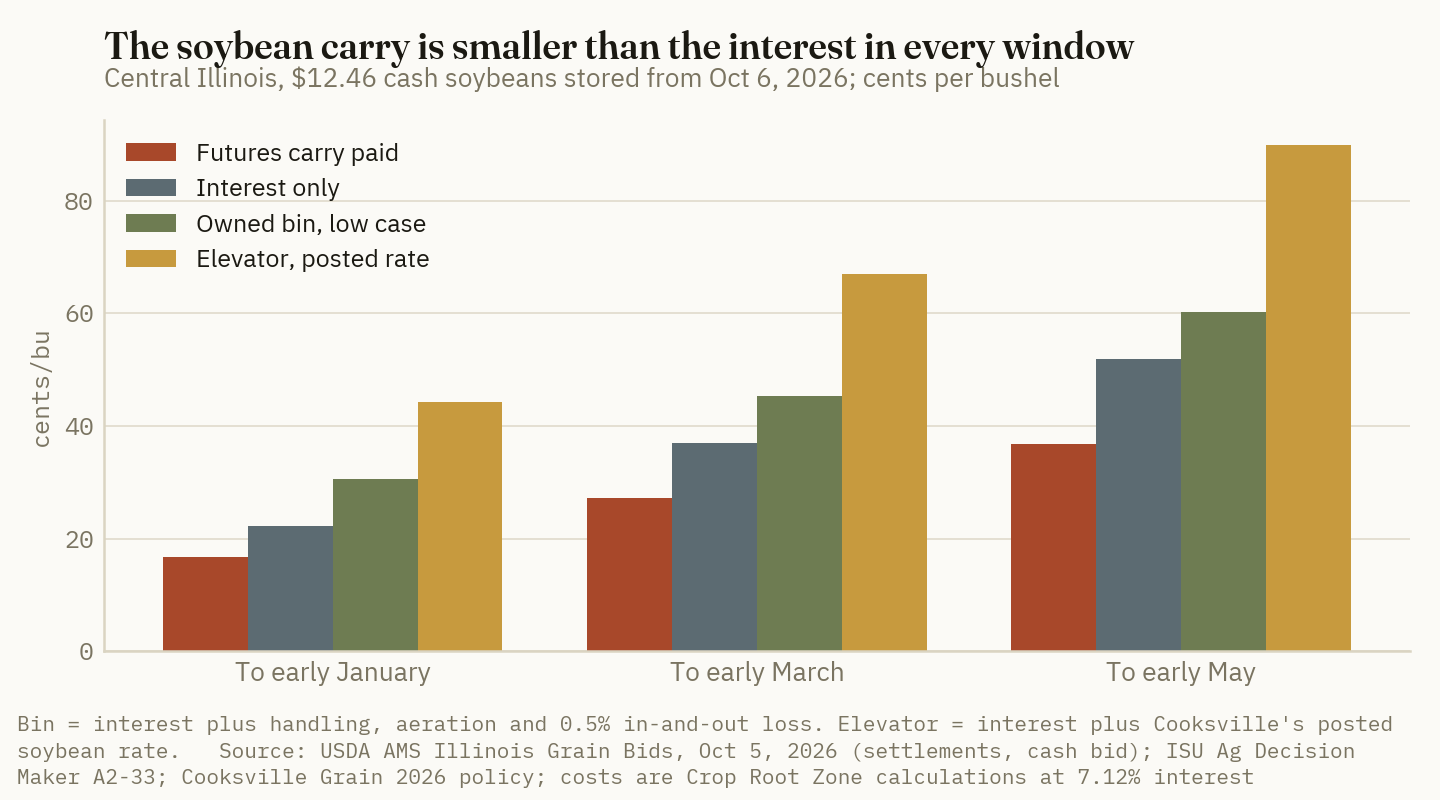
Moisture is the cost that never reaches a storage budget. The market basis for soybeans is 13%, and NDSU's guidance is that 13% is adequate for winter storage while beans held into summer should be closer to 11% (NDSU Extension, Sep 26, 2023 [13]). Beans sold at 11% carry 2.25% fewer pounds than the same beans at 13%. At $12.46 that is 28 cents a bushel; at 9% it is 55 cents. Those are our calculations from the dry-matter arithmetic. The discount runs the other way too. Topflight shrinks soybeans 1.4% for each half point of moisture from 13.1% to 15% [6], and Cooksville 3% a point [7]. A load at 14% loses 35 to 37 cents.
Ground Truth: On beans the bin and the elevator are closer than on corn. Interest and in-and-out loss are percentages of a $12.46 bushel, and together they run 28 to 35 cents to January before anyone is paid for space. The elevator's charge to January is a flat 9 to 27½ cents that barely moves with the crop. Our September bag piece found an owned bin beat two Illinois elevators by 19 to 32 cents on corn to March (Crop Root Zone, TRZ-0195, Sep 15, 2026 [21]); on beans the gap is 15 to 28. The bin's largest soybean payoff this fall is not in that table. Where rain has delayed harvest, a bin with a fan can take 14% beans and air them down to 13%. The water in that point weighs 1.1% of the load, or 14 cents. The elevator's shrink takes 35 to 37. The 21 to 23 cents between them, before fan electricity, is more than the carry to January.
3. The break-even basis, and what Iowa's record says about reaching it
What's new: With the carry locked in, the storage decision reduces to one number: the basis needed against the later contract on the day of sale. In Iowa an owned bin needs about the five-year average in January and more than the average in March and May.
Evidence: A bushel bid 34 under November is 50¾ under January, 61¼ under March and 70¾ under May. Add the cost of getting there and the result is the basis the stored bushel has to fetch.
| Central Illinois: basis needed at sale (¢/bu)* | Early January, vs January | Early March, vs March | Early May, vs May |
|---|---|---|---|
| Harvest bid restated against that contract | −50.75 | −61.25 | −70.75 |
| Owned bin | −20 to −13 | −16 to −9 | −11 to −4 |
| Elevator, Cooksville rate | −7 | +6 | +19 |
| Elevator, Topflight rate | −1 | +12 | +26 |
Basis: cash bid minus the named futures contract, cents per bushel. Source: USDA AMS [1]; cost rows from Section 2. *Crop Root Zone calculations.
For scale, central Illinois processors bid 21 to 10 under November on Monday and Mississippi River barge terminals 3 over [1]. An owned bin has to turn a country-elevator bushel into a processor-priced one by spring. A commercially stored bushel has to do better than any bid on Monday's sheet.
Iowa has an open historical record to test this against. Iowa State publishes the state's weekly average soybean basis against each contract for 2020/21 through 2024/25 (ISU Ag Decision Maker A2-42, Dec 2025 [8]). In the first week of October the five-year average was 58 under November. Monday's 61 under is an ordinary harvest basis.
| Iowa state average: sale week and contract | Harvest bid vs that contract, Oct 5* | Owned-bin cost (¢/bu)* | Basis needed* | Five-year average that week | Strongest of five | Weakest of five |
|---|---|---|---|---|---|---|
| First week of January, vs January | −77.75 | 30.0–36.7 | −48 to −41 | −45 | −37 | −54 |
| First week of March, vs March | −88.25 | 44.5–51.2 | −44 to −37 | −61 | −45 | −104 |
| First week of May, vs May | −97.75 | 59.0–65.7 | −39 to −32 | −46 | −22 | −75 |
| Elevator at ISU guide rates, January | −77.75 | 30.7–37.7 | −47 to −40 | −45 | −37 | −54 |
| Elevator at ISU guide rates, March | −88.25 | 49.2–60.2 | −39 to −28 | −61 | −45 | −104 |
| Elevator at ISU guide rates, May | −97.75 | 67.7–82.7 | −30 to −15 | −46 | −22 | −75 |
Basis: cents per bushel; cash is the Iowa state average, $12.20 on Oct 5. Source: USDA AMS [2]; ISU A2-42 [8]; ISU A2-33 [4] and C2-24 [5]; rate via [3]. *Crop Root Zone calculations: interest at 7.12% on $12.20 plus the Section 2 cost items.
17 to 24 cents
How much stronger than its five-year average Iowa's first-week-of-March soybean basis has to be for an owned bin to break even on beans carried from this week. The strongest March week in the five years was 45 under, a cent short of the low-cost case. (Crop Root Zone calculation from USDA AMS, Oct 5, 2026 [2] and ISU A2-42 [8])
January works on the average. March does not: the basis against the March contract weakens through February as that contract comes into delivery, and the average first-week-of-March reading is no better than October's against November. May falls 7 to 14 cents short on the average and clears in the strong years.
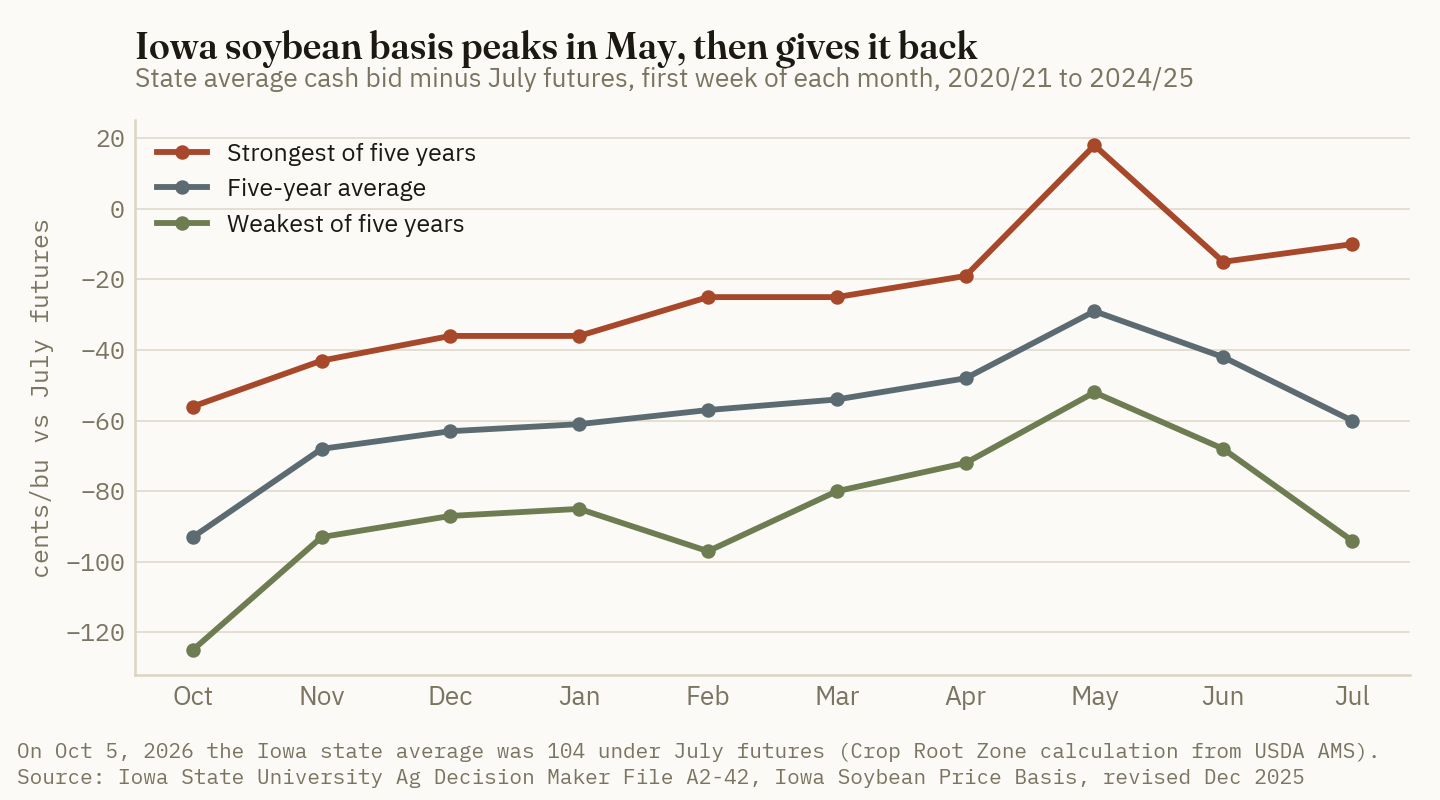
All of this assumes the later contract is sold or otherwise priced when the bin is filled. For an unpriced bushel, every cent the later contract gains by sale day lowers the needed basis by a cent, and every cent it loses raises it.
4. What history paid the unpriced bushel
What's new: Nothing this week. The long record says cash storage of soybeans has roughly covered its cost, has done better than corn, and has not been reliably profitable hedged.
Evidence: Across the 1974 to 2024 marketing years, the average US cash soybean price rose one to two percentage points a month from its October low and stood at 111% of October in May, June and July (farmdoc daily, Oct 8, 2025 [10]). Storage cost took most of that. Total soybean storage cost averaged 11% of the October price, from 3% in 2012 to 21% in 1981, and ran 37% above corn's per bushel [9]. Net return to cash storage did not differ statistically from zero in any of eight windows, though it exceeded 3% of the October price for April, May and June [10]. Three percent of $12.46 is 37 cents. Hedged storage never averaged above zero, and was below zero with 99% confidence for April and June [10]. Cash returns show no downward trend over the 51 years [11].
Purdue's central Indiana study of the 1988 to 2017 harvests found larger numbers: on-farm returns above interest of $0.80 to $1.30 a bushel for beans priced in late April through early June, positive in 70% to 90% of years, and $0.60 to $1.00 after elevator charges (Purdue PAER, Jun 5, 2019 [12]). The author called them speculative returns. The period includes the 2007 to 2012 price run-up, and the on-farm figure is net of interest only.
The two studies agree on the part that matters here. What paid in soybean storage was the price, in the spring. Section 3's hedged break-evens leave that out by design. A grower who stores unpriced beans to May is holding the position that produced the historical return. Monday's curve prices May at 2.9% over November.
5. What is different this fall
What's new: Four things bear on whether basis beats its average this winter. Two point each way.
Evidence:
- The crop. USDA's September forecast is 4.535 billion bushels with ending stocks of 310 million, 6.8% of use (Crop Root Zone, TRZ-0192, Sep 14, 2026, relaying WASDE-675 [23]). September 1 stocks came in at 315 million (Crop Root Zone, TRZ-0247, Oct 1, 2026 [24]). A record crop into a tight carryout is why the carry is three-quarters of interest and no more. USDA's next balance sheet is due October 9 [19].
- Harvest is late where basis is weakest. Soybeans were 25% harvested on October 4 against a 33% five-year average. Illinois was at 31% against 29%. Iowa was at 5% against 38%, Nebraska 9% against 34%, Minnesota 25% against 51% (USDA NASS Crop Progress, Oct 5, 2026 [14]). Iowa's 61 under was posted with 95% of the crop still in the field.
- The processor premium is gone. Iowa processors were a seasonal-record 31 over November in the fourth week of September (Purdue Center for Commercial Agriculture, Sep 25, 2026 [17]) and some bid $1 over for delivery by October 2 (Crop Root Zone, TRZ-0256, Oct 5, 2026 [22]). On October 5 the Iowa processor range was 40 under to even, down 40 to 125 cents in a day [2]. Plants crushed 210 million bushels in August, 6% more than a year earlier (USDA NASS Fats and Oils, Oct 1, 2026 [16]). The demand is there. The scarcity was a matter of days.
- The export book is loading. Commitments reached 22.24 million tons on September 24, 48% of USDA's forecast against 28% a year earlier, with China at 10.76 million (USDA AMS Grain Transportation Report, Oct 1, 2026 [15]). The Iowa-to-Gulf soybean spread, which our September 21 piece flagged at $1.50 [19], narrowed to $1.38 on September 18 and $1.29 on September 25 [15]. That is the first sign of the book reaching the interior bid.
One correction to our own record. Our September 8 piece put central Illinois soybean basis at 7¼ under, derived from a national daily-bids report, and concluded that beans should go to town and corn to the bin (Crop Root Zone, TRZ-0171, Sep 8, 2026 [20]). The Illinois state report's country average was 34 under on September 21 and is 34 under now [1][19]. The state report is a direct survey of country elevators and is the better reading for a storage decision. That piece's conclusion, beans to town and corn to the bin, now rests on the carry and interest arithmetic above and not on a 7-cent basis.
Ground Truth: For beans that would go to an elevator's storage ticket, selling across the scale is the baseline this year. No basis on Monday's Illinois sheet pays posted storage to March. An owned bin to January is a fair trade where the local bid is at or below its usual harvest level and the January price is locked. It breaks even on Iowa's average basis, and Iowa's harvest pressure has not arrived yet. If the state's country bids widen as the combines catch up, the January break-even moves with them and the bin's odds improve. Past January the hedged arithmetic fails on the record, and the stored bean becomes an unpriced position that needs 23 to 30 cents from price or basis, beyond what the curve already pays, to reach May in an owned bin. Purdue's record says that position paid in most years. Illinois' longer one says the average barely cleared its cost. It is a price view, and it should be sized like one: on the bushels a grower can afford to be wrong about at 7.4 cents a month.
References
- USDA AMS Livestock, Poultry and Grain Market News / Illinois Dept. of Agriculture, "Illinois Grain Bids" (Report 3192), Oct 5, 2026 (CBOT settlements; central Illinois country elevator averages; processor and barge bids) — https://www.ams.usda.gov/mnreports/ams_3192.pdf
- USDA AMS Livestock, Poultry and Grain Market News / Iowa Dept. of Agriculture, "Iowa Daily Cash Grain Bids" (Report 2850), Oct 5, 2026 (state average; processor bids) — https://www.ams.usda.gov/mnreports/ams_2850.pdf
- Crop Root Zone, TRZ-0200, "A Quarter-Point Rate Move Is Worth About $1 an Acre on a 2027 Illinois Corn Crop. The Budget Projects a $36 Profit.," Sep 16, 2026 (relaying the 7.12% average operating-loan rate in Federal Reserve Bank of Chicago, AgLetter No. 2013, Aug 2026 — https://www.chicagofed.org/publications/agletter/2025-2029/august-2026).
- W. Edwards, "Cost of Storing Grain," Ag Decision Maker File A2-33, Iowa State University Extension and Outreach, revised May 2023 — https://www.extension.iastate.edu/agdm/crops/pdf/a2-33.pdf
- W. Edwards, "Estimating a Grain Storage Rental Rate," Ag Decision Maker File C2-24, Iowa State University Extension and Outreach, updated Aug 2024 — https://www.extension.iastate.edu/agdm/wholefarm/html/c2-24.html
- Topflight Grain Cooperative, Service Rates, 2026–2027 fall policy, accessed Oct 6, 2026 — https://www.topflightgrain.com/service-rates/
- Cooksville Grain Company, Policies, 2026 harvest, accessed Oct 6, 2026 — https://cooksville-grain.com/policies/
- Iowa State University Extension and Outreach, "Iowa Soybean Price Basis, 2020/21 through 2024/25," Ag Decision Maker File A2-42, revised Dec 2025 — https://www.extension.iastate.edu/agdm/crops/pdf/a2-42.pdf
- C. Zulauf, N. Paulson and J. Janzen, "Annual Cost of Storing US Corn and Soybeans Since 1973," farmdoc daily (15):181, University of Illinois, Oct 2, 2025 — https://farmdocdaily.illinois.edu/2025/10/annual-cost-of-storing-us-corn-and-soybeans-since-1973.html
- C. Zulauf, "Net Return to Storing US Corn and Soybeans Since 1973," farmdoc daily (15):185, University of Illinois, Oct 8, 2025 — https://farmdocdaily.illinois.edu/2025/10/net-return-to-storing-us-corn-and-soybeans-since-1973.html
- C. Zulauf, "Has US Return to Storing Corn and Soybeans Declined over Time?," farmdoc daily (15):220, University of Illinois, Dec 1, 2025 — https://farmdocdaily.illinois.edu/2025/12/has-us-return-to-storing-corn-and-soybeans-declined-over-time.html
- C. Hurt, "Soybean Storage Returns: Implications for Storage and Pricing Decisions," Purdue Agricultural Economics Report PAER-2019-07, Jun 5, 2019 — https://ag.purdue.edu/commercialag/home/paer-article/soybean-storage-returns-implications-for-storage-and-pricing-decisions
- NDSU Extension (K. Hellevang), "NDSU offers advice for soybean harvest and drying," Sep 26, 2023 — https://www.ag.ndsu.edu/news/newsreleases/2023/september/ndsu-offers-advice-for-soybean-harvest-and-drying
- USDA National Agricultural Statistics Service, "Crop Progress," week ending Oct 4, 2026, released Oct 5, 2026 — https://release.nass.usda.gov/reports/prog4026.txt
- USDA Agricultural Marketing Service, Grain Transportation Report, Oct 1, 2026 (FAS export sales for the week ended Sep 24, 2026, Table 16; origin-to-export price spreads, Table 2a) — https://www.ams.usda.gov/sites/default/files/media/GTR10012026.pdf
- USDA National Agricultural Statistics Service, "Fats and Oils: Oilseed Crushings, Production, Consumption and Stocks," released Oct 1, 2026 — https://esmis.nal.usda.gov/sites/default/release-files/796091/cafo1026.pdf
- J. Strine, "September 2026 Basis Update: The Harvest Dip," Purdue Center for Commercial Agriculture, Sep 25, 2026 — https://ag.purdue.edu/commercialag/home/?p=22921
- FXEmpire, Soybean futures contracts (CBOT), delayed quotes at 15:31 UTC, Oct 6, 2026 — https://www.fxempire.com/commodities/zs/contracts
- Crop Root Zone, TRZ-0215, "The Soybean Export Book Is 45% Full Ten Days Into the Year. In 2022 It Was 44.5% Full, and That Year Finished 105 Million Bushels Short.," Sep 21, 2026.
- Crop Root Zone, TRZ-0171, "At the Same Illinois Elevator, Soybean Basis Is 31 Cents Stronger Than Corn Basis. One Crop Has a Buyer That Doesn't Need the River.," Sep 8, 2026.
- Crop Root Zone, TRZ-0195, "A Grain Bag Costs 44 to 61 Cents to Store Corn to March. The Carry Pays 14¾, and a Full Basis Recovery Still Leaves the Bag Short.," Sep 15, 2026.
- Crop Root Zone, TRZ-0256, "An Extra Mile to a Better Bid Costs 0.4 to 0.5 Cents a Bushel at $6.53 Diesel. An Extra Hour in the Dump Line Costs 3 to 12 Cents, and Iowa's $1 Soybean Premium Had a Delivery Date of October 2.," Oct 5, 2026.
- Crop Root Zone, TRZ-0192, "USDA Raised the Soybean Price 60 Cents on a Crop That Got Bigger. Soybean Meal Did Almost All of the Arithmetic.," Sep 14, 2026 (relaying USDA WASDE-675, Sep 11, 2026 — https://www.usda.gov/oce/commodity/wasde/wasde0926.pdf).
- Crop Root Zone, TRZ-0247, "Old-Crop Corn Counted 2.095 Billion Bushels, 173 Million Over USDA. The Summer Quarter Grew 3.4%, Not the 9.1% USDA's Figure Needed.," Oct 1, 2026 (relaying USDA NASS Grain Stocks, Sep 30, 2026).
Disclosures
Crop Root Zone is an independent publication. Nothing here is investment advice. Market calls, where included, reflect the editors' own read and are not a recommendation to buy or sell any security.
USDA Sees 2026 Net Farm Income Down 2.6%. Net of $47.4 Billion in Government Payments, It Falls 18%.
ERS's Sep 3 forecast has government payments at 30% of 2026 net farm income, up from 17%, and fertilizer and fuel make up almost half of a $21.2 billion rise in expenses. By this desk's estimate, about half of those payments pay for the 2025 crop. On central Illinois budgets, federal support for the 2026 corn crop falls from $86 to $17 an acre, so the return rests on a price rally that is only a month old.
The Economic Research Service's September farm income forecast, released Sep 3, puts 2026 net farm income at $158.4 billion, down $4.3 billion or 2.6% from a revised 2025 estimate of $162.7 billion, and down 5.5% after inflation (USDA ERS, Sep 3, 2026). The dip is small, but the mix behind it has changed. Direct government payments rise $19.5 billion to $47.4 billion. Production expenses rise $21.2 billion to $492.8 billion. The two roughly cancel, and cash receipts from farm products come in $1.7 billion lower. The forecast is $5 billion higher than USDA's February figure for 2026, but USDA raised its 2025 estimate by $8.1 billion, so the year-on-year decline is now steeper than it looked in February (Farm Policy News, Sep 4, 2026). For a corn and soybean operation, the aggregate figure hides three things: the livestock sector is moving in the opposite direction, much of the 2026 payment money is compensation for the 2025 crop, and the 2026 crop's return now depends on price rather than support.
1. The headline decline is small because government payments grew by $19.5 billion
What's new: ERS forecasts net cash farm income, the cash-basis measure, at $176.4 billion, up $0.7 billion or 0.4% on 2025 in nominal terms and down $4.6 billion or 2.5% after inflation (USDA ERS, Sep 3, 2026). Direct government payments are forecast at the highest level in five years (DTN/Progressive Farmer, Sep 10, 2026).
Evidence:
| Measure | 2025 | 2026F | Change | Change, inflation-adjusted |
|---|---|---|---|---|
| Net farm income | 162.7 | 158.4 | −4.3 (−2.6%) | −9.1 (−5.5%) |
| Net cash farm income | 175.7* | 176.4 | +0.7 (+0.4%) | −4.6 (−2.5%) |
| Total cash receipts | 542.0* | 540.3 | −1.7 (−0.3%) | −18.0 (−3.2%) |
| Direct government payments | 27.9 | 47.4 | +19.5 (+69.8%) | — |
| Total production expenses | 471.6 | 492.8 | +21.2 (+4.5%) | +7.1 (+1.5%) |
| Government payments as % of net farm income | 17.1%† | 29.9%† | +12.8 pts† | — |
| Net farm income excluding government payments | 134.8† | 111.0† | −23.8 (−17.7%)† | — |
Source: USDA ERS, Farm Sector Income Forecast, Sep 3, 2026. $ billion, nominal, calendar year; 2026 is a forecast. *2025 level derived by subtracting ERS's stated change from its 2026 figure. †Crop Root Zone estimate: payments divided by net farm income, and net farm income minus payments, using the ERS figures in this table.
29.9%
Share of 2026 net farm income accounted for by direct government payments, against 17.1% in 2025. (Crop Root Zone calculation from USDA ERS, Sep 3, 2026)
Subtracting payments from income is a piece of accounting, not a forecast of what farms would have earned without aid. Without the payments, some land, credit and marketing decisions would have been different. The calculation still shows how the sector's income is made up. ERS's farm-business measure, which excludes the smallest residential farms, rises: average net cash farm income per farm business is forecast up 7.1% to $121,700 (USDA ERS, Farm Income Forecast Highlights, Sep 3, 2026). Pro Farmer noted that even after inflation, sector net farm income stays above its 20-year average (Pro Farmer, Sep 3, 2026). The level is not the problem. The problem is that more of it comes from government.
Ground Truth: A lender or landlord reading "down 2.6%" will judge the year as roughly flat. For a crop operation, the flatness comes from payments, and payments are not repeatable in the way a yield trend is. The better planning figure is the 17.7% decline in income from the market. Any 2027 rent negotiation or machinery purchase that treats 2026 cash income as a baseline is building a one-time transfer into a recurring cost.
2. Crops gain $14.6 billion and animals lose $16.4 billion, but eggs account for all of the animal loss
What's new: Crop cash receipts are forecast at $253.0 billion, up $14.6 billion or 6.1%. Animal and animal-product receipts are forecast at $287.3 billion, down $16.4 billion or 5.4% (USDA ERS, Sep 3, 2026).
Evidence:
| Commodity | 2025 | 2026F | Change | Change % |
|---|---|---|---|---|
| Corn | 60.5* | 67.3 | +6.8 | +11.3% |
| Soybeans | 43.6* | 47.9 | +4.3 | +10.0% |
| Vegetables and melons | 25.3* | 29.1* | +3.8 | +15.0% |
| Cotton | 5.2* | 5.9 | +0.7 | +12.5% |
| All crops | 238.4* | 253.0 | +14.6 | +6.1% |
| Cattle and calves | 133.7 | 140.7 | +7.0 | +5.2% |
| Turkeys | 5.7* | 7.7* | +2.0 | +35.1% |
| Hogs | 30.0* | 28.8* | −1.2 | −4.0% |
| Broilers | 46.4* | 45.1* | −1.3 | −2.8% |
| Milk | 48.8* | 46.7* | −2.1 | −4.3% |
| Eggs | 31.5* | 10.6* | −20.9 | −66.3% |
| All animals and products | 303.7* | 287.3 | −16.4 | −5.4% |
Source: USDA ERS, Farm Sector Income Forecast, Sep 3, 2026; cattle and calf levels and crop levels for corn, soybeans and cotton as relayed by Farm Policy News, Sep 4, 2026. $ billion, nominal cash receipts, calendar year. *Crop Root Zone estimate: level derived from ERS's stated dollar and percentage change, rounded to $0.1 billion; may differ from ERS tables by rounding. Rice (−$0.6 billion), wheat (−$0.3 billion), sugarbeets (−$1.2 billion) and sugarcane (−$0.4 billion) not shown.
Corn and soybeans together add $11.1 billion, about 76% of the crop gain (Crop Root Zone calculation). On the animal side, eggs lose $20.9 billion, which is more than the whole animal decline. Without eggs, animal receipts would be up about $4.5 billion (Crop Root Zone calculation). Cattle receipts rise $7.0 billion to $140.7 billion. Brad Lubben of the University of Nebraska-Lincoln called the situation "a tale of two farms," with ranches earning record returns while crop farms have struggled since 2022 (Farm Policy News, Sep 4, 2026).
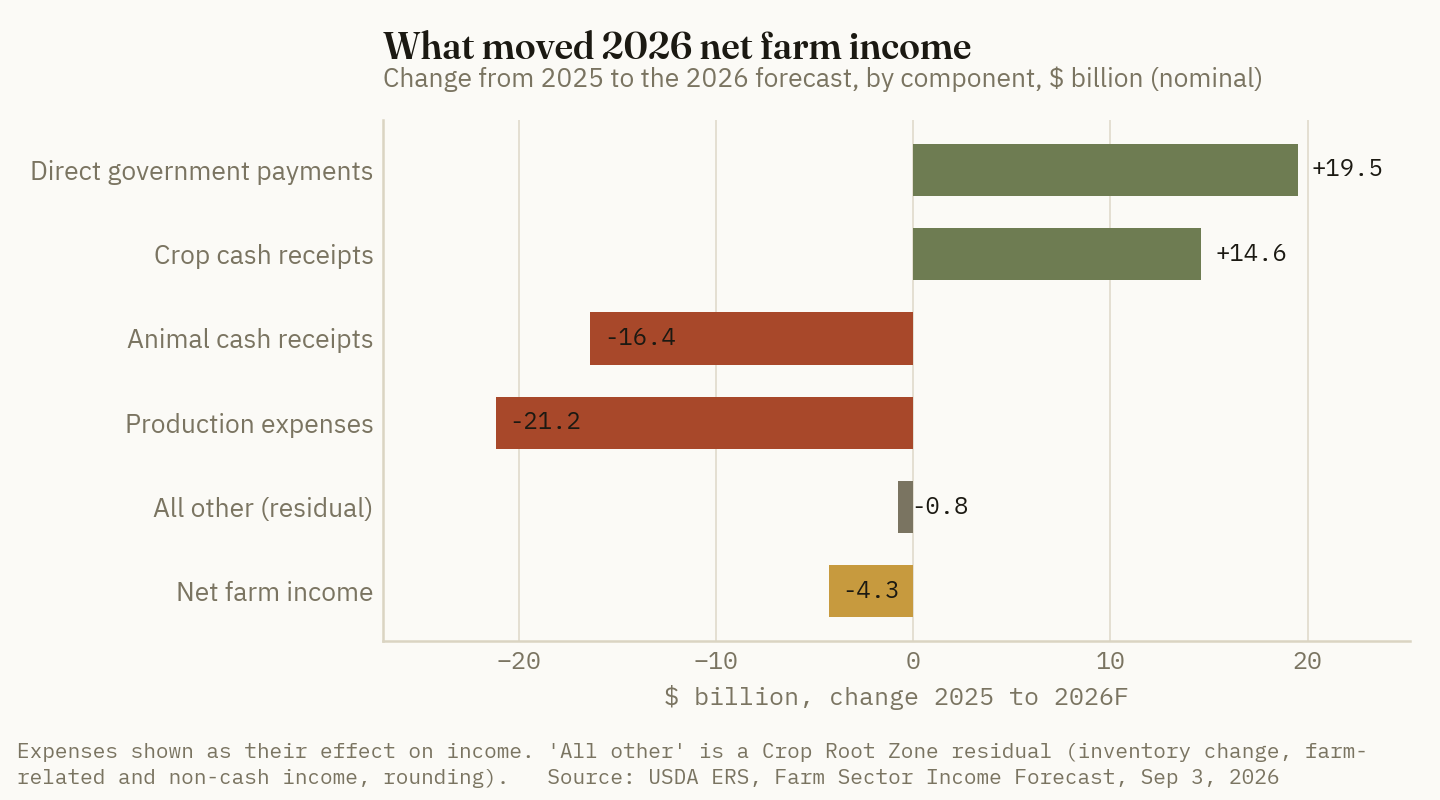
Ground Truth: The sector-wide "animal receipts down 5.4%" is an egg story. Cattle, the largest single commodity, are up. For the corn market, that matters. Livestock demand, the feed base that absorbs a large share of the corn crop, is not weakening. Lower egg prices cut a laying flock's revenue; they do not by themselves cut its feed use. Grain growers should not read the animal decline as a sign that feed demand is softening.
3. $47.4 billion in payments, and roughly half of it pays for last year's crop
What's new: ERS splits 2026 direct payments into three groups. Supplemental and ad hoc disaster assistance is $26.5 billion, mainly the Farmer Bridge Assistance (FBA) program and supplemental disaster aid under the American Relief Act of 2025. Farm bill commodity payments are $15.6 billion, up $13.4 billion because the One Big Beautiful Bill Act changed Agriculture Risk Coverage (ARC) and Price Loss Coverage (PLC). Conservation payments are $5.3 billion (USDA ERS, Sep 3, 2026).
Evidence:
| Payment group | 2025 | 2026F | Change | |
|---|---|---|---|---|
| Supplemental and ad hoc disaster assistance | 21.2* | 26.5 | +5.3 (+24.9%) | ██████████ |
| Farm bill commodity programs (mainly ARC and PLC) | 2.2* | 15.6 | +13.4 | ██████░░░░ |
| Conservation | 4.5* | 5.3 | +0.8 (+16.9%) | ██░░░░░░░░ |
| Total direct payments | 27.9 | 47.4 | +19.5 (+69.8%) |
Source: USDA ERS, Farm Sector Income Forecast, Sep 3, 2026. $ billion, nominal, calendar year of payment. *2025 level derived from ERS's stated change. Dairy Margin Coverage is forecast at $169.9 million, up $167.0 million. Bars scale the 2026 level to ten blocks at $26.5 billion.
ERS records payments in the calendar year they are paid, not the crop year they cover. Two of the largest items in the 2026 total cover the 2025 crop. FBA used an $11 billion allocation to pay flat per-acre rates on acres planted in 2025, including $44.36 an acre for corn and $30.88 for soybeans, with payments due by Feb 28, 2026 and a $155,000 limit per person or entity (farmdoc daily, Jan 6, 2026). ARC and PLC payments for the 2025 crop, the first to include the new law's higher reference prices, were projected in November 2025 at more than $13.5 billion, to be paid in October 2026. The projection was about $66 per base acre for corn and $22 for soybeans (farmdoc daily, Nov 18, 2025).
Taken together, $11 billion of FBA and roughly $13.5 billion of 2025-crop ARC/PLC come to about $24.5 billion, or about 52% of the $47.4 billion (Crop Root Zone estimate). The inputs come from different sources and dates. The FBA figure is an allocation, not actual disbursement. The ARC/PLC figure was a projection made before the 2025 marketing-year average prices were final. ERS does not publish a crop-year split, so "roughly half" is the right precision.
Ground Truth: The payment that ends up in a grain farm's 2026 bank account largely pays for the 2025 crop, which lost money. ARC/PLC for the 2026 crop would normally not arrive until October 2027. At today's prices it will be smaller, because the corn and soybean rally cuts the formula payments. This desk has not found an announced FBA-style program for the 2026 crop. Unless Congress or USDA adds new ad hoc aid, grain-farm cash receipts from government in calendar 2027 look likely to fall sharply from 2026. The drop will show up in the cash flow a year after the crop that caused it.
4. Fertilizer and fuel make up nearly half of a $21.2 billion rise in expenses
What's new: Total production expenses are forecast at $492.8 billion, $21.2 billion above 2025 and $15.1 billion above USDA's February forecast. Fertilizer, lime and soil conditioners rise $5.3 billion or 15.3% to $39.6 billion. Fuel and oil rise $4.8 billion or 28.8% to $21.6 billion (USDA ERS, Sep 3, 2026; American Farm Bureau Federation, Sep 3, 2026).
Evidence:
| Expense category | 2025 | 2026F | Change | Change % | |
|---|---|---|---|---|---|
| Livestock and poultry purchases | 64.5* | 71.9 | +7.4 | +11.4% | ██████████ up |
| Fertilizer, lime, soil conditioners | 34.3* | 39.6 | +5.3 | +15.3% | ███████ up |
| Fuel and oil | 16.8* | 21.6 | +4.8 | +28.8% | ██████ up |
| Marketing, storage, transportation | 10.8† | 12.1† | +1.3† | +12% | ██ up |
| Interest | 32.9† | 33.8† | +0.9 | +2.8% | █ up |
| Property taxes and fees | 18.1† | 18.9† | +0.9 | +4.8% | █ up |
| Cash labor | 44.7* | 44.3 | −0.4 | −0.8% | █ down |
| Pesticides | 21.2† | 19.8† | −1.4 | −6.6% | ██ down |
| Feed | 71.0* | 69.5 | −1.5 | −2.1% | ██ down |
| Total production expenses | 471.6 | 492.8 | +21.2 | +4.5% |
Source: USDA ERS, Farm Sector Income Forecast, Sep 3, 2026 (levels and changes for total, livestock purchases, feed, cash labor, fertilizer, fuel, pesticides); American Farm Bureau Federation, Sep 3, 2026 (marketing, storage and transportation; interest, $921 million; property taxes, $867 million). $ billion, nominal. *2025 level derived from ERS's stated change. †Crop Root Zone estimate: level derived from a reported percentage and approximate dollar change; treat as ±$0.5 billion. Bars scale absolute change to ten blocks at $7.4 billion.
Fertilizer and fuel add $10.1 billion, about 48% of the increase (Crop Root Zone calculation). Livestock purchases add another $7.4 billion. In this desk's reading, much of that category is feeder cattle bought by feedlots and stocker operations, which rises with the same cattle prices that lift cattle receipts; the ERS summary does not break it out. Feed, the largest single expense, falls. Interest rises a modest 2.8%, but the debt behind it reaches a record $605.1 billion, up 4.6%, and the debt-to-asset ratio rises from 13.34% to 13.54% (Pro Farmer, Sep 3, 2026). The Farm Bureau economists pointed to disruption of Strait of Hormuz traffic as a further risk to energy, transportation and fertilizer costs (Farm Policy News, Sep 4, 2026, relaying the American Farm Bureau Federation).
Ground Truth: The two fastest-rising categories fall on crop farms. Of the categories that decline, only pesticides is mainly a crop cost, and it offsets $1.4 billion of a $10.1 billion increase. The livestock sector's big cost increase is feeder cattle, which it recovers in the sale price. A grain farm's big cost increase is fertilizer and diesel, which it does not. Calendar-year fertilizer expense also includes fall 2026 applications for the 2027 crop. farmdoc's first 2027 budget carries central Illinois corn fertilizer at $263 an acre, $34 above the 2026 projection. The 15.3% sector increase is the start of the pressure on 2027 costs, not the whole of it.
5. What a central Illinois corn-soybean farm sees: support falls, price carries the return
What's new: ERS forecasts that average net cash farm income for corn-specialized farm businesses rises 46% to $306,100 in 2026, and for soybean farms rises 44% to $112,000. Dairy farms fall 12%, hog farms fall 10%, cattle farms are flat at $50,300, and poultry and egg farms fall to −$3,400 (USDA ERS, Farm Business Income, Sep 3, 2026). ERS's next update is due Dec 2, 2026 (USDA ERS, Farm Income and Wealth Statistics, Sep 3, 2026). The University of Illinois crop budgets show how different the crop-year picture looks from the calendar-year one (farmdoc daily, Sep 1, 2026).
Evidence:
| Central Illinois, high-productivity, $/acre | Corn 2025 | Corn 2026P | Soybeans 2025 | Soybeans 2026P |
|---|---|---|---|---|
| Yield, bu/acre | 242 | 240 | 75 | 76 |
| Price, $/bu | 4.09 | 4.95 | 10.24 | 12.20 |
| Crop revenue | 990 | 1,188 | 768 | 927 |
| ARC/PLC | 42 | 17 | 42 | 17 |
| Ad hoc federal payments | 44 | 0 | 31 | 0 |
| Crop insurance proceeds | 4 | 10 | 2 | 5 |
| Fertilizers | 210 | 229 | 63 | 66 |
| Fuel and oil | 22 | 28 | 19 | 23 |
| Interest (non-land) | 36 | 39 | 30 | 33 |
| Total non-land costs | 806 | 835 | 502 | 512 |
| Cash rent | 326 | 321 | 326 | 321 |
| Farmer return | −52 | 59 | 15 | 116 |
| Farmer return excluding government payments† | −138 | 42 | −58 | 99 |
| Break-even price, total costs, $/bu | 4.68 | 4.82 | 11.05 | 10.96 |
Source: farmdoc daily (16):157, Paulson, Schnitkey, Zulauf and Zwilling, Sep 1, 2026, Table 2 (Illinois FBFM data for 2025; farmdoc projections for 2026, original release August 2026). Crop years, not calendar years. †Crop Root Zone calculation: farmer return minus ARC/PLC and ad hoc federal payments.
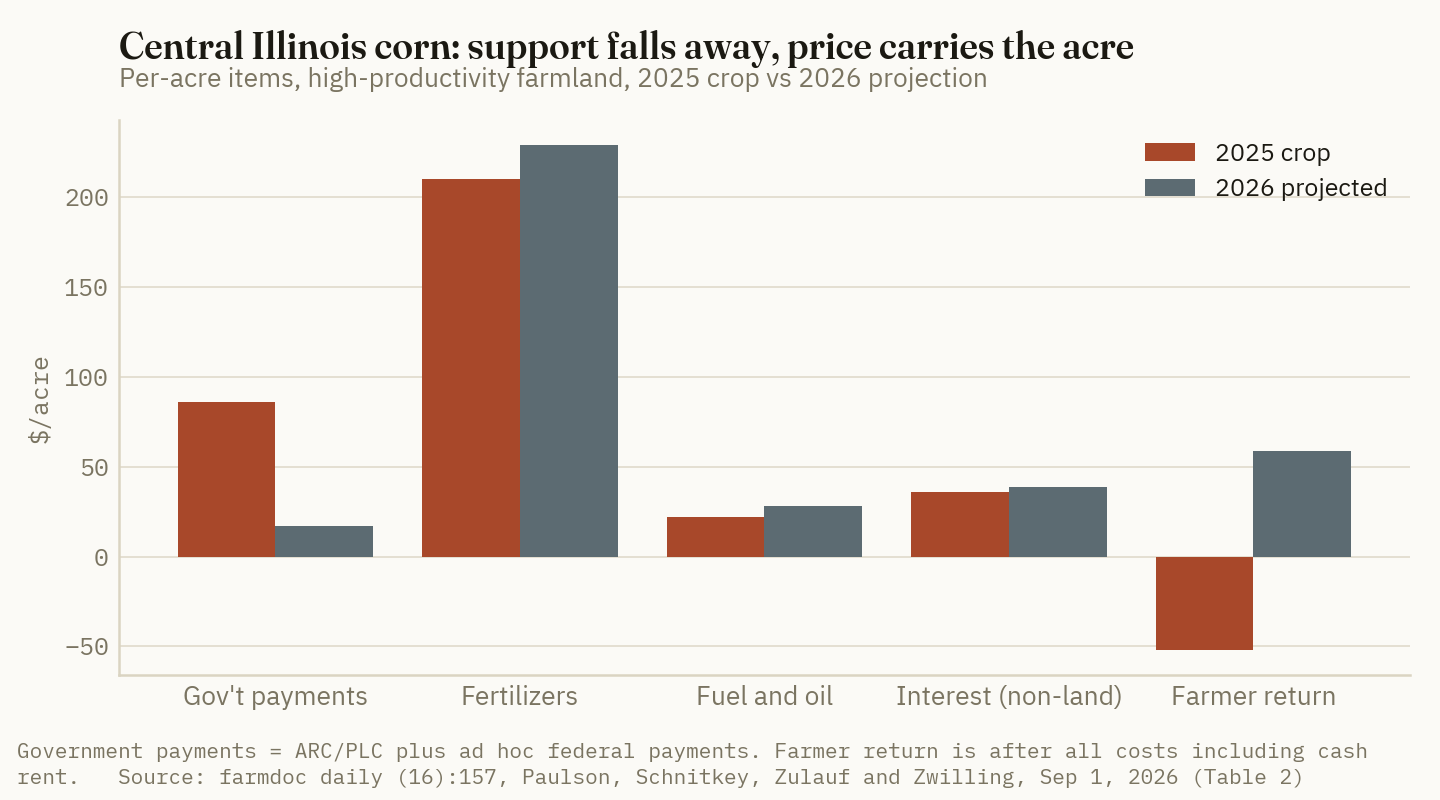
Two numbers stand out. First, the corn-farm income increase ERS forecasts is a calendar-year cash figure. It includes the $44 FBA payment and the 2025-crop ARC/PLC payment, both for a crop that lost $52 an acre after payments and about $138 before them. Second, the 2026 crop's projected return has almost nothing to do with support. Support is $17 an acre, and before it corn earns $42 and soybeans $99. On a 50-50 rotation, that is about $71 an acre from the market, compared with about −$98 for 2025 (Crop Root Zone calculation from farmdoc daily, Sep 1, 2026). Costs moved much less than revenue. Corn non-land costs rose $29 an acre, of which fertilizer was $19 and fuel $6, while crop revenue rose $198. The 2026 fertilizer figure did not change in the September revision. The only 2026 cost change was fuel and oil (farmdoc daily, Sep 1, 2026). The authors warn that the price gains came mostly within the past month. December corn futures had implied about $4.50 through spring and less in June and July, and a $0.50 move in corn price shifts returns by more than $100 an acre (farmdoc daily, Sep 1, 2026).
Ground Truth: The aggregate and the grain farm are moving in opposite directions. The sector's income is becoming more dependent on payments. A central Illinois corn-soybean acre's 2026 return is becoming less dependent on them, and more dependent on a $4.95 corn price and a $12.20 soybean price that did not exist in July. That makes the 2026 crop less protected than the 2025 crop. The formula payments shrink as prices rise, and no ad hoc payment is announced to catch a reversal. At a $4.82 total-cost break-even, a return to the spring's $4.50 corn price would cut about $108 of revenue and leave the corn acre roughly $50 under water, before any change in ARC/PLC or insurance proceeds, with only $17 of support behind it (Crop Root Zone calculation). The farmdoc authors suggest pricing more of the 2026 crop than usual at harvest. That is the practical response to what this forecast shows: the payments arriving this year cover last year's crop, and the protection for this year's crop is whatever price the grower locks in.
References
- USDA Economic Research Service, "Farm Sector Income Forecast," updated Sep 3, 2026 — https://www.ers.usda.gov/topics/farm-economy/farm-sector-income-finances/farm-sector-income-forecast
- USDA Economic Research Service, "Highlights From the Farm Income Forecast," updated Sep 3, 2026 — https://www.ers.usda.gov/topics/farm-economy/farm-sector-income-finances/highlights-from-the-farm-income-forecast
- USDA Economic Research Service, "Farm Business Income," updated Sep 3, 2026 — https://www.ers.usda.gov/topics/farm-economy/farm-sector-income-finances/farm-business-income
- USDA Economic Research Service, "Farm Income and Wealth Statistics" (release of Sep 3, 2026; next release Dec 2, 2026) — https://www.ers.usda.gov/data-products/farm-income-and-wealth-statistics
- Farm Policy News (University of Illinois), Ryan Hanrahan, "USDA's 2026 Farm Income Outlook Improves, but Expenses Sharply Higher," Sep 4, 2026 — https://farmpolicynews.illinois.edu/2026/09/usdas-2026-farm-income-outlook-improves-but-expenses-sharply-higher/
- American Farm Bureau Federation, Market Intel, Faith Parum and Daniel Munch, "USDA Revises Farm Income Higher, but Costs Still Bite," Sep 3, 2026 — https://www.fb.org/intel/markets/usda-revises-farm-income-higher-but-costs-still-bite
- Pro Farmer, "Farm Sector 2026 Profits Forecast to Fall," Sep 3, 2026 — https://www.profarmer.com/news/agriculture-news/farm-sector-2026-profits-forecast-fall
- DTN/Progressive Farmer, Jake Zajkowski, "From Farm Aid to Trump's Promised Dividend, Payments Grow," Sep 10, 2026 — https://www.dtnpf.com/agriculture/web/ag/blogs/ag-policy-blog/blog-post/2026/09/10/farm-aid-trumps-promised-dividend
- farmdoc daily (16):157, Nick Paulson, Gary Schnitkey, Carl Zulauf and Bradley Zwilling, "Illinois Crop Budgets for 2027," Sep 1, 2026 — https://farmdocdaily.illinois.edu/2026/09/illinois-crop-budgets-for-2027.html
- farmdoc daily, Nick Paulson, Gary Schnitkey, Jonathan Coppess and Carl Zulauf, "Farmer Bridge Assistance Program Payment Rates," Jan 6, 2026 — https://farmdocdaily.illinois.edu/2026/01/farmer-bridge-assistance-program-payment-rates.html
- farmdoc daily (15):213, Nick Paulson, Henrique Monaco, Gary Schnitkey, Jonathan Coppess and Carl Zulauf, "Projected ARC and PLC Payments for 2025," Nov 18, 2025 — https://farmdocdaily.illinois.edu/2025/11/projected-arc-and-plc-payments-for-2025.html
Disclosures
Crop Root Zone is an independent publication. Nothing here is investment advice. Market calls, where included, reflect the editors' own read and are not a recommendation to buy or sell any security.
A Hired Fall Strip-Till Pass With Banded Dry Fertilizer Costs About $32 an Acre in Iowa. A New 16-Row Rig Asked at $249,000 Beats That Past About 1,300 Acres. The Trials Do Not Let It Cut the P and K Rate.
Iowa's $29.65 survey rate, repriced to $5.63 farm diesel, is $32.12 an acre, or 7.3 bushels of $4.37 corn, and it is $20.50 cheaper than hiring a chisel pass, a field cultivator pass and a spreader. A new 16-row bar with a dry fertilizer cart carries about $28,100 a year of fixed cost and breaks even near 1,300 acres with the tractor treated as paid for, near 1,950 with it charged. Illinois trials put strip-till 4.5% to 7.8% above no-till corn. Twenty-five years of Iowa trials found no banded rate that held yield below the broadcast rate.
Iowa's 2026 custom rate survey prices a strip-till pass that bands dry fertilizer at $29.65 an acre, materials excluded, with a median of $30.00 and a range of $17 to $40 across 21 responses (Iowa State University, AgDM A3-10, Mar 2026) [1]. That rate assumed $2.89 diesel. Illinois farm diesel averaged $5.63 in the week ending October 2 (USDA AMS, Oct 2, 2026) [6], which moves the pass to about $32.12, or 7.3 bushels of corn at the October 9 Iowa cash average of $4.37 (USDA AMS, Oct 9, 2026) [7]. The machine that does the work, a new 16-row bar with a dry fertilizer cart, was listed by dealers on October 12 at a median asking price of $249,000 (Machinery Pete, accessed Oct 12, 2026) [10]. This piece prices the hired pass in four state surveys, prices the passes it replaces, builds an ownership cost for the new rig, and then sets the result against the university trial record on yield and on the claim that banding lets a grower cut the phosphorus and potash rate. The cost side produces a clean break-even. The rate-cut side does not hold up.
1. What a hired strip-till pass costs in four surveys
What's new: Four state surveys published this year report strip-till with and without fertilizer. The pass with fertilizer runs from $26.28 in Kansas to $35.85 in Ohio. Adding the fertilizer costs far less than a separate application pass.
Evidence:
| Survey (2026) | Service | Average $/acre | Median or most common | Range | Responses |
|---|---|---|---|---|---|
| Iowa | Strip-till, no fertilizer | 23.20 | 23.50 | 15.00–30.00 | 20 |
| Iowa | Strip-till, dry bulk fertilizer, banded | 29.65 | 30.00 | 17.00–40.00 | 21 |
| Iowa | Strip-till, liquid fertilizer, knifed | 28.15 | 29.00 | 17.00–39.00 | 16 |
| Iowa | Strip-till, anhydrous | 28.35 | 29.50 | 17.00–37.00 | 18 |
| Nebraska | Strip-till, tillage only | 25.67 | 22 | 14–36 | 9 |
| Nebraska | Strip-till with fertilizer application | 26.71 | 30 | 18–36 | 14 |
| Ohio | Strip tillage | 30.25 | 30.00 | 20.00–37.00 | 8 |
| Ohio | Strip tillage with fertilizer injection | 35.85 | 35.00 | 28.00–43.00 | 13 |
| Kansas | Strip tillage, with or without chemicals | 26.28 | — | — | — |
| Kansas | Deep strip-till, over 6 inches | 27.07 | — | — | — |
Basis: $/acre, materials excluded, operator, tractor and fuel included. Source: Iowa State University Extension, AgDM A3-10, Mar 2026 [1]; University of Nebraska–Lincoln, Nebraska Agricultural Custom Rates 2026 [2]; Ohio State University Extension, Ohio Farm Custom Rates 2026 [3]; Kansas Department of Agriculture and Kansas State University LUSO, Kansas Custom Rates 2026 [4]. Iowa's ranges exclude the single highest and lowest response; Ohio's range is its reported minimum and maximum. Kansas combined its with- and without-chemical rates because they were nearly equal; its report text prints the average as "$6.28," and its history table gives $26.28. Kansas district tables did not extract cleanly, so no range or response count is shown.
Illinois has no survey; its benchmark is farmdoc's cost estimate of $26.10 an acre for a new 16-row bar making strips only, with no profit margin (Lattz and Schnitkey, farmdoc, Aug 2025) [5]. We did not open Michigan or Minnesota rate publications for this piece.
Iowa's rows show what the market charges for the fertilizer itself. Banding dry product in the strip adds $6.45 to the bare strip-till rate. Broadcasting it in a separate trip costs $8.15 [1]. Putting anhydrous through the strip-till bar adds $5.15, against $15.55 for a stand-alone anhydrous pass with the operator's toolbar, the rate our September 25 piece worked from [1][21].
Repricing for diesel. Iowa State's fuel table has no strip-till row (Iowa State University, AgDM A3-27, Feb 2026) [8]. farmdoc puts a 16-row bar at 0.9 gallons an acre and a 12-row at 0.7 [5]. At 0.9 gallons, the $2.74 gap between Iowa's $2.89 basis and $5.63 adds $2.47. Nebraska's respondents expected $2.93 diesel [2]. Ohio's authors say only that most responses were priced near the low end of a $3.36 to $5.81 range [3], and Kansas publishes no basis [4].
Ground Truth: For a grower who already hires strip-till, the band is the cheapest fertilizer application in the Iowa survey: $6.45 for dry and $5.15 for anhydrous, against $8.15 and $15.55 for separate trips. Strip-till plus anhydrous in one pass is $28.35; the two passes hired apart are $38.75. A quote that prices the fertilizer add-on above about $8 an acre is charging more than a spreader would.
2. What the pass replaces, in dollars and bushels
What's new: The strip-till pass is usually sold against a full-tillage program: a fall chisel pass, a spring field cultivator pass and a broadcast spreader. On Iowa's rates and current diesel that program costs $52.62 an acre to hire. Strip-till with banded dry fertilizer costs $32.12.
Evidence:
| Hired pass (Iowa basis) | Survey rate | Fuel, gal/acre | At $5.63 diesel* | Corn bu at $4.37 | |
|---|---|---|---|---|---|
| Chisel plow | 20.75 | 0.90 | 23.22 | 5.3 | ████░░░░░░ |
| Field cultivate | 19.20 | 0.60 | 20.84 | 4.8 | ████░░░░░░ |
| Dry bulk fertilizer, applied | 8.15 | 0.15 | 8.56 | 2.0 | ██░░░░░░░░ |
| Three passes together | 48.10 | 1.65 | 52.62 | 12.0 | ██████████ |
| Strip-till, dry fertilizer banded | 29.65 | 0.90 | 32.12 | 7.3 | ██████░░░░ |
| Saving against the three passes | 18.45 | 0.75 | 20.50 | 4.7 | ████░░░░░░ |
| Extra cost against the spreader alone | 21.50 | −0.75 | 23.56 | 5.4 | ████░░░░░░ |
Basis: $/acre, materials excluded. Source: rates from Iowa State University, AgDM A3-10, Mar 2026 [1]; chisel and field cultivator fuel are the updated medians in AgDM A3-27, Table 2, and the spreader figure is Table 1, Feb 2026 [8]; strip-till fuel from farmdoc, Aug 2025 [5]; diesel from USDA AMS, Oct 2, 2026 [6]; corn from USDA AMS, Oct 9, 2026 [7]. *Crop Root Zone estimate: survey rate + gallons × $2.74. Bars scale the diesel-adjusted column, with the three-pass total = 10 blocks.
The table holds two different decisions. A grower leaving full tillage saves $20.50 an acre, or 4.7 bushels, before any yield change. A no-till grower who now hires only the spreader pays $23.56 more, or 5.4 bushels, and needs that much yield back. Owned iron tells the same story at cost: farmdoc's full cost for a new chisel plow and field cultivator is $19.50 plus $15.30, or $34.80, against $26.10 for the strip-till bar [5].
Our October 1 piece found that a hired chisel pass ahead of soybeans does not return its cost in long-term plots [20]. Nothing here changes that. The comparison in this table applies to ground going to corn.
3. What a new rig costs to own, and where it beats hiring
What's new: Five dealer listings for a new 2026 Kuhn Krause Gladiator 1210, 16 rows on 30 inches with a Montag dry fertilizer system (9-ton where the listing states a size), carried asking prices of $213,500 to $253,000, with a median of $249,000 [10]. farmdoc lists a 16-row strip-till bar without fertilizer delivery at $182,112 [5]. On Iowa State's cost method the rig carries about $28,100 a year of fixed cost.
Evidence:
| Input | Value | Basis |
|---|---|---|
| Purchase price | $249,000* | Median asking price, five new listings [10] |
| Years held | 10 | farmdoc convention [5] |
| Resale at end | $74,700* | 30% after 10 years, "other tillage" class [9] |
| Real interest rate | 5.12%* | 7.12% operating-loan rate [11] less 2% inflation [9] |
| Tractor | 490 hp | farmdoc, 16-row bar [5] |
| Field capacity | 23.3 acres/hour | farmdoc [5] |
| Design load | 1,629 acres/year | farmdoc [5] |
| Capital recovery | $26,529/year | (249,000 − 74,700) × 0.13026 + 74,700 × 0.0512 |
| Insurance and housing | $1,618/year | 1% × (249,000 + 74,700) ÷ 2 [9] |
| Fixed cost | $28,148/year | Sum of the two lines above |
| Fuel and lube | $5.83/acre | 0.9 gal × $5.63 × 1.15 [5][6][9] |
| Labor | $1.04/acre | $22 × 1.1 ÷ 23.3 [1][9] |
| Repairs | $3.54/acre* | Proxy, explained below |
| Variable cost, tractor treated as paid for | $10.41/acre | Sum of the three lines above |
| Tractor overhead | $7.30/acre | farmdoc, on farmdoc's assumptions [5] |
| Variable cost, tractor charged | $17.71/acre |
Source: Crop Root Zone calculation on the method in Iowa State University AgDM A3-29, Mar 2026 [9], with inputs from farmdoc, Aug 2025 [5]; Machinery Pete, accessed Oct 12, 2026 [10]; Federal Reserve Bank of Chicago, Aug 2026 [11]; USDA AMS, Oct 2, 2026 [6]; and AgDM A3-10 [1]. *Crop Root Zone assumption or estimate. The capital recovery factor is 0.0512 × 1.0512¹⁰ ÷ (1.0512¹⁰ − 1) = 0.13026.
Four of those inputs are ours and need defending.
- Price. These are asking prices from two dealers on one site on one day, and sale prices are lower. We use the ask with no discount. Iowa State applies its resale percentages to list price, which we do not have for this configuration, so resale is taken as 30% of the ask.
- Interest. The Chicago Fed's survey put Seventh District operating loans at 7.12% at the end of the second quarter and reports no machinery rate (Federal Reserve Bank of Chicago, Aug 2026) [11]. Iowa State's method subtracts expected inflation, which it sets at 2% [9].
- Repairs. ASABE has no strip-till category. At the design load the rig logs about 700 hours in ten years. We applied Iowa State's chisel-plow curve (17% of list at 700 hours) to farmdoc's $182,112 bar and its fertilizer-spreader curve (40%) to the remaining $66,888 [9]. That is $57,714 over 16,290 acres. It is the least certain line in the model.
- Labor. Iowa's median wage for machinery operation other than spraying or harvest is $22 an hour [1], times 1.1 for service time [9].
Break-even acres equal fixed cost divided by the gap between the hired rate and the owner's variable cost.
| Hired benchmark, diesel-adjusted | $/acre | Break-even, tractor paid for | Break-even, tractor charged |
|---|---|---|---|
| Ohio, strip-till with fertilizer injection | 37.89* | 1,024 | 1,395 |
| Iowa, dry fertilizer banded | 32.12 | 1,297 | 1,954 |
| Iowa, liquid fertilizer knifed | 30.62 | 1,393 | 2,181 |
| Nebraska, with fertilizer application | 29.14 | 1,503 | 2,463 |
| Kansas, combined rate | 28.75* | 1,535 | 2,551 |
Basis: acres per year. Source: Crop Root Zone calculation, $28,148 ÷ (hired rate − $10.41 or $17.71). Hired rates are the Section 1 averages [1][2][3][4] plus 0.9 gallons × the gap between $5.63 [6] and each survey's fuel basis. *Ohio is adjusted from $3.36, the low end of the range its authors describe; Kansas publishes no basis and Iowa's $2.89 is assumed. The liquid row sets a dry rig against the liquid rate because we found no priced new liquid rig.
1,297 acres
What a new 16-row strip-till rig with a dry cart, bought at the $249,000 median asking price, has to cover each fall to cost the same as hiring Iowa's dry-banded pass at current diesel, with the tractor treated as already paid for. (Crop Root Zone calculation, Oct 12, 2026)
| Acres a year | Own, tractor paid for, $/acre | Own, tractor charged, $/acre | Paid-for column, scaled |
|---|---|---|---|
| 400 | 80.78 | 88.08 | ██████████ |
| 600 | 57.32 | 64.62 | ███████░░░ |
| 800 | 45.59 | 52.89 | ██████░░░░ |
| 1,000 | 38.56 | 45.86 | █████░░░░░ |
| 1,300 | 32.06 | 39.36 | ████░░░░░░ |
| 1,629 | 27.69 | 34.99 | ███░░░░░░░ |
| 2,000 | 24.48 | 31.78 | ███░░░░░░░ |
| 2,500 | 21.67 | 28.97 | ███░░░░░░░ |
Basis: $/acre, $28,148 ÷ acres + variable cost; read each row against Iowa's $32.12. Source: Crop Root Zone calculation, inputs as above. Bars scale the paid-for column, with 400 acres = 10 blocks. Repairs are held at $3.54 an acre across acreages.
Three things move the line. Each point of interest is worth about 85 acres: the break-even is 1,202 at Iowa State's 4% example rate and 1,469 if the full 7.12% is charged. Price matters more: at the $213,500 low ask the line is 1,112 acres. Diesel barely matters, because the owner burns the fuel the custom operator passes through. At the survey's $2.89 the Iowa break-even was 1,275 acres, 22 fewer.
The tractor is the larger swing, as it was for anhydrous bars [21]. With a 490-horsepower tractor charged at farmdoc's $7.30, owning at the 1,629-acre design load costs $34.99, which is $2.87 above the Iowa hired rate. The rig then has to cover 1,954 acres, 20% more than farmdoc sizes it for. At 23.3 acres an hour that is 84 field hours.
Ground Truth: The rig's fixed cost is 11.3% of its purchase price each year, so the Iowa rate sets a price ceiling by acreage. With the tractor paid for, a rig matches hiring at 1,000 acres only if it costs about $192,000, at 800 acres about $154,000 and at 600 acres about $115,000. Those figures assume new-machine repairs, which a used rig will exceed. The same site listed a 2023 16-row at $190,000 and a 2022 16-row at $79,900, neither with a fertilizer system stated [10]. Below about 1,000 strip-tilled acres, the purchase that can pay is a used bar, and a new one is a purchase made for timing, not cost.
4. What the trials say about yield and about cutting the rate
What's new: The public record splits three ways. Strip-till beats no-till on corn yield in the Illinois trials. It does not reliably beat full tillage. Within strip-till, deep-banded P and K yield about the same as broadcast, and Iowa's long-term trials found no banded rate that held yield below the broadcast rate.
Evidence:
| Study | Design | Result |
|---|---|---|
| Fernández and White, Illinois, 2012 [14] | 4 years near Urbana; no-till broadcast, no-till deep band, strip-till deep band | Strip-till deep band 9.43 Mg/ha, 7.8% above no-till broadcast; about 150 against 139 bu/acre* |
| Yuan and others, Illinois, 2020 [15][16] | 8 years, three farmers' fields, corn-soybean | No-till broadcast corn 6.2% below strip-till broadcast and 4.5% below strip-till deep band; soybeans 3.1% and 6.1% below; placement did not change nutrient use efficiency |
| Mallarino, Iowa, 2019 [12] | Ten long-term trials at five farms, 1994–2018, plus on-farm strips | Deep-band P never differed from broadcast; deep-band K occasionally higher in no-till; banding did not lower the rate needed for maximum yield |
| Mallarino, Iowa, 2000 [13] | More than 100 experiments | Deep-band K over broadcast: about 8 bu in ridge-till, 4 to 5 in no-till, 2 in chisel-disk corn; a coulter-knife pass alone added 2 to 3 bu to no-till |
| DeJong-Hughes, Minnesota and North Dakota, 2015–2018 [17] | On-farm strip-till, chisel and vertical tillage | Corn differences inconsistent across years and farms; soybeans unaffected except one sandy site in 2018, strip-till +3.7 bu |
| Langemeier and You, Illinois farm records, 2015–2023 [18] | Precision Conservation Management field data | No-till, one-pass and two-pass corn returned $355 to $367 an acre to operator and land; strip-till "substantially lower" |
Source: as cited in each row. *Bushel figures are Crop Root Zone conversions at 62.77 kg/ha per bu/acre; the abstract reports Mg/ha and the percentage only. The two Illinois papers were read as abstracts on AGRIS; the full texts were not reached. The Minnesota yield table and the Purdue cost tables are images we could not read, so no strip-till figure is given for either.
Against no-till, the numbers work. The pass costs 5.4 bushels more than a spreader alone. The Urbana trial's gap was about 11 bushels, and a 6.2% gain clears 5.4 bushels at any yield above 87 (our arithmetic). The Urbana trial had no strip-till broadcast arm, so it cannot say whether the band or the strip earned the yield. The later eight-year study can, and it found the two strip-till corn treatments within two points of each other [15]. A 2021 summary of that work reports that most roots and most P and K uptake sat in the top 2 to 4 inches of soil, above the 6-inch band [16].
Against full tillage, the saving is cost, not yield. Iowa State's seven-site study, as we reported on October 1 from summaries, found strip-till matched conventional tillage at its northern sites [20]. Minnesota's on-farm work found nothing consistent [17]. The Illinois farm-record data cut the other way: strip-till fields returned less than no-till and light-tillage fields [18]. We could not open the underlying handout, which exceeded our retrieval limit, and the Purdue article prints no strip-till figure in its text.
The rate cut. This is where the equipment case usually rests, and the stakes are large. Illinois distributors asked $936 a ton for MAP and $516.36 for potash in the week ending October 2 [6]. That is about $0.90 a pound of P2O5, giving the MAP's nitrogen no credit, and $0.42 a pound of K2O. The upper annual rates in Iowa's long-term trials, 56 pounds of P2O5 and 70 of K2O [12], cost about $79.55 an acre at those asks. Half of that is $39.77, or 9.1 bushels, which is more than the whole hired pass.
Mallarino's 2019 summary of the Iowa work is direct. Both the low and the high deep-band potash rates raised yield in proportion, so banding did not reduce the rate needed. Across tillage systems, he wrote, rates "cannot be reduced by banding without limiting grain yield" [12]. He attached two limits. The trials tested no rate below 28 pounds of P2O5 or 35 of K2O. And on soils testing optimum, a smaller banded rate can hold yield for a time while the soil test falls.
One non-university result points the other way. Beck's Practical Farm Research reported that a strip-till band at 25% of its full rate, 37.5 pounds each of MAP and potash, gave its highest return in 2022 at $47.54 an acre, while the top yield, 217 bushels, came from the full banded rate. The researchers said more data were needed (No-Till Farmer, Nov 15, 2023) [19]. That is one company's trial and one year's return, and the article gives no locations or soil tests.
Ground Truth: Budget the strip-till pass on tillage it replaces and on yield over no-till. Do not budget it on fertilizer savings. A half-rate plan is worth about $40 an acre this fall, enough to pay for the pass outright, and that is exactly why it should be checked against a soil test. On ground testing optimum or above, the saving is real for a year or two and is a drawdown of soil P and K, available to a broadcast program as well. On low-testing ground the Iowa record says the yield goes with the rate.
5. What the arithmetic leaves out
What's new: Four costs sit outside the model, and each one raises the owner's side of the comparison or leaves it unpriced.
Evidence:
Guidance. Strip-till needs the planter to return to the same strip, so both the bar and the planter tractor need repeatable sub-inch guidance. No signal subscription or receiver is in our ownership cost, and the surveys do not say whether hired rates include it.
Tendering. The hired rate with dry fertilizer includes getting product to the bar. Our ownership model includes no tender truck or loader. That raises every break-even in Section 3.
Liquid delivery. Iowa prices the liquid version $1.50 below the dry one [1]. We could not price a new liquid rig. The one new 12-row with a 1,600-gallon cart on the listing page was marked "call for price," and a 2015 12-row liquid bar was asked at $35,000 [10]. A manufacturer's suggested price for a larger liquid system reached us only through a search summary of a page that refused our request, and we have not used it.
The fall window. None of this prices timing. A custom operator's queue matters most on the heavy ground where a fall strip is the point, and a strip made too wet is worse than no strip. That is the case for owning below break-even, and we have no survey that puts a number on it.
What to check before signing. Ask for the hired quote with the fertilizer add-on and the fuel surcharge shown separately, and compare them with $6.45 and $2.47. Count the acres going to corn that would actually be stripped each fall, and compare the total with 1,300 if the tractor is on the farm and 1,950 if it is not. Pull the soil tests before accepting any budget that pays for the pass with a lower P and K rate.
References
- Iowa State University Extension and Outreach, Ag Decision Maker File A3-10, "2026 Iowa Farm Custom Rate Survey" (FM 1698), A. Johanns and C. Hart, revised March 2026 — https://www.extension.iastate.edu/agdm/crops/pdf/a3-10.pdf
- University of Nebraska–Lincoln, Center for Agricultural Profitability, "Nebraska Agricultural Custom Rates 2026" (report), 2026 — https://cap.unl.edu/sites/unl.edu.ianr.agecon.center-for-ag-profitability/files/media/file/2026-nebraska-custom-rates-report_ada.pdf
- Ohio State University Extension, "Ohio Farm Custom Rates 2026," summary dated June 29, 2026 — https://farmoffice.osu.edu/sites/aglaw/files/site-library/Ohio%20Farm%20Custom%20Rate%20Summary%202026%20June%2029.pdf
- Kansas Department of Agriculture and Kansas State University Land Use Survey Office, "Kansas Custom Rates 2026," accessed Oct 12, 2026 — https://www.agmanager.info/sites/default/files/pdf/CustomRates_2026.pdf
- Dale Lattz and Gary Schnitkey, University of Illinois farmdoc, "Machinery Cost Estimates: Field Operations," August 2025 (Table 1 and Appendix Table 1) — https://farmdoc.illinois.edu/assets/management/machinery-costs/field_operations_2025.pdf
- USDA Agricultural Marketing Service, Illinois Production Cost Report (Bi-weekly), report 3195, week ending Oct 2, 2026 — https://www.ams.usda.gov/mnreports/ams_3195.pdf
- USDA Agricultural Marketing Service and Iowa Department of Agriculture Market News, "Iowa Daily Cash Grain Bids," report 2850, Oct 9, 2026 — https://www.ams.usda.gov/mnreports/ams_2850.pdf
- Iowa State University Extension and Outreach, Ag Decision Maker File A3-27, "Fuel Required for Field Operations" (PM 709), revised February 2026 — https://www.extension.iastate.edu/agdm/crops/pdf/a3-27.pdf
- Iowa State University Extension and Outreach, Ag Decision Maker File A3-29, "Estimating Farm Machinery Costs" (PM 710), revised March 2026 (Tables 1b and 3) — https://www.extension.iastate.edu/agdm/crops/pdf/a3-29.pdf
- Machinery Pete, strip-till dealer listings (first page, 50 of 118 listings, asking prices), accessed Oct 12, 2026 — https://www.machinerypete.com/tillage/strip-till
- Federal Reserve Bank of Chicago, AgLetter No. 2013, August 2026 (second-quarter 2026 survey; rates at end of period) — https://www.chicagofed.org/publications/agletter/2025-2029/august-2026
- Antonio P. Mallarino, "Phosphorus and potassium fertilizer placement options when crop prices are low," Proceedings of the 2019 Integrated Crop Management Conference, Iowa State University, pp. 123–130, December 2019 — https://www.agronext.iastate.edu/soilfertility/info/Mallarino%20P%20and%20K%20placement%20Proceed%20ICM%20conf%202019.pdf
- Antonio Mallarino, "Corn and soybean responses to deep-band phosphorus and potassium," Iowa State University Integrated Crop Management, IC-484(22), Sep 18, 2000 — https://crops.extension.iastate.edu/encyclopedia/corn-and-soybean-responses-deep-band-phosphorus-and-potassium
- Fabián G. Fernández and Catherine White, "No-Till and Strip-Till Corn Production with Broadcast and Subsurface-Band Phosphorus and Potassium," Agronomy Journal, 2012, doi:10.2134/agronj2012.0064 (abstract as posted on FAO AGRIS; full text not reached) — https://agris.fao.org/search/en/records/65e003fa63b8185d9cb0ae65
- Mingwei Yuan, Fabián G. Fernández, Cameron M. Pittelkow, Kristin D. Greer and Daniel Schaefer, "Soil and crop response to phosphorus and potassium management under conservation tillage," Agronomy Journal 112(3):2302–2316, 2020 (abstract as posted on FAO AGRIS; full text not reached) — https://agris.fao.org/search/en/records/65de2eb44c5aef494fdab8b7
- Megan Sever, "Managing phosphorus and potassium is key in conservation tillage systems," Crops & Soils, Mar 3, 2021 — https://www.sciencesocieties.org/publications/crops-soils/2021/march-april/managing-phosphorus-and-potassium-is-key-in-conservation
- Jodi DeJong-Hughes, "Four years of tillage research wraps up," University of Minnesota Extension Crop News, November 2019, revised Jan 1, 2024 — https://blog-crop-news.extension.umn.edu/2019/11/four-years-of-tillage-research-wraps-up.html
- Michael Langemeier and Yufei You, "Net Return Comparisons between Tillage Systems," Purdue University Center for Commercial Agriculture, May 23, 2025 — https://ag.purdue.edu/commercialag/home/resource/2025/05/net-return-comparisons-between-tillage-systems/
- Noah Newman, "Banding Nutrients Nets Higher ROI and Yields than Broadcasting," No-Till Farmer, Nov 15, 2023 (reporting Beck's Practical Farm Research) — https://www.no-tillfarmer.com/articles/12904-banding-nutrients-nets-higher-roi-and-yields-than-broadcasting
- Crop Root Zone, TRZ-0248, "A Fall Chisel Pass Now Costs About 5 Bushels of Corn. Long-Term Trials Pay It Back on Wet Corn-on-Corn Ground, and Almost Nowhere Ahead of Soybeans.," Oct 1, 2026.
- Crop Root Zone, TRZ-0232, "Hiring an Iowa Anhydrous Pass Costs About $17 an Acre at Today's Diesel. A New Toolbar Beats It Only Past About 1,500 Acres, and Only if the Tractor Is Treated as Free.," Sep 25, 2026.
Disclosures
Crop Root Zone is an independent publication. Nothing here is investment advice. Market calls, where included, reflect the editors' own read and are not a recommendation to buy or sell any security.
A New 120-Foot Sprayer Needs About 5,600 Acre-Passes a Year to Beat Iowa's $9.35 Custom Rate. A Seven-Year-Old One Needs 3,300. A Pull-Type Needs 1,150.
At a $543,689 list price, a 5.12% real interest rate and $5.63 farm diesel, a new self-propelled sprayer carries $46,400 a year of fixed cost and beats hired spraying only above about 1,860 acres sprayed three times. A used machine at the $220,000 median asking price gets there near 1,100 acres, and a 90-foot pull-type near 380. Diesel moves the hired rate by 22 cents. Each point of interest moves the new-machine line by about 450 acre-passes. The tender truck, the applicator license and the drift claim are in none of these numbers.
Iowa's 2026 custom rate survey puts broadcast ground spraying with a self-propelled machine at $9.35 an acre, materials excluded, with a median of $9.00 and a range of $5 to $18 across 121 responses (Iowa State University, AgDM A3-10, Mar 2026) [1]. The machine that does the work lists at $543,689 new with a 120-foot boom (Lattz and Schnitkey, farmdoc, Aug 2025) [4]. Dealers were asking a median of about $220,000 for the 2018 to 2021 version on October 9 (Machinery Pete, accessed Oct 9, 2026) [12]. This piece builds an annual ownership cost for the new machine, the used one and a pull-type alternative, and sets each against the hired rate. Counted in acre-passes, which is acres times trips across them, the new machine needs about 5,600 a year, the used one about 3,300 and the pull-type about 1,150. Diesel has almost nothing to do with it.
1. What a hired pass costs, and why diesel barely moved it
What's new: The three large Corn Belt surveys published this year price a self-propelled herbicide pass between $8.57 and $9.85 an acre. Liquid fertilizer through the same machine costs about the same in Iowa and Kansas and more in Nebraska.
Evidence: Iowa's survey went to 1,122 people in early February and assumed $2.89 diesel [1]. Nebraska's respondents expected farm-delivered diesel to average $2.93 (University of Nebraska–Lincoln, 2026) [2]. Kansas does not publish its fuel basis (Kansas Department of Agriculture and K-State LUSO, 2026) [3].
| Survey (2026) | Service | Average $/acre | Median or most common | Range | Responses |
|---|---|---|---|---|---|
| Iowa | Ground, broadcast, self-propelled | 9.35 | 9.00 | 5.00–18.00 | 121 |
| Iowa | Ground, broadcast, self-propelled, tall crop | 11.15 | 10.50 | 6.00–20.00 | 65 |
| Iowa | Ground, broadcast, tractor | 8.50 | 8.00 | 5.00–14.00 | 35 |
| Iowa | Liquid fertilizer, spraying | 9.45 | 9.00 | 5.00–15.00 | 35 |
| Iowa | Liquid fertilizer, high clearance, drop hose | 13.25 | 13.75 | 8.00–20.00 | 26 |
| Iowa | Aerial | 12.00 | 11.60 | 9.00–18.00 | 54 |
| Iowa | Drone | 12.50 | 12.00 | 8.00–16.00 | 47 |
| Nebraska | Weed control, self-propelled sprayer | 9.85 | 11 | 7–12.50 | 29 |
| Nebraska | Liquid fertilizer, constant rate | 12.82 | 9 | 8–25 | 22 |
| Kansas | Herbicide, ground rig, statewide | 8.57 | — | 5.00–18.00 | 196 |
| Kansas | Liquid fertilizer, statewide | 8.28 | — | 3.00–24.00 | 137 |
Basis: $/acre, materials excluded, operator, machine and fuel included. Source: Iowa State University Extension, AgDM A3-10, Mar 2026 [1]; University of Nebraska–Lincoln, Nebraska Agricultural Custom Rates 2026 [2]; Kansas Department of Agriculture and Kansas State University LUSO, Kansas Custom Rates 2026 [3]. Iowa's ranges exclude the single highest and lowest response.
Illinois farm diesel averaged $5.63 a gallon in the week ending October 2, in a range of $5.53 to $5.81 (USDA AMS, Oct 2, 2026) [9]. That is $2.74 above Iowa's survey basis. Iowa State's fuel table puts a self-propelled sprayer at a median 0.08 gallons an acre (Iowa State University, AgDM A3-27, Feb 2026) [7]. The diesel run-up is therefore worth 22 cents on a spray pass, against $1.50 on an anhydrous pass and about $3 on a combining pass in our September pieces [20][21]. An operator who passes fuel through at cost moves Iowa's $9.35 to $9.57. We use $9.57 as the hired benchmark below.
One comparison sets spraying apart from those earlier operations. farmdoc costs a new 120-foot machine at $6.10 an acre all in, over 8,028 acres a year, with no profit allowance [4]. Iowa's custom average is 53% above that. For anhydrous bars and combines, the Iowa custom rate sat at or below farmdoc's full cost of new iron [20][21].
Ground Truth: A fuel surcharge on a spray invoice above about a quarter an acre is a rate increase, not fuel. And the 53% gap between farmdoc's machine cost and the Iowa rate is not all margin. The hired price also buys a tender truck, a licensed operator and somebody else's drift insurance, and none of those is in a machinery cost table. A grower comparing the two numbers is comparing a machine with a service.
2. What three machines cost to own
What's new: We rebuilt the ownership cost of each machine with Iowa State's ASABE-based method [5][6], this month's diesel, Iowa's surveyed spraying wage and a real interest rate taken from the Chicago Fed's latest survey.
Evidence: The inputs, with the basis for each:
| Input | New 120-ft self-propelled | Used 120-ft self-propelled | New 90-ft pull-type |
|---|---|---|---|
| List price | $543,689 | $543,689 (same class, new) | $86,930 |
| Purchase price | $462,136* | $220,000 | $73,891* |
| Years held | 10 | 5 | 10 |
| Resale value at end | $217,476 | $150,000* | $34,772 |
| Field capacity, acres/hour | 101.2 | 101.2 | 49.6 |
| Fuel, gallons/acre | 0.08 | 0.08 | 0.10 |
| Tractor | — | — | 95 hp, $1.40/acre |
Source: list prices and pull-type capacity and tractor overhead from Lattz and Schnitkey, farmdoc, Aug 2025 [4]; used price is the median dealer asking price of 39 John Deere R4038 listings, model years 2018 to 2021 with 120-foot booms, Machinery Pete, accessed Oct 9, 2026 [12]; resale at 40% of list after 10 years from Iowa State University, AgDM A3-29, Table 1b, Mar 2026 [5]; self-propelled capacity from AgDM A3-24, Feb 2026 [8]; fuel from AgDM A3-27, Feb 2026 [7]. *Crop Root Zone assumption or estimate, explained below.
Three of those cells are ours.
- Purchase at 85% of list. This is the discount our combine and toolbar pieces used [20][21]. Iowa State's worked example uses 87.5% [5]. The discount may be generous this year. Dealers listed 2026-model John Deere 412R machines with 120-foot steel booms and about 300 hours at $559,000 to $585,800 (Machinery Pete, accessed Oct 9, 2026) [13]. That is above farmdoc's list for the class. New 120-foot pull-types were listed at $144,000 and $178,000, well above farmdoc's 90-foot figure, so the pull-type column describes the smaller machine only (Machinery Pete, accessed Oct 9, 2026) [14].
- Used price of $220,000. The 39 listings ran from $72,000 to $379,500. The middle half sat between $185,000 and $259,900, and the median hour meter read 2,200. These are asking prices from one brand on one site, read on one day. Sale prices are lower. We could not reach Machinery Pete's or TractorHouse's auction-result pages, which returned access errors, so we have no sold-price series.
- Used resale of $150,000 after five years. Sixteen 2014 to 2016 listings on the same site had a median ask of $117,250 at a median 3,407 hours. The four between 2,350 and 2,900 hours asked $149,000 to $210,000 [12]. A farm adds few hours, so we took the low end of the lower-hour group. ASABE's table would say 38% of list, or $206,600 [5]. The choice matters and is tested in Section 3.
Interest. The Seventh District's average operating-loan rate was 7.12% at the end of the second quarter (Federal Reserve Bank of Chicago, Aug 2026) [10]. That is the rate our October 8 piece on operating interest used [22]. The Chicago survey does not report a machinery rate. The Kansas City Fed put rates on farm loans over $100,000 at slightly under 7% and said machinery and equipment lending was more than 50% above recent years (Federal Reserve Bank of Kansas City, Jul 10, 2026) [11]. Its machinery-loan rate sits in a data file we did not retrieve. Iowa State's method subtracts expected inflation, which it sets at 2% [5]. That gives a 5.12% real rate. Our combine piece used 5% on the same logic. Our toolbar piece used 5.5% nominal [20][21].
Repairs. Iowa State's ownership worksheet carries an ASABE repair curve for self-propelled sprayers: 5% of list by 600 hours, 26% by 2,100 and 31% by 2,400 (Iowa State University, AgDM A3-33, Jul 2015) [6]. A new machine spraying 5,500 acre-passes a year logs 543 field hours in ten years and accumulates 4.4% of list, or $0.44 an acre-pass. A used machine that starts at 2,200 hours sits on the steep part of the curve: $90.61 an hour, or $0.90 an acre-pass. The pull-type uses the boom-type sprayer curve in A3-29 and comes to $0.47 at 1,200 acre-passes a year [5]. Labor is Iowa's $25 median wage for spraying [1], times 1.2 for service time [6].
| Annual cost | New self-propelled | Used self-propelled | New pull-type |
|---|---|---|---|
| Capital recovery (depreciation plus interest), $/year | 43,004 | 23,902 | 6,876 |
| Insurance and housing at 1% of average value, $/year | 3,398 | 1,850 | 543 |
| Fixed cost, $/year | 46,402 | 25,752 | 7,419 |
| Fuel and lube at $5.63 diesel, $/acre-pass | 0.52 | 0.52 | 0.65 |
| Labor at $25/hour × 1.2, $/acre-pass | 0.30 | 0.30 | 0.60 |
| Repairs, $/acre-pass | 0.44 | 0.90 | 0.47 |
| Tractor overhead, $/acre-pass | — | — | 1.40 |
| Variable cost, $/acre-pass | 1.26 | 1.72 | 3.12 |
Basis: 5.12% real interest; capital recovery = (purchase − resale) × capital recovery factor + resale × interest rate. Source: Crop Root Zone calculation on the method in Iowa State University AgDM A3-29 [5] and A3-33 [6], with inputs from the table above, USDA AMS (Oct 2, 2026) [9] and AgDM A3-10 [1]. Every cell is our model output. Tractor overhead is farmdoc's figure on farmdoc's own assumptions [4] and is not re-based.
As a check, the rebuilt new machine carries about $6.22 an acre of overhead at farmdoc's 8,028 acres. farmdoc's figure is $5.70 [4]. The farmdoc file refers to a table of its cost variables that is not in the posted PDF, so we cannot reconcile the remaining 9%.
3. The break-evens
What's new: Break-even acre-passes equal fixed cost divided by the gap between the hired rate and the owner's variable cost. Against Iowa's diesel-adjusted $9.57, that is 5,584 for the new machine, 3,280 for the used one and 1,150 for the pull-type.
Evidence: The same division against each survey's rate, with 22 cents of diesel added to each:
| Hired benchmark, diesel-adjusted | $/acre | New self-propelled | Used self-propelled | Pull-type, tractor charged | Pull-type, tractor already owned |
|---|---|---|---|---|---|
| Kansas, herbicide, ground rig | 8.79* | 6,162 | 3,642 | 1,309 | 1,049 |
| Iowa, self-propelled broadcast | 9.57 | 5,584 | 3,280 | 1,150 | 945 |
| Iowa, liquid fertilizer, spraying | 9.67 | 5,518 | 3,239 | 1,133 | 933 |
| Nebraska, self-propelled weed control | 10.07 | 5,267 | 3,084 | 1,068 | 889 |
| Iowa, self-propelled, tall crop | 11.37 | 4,590 | 2,669 | — | — |
Basis: break-even acre-passes per year. Source: Crop Root Zone calculation from the Section 2 cost table and the Section 1 survey rates [1][2][3], each raised by 0.08 gallons × the gap between $5.63 diesel [9] and the survey's fuel basis. *Kansas publishes no fuel basis; Iowa's $2.89 is assumed. The pull-type is not set against the tall-crop rate because Iowa prices that work as a self-propelled service. "Tractor already owned" drops the $1.40 tractor overhead. Cells use unrounded fixed costs; recomputing from the rounded Section 2 figures moves some by one acre-pass.
5,584 acre-passes
What a new 120-foot self-propelled sprayer has to cover each year to cost the same as hiring at Iowa's 2026 rate plus fuel. At three passes an acre that is 1,861 acres of cropland. (Crop Root Zone calculation, Oct 9, 2026)
The same comparison as cost per acre-pass. Read each row against $9.57:
| Acre-passes a year | New self-propelled, $ | Used self-propelled, $ | Pull-type, tractor charged, $ | New machine, scaled |
|---|---|---|---|---|
| 1,000 | 47.66 | 27.47 | 10.54 | ██████████ |
| 2,000 | 24.46 | 14.60 | 6.83 | █████░░░░░ |
| 3,000 | 16.73 | 10.30 | 5.59 | ████░░░░░░ |
| 4,000 | 12.86 | 8.16 | 4.97 | ███░░░░░░░ |
| 6,000 | 8.99 | 6.01 | 4.36 | ██░░░░░░░░ |
| 8,000 | 7.06 | 4.94 | — | █░░░░░░░░░ |
| 12,000 | 5.13 | 3.87 | — | █░░░░░░░░░ |
Basis: $/acre-pass, fixed cost ÷ acre-passes + variable cost. Source: Crop Root Zone calculation, inputs as in Section 2. Bars scale the new-machine column, with 1,000 acre-passes = 10 blocks. Repairs are held at the per-acre rates in Section 2. The pull-type is not shown past 6,000 acre-passes, three times the 1,985 acres farmdoc sizes it for [4].
Three assumptions move these lines more than anything in the survey data.
- The new machine's price. Bought at the $559,000 low dealer ask instead of 85% of list, fixed cost rises to about $59,500 and the break-even to about 7,160 acre-passes.
- The used machine's resale. At the $117,250 median ask for all 2014 to 2016 listings, the break-even is about 4,010. At ASABE's $206,600, it is about 2,020.
- Hours. Iowa State's method counts field hours, which is about 54 a year at 5,500 acre-passes. The listed used machines carry 2,200 hours at five to eight years old [12]. Many were commercial rigs, and meters also count road and idle time. If a farm's meter runs twice its field hours, repairs and labor double, and the break-evens become about 6,350 and 3,870.
4. Interest and passes per acre
What's new: Diesel moved the hired rate by 2%. A point of interest moves the new machine's fixed cost by about 8%.
Evidence:
| Real interest rate | Roughly equal to a nominal loan rate of | New self-propelled | Used self-propelled | Pull-type, tractor charged |
|---|---|---|---|---|
| 3.12% | 5.12% | 4,698 | 2,786 | 968 |
| 4.00% | 6.00% | 5,086 | 3,003 | 1,048 |
| 5.12% | 7.12% | 5,584 | 3,280 | 1,150 |
| 6.12% | 8.12% | 6,033 | 3,529 | 1,243 |
| 7.12% | 9.12% | 6,487 | 3,778 | 1,336 |
Basis: break-even acre-passes per year against Iowa's $9.57. Source: Crop Root Zone calculation; base rate from Federal Reserve Bank of Chicago, Aug 2026 [10], less the 2% inflation convention in Iowa State University AgDM A3-29 [5]. Rates other than 5.12% are scenarios, not forecasts. The 4% row is Iowa State's worked example.
Each point is worth about 450 acre-passes on the new machine, 250 on the used one and 90 on the pull-type. The Chicago survey predates September's increase in the prime rate, which our October 8 piece tracked [22]. A farm that skips the inflation adjustment and charges the full 7.12% lands on the bottom row.
Passes per acre turn acre-passes into farm size:
| Passes per acre per year | New self-propelled | Used self-propelled | Pull-type, tractor charged |
|---|---|---|---|
| 2 | 2,792 | 1,640 | 575 |
| 3 | 1,861 | 1,093 | 383 |
| 4 | 1,396 | 820 | 288 |
| 5 | 1,117 | 656 | 230 |
Basis: acres of cropland at which owning matches hiring at Iowa's $9.57, at 5.12% real interest. Source: Crop Root Zone calculation, break-even acre-passes ÷ passes.
A burndown, a pre-emergence pass, one post pass and a fungicide trip is four. A liquid nitrogen pass through the same machine makes five. The count is the farm's own number, and it moves the answer as far as the interest rate does. The pull-type column assumes the machine can make every pass counted. It cannot make the ones Iowa's survey prices as tall-crop work.
Ground Truth: Spraying is the one operation in this series where used iron pays at ordinary farm size: about 1,100 acres at three passes, against 1,420 for a five-year-old combine [21]. A new machine does not pay below about 1,900 acres at three passes, and less so at this week's dealer asks. Below roughly 1,000 acres, the cheapest sourced arrangement is a split. Own a pull-type for the burndown and early passes, where the owner's cost is $6.83 at 2,000 acre-passes, and hire the tall-crop trip at about $11.37. That split also puts the pass most exposed to weather and weed height in the farm's own hands.
5. What the arithmetic leaves out
Tendering. The hired rate includes the water, the nurse truck and usually a second person. Our ownership cost includes none of them. We found no survey that prices a tender rig per acre and have not estimated one. It raises every break-even above.
Licensing. An Iowa farmer applying restricted-use products needs private applicator certification. The fee is $15 for three years, with an exam every third year or two hours of instruction each year (Iowa Code §206.5, as posted) [17]. The cash cost is trivial. The requirement that a certified person be in the seat on the right day is not.
Drift liability. Hiring does not remove a farm's exposure, but it puts a licensed applicator and that applicator's insurer into any claim. An owner-operator has only the farm's policy. Farm liability policies can cap chemical-drift coverage well below the policy limit. One Texas agent described carriers limiting it to $50,000 and said he had raised limits to $1 million for clients who asked (Texas A&M AgriLife Extension, May 23, 2016) [18]. That source is ten years old and from one state. We have no current premium quote for a drift endorsement, and none is in the model.
Timeliness. This is the usual reason given for owning, and the surveys do not price it. Iowa State's ownership guide says only that a custom operator "may not be able to" cover the crop in the optimum window [6]. We found no public trial that compares yield on owned and hired spraying. What exists is weed-science data on delay. University of Nebraska trials at Mead and Concord in 1999 and 2000 found an average 2% corn yield loss for each leaf stage that weed removal is delayed past the start of the critical period (Knezevic, UNL CropWatch, Jun 8, 2007) [15]. On farmdoc's 2027 central Illinois budget of 245 bushels at $5.00 (farmdoc daily, Sep 1, 2026) [16], that is 4.9 bushels, or $24.50 an acre, for one leaf stage.
Set that against the cost of owning below break-even. A used machine covering 2,000 acre-passes costs $14.60 a pass, $5.03 more than hiring, or about $10,050 a year. That premium is repaid if owning saves one leaf stage of delay on about 410 acres of corn each year. For a new machine at 3,000 acre-passes the premium is about $21,500 and the figure is about 880 acres. This is our arithmetic on a 26-year-old Nebraska coefficient and an Illinois budget. It is not a measured result, and it assumes the hired rig would in fact have been a leaf stage late.
What to check before signing. Count last year's acre-passes from the spray records, not from memory. Ask the custom operator for the rate with fuel shown separately and compare the surcharge with 22 cents. Price the tender setup and call the insurance agent about the drift limit before pricing the sprayer. Then compare the total with 3,300 acre-passes for a used machine and 5,600 for a new one. Our earlier piece on spray drones found a 1,000-acre break-even for an owned drone against a hired one [19]. That is a different machine doing a narrower job, and the two figures should not be read against each other.
References
- Iowa State University Extension and Outreach, Ag Decision Maker File A3-10, "2026 Iowa Farm Custom Rate Survey" (FM 1698), revised March 2026 — https://www.extension.iastate.edu/agdm/crops/pdf/a3-10.pdf
- University of Nebraska–Lincoln, Center for Agricultural Profitability, "Nebraska Agricultural Custom Rates 2026" (report), 2026 — https://cap.unl.edu/sites/unl.edu.ianr.agecon.center-for-ag-profitability/files/media/file/2026-nebraska-custom-rates-report_ada.pdf
- Kansas Department of Agriculture and Kansas State University Land Use Survey Office, "Kansas Custom Rates 2026," accessed Oct 9, 2026 — https://www.agmanager.info/sites/default/files/pdf/CustomRates_2026.pdf
- Dale Lattz and Gary Schnitkey, University of Illinois farmdoc, "Machinery Cost Estimates: Field Operations," August 2025 (Table 1 and Appendix Table 1) — https://farmdoc.illinois.edu/assets/management/machinery-costs/field_operations_2025.pdf
- Iowa State University Extension and Outreach, Ag Decision Maker File A3-29, "Estimating Farm Machinery Costs" (PM 710), revised March 2026 — https://www.extension.iastate.edu/agdm/crops/pdf/a3-29.pdf
- Iowa State University Extension and Outreach, Ag Decision Maker File A3-33, "Self-Propelled Harvesting and Spraying: Machinery Ownership Versus Custom Hire" (PM 786), revised July 2015 — https://www.extension.iastate.edu/agdm/crops/pdf/a3-33.pdf
- Iowa State University Extension and Outreach, Ag Decision Maker File A3-27, "Fuel Required for Field Operations" (PM 709), revised February 2026 — https://www.extension.iastate.edu/agdm/crops/pdf/a3-27.pdf
- Iowa State University Extension and Outreach, Ag Decision Maker File A3-24, "Estimating the Field Capacity of Farm Machines" (PM 696), revised February 2026 — https://www.extension.iastate.edu/agdm/crops/pdf/a3-24.pdf
- USDA Agricultural Marketing Service, Illinois Production Cost Report (Bi-weekly), report 3195, week ending Oct 2, 2026 — https://www.ams.usda.gov/mnreports/ams_3195.pdf
- Federal Reserve Bank of Chicago, AgLetter, August 2026 (second-quarter 2026 survey; rates at end of period) — https://www.chicagofed.org/publications/agletter/2025-2029/august-2026
- Federal Reserve Bank of Kansas City, "New Farm Loan Originations Ease Slightly," Jul 10, 2026 (Survey of Terms of Lending to Farmers, second quarter 2026) — https://www.kansascityfed.org/center-for-agriculture-and-the-economy/agricultural-finance/new-farm-loan-originations-ease-slightly/
- Machinery Pete, used John Deere R4038 self-propelled sprayer dealer listings (three pages, asking prices), accessed Oct 9, 2026 — https://www.machinerypete.com/applicators/self-propelled-sprayers/john-deere/r4038
- Machinery Pete, John Deere 412R self-propelled sprayer dealer listings (first page, asking prices), accessed Oct 9, 2026 — https://www.machinerypete.com/applicators/self-propelled-sprayers/john-deere/412r
- Machinery Pete, pull-type sprayer dealer listings (first page, asking prices), accessed Oct 9, 2026 — https://www.machinerypete.com/applicators/pull-type-sprayers
- Stevan Knezevic, University of Nebraska–Lincoln CropWatch, "Timing Weed Control in Corn to Get the Most Effect," Jun 8, 2007 — https://cropwatch.unl.edu/timing-weed-control-corn-get-most-effect
- N. Paulson, G. Schnitkey, C. Zulauf and B. Zwilling, "Illinois Crop Budgets for 2027," farmdoc daily, University of Illinois, Sep 1, 2026 — https://farmdocdaily.illinois.edu/2026/09/illinois-crop-budgets-for-2027.html
- Iowa Code §206.5, certification requirements for pesticide applicators (2018 edition as posted by the Iowa Legislature) — https://www.legis.iowa.gov/docs/code/2018/206.5.pdf
- Tiffany Dowell, Texas A&M AgriLife Extension, Texas Agriculture Law Blog, "Pesticide Drift Liability (Part 3): Practical Advice for Farmers & Ranchers Using Pesticides," May 23, 2016 — https://agrilife.org/texasaglaw/2016/05/23/pesticide-drift-liability-part-3-practical-advice-farmers-ranchers-using-pesticides/
- Crop Root Zone, TRZ-0203, "Hired Drones Now Cost About What a Plane Costs. Owning One Beats Hiring Only Past About 1,000 Acres a Year, and Tariffs and Insurance Can Push That Past 2,300.," Sep 17, 2026.
- Crop Root Zone, TRZ-0232, "Hiring an Iowa Anhydrous Pass Costs About $17 an Acre at Today's Diesel. A New Toolbar Beats It Only Past About 1,500 Acres, and Only if the Tractor Is Treated as Free.," Sep 25, 2026.
- Crop Root Zone, TRZ-0196, "A New Combine Has to Cover About 2,700 Acres a Year to Beat Iowa's Custom Rate. Diesel Moved That Line by 60 Acres; a Slow Soybean Queue Moves It 500.," Sep 15, 2026.
- Crop Root Zone, TRZ-0263, "Financing a 2027 Illinois Corn Acre Costs $35 to $55 in Interest at 7.12%, or 7 to 11 Bushels. The Rent Check's Due Date Moves It as Much as the Fertilizer's. Each Month the Line Stays Open Past November Costs $6.28.," Oct 8, 2026.
Disclosures
Crop Root Zone is an independent publication. Nothing here is investment advice. Market calls, where included, reflect the editors' own read and are not a recommendation to buy or sell any security.
A 5,000-Gallon UAN Tank Costs $67 a Ton a Year to Own. The Fall-to-Spring Price Gap Has to Top $83 to Pay for It, and Did in Three of the Last Seven Seasons. Add a Containment Dike and the Bar Passes $130.
From October 2026 dealer listings, a 5,000-gallon poly tank under the Iowa, Illinois and Minnesota containment thresholds costs $2.21 a gallon installed. Seven seasons of DTN prices put the average fall-to-spring UAN28 gain at $40 a ton after interest. Price alone does not pay; one well-bought truckload can.
A Norwesco 5,000-gallon vertical polyethylene tank rated for liquids up to 12.52 pounds a gallon is listed at $7,543.19 this week (Plastic-Mart, accessed Oct 8, 2026) [11]. Filled with 28% urea-ammonium nitrate solution at 10.67 pounds a gallon [10], it holds 26.7 short tons. At the $430 a ton national retail average DTN reported for the week of September 28 to October 2 [1], that fill is worth $11,472. We put the tank, set on a base and plumbed with a pump, at about $11,000. The storage costs what the product in it costs. This piece annualizes that capital, adds what the states require once a farm stores more than 5,000 or 6,000 gallons, and tests the result against seven seasons of fall and spring UAN prices. Our July 20 and August 5 pieces covered the prepay option and dry storage [26]. This one asks a narrower question: does a liquid nitrogen tank pay for itself on the seasonal price gap, and if not, on what?
1. What a gallon of liquid storage costs in October 2026
What's new: Listed prices for bare poly tanks run $1.51 to $2.09 a gallon of capacity this week, and the larger tanks cost more per gallon than the smaller ones, not less. Steel and fiberglass are sold by quote. The installed number depends far more on whether the site needs a dike than on which vessel sits in it.
Evidence: The poly tanks below are current dealer listings [11][12][13]. All are rated at 1.5 specific gravity or higher, which is the rating North Dakota State University's extension service says a fertilizer weighing 10 to 12 pounds a gallon needs (NDSU, Oct 9, 2008) [23]. UAN28 and UAN32 weigh 10.67 and 11.08 pounds a gallon at 60°F (CF Industries, May 2022) [10].
| Tank, listed price | Gallons | List price, $ | $/gal | UAN28 held, st | UAN32 held, st | Bare tank, $/st of UAN28 |
|---|---|---|---|---|---|---|
| Norwesco vertical, 1.5 SG | 5,000 | 7,543 | 1.51 | 26.7 | 27.7 | 283 |
| Norwesco vertical, 1.5 SG | 10,000 | 16,500 | 1.65 | 53.4 | 55.4 | 309 |
| Norwesco vertical fertilizer, 1.5 SG | 15,000 | 26,601 | 1.77 | 80.0 | 83.1 | 332 |
| Norwesco vertical fertilizer, 1.9 SG | 20,000 | 41,800 | 2.09 | 106.7 | 110.8 | 392 |
Source: Plastic-Mart listings for the 5,000-, 15,000- and 20,000-gallon tanks and Tank Depot listing for the 10,000-gallon tank, all accessed Oct 8, 2026. List price before freight; both dealers state that the buyer unloads. Tons held and dollars per ton are Crop Root Zone calculations at 10.67 and 11.08 lb/gal (CF Industries, May 2022), filled to nominal capacity.
Two things stand out. First, the 15,000-gallon tank listed at $21,299.99 when we priced it on July 20 [26]. It is $26,601.20 now, 25% higher in under three months [13]. Second, we could not find a posted price for a steel or stainless farm tank. The only fiberglass listing we found is a Manitoba surplus dealer offering a new 16,800-US-gallon tank at C$39,995, or C$2.38 a gallon (Kijiji listing, accessed Oct 8, 2026) [24]. Treat that as one data point, not a market.
The vessel is the smaller part of the bill above the state thresholds. The cleanest published costing of a farm dike is still Purdue's from 1992. It put a concrete dike and load pad at $7,797 for a 6,000-gallon tank and $9,712 for a 10,000-gallon tank (Rogers and Akridge, Jun 16, 1992) [15]. We bring those dollars forward two ways. The Consumer Price Index rose 2.38-fold between June 1992 and August 2026 [16]. The producer price index for concrete products rose 3.50-fold [17]. That brackets the 10,000-gallon dike and pad at $23,200 to $34,000 today. For a 15,000-gallon tank we extend Purdue's two points in a straight line and get $28,900 to $42,400. An Ohio conservation district official put a typical farm dike at "about $10,000" in 2005 (Farm and Dairy, Mar 3, 2005) [25], which is the same order of magnitude before two decades of construction inflation.
| Installed system | Tank, $ | Dike and pad, $ | Pump, plumbing, base, freight, $ | Total, $ | $/gal | |
|---|---|---|---|---|---|---|
| 5,000 gal poly, no dike | 7,543 | 0 | 3,500* | 11,043* | 2.21* | ███░░░░░░░ |
| 15,000 gal poly, concrete dike | 26,601 | 35,600* | 5,000* | 67,200* | 4.48* | ██████░░░░ |
| 10,000 gal poly, concrete dike | 16,500 | 28,600* | 5,000* | 50,100* | 5.01* | ███████░░░ |
| 5,000 gal double-wall poly, vessel only | 37,200 | 0 | not included | 37,200 | 7.44 | ██████████ |
Source: tank prices from Plastic-Mart and Tank Depot listings, accessed Oct 8, 2026. *Crop Root Zone estimates. Dike and pad are the midpoint of Purdue's 1992 costs escalated by the CPI and by the concrete products PPI (FRED, August 2026 readings), with the 15,000-gallon figure extrapolated. The $3,500 and $5,000 allowances for a transfer pump, stainless valve, hose, base, freight and, on the diked systems, engineering drawings are our assumption, not a quote. Bars scale $/gal, with the double-wall tank at ten blocks.
A double-wall tank is the other way to buy containment. Snyder's 5,000-gallon model, whose outer shell holds 115% to 120% of the inner tank, lists at $37,199.99 (Tank Depot, accessed Oct 8, 2026) [14]. That is $7.44 a gallon before a pump or a pad, more than a single-wall tank inside a concrete dike. Whether a state accepts it in place of a dike is a question for the state.
2. The line at 5,000 gallons
What's new: Three of the four upper Corn Belt states exempt a farm's own liquid fertilizer from containment up to a stated volume. Iowa and Illinois draw the line at 5,000 gallons and Minnesota at 6,000. The installed cost per gallon more than doubles on the other side of it.
Evidence: The rules differ in how they count.
| State | Farm storage exempt up to, gal | How it is counted | Above the line |
|---|---|---|---|
| Iowa | 5,000 | One container or a combination of containers | Secondary containment, a load pad, and plans drawn by a registered engineer and filed with the state |
| Illinois | 5,000 | A single non-mobile container holding product more than 45 consecutive days | Secondary containment holding the largest tank plus a 6-inch rain |
| Minnesota | 6,000 | Total liquid bulk fertilizer on the farm | $100 permit, containment at 125% of the largest tank plus displacement, incident response plan |
| Wisconsin | no stated volume | Rule covers bulk fertilizer stored for distribution or manufacture | Where the rule applies: professionally designed containment at 125% of the largest container |
Sources: Iowa Department of Agriculture and Land Stewardship, "On Farm Fertilizer Storage," Feb 2020; Illinois Administrative Code, title 8, sections 255.10 and 255.180; Minnesota Department of Agriculture, "On-Farm Storage of Liquid Bulk Fertilizer," accessed Oct 8, 2026; Wisconsin Administrative Code ATCP 33.01(32) and Wisconsin DATCP program sheet, rev. Feb 2024. This table is a reading of published rules, not legal advice. Confirm with the state before pouring concrete.
Iowa counts every tank on the site, so two 5,000-gallon tanks need a dike [19]. Illinois defines an on-farm storage facility by what sits in a single container for more than 45 days [20]. A fall fill held to April is well past 45 days. Minnesota allows up to 6,000 gallons without a permit or containment and, above that, wants stainless steel fittings through the first valve and advises against poly tanks more than 10 years old [21]. Wisconsin's bulk storage rule defines a storage facility as a place where product is held for distribution or manufacture [22]. As written, that does not reach a farm's own-use tank, but we could not open the rule's applicability section and a Wisconsin grower should ask the department.
One more fact shapes what goes in the tank. UAN32 salts out at 32°F. UAN28 salts out at 0°F [10]. A tank filled in October and drawn in April across an Iowa or Minnesota winter is a UAN28 tank. Our September 21 piece measured UAN28 at 5.4 cents a pound of nitrogen above UAN32 on the national board [26]. The grower who stores through winter buys the more expensive nitrogen to do it. South of roughly central Illinois the 32% case is more realistic, so we carry both.
Ground Truth: The containment threshold is the real size limit on a farm nitrogen tank, and it lands almost exactly on one truckload. A transport of UAN is roughly 25 tons by our estimate, about 4,700 gallons of 28%. A 5,000-gallon tank takes one load with a little room. A second tank on the same Iowa farmstead adds a dike, a pad and an engineer, and the cost per gallon goes from $2.21 to between $4.50 and $5.00. That means the cheapest storage a farm can build holds 83 acres of a 180-pound nitrogen program, and the next 83 acres cost more than twice as much to cover. A farm should size liquid storage to the state's line and to the truck, not to the acreage.
3. Annualizing it: $67 a ton a year without a dike, $115 to $127 with one
What's new: At 7% money, a ten-year life for the tank and pump and a twenty-year life for concrete, the exempt 5,000-gallon system costs about $1,790 a year. Filled once a year with UAN28, that is $67 a ton. The diked systems cost $115 to $127 a ton.
Evidence: The Kansas City Fed's second-quarter survey put farm non-real-estate loan rates slightly under 7% above $100,000 and slightly above 7% below it (Federal Reserve Bank of Kansas City, Jul 10, 2026) [18]. We use 7%. NDSU reports that outdoor poly tanks begin to show ultraviolet damage at five to eight years [23], and Minnesota's ten-year guidance points the same way [21], so we recover the tank, pump and plumbing over ten years. That is a capital recovery factor of 0.1424. Concrete is recovered over twenty years, at 0.0944. We add 2% of installed cost a year for insurance, repairs and upkeep. Purdue used 2% for maintenance and 3.6% for taxes and insurance in 1992 [15], so ours is the lower assumption.
| System | Installed, $ | Annual cost, $ | $/st/yr, UAN28 | $/st/yr, UAN32 | Acres covered at 180 lb N, UAN28 |
|---|---|---|---|---|---|
| 5,000 gal, no dike | 11,043* | 1,793* | 67.22* | 64.74* | 83 |
| 15,000 gal, diked | 67,200* | 9,206* | 115.04* | 110.78* | 249 |
| 10,000 gal, diked | 50,100* | 6,760* | 126.71* | 122.02* | 166 |
Source: *Crop Root Zone calculation from the installed costs in section 1. Capital recovery at 7% (Federal Reserve Bank of Kansas City, Jul 10, 2026), ten years on tank and equipment, twenty on concrete, plus 2% a year for insurance and upkeep. One fill a year to nominal capacity. Acres at 560 lb N per ton of UAN28. Using the low and high dike estimates instead of the midpoint moves the diked systems to $105 to $138 a ton.
Stretching the poly tank to fifteen years takes the exempt system to $54 a ton. Filling it twice a year halves the cost per ton to about $34, but only the fall fill can earn a seasonal gap.
The stored product also carries interest. From October 5 to an April 20 application is 197 days. At 7% that is 3.78% of the purchase price: $16.25 on a $430 ton of UAN28 and $18.25 on a $483 ton of UAN32 [1]. Our October 5 urea piece used the same clock [26].
$83 a ton
The October-to-April rise in retail UAN28 needed to cover a 5,000-gallon tank with no dike: $67.22 of ownership plus $16.25 of interest on a $430 ton. With a dike it is $131 to $143. (Crop Root Zone calculation from Plastic-Mart, accessed Oct 8, 2026; DTN/Progressive Farmer, Oct 7, 2026; Federal Reserve Bank of Kansas City, Jul 10, 2026)
4. Seven seasons of the fall-to-spring gap
What's new: We matched DTN's first October retail survey with the mid-April survey that followed, for the seven seasons from 2019–20 through 2025–26. UAN28 rose from fall to spring in five of the seven. It rose by more than the $83 a small tank needs in three, and by more than a diked tank needs in one or two.
Evidence: All prices are DTN national retail averages [1][2][3][4][5][6][7][8].
| Season | UAN28 Oct, $/st | UAN28 Apr, $/st | Change | UAN32 Oct, $/st | UAN32 Apr, $/st | Change | UAN28 change after interest* |
|---|---|---|---|---|---|---|---|
| 2019–20 | 253 | 236 | −17 | 289 | 279 | −10 | −26.56 |
| 2020–21 | 209† | 341 | +132 | 249† | 378 | +129 | +124.10 |
| 2021–22 | 400 | 631 | +231 | 456 | 730 | +274 | +215.89 |
| 2022–23 | 565 | 423 | −142 | 652 | 507 | −145 | −163.35 |
| 2023–24 | 354 | 364 | +10 | 414 | 418 | +4 | −3.37 |
| 2024–25 | 317 | 380 | +63 | 350 | 448 | +98 | +51.02 |
| 2025–26 | 419 | 520 | +101 | 465 | 579 | +114 | +85.17 |
| Seven-season average | +54 | +66 | +40.42 |
Source: DTN/Progressive Farmer Retail Fertilizer Trends, national average retail, $/short ton. October weeks: Sep 30–Oct 4, 2019; Oct 19–23, 2020; Oct 4–8, 2021; Oct 3–7, 2022; Oct 2–6, 2023; Sep 30–Oct 4, 2024; Sep 29–Oct 3, 2025. April weeks: Apr 13–17, 2020; Apr 5–9, 2021; Apr 25–29, 2022; Apr 17–21, 2023; Apr 15–19, 2024; Apr 14–18, 2025; Apr 13–17, 2026. *Crop Root Zone calculation: April price minus October price minus 3.78% of the October price. The 7% rate is applied to every season, which overstates the carry in the low-rate years. †The Oct 19–23 survey is the nearest October week in the table we could retrieve for 2020.
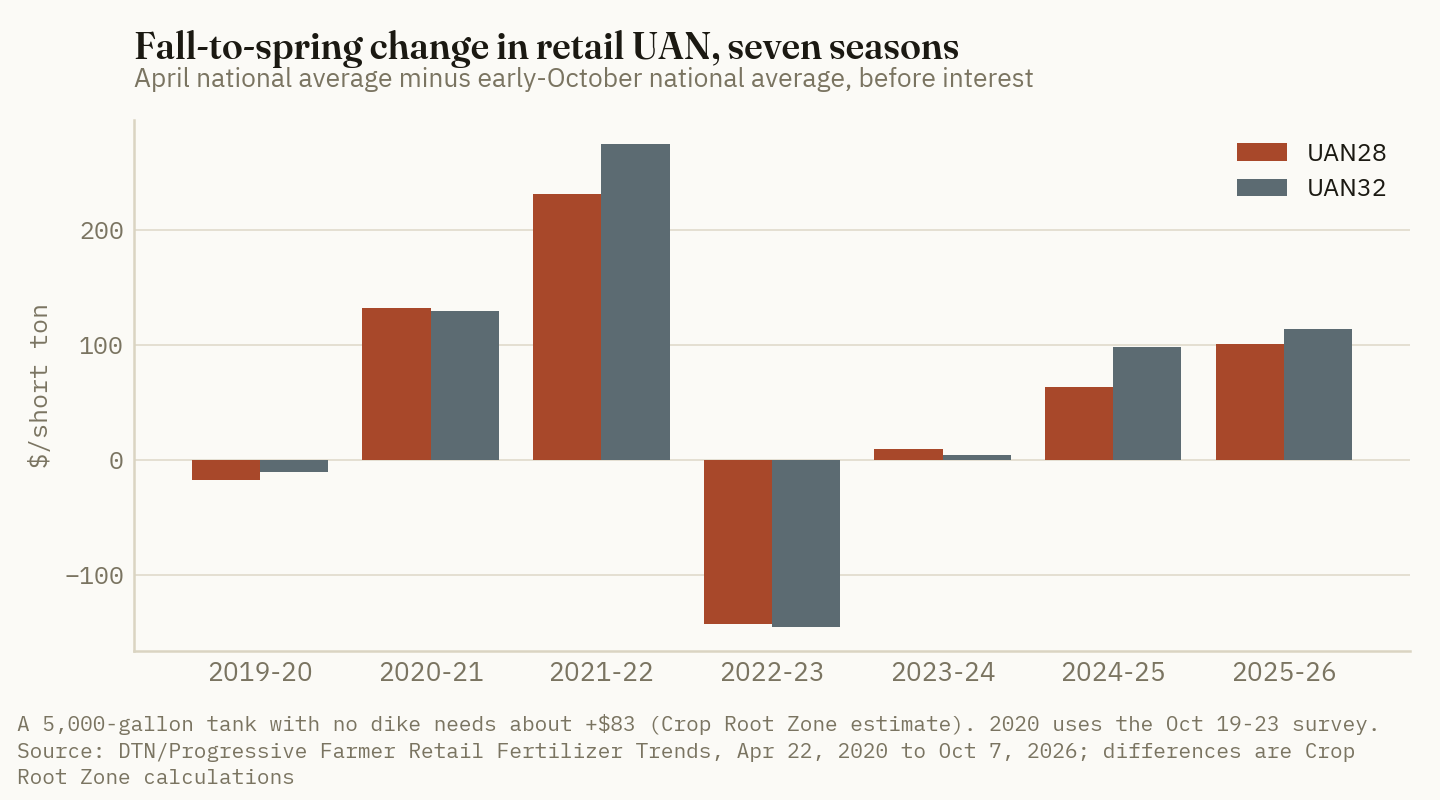
Now subtract the tank.
| System | Gap needed today, UAN28, $/st | UAN28 seasons cleared, of 7 | UAN32 seasons cleared, of 7 | Average result, UAN28, $/st/yr | Average result, $/yr |
|---|---|---|---|---|---|
| 5,000 gal, no dike | 83.47* | 3 | 4 | −26.81* | −715* |
| 15,000 gal, diked | 131.28* | 2 | 2 | −74.62* | −5,972* |
| 10,000 gal, diked | 142.96* | 1 | 1 | −86.30* | −4,604* |
Source: *Crop Root Zone calculation. Each season's change after interest, less the annual ownership cost per ton from section 3 at today's installed cost, averaged over seven seasons and multiplied by tons held. A season is cleared when the result is positive. For the 5,000-gallon tank the counts are the same at any interest rate on the product from zero to 7%.
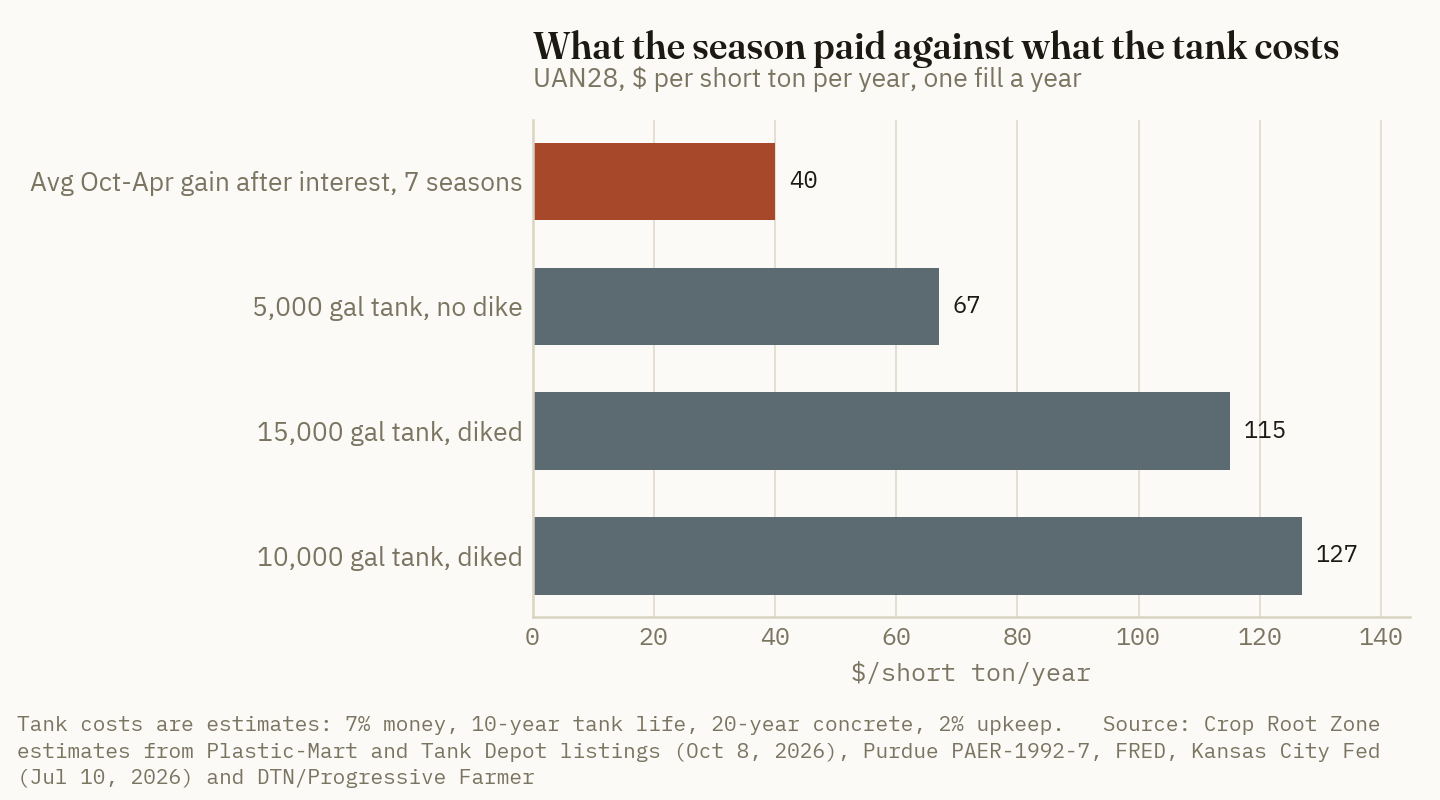
The small tank won in 2020–21, 2021–22 and 2025–26 on UAN28, and in 2024–25 as well on UAN32. It lost in the other seasons, and it lost $231 a ton in 2022–23, when a grower who filled at $565 in October watched April come in at $423 [4][6]. Averaged across all seven, the 5,000-gallon tank came up $715 a year short on UAN28 and $387 short on UAN32. The diked tanks came up $4,600 to $6,000 short.
The wins need a second look. Our October 5 piece sorted the same seasons for urea and found that the large fall-to-spring gains were a supply-driven rally in 2021, a war in 2022 and a Gulf shipping shock in March 2026 [26]. UAN28 sat at $412 in the third week of February 2026, $7 below the October price, before it reached $520 in April [1]. Take out the shock years and the ordinary seasonal rise is the $10 of 2023–24 and the $63 of 2024–25. Neither pays for a tank.
Waiting until late December to fill does not help. The seven-season average rise from the last December survey to April was $31 a ton for UAN28 and $32 for UAN32, below the October averages of $54 and $66, because most of the 2021 rally had happened by Christmas [1][2][3][4][6][7][8]. A December fill also shortens the interest clock by only about ten weeks.
And the tank is not the only way to own October's price. A retailer's prepay contract for spring delivery captures the same gap with no capital. We made that point for dry storage on August 5 [26]. It applies with more force to liquid, where the capital per ton is higher. The tank earns the seasonal gap only in the years when a prepay is not offered or is priced above the fall market.
5. What does pay: the truck, not the calendar
What's new: The shortfall on the exempt tank is small in dollars. Roughly $715 a year, or $8.60 an acre on the 83 acres it covers, has to come from somewhere other than the season. The spread between sellers on a single day is larger than the average spread between seasons.
Evidence: USDA's Illinois dealer survey for the week ending October 2 shows UAN28 asks from $400 to $550 a ton, averaging $466.67, f.o.b. (USDA AMS, Oct 2, 2026) [9]. The gap between the lowest ask and the average is $66.67. The gap between the lowest and highest is $150. The seven-season average October-to-April change was $54 [1][2][3][4][5][6][7][8].
A grower with no tank buys from whoever will deliver in 1,000- to 1,500-gallon lots during the application window. A grower with 5,000 gallons of tank can take a full transport from any seller within hauling distance, on any day. If that access is worth the Illinois low-to-average spread on one load, it is $66.67 times 26.7 tons, or about $1,780 a year. The tank costs about $1,790.
| What has to cover the 5,000-gallon tank's $1,793 a year | $/st on one 26.7-ton fill | $/yr |
|---|---|---|
| Seven-season average UAN28 gain, October to April, after interest | 40.42* | 1,078* |
| Shortfall left to cover | 26.81* | 715* |
| Illinois UAN28 low ask against average ask, Oct 2 | 66.67 | 1,779* |
| A second load through the tank at half that saving | 33.33* | 889* |
Source: USDA AMS, Illinois Production Cost Report (Bi-weekly), Oct 2, 2026, distributor asks f.o.b.; DTN/Progressive Farmer series as in section 4. *Crop Root Zone calculation. The dealer spread is an ask range across reporting distributors. It is not evidence that the lowest seller will load a farm transport, and f.o.b. prices exclude the freight a farm would pay.
There is a second, unpriced return. Product in the yard removes the delivery truck from the spring schedule. Our September 11 piece showed how quickly an applicator outruns its supply [26]. We do not put a dollar figure on a lost field day here, because no public series does. The table shows how little it has to be: $715 a year.
Ground Truth: A farm nitrogen tank does not pay as a bet on spring prices. It can pay as a truckload-receiving point. The seasonal gap covered the cost of the cheapest tank in three or four years of seven, and each of those years had a supply shock that nobody could have booked in October. The spread between dealers was $150 a ton in one state in one week. A grower who uses the tank to solicit three delivered-truckload bids, in fall and again before sidedress, needs to save $13 a ton across two loads to cover what the season leaves unpaid. A grower who builds past the containment line needs $75 to $86 a ton from the same source, every year, and the listings give no reason to expect it. Build one exempt tank, turn it twice, and decide what goes in it by the bids, not the month.
What to check before ordering one:
- The delivered truckload price against the small-lot price, from at least two sellers, today. If the difference is under $13 a ton, the tank is a convenience purchase.
- Whether the retailer's spring prepay matches its fall price. If it does, the tank adds nothing on price.
- The state line. In Iowa a second tank on the site triggers the dike. In Illinois the test is a single container and 45 days. In Minnesota it is 6,000 gallons in total.
- The grade. A tank that holds product through a winter of sub-freezing nights holds 28%, and 28% has been the more expensive nitrogen per pound.
- The tank's age. A ten-year recovery is built into the $67. A used poly tank of unknown age is not a discount.
One note on consistency. Our July 20 piece put an installed 15,000-gallon system near $520 a ton of UAN32 capacity and $57 a ton a year [26]. The figures here are $809 and $111. Three things moved: the tank's list price rose 25%, we now escalate concrete by the concrete products index as well as the CPI, and we recover a poly tank over ten years instead of twenty. The conclusion of that piece, that a once-a-year liquid tank does not pencil on the fill discount, is unchanged and is stronger at these costs.
References
- DTN/Progressive Farmer, Russ Quinn, "UAN32 Leads Fertilizer Prices Higher," Oct 7, 2026 (retail survey Sep 28–Oct 2, 2026; price table from Sep 29–Oct 3, 2025). https://www.dtnpf.com/agriculture/web/ag/crops/article/2026/10/07/uan32-leads-fertilizer-prices-higher
- DTN/Progressive Farmer, DTN Retail Fertilizer Trends, Apr 22, 2020 (price table Apr 15–19, 2019 to Apr 13–17, 2020). https://www.dtnpf.com/agriculture/web/ag/crops/article/2020/04/22/fertilizer-prices-continue-mostly-2
- DTN/Progressive Farmer, DTN Retail Fertilizer Trends, Apr 14, 2021 (price table Apr 6–10, 2020 to Apr 5–9, 2021). https://www.dtnpf.com/agriculture/web/ag/crops/article/2021/04/14/nitrogen-prices-continue-climb-price
- DTN/Progressive Farmer, DTN Retail Fertilizer Trends, Oct 12, 2022 (price table Oct 4–8, 2021 to Oct 3–7, 2022). https://www.dtnpf.com/agriculture/web/ag/crops/article/2022/10/12/average-price-10-34-0-starter-6-2022
- DTN/Progressive Farmer, DTN Retail Fertilizer Trends, Jun 1, 2022 (price table including Apr 25–29, 2022). https://www.dtnpf.com/agriculture/web/ag/crops/article/2022/06/01/stagnant-retail-fertilizer-prices-2
- DTN/Progressive Farmer, DTN Retail Fertilizer Trends, Apr 26, 2023 (price table Apr 18–22, 2022 to Apr 17–21, 2023). https://www.dtnpf.com/agriculture/web/ag/crops/article/2023/04/26/anhydrous-drops-1-000-per-ton-first
- DTN/Progressive Farmer, DTN Retail Fertilizer Trends, Apr 24, 2024 (price table Apr 17–21, 2023 to Apr 15–19, 2024). https://www.dtnpf.com/agriculture/web/ag/crops/article/2024/04/24/major-fertilizer-prices-continue
- DTN/Progressive Farmer, "UAN32 Retail Price Up 9%, UAN28 Price Up 7% From Last Month," Apr 23, 2025 (price table Apr 15–19, 2024 to Apr 14–18, 2025). https://www.dtnpf.com/agriculture/web/ag/crops/article/2025/04/23/uan32-retail-price-9-uan28-price-7
- USDA AMS, Illinois Production Cost Report (Bi-weekly), week ending Oct 2, 2026. https://www.ams.usda.gov/mnreports/ams_3195.pdf
- CF Industries, "Urea Ammonium Nitrate Solution (UAN): UAN 28, 30 and 32% Total Nitrogen," product specification, revision date May 2022 (density and salt-out temperature). https://www.cfindustries.com/globalassets/cf-industries/media/documents/product-specification-sheets---may-2022/urea-ammonium-nitrate-solution.pdf
- Plastic-Mart, Norwesco 5,000 Gallon Vertical Storage Tank 1.5 S.G. (part 40346), listed price, accessed Oct 8, 2026. https://www.plastic-mart.com/norwesco-5000-gallon-liquid-storage-tank-n-40346
- Tank Depot, Norwesco 10,000 Gallon Vertical Liquid Storage Tank in White (part 43128), listed price, accessed Oct 8, 2026. https://www.tank-depot.com/norwesco-141-inch-wide-10000-gallon-plastic-vertical-liquid-storage-tank-in-white-n-43128
- Plastic-Mart, Liquid Fertilizer Tanks (Norwesco 15,000 and 20,000 gallon), listed prices, accessed Oct 8, 2026. https://www.plastic-mart.com/chemical-storage-tanks/liquid-fertilizer-tanks/
- Tank Depot, Snyder Industries 5,000 Gallon Vertical Double Wall Liquid Chemical Storage Tank (part 5630000N43), listed price, accessed Oct 8, 2026. https://www.tank-depot.com/snyder-industries-102-inch-wide-5000-gallon-plastic-vertical-double-wall-liquid-chemical-storage-tank-in-white-sii-5630000n43
- Rogers, D. and Akridge, J.T., "Bringing On-Farm Fluid Fertilizer Storage into Compliance: What Will It Cost?", Purdue Agricultural Economics Report PAER-1992-7, Jun 16, 1992. https://ag.purdue.edu/commercialag/home/paer-article/bringing-on-farm-fluid-fertilizer-storage-into-compliance-what-will-it-cost-2
- Federal Reserve Bank of St. Louis (FRED), Consumer Price Index for All Urban Consumers, series CPIAUCSL, June 1992 (140.1) and August 2026 (334.131), accessed Oct 8, 2026. https://fred.stlouisfed.org/data/CPIAUCSL.txt
- Federal Reserve Bank of St. Louis (FRED), Producer Price Index by Commodity: Concrete Products, series WPU133, June 1992 (117.0) and August 2026 (409.479), accessed Oct 8, 2026. https://fred.stlouisfed.org/data/WPU133.txt
- Federal Reserve Bank of Kansas City, F. Scott, "New Farm Loan Originations Ease Slightly," Jul 10, 2026 (second quarter 2026). https://www.kansascityfed.org/center-for-agriculture-and-the-economy/agricultural-finance/new-farm-loan-originations-ease-slightly/
- Iowa Department of Agriculture and Land Stewardship, Commercial Feed and Fertilizer Bureau, "On Farm Fertilizer Storage," Feb 2020. https://iowaagriculture.gov/sites/default/files/feeds/Commercial%20Fertilizer/On%20Farm%20Fertilizer%20Storage.pdf
- Illinois Administrative Code, title 8, part 255 (Agrichemical Containment), section 255.10 (definitions) and section 255.180 (on-farm storage facility containment), accessed Oct 8, 2026. https://www.law.cornell.edu/regulations/illinois/IL-Admin-Code-8-255-180
- Minnesota Department of Agriculture, "On-Farm Storage of Liquid Bulk Fertilizer," accessed Oct 8, 2026. https://www.mda.state.mn.us/farm-storage-liquid-bulk-fertilizer
- Wisconsin Administrative Code ATCP 33.01(32) (definition of storage facility), accessed Oct 8, 2026, and Wisconsin DATCP, "Fertilizer and Containment Program Information," rev. Feb 2024. https://datcp.wi.gov/Documents2/FertilizerandContainmentProgramInfo.pdf
- North Dakota State University Extension, "NDSU Offers Advice on Using Poly Tanks for Agricultural Storage," Oct 9, 2008. https://www.ag.ndsu.edu/news/newsreleases/2008/oct-9-2008/ndsu-offers-advice-on-using-poly-tanks-for-agricultural-storage
- Kijiji classified listing, "New Liquid Fertilizer Fiberglass Storage Tanks," CanAm Surplus, Killarney, Manitoba, prices in Canadian dollars, accessed Oct 8, 2026. https://www.kijiji.ca/v-storage-containers/brandon/new-liquid-fertilizer-fiberglass-storage-tanks/1635836922
- Farm and Dairy, "On-farm fertilizer storage now regulated," Mar 3, 2005. https://www.farmanddairy.com/?p=1483
- Crop Root Zone, "Prepay Is a Short Put: What On-Farm Storage Is Actually Worth in a Split Nutrient Market," Jul 20, 2026 (15,000-gallon tank price and installed cost); "Urea Fell $148 a Ton Since May. DAP Rose a Dollar. Only One of Those Pays for a Building," Aug 5, 2026 (prepay against owned storage); "A 55-Foot Bar at 5 MPH Empties a 1,450-Gallon Nurse Tank in 57 Minutes. The Toolbar Was Never the Constraint," Sep 11, 2026; "UAN32 and Urea Cost $0.714 and $0.715 a Pound of Nitrogen," Sep 21, 2026 (UAN28 premium per pound of nitrogen); "A $675 Urea Prepay Costs $25.50 a Ton in Interest by April," Oct 5, 2026 (197-day carry, sorting of seasons by shock).
Disclosures
Crop Root Zone is an independent publication. Nothing here is investment advice. Market calls, where included, reflect the editors' own read and are not a recommendation to buy or sell any security.
Iowa's 90,000-Pound Harvest Window Closes October 10 With 7% of Its Corn Cut. Nebraska Allows 25% Over Until Late December, and 10,000 Extra Pounds Is Worth 2 to 7 Cents a Bushel.
Five Corn Belt governors have temporary harvest weight relief in force, from 88,000 to 100,000 pounds, expiring between October 10 and December 28. We tabulate each rule and its road limits, price the extra payload at $6.29 diesel, and set it against Iowa's fine schedule and pavement wear.
Iowa's harvest proclamation lets corn and soybean trucks run at 90,000 pounds without a permit, and it expires on Saturday, Oct 10 (Office of the Governor of Iowa, Sep 10, 2026) [1]. On Oct 4 the state had 7% of its corn and 5% of its soybeans harvested, against five-year averages of 20% and 38% (USDA NASS, Oct 5, 2026) [18]. Iowa DOT's proclamation page still showed Oct 10 as the end date when we read it on Oct 6, and the governor's newsroom carried no extension [2] [3]. Meanwhile four neighbors have signed emergency orders since Sep 24, which USDA describes as measures against diesel costs [21]. Nebraska's allows 25% over legal weight for 90 days (Office of the Governor of Nebraska, Sep 24, 2026) [4]. Midwest on-highway diesel was $6.286 a gallon in the week of Oct 5, down 24.0 cents on the week and $2.616 above a year earlier (EIA, Oct 6, 2026) [19] [20]. Our Sep 23 feature priced Iowa's window alone, at about 8 cents a bushel on a 100-mile haul (Crop Root Zone, TRZ-0224, Sep 23, 2026) [24]. This piece covers the other states, the short hauls where most bushels move, the loads saved, and the cost of getting it wrong. It is not legal advice; confirm the rule and the route with your state DOT and county engineer before loading to it.
1. What is in force on October 6
What's new: Five temporary orders overlap for the first time this fall. Iowa's is the routine annual proclamation. Nebraska, South Dakota, Missouri and Minnesota issued theirs between Sep 24 and Oct 1 as fuel-cost relief (USDA AMS, Oct 1, 2026) [21]. Four more states in our coverage area have standing harvest allowances that need no governor.
Evidence: The federal 80,000-pound gross limit governs the Interstates. Every rule below stops at the Interstate ramp, with one Wisconsin exception, and every one leaves posted road and bridge limits in force.
| State | Authority and window | Gross on an 80,000-lb five-axle* | Permit and fee | Haul covered | Roads |
|---|---|---|---|---|---|
| Iowa | Governor's proclamation, Sep 10 – Oct 10 | 90,000 | None | Corn, soybeans, hay, straw, silage, stover, fertilizer, manure, distillers grains; any leg | All highways except Interstates |
| Nebraska | Executive Order 26-20, Sep 24, 90 days (to about Dec 23*) | 100,000 | None | Grain, seasonally harvested products, livestock; field to storage or market, and farm storage to market | All highways and local roads except Interstates |
| South Dakota | Executive Order 2026-11, Sep 28 – Dec 28 | 88,000 | Order is the permit; fee suspended | Agricultural products, commodities, livestock; all movement | State trunk highways except Interstates |
| Missouri | Executive Order 26-19, Sep 30 – Oct 30 | 90,000 | None reported | Livestock, grain, timber, seasonally harvested products; field to storage or market, and farm storage to market | State highways and local roads; not Interstates |
| Minnesota | Emergency Executive Order 26-11, Oct 1 – Oct 31 | 88,000 | MnDOT temporary emergency harvest permit; fee not stated in the order | Corn, soybeans, wheat, potatoes, sugar beets, carrots, forest products; field to first unloading only | State and local highways; not Interstates |
| Illinois | Annual harvest permit, Sep 1 – Dec 31 (2025 terms; see text) | 88,000 | Free permit plus a route authorization renewed every 14 days | Agricultural commodities | State routes only; local roads need local approval |
| Wisconsin | Wis. Stat. 348.17(5), Aug 1 – Dec 31 | 92,000 | None | Corn, soybeans, potatoes, vegetables, cranberries; field to farm storage, first off-farm storage or first processing | Not Interstates, except the I-39 and I-41 corridors |
| North Dakota | 10% harvest permit, Jul 15 – Nov 30 | 88,000 | $50 per 30 days | Field to storage or first sale | State highways only; not Interstate, county, township or city roads |
| Indiana | IC 9-20-4-2, year-round | 88,000 | None | Farm commodities, place of production to first point of delivery | Not Interstates |
Sources: Office of the Governor of Iowa, Sep 10, 2026; Nebraska Executive Order 26-20, Sep 24, 2026; South Dakota Register, Oct 5, 2026; Missouri Farm Bureau, Sep 30, 2026; Minnesota Emergency Executive Order 26-11, Oct 1, 2026; FarmWeek, Sep 1, 2025; Wis. Stat. 348.17; North Dakota Highway Patrol, read Oct 6, 2026; Indiana State Police, undated. Basis: gross vehicle weight, pounds. *Crop Root Zone arithmetic: the stated percentage applied to 80,000 lb, and 90 days counted from Sep 24. Axle limits can hold the usable gross below these figures.
The details differ. Iowa's axles may run 12.5% over but no axle above 20,000 pounds [1]. Nebraska's order allows 25% over both gross and axle-group limits, caps any single axle at 20,000 pounds, and requires compliance with all posted limits [4]. It sits on top of a standing statute that already allows 15% over for up to 70 miles with a signed statement of origin and destination (Neb. Rev. Stat. 60-6,301) [5]. South Dakota's order widens a standing 10% allowance that covered only one trip from field to first unloading [9]. Missouri's raises a harvest ceiling reported as 88,000 pounds to 90,000, "subject to route and bridge restrictions"; we read the Missouri Farm Bureau's summary, not the order (Missouri Farm Bureau, Sep 30, 2026) [10]. Missouri's standing legal weight for grain off the Interstates is 85,500 pounds (MoDOT, undated) [11]. Minnesota's order requires the truck to be licensed for the weight it carries [6]. Wisconsin's 15% needs a truck registered for at least 50,000 pounds (Wis. Stat. 348.17) [15]. North Dakota's permit allows up to 105,500 pounds on highways rated for it and 88,000 on 80,000-pound highways (North Dakota Highway Patrol, read Oct 6, 2026) [14].
Three entries need a flag. Illinois: the terms shown are from a Sep 1, 2025 FarmWeek report, and the Illinois Farm Bureau's permit page describes the same program today [12] [13]. We could not open the statute or a 2026-dated IDOT notice, so treat the row as last year's terms pending confirmation. Indiana: the 10% applies to gross weight and not where a bridge is posted (Indiana State Police, undated) [16]. We found no 2026 Indiana weight order; its recent action covers dyed diesel through Nov 4 (American Farm Bureau Federation, Oct 1, 2026) [22]. Kansas: we could not open the Kansas DOT document. A search excerpt of it describes an annual permit to 90,000 pounds for trucks with six or more axles above an 85,500-pound threshold [26]. We did not confirm that and found no Kansas harvest order.
The windows do not match the harvest.
| State | Corn harvested, Oct 4 | 5-yr avg | Soybeans harvested, Oct 4 | 5-yr avg | Temporary relief ends |
|---|---|---|---|---|---|
| Iowa | 7% | 20% | 5% | 38% | Oct 10 |
| Missouri | 50% | 49% | 21% | 17% | Oct 30 |
| Minnesota | 12% | 16% | 25% | 51% | Oct 31 |
| Nebraska | 15% | 24% | 9% | 34% | About Dec 23* |
| South Dakota | 11% | 16% | 17% | 34% | Dec 28 |
| Illinois | 36% | 30% | 31% | 29% | Dec 31 (permit) |
Sources: USDA NASS Crop Progress, week ending Oct 4, 2026, released Oct 5, 2026; state orders as above. *Crop Root Zone count of 90 days from Sep 24.
Iowa extended last year's proclamation into November and again into December, as we reported on Sep 23 [24]. That is last year's record, not this year's rule.
Ground Truth: The orders differ most in which trip they cover, and that changes the storage decision by state. Minnesota's 88,000 pounds applies from the field to the first unloading and nowhere else, so corn binned this month comes back out at 80,000. Nebraska, Missouri and South Dakota cover farm storage to market, and Nebraska's and South Dakota's orders outlast the harvest. A Nebraska farm can bin now and haul heavy in December. A Minnesota farm that wants the extra payload has to send the bushels straight to their destination this month. On a route that crosses a state line, load to the lower limit: 88,000 into Minnesota, South Dakota or Illinois, 90,000 into Iowa or Missouri.
2. What the extra pounds carry
What's new: Nothing here is new data. It is arithmetic on a stated tare. We use the 25,000-pound empty weight in USDA's truck advisory, the same basis as our Sep 23 piece [24]. Every pound of added gross weight is then a pound of grain. Our Oct 5 feature used a 950-bushel load, a slightly heavier truck (Crop Root Zone, TRZ-0256, Oct 5, 2026) [25].
Evidence:
| Gross weight (lb) | Where it applies | Corn, bu/load* | Soybeans, bu/load* | |
|---|---|---|---|---|
| 80,000 | Federal limit; Interstates everywhere | 982 | 917 | ███████░░░ |
| 85,500 | Missouri grain, standing rule | 1,080 | 1,008 | ████████░░ |
| 88,000 | 10% states: MN, SD, IL, IN, ND | 1,125 | 1,050 | ████████░░ |
| 90,000 | Iowa, Missouri orders | 1,161 | 1,083 | █████████░ |
| 92,000 | 15%: Wisconsin; Nebraska's standing statute | 1,196 | 1,117 | █████████░ |
| 100,000 | Nebraska order, ceiling | 1,339 | 1,250 | ██████████ |
Sources: state orders and statutes as in section 1. *Crop Root Zone calculation: gross weight less a 25,000-lb tare, divided by 56 lb/bu for corn and 60 lb/bu for soybeans. Bars scale the corn load.
Axle limits cut into the top rows. Twelve and a half percent over a 34,000-pound tandem is 38,250 pounds. Two tandems and a 12,000-pound steer axle make 88,500, not 90,000, which is 1,134 bushels of corn. The same sum at Nebraska's 25% gives 97,000 pounds and 1,286 bushels (Crop Root Zone calculation; the steer-axle weight is our assumption). No order waives a tire's load rating, a trailer's rated capacity or its cubic volume.
| Gross weight (lb) | Corn loads per 1,000 acres* | Fewer loads* | Soybean loads per 1,000 acres* | Fewer loads* |
|---|---|---|---|---|
| 80,000 | 204 | n/a | 65 | n/a |
| 88,000 | 178 | 26 | 57 | 8 |
| 90,000 | 172 | 31 | 55 | 10 |
| 92,000 | 167 | 36 | 54 | 12 |
| 100,000 | 149 | 54 | 48 | 17 |
*Crop Root Zone calculation at illustrative yields of 200 bu/acre corn and 60 bu/acre soybeans, 25,000-lb tare. Fewer-loads figures are computed before rounding.
31 fewer loads
Per 1,000 acres of 200-bushel corn at 90,000 pounds instead of 80,000: 172 trips, not 204. (Crop Root Zone calculation from Office of the Governor of Iowa, Sep 10, 2026)
Ground Truth: The loads matter more than the cents. On a 25-mile haul with a half-hour stop, the assumptions we used on Oct 5, each avoided load returns about an hour and a half of truck time [25]. Thirty-one loads is about 47 truck-hours per 1,000 acres of corn (Crop Root Zone estimate). That piece found an idle combine costs more than the haul itself. In a state at 7% harvested with a compressed season ahead, the weight allowance is closer to a fraction of an extra truck than to a fuel discount, and it is available without hiring a driver.
3. What it is worth per bushel
What's new: We reprice the hired-truck cost from Oct 5 to this week's diesel and spread it over the larger loads. That piece split USDA's North Central truck rate into a stop charge of about $86 a load and a marginal one-way mile of 0.43 to 0.45 cents a bushel at $6.53 diesel [25]. Diesel is 24 cents lower now [19]. On the same fuel-economy range, 5.0 to 7.6 miles per gallon, the mile comes to about $4.10 a load (Crop Root Zone calculation).
Evidence: A heavier truck burns more fuel loaded. We assume the loaded leg's fuel rises in proportion to gross weight and the empty return is unchanged. That overstates the penalty, so the savings below are conservative. We hold the stop charge fixed.
| Gross weight (lb) | 10 miles | 25 miles | 50 miles | 100 miles | $ per 1,000 acres of corn, 25 miles* |
|---|---|---|---|---|---|
| 80,000, cost in ¢/bu* | 12.9 | 19.2 | 29.6 | 50.5 | n/a |
| 88,000, saving in ¢/bu* | 1.6 | 2.2 | 3.3 | 5.5 | 4,400 |
| 90,000, saving in ¢/bu* | 1.9 | 2.7 | 4.0 | 6.7 | 5,300 |
| 92,000, saving in ¢/bu* | 2.2 | 3.1 | 4.7 | 7.7 | 6,200 |
| 100,000, saving in ¢/bu* | 3.3 | 4.6 | 6.9 | 11.5 | 9,300 |
Sources: Crop Root Zone, TRZ-0256, Oct 5, 2026, for the stop charge and marginal mile derived from USDA AMS's second-quarter truck advisory; EIA, Oct 6, 2026. Basis: hired truck, corn, one-way distance, empty return. *Crop Root Zone estimates: $86 a load plus $4.10 a one-way mile at 80,000 lb, with loaded-leg fuel of about $1.04 a mile scaled by gross weight; 25,000-lb tare; 200 bu/acre. Soybean savings per bushel are about 7% larger.
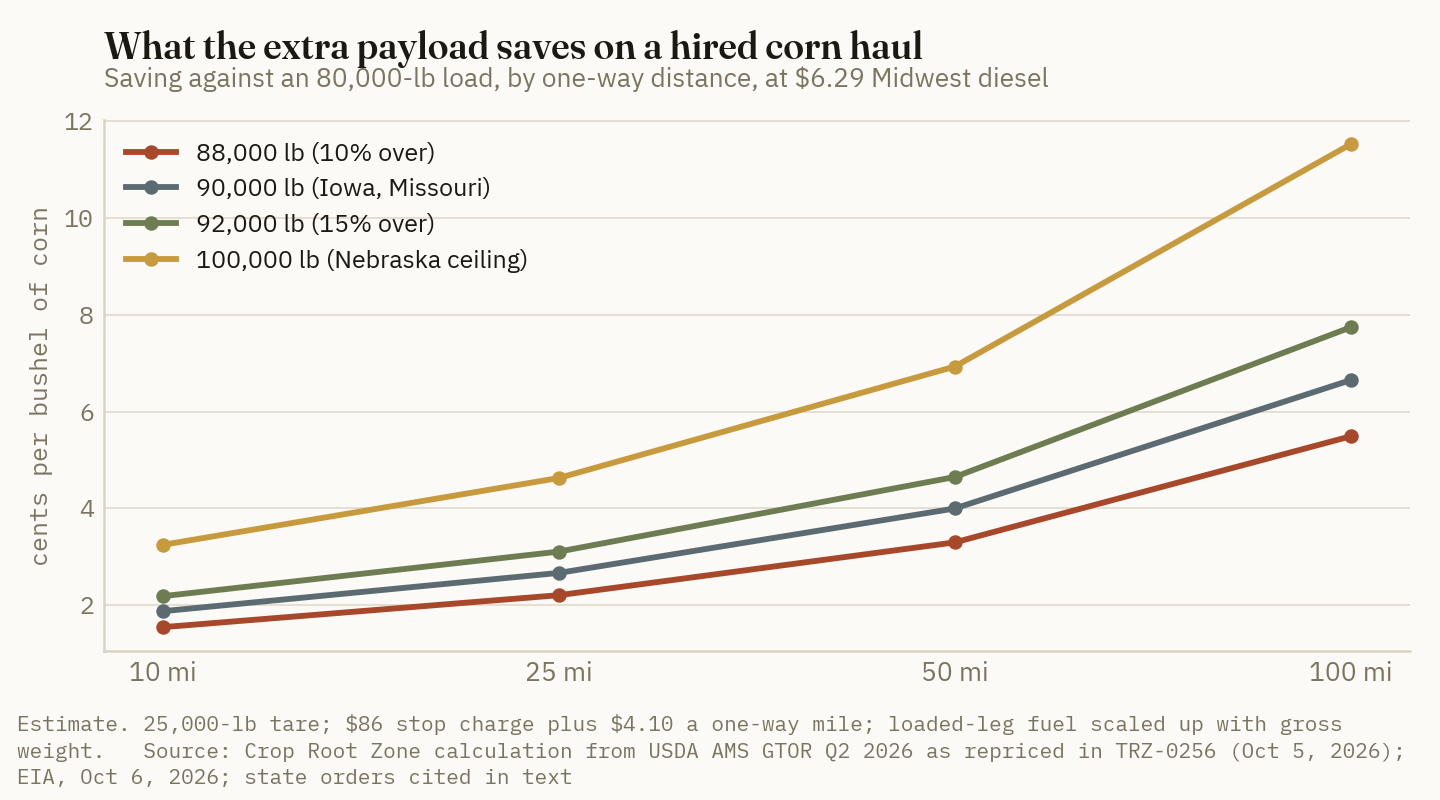
At 100 miles, 90,000 pounds saves 6.7 cents, or 7.8 with no fuel penalty. Our Sep 23 figure was 8.2 to 8.4 cents [24]. The difference is three things: diesel is 39 cents cheaper than the $6.68 used then, we use the North Central rate in place of the national one, and we charge the heavier load for its fuel. The two estimates agree within their assumptions.
Who keeps the saving depends on how the truck is paid. An owner-operator farm keeps all of it. A hauler paid by the load or the loaded mile passes it through. A hauler paid by the bushel keeps it, and collects more per trip, unless the rate is renegotiated. Iowa's custom-rate survey quotes grain hauling by the bushel [25].
Ground Truth: Most of the money is in the short hauls nobody thinks about. A 25-mile run to the elevator saves under 3 cents a bushel, which looks trivial next to basis. But that haul is most of the crop, and it adds up to about $5.30 an acre of corn at 90,000 pounds. If your hauler bills by the bushel, the order has raised his revenue per trip by 18% at your state's expense in pavement. Ask for a per-bushel rate that reflects it, or a per-load rate, before the next ticket is written.
4. What it costs: fines, bridges, wear and axles
What's new: The exemptions suspend the permit requirement on certain roads. They do not suspend the fine schedule anywhere else. Iowa prints its schedule in the weight statute, and gross-weight fines run at half the axle rate (Iowa Code 321.463, 2026) [17].
Evidence:
| Iowa, axle or axle-group overload (lb) | Scheduled fine ($) | Gross-weight fine at half rate ($)* |
|---|---|---|
| Up to 1,000 | 12 | 6 |
| 1,001 – 2,000 | 22 | 11 |
| 2,001 – 3,000 | 155 | 78 |
| 3,001 – 4,000 | 240 | 120 |
| 4,001 – 5,000 | 375 | 188 |
| 5,001 – 6,000 | 585 | 293 |
| 7,001 – 8,000 | 950 | 475 |
| 9,001 – 10,000 | 1,150 | 575 |
Source: Iowa Code 321.463(11), 2026 edition. Selected rows; the schedule continues to $2,200 at 20,000 lb. *Crop Root Zone arithmetic, half of the axle rate, rounded to the dollar. Court costs and surcharges are not included.
A truck loaded to Iowa's allowance that takes an Interstate ramp is 10,000 pounds over gross and 4,250 over on each tandem. Axle and gross overloads are separate violations under the statute [17]. That is $575 plus two fines of $375, or about $1,325 on the schedule (Crop Root Zone calculation). The 90,000-pound load saves about $31 on a 25-mile haul, so one citation cancels the saving on roughly 43 loads, a quarter of a 1,000-acre corn crop.
Minnesota's civil penalty for 8,000 pounds over is $610 plus 20 cents a pound above 7,000, or $810 (Minn. Stat. 169.871) [8]. That is 33 loads of savings at 88,000 pounds and 25 miles. A first-haul violation is capped at $150 if the truck has fewer than two violations in the prior 12 months [8].
Posted bridges are the same exposure on a road the order does cover. Every order in section 1 keeps posted limits binding, and a posted county bridge can sit between the field and the blacktop.
Pavement is the cost nobody is billed for. FHWA's synthesis of the road-test research puts pavement wear at roughly the fourth power of axle load, and rates a 34,000-pound tandem at about 1.1 standard axle loads on flexible pavement [23]. It also reports later studies that put the exponent nearer two or three. On the fourth-power rule a tandem 12.5% over does about 60% more wear per pass while carrying 18% more grain, so wear per bushel rises about 36%. At Nebraska's 25% it is about 79% more per bushel (Crop Root Zone calculation).
More axles reverse that. The same FHWA paper cites research finding less wear per ton of payload on a six-axle combination with a rear tridem than on a standard five-axle [23]. Minnesota sells that as a standing permit: $300 a year for 90,000 pounds on six axles and $500 for 97,000 on seven, not valid on Interstates and subject to posted bridges (Minn. Stat. 169.865) [7]. Unlike the October order, it covers hauls out of storage.
We could not find a public survey that prices a third trailer axle, so we do not quote a price. The break-even can be stated without one. If the axle adds 2,000 pounds of tare, our assumption, a six-axle truck at 90,000 pounds carries the same 1,125 bushels as a five-axle at 88,000. At 2.2 cents a bushel on 25-mile hauls, the $300 permit pays back in about 13,600 bushels, or 12 loads. Each $1,000 a year of ownership cost for the axle needs about 45,000 bushels at 25 miles or 30,000 at 50 miles (Crop Root Zone estimates).
Ground Truth: Plan the route before the load. The saving is $25 to $60 a trip and the downside is $800 to $1,300 a stop, so the exemption only pays for a driver who knows which miles are Interstate and which bridges are posted. Expect more postings. An 18% payload gain bought with 36% more pavement wear per bushel lands on county budgets, and county engineers respond with embargoes, which no governor's order overrides. Farms that haul heavy every fall, out of storage as well as out of the field, are buying the wrong thing with a 30-day order. The durable version is another axle and a standing permit.
5. What to watch, and what this does not cover
What's new: Three dates decide most of the value.
Evidence: Oct 10 is Iowa's expiry. A gap of even a week costs about 2.7 cents a bushel on 25-mile hauls and 6.7 at 100 for grain moved in it (Crop Root Zone estimate). Oct 30 and Oct 31 end the Missouri and Minnesota orders, with Minnesota's soybeans at 25% harvested against a 51% average [18]. Iowa's Oct 6 proclamation on dyed diesel runs to Feb 2, 2027 and does not mention weight [3]. EIA's next diesel price is due Oct 13; each 50 cents a gallon moves the 100-mile saving at 90,000 pounds by about 0.2 cents a bushel (Crop Root Zone estimate). Texas and Georgia have also eased weight limits, outside the area we tabulated [21] [22].
Limits. We read the order text for Iowa, Nebraska and Minnesota, the official register summary for South Dakota, and a farm-organization summary for Missouri. Illinois terms are last year's. Kansas is unconfirmed, and we did not review county or township rules anywhere. Tare, steer-axle weight, the added axle's weight, yields and the fuel penalty are our assumptions. The cost per load carries forward a second-quarter survey repriced for fuel. Fines shown are statutory schedules for two states, before court costs; other states differ. The scale ticket at the elevator records the weight either way.
References
- Office of the Governor of Iowa, "September-October 2026 Harvest Proclamation," Sep 10, 2026 — https://governor.iowa.gov/news/2026-09-10/september-october-2026-harvest-proclamation
- Iowa Department of Transportation, "Transportation-Related Emergency Proclamations," read Oct 6, 2026 — https://iowadot.gov/motor-carriers/proclamations
- Office of the Governor of Iowa, "Gov. Reynolds signs proclamation suspending penalties for on-road dyed diesel use," Oct 6, 2026, and newsroom listing read the same day — https://governor.iowa.gov/press-release/2026-10-06/gov-reynolds-signs-proclamation-suspending-penalties-road-dyed-diesel-use
- State of Nebraska, Office of the Governor, Executive Order No. 26-20, "Emergency Relief for Transportation of Seasonally Harvested Products," Sep 24, 2026 — https://govdocs.nebraska.gov/docs/pilot/pubs/eofiles/26-20.pdf
- Nebraska Revised Statutes 60-6,301, read Oct 6, 2026 — https://nebraskalegislature.gov/laws/statutes.php?statute=60-6,301
- State of Minnesota, Emergency Executive Order 26-11, "Providing for Emergency Relief from Regulations to Motor Carriers and Drivers Operating in Minnesota," Oct 1, 2026 — https://content.govdelivery.com/attachments/MNGOV/2026/10/01/file_attachments/3801787/EO%2026-11%20Weight%20Restrictions.pdf
- Minnesota Statutes 169.865, "Special farm products permits," read Oct 6, 2026 — https://www.revisor.mn.gov/statutes/cite/169.865
- Minnesota Statutes 169.871, "Civil penalty," read Oct 6, 2026 — https://www.revisor.mn.gov/statutes/cite/169.871
- South Dakota Legislative Research Council, South Dakota Register, Vol. 53, Oct 5, 2026, summary of Executive Order 2026-11 dated Sep 28, 2026 — https://mylrc.sdlegislature.gov/api/Documents/Register/308247.pdf?Year=2026
- Missouri Farm Bureau, "Temporary relief expands red-dyed diesel, weight exemptions," Sep 30, 2026, summarizing Executive Order 26-19; the order text was not available to us — https://mofb.org/temporary-relief-expands-red-dyed-diesel-weight-exemptions/
- Missouri Department of Transportation, "Oversize Overweight Legal & Permit Maximums," undated, read Oct 6, 2026 — https://www.modot.org/sites/default/files/documents/LegalSizeAndWeight_3.pdf
- FarmWeek, "Illinois harvest permits now available," Sep 1, 2025 — https://www.farmweeknow.com/policy/state/illinois-harvest-permits-now-available/article_b4225a68-1be0-444d-a117-ad264a6283e4.html
- Illinois Farm Bureau, "Illinois Harvest Permit," read Oct 6, 2026 — https://www.ilfb.org/trusted-information/member-information/transportation/illinois-harvest-permit/
- North Dakota Highway Patrol, "10% Harvest Permit," read Oct 6, 2026 — https://www.statepatrol.nd.gov/10-harvest-permit
- Wisconsin Statutes 348.17(5), read Oct 6, 2026 — https://docs.legis.wisconsin.gov/statutes/statutes/348/iii/17
- Indiana State Police, "Summary of Indiana Size and Weight Laws under Title 9 Article 20," undated, read Oct 6, 2026 — https://secure.in.gov/isp/files/size_weight_laws.pdf
- Iowa Code 2026, Section 321.463, "Maximum gross weight — exceptions — penalties" — https://www.legis.iowa.gov/docs/code/321.463.pdf
- USDA National Agricultural Statistics Service, "Crop Progress," week ending Oct 4, 2026, released Oct 5, 2026 — https://release.nass.usda.gov/reports/prog4026.txt
- U.S. Energy Information Administration, Gasoline and Diesel Fuel Update, week of Oct 5, 2026, released Oct 6, 2026 — https://www.eia.gov/petroleum/gasdiesel/
- U.S. Energy Information Administration, Midwest (PADD 2) No. 2 Diesel Retail Prices, weekly series, released Oct 6, 2026 — https://www.eia.gov/dnav/pet/hist/LeafHandler.ashx?n=PET&s=EMD_EPD2D_PTE_R20_DPG&f=W
- USDA Agricultural Marketing Service, Grain Transportation Report, Oct 1, 2026 — https://ams-prod.azureedge.us/sites/default/files/media/GTR10012026.pdf
- American Farm Bureau Federation, letter to the President on diesel costs, Oct 1, 2026 — https://www.fb.org/files/Diesel-Letter_WH_10.1.26.pdf
- Federal Highway Administration, Comprehensive Truck Size and Weight Study, Phase 1 Synthesis, Working Paper 3, "Pavements and TS&W Regulations," undated in the copy read — https://www.fhwa.dot.gov/reports/tswstudy/TSWwp3.pdf
- Crop Root Zone, TRZ-0224, "Diesel Added 48 to 73 Cents to Every Loaded Mile of a Grain Haul in a Year. USDA's 100-Mile Truck Rate Added 4, and Midwest Diesel Is Another $1.34 Higher Since," Sep 23, 2026
- Crop Root Zone, TRZ-0256, "An Extra Mile to a Better Bid Costs 0.4 to 0.5 Cents a Bushel at $6.53 Diesel. An Extra Hour in the Dump Line Costs 3 to 12 Cents, and Iowa's $1 Soybean Premium Had a Delivery Date of October 2," Oct 5, 2026
- Kansas Department of Transportation, truck weight summary document; the server refused our request, and we read only a search-engine excerpt on Oct 6, 2026 — https://ksdot.gov/home/showpublisheddocument/10402/638741737995670000
Disclosures
Crop Root Zone is an independent publication. Nothing here is investment advice. Market calls, where included, reflect the editors' own read and are not a recommendation to buy or sell any security.
A Pound of Nitrogen Costs $1.90 in Truckload Feather Meal, $5.88 in Bagged Feather Meal and 60 Cents in Anhydrous. Organic Corn at $11.23 Pays for the First and Not the Second.
On first-year-available nitrogen, allowed organic sources run from $1.50 a pound for a legume credit and $2.54 for feed-grade feather meal to $7.84–$23.82 for bagged meals and pellets, against 60 cents for anhydrous. The same feather meal costs 3.1 times as much in a 50-pound bag as on a truck, and 100 pounds of available nitrogen from any bagged product costs more than the $725-an-acre gross advantage organic corn holds over conventional.
Feed-grade feather meal was offered at $475 to $500 a ton FOB Minnesota plants in the week of October 5–9, an average of $487.50, up 23% from $397.50 a year earlier (USDA AMS, Oct 9, 2026) [2]. At 80% protein that is about 12.8% nitrogen, or $1.90 per pound of nitrogen by our calculation. The same material in a 50-pound bag labelled 13-0-0 lists at $38.20 from an organic farm supplier, which is $1,528 a ton and $5.88 per pound of nitrogen (Seven Springs Farm Supply, accessed Oct 12, 2026) [4]. Anhydrous ammonia averaged $979 a ton and 60 cents per pound of nitrogen in DTN's latest retail survey, and urea $683 and 74 cents (DTN/Progressive Farmer, Oct 7, 2026) [1]. New-crop organic feed corn was contracted forward at an average of $11.23 a bushel FOB the farm in USDA's latest organic grain report (USDA AMS, Sep 30, 2026) [3]. This piece prices each nitrogen source the National Organic Program allows on the same two bases, total and first-year-available, and asks which of them that corn price can carry.
One caution before the numbers. We set out to price every source delivered to the farm. We could not. Outside one extension budget, no public source we opened quotes field-scale organic nitrogen delivered. What follows is a bulk commodity quote FOB the plant, bagged list prices before freight, one tote price, and one budget assumption, and each is labelled as such.
1. What a pound of nitrogen costs, source by source
What's new: The inputs and the crop both moved up in a year. Feather meal asks rose $90 to $157.50 a ton across USDA's four reporting regions. Ruminant blood meal traded at $1,670 a ton FOB in the central U.S., against $1,050 a year earlier [2]. On the other side of the ledger, new-crop organic feed corn delivered to feed mills averaged $12.93 a bushel on the spot market, $4.76 above a year ago [3].
Evidence: The price base, exactly as published:
| Source | Label analysis | Published price | $/st | What the price is |
|---|---|---|---|---|
| Feather meal, feed grade | 80% protein | $475–500/st | 487.50 | Bulk, ask, FOB Minnesota, truck; week of Oct 5–9 |
| Blood meal, ruminant, feed grade | not stated | $1,670/st | 1,670.00 | Bulk, trade, FOB central U.S., truck; week of Oct 5–9 |
| Poultry litter | 30-40-40 lb/ton | $57/st | 57.00 | Budget assumption, delivered and applied, Ohio; Jan 2026 |
| Feather meal | 13-0-0 | $38.20/50 lb | 1,528.00* | Bagged, list, freight extra; Oct 12 |
| Blood meal | 13-0-0 | $66.00/50 lb | 2,640.00* | Bagged, list, freight extra; Oct 12 |
| Soybean meal | 7-1-2 | $32.90/50 lb | 1,316.00* | Bagged, list, freight extra; Oct 12 |
| Fish meal | 9-4.5-0 | $80.40/50 lb | 3,216.00* | Bagged, list, freight extra; Oct 12 |
| Pelleted layer manure (Harmony) | 5-4-3 | $18.85/40 lb | 942.50* | Bagged, list, freight extra; Oct 12 |
| Pelleted poultry manure (Nutri-Rich) | 4-3-2 | $450/2,000 lb | 450.00 | Tote, list, FOB northern California, freight quoted separately, backordered; Oct 12 |
| Sodium nitrate (Allganic Nitrogen Plus) | 15-0-2 | $61.60/50 lb | 2,464.00* | Bagged, list, freight extra; Oct 12 |
| Sodium nitrate | 15-0-2 | $1,800/st | 1,800.00 | Budget assumption, Ohio; Jan 2026 |
| Urea | 46-0-0 | $683/st | 683.00 | Retail average; week of Sep 28–Oct 2 |
| Anhydrous ammonia | 82-0-0 | $979/st | 979.00 | Retail average; week of Sep 28–Oct 2 |
Sources: USDA AMS National Animal By-Product Feedstuff Report, Oct 9, 2026 [2]; Ohio State University Extension organic corn budget, updated Jan 2, 2026 [6]; Seven Springs Farm Supply online list prices, accessed Oct 12, 2026 [4]; Peaceful Valley Farm Supply (GrowOrganic) product page, accessed Oct 12, 2026 [7]; DTN/Progressive Farmer, Oct 7, 2026 [1]. *Crop Root Zone calculation: bag price × (2,000 ÷ bag weight). The retailer's pages showed no pallet or ton pricing.
For availability we use Oregon State's organic fertilizer calculator, the one university tool we found that covers manures and specialty meals with a single rule. It predicts plant-available nitrogen ten weeks after application from the product's nitrogen content: 75% of total nitrogen for anything at 6% nitrogen or above, and (15 × %N) − 15 below that, which gives 60% for a 5% product and 45% for a 4% product. For bagged products it takes the label nitrogen as the input (Oregon State University Extension, May 2019) [5]. The same publication reports field trials in sweet corn in which broiler litter at 3.8% nitrogen in dry matter returned 42% of its nitrogen, and we use that measured figure for litter. The calculator was built for irrigated summer vegetables in Oregon's Willamette Valley with the material tilled in [5]. We found no Corn Belt coefficients for feather, blood, fish or soybean meal, so the figures below carry that limitation.
The arithmetic is $/lb total N = $/st ÷ (2,000 × %N), and $/lb available N = $/lb total N ÷ availability.
| Source and price basis | $/lb total N | First-year availability | $/lb available N | |
|---|---|---|---|---|
| Fish meal, bagged | 17.87 | 75% | 23.82 | ██████████ |
| Pelleted layer manure 5-4-3, bagged | 9.43 | 60% | 15.71 | ███████░░░ |
| Blood meal, bagged | 10.15 | 75% | 13.54 | ██████░░░░ |
| Soybean meal, bagged | 9.40 | 75% | 12.53 | █████░░░░░ |
| Pelleted poultry manure 4-3-2, tote | 5.63 | 45% | 12.50 | █████░░░░░ |
| Blood meal, feed grade, bulk | 6.42* | 75% | 8.56* | ████░░░░░░ |
| Sodium nitrate, bagged | 8.21 | 100%* | 8.21 | ███░░░░░░░ |
| Feather meal, bagged | 5.88 | 75% | 7.84 | ███░░░░░░░ |
| Sodium nitrate, Ohio budget price | 6.00 | 100%* | 6.00 | ███░░░░░░░ |
| Poultry litter, delivered and applied | 1.90 | 42% | 4.52 | ██░░░░░░░░ |
| Feather meal, feed grade, bulk | 1.90* | 75% | 2.54* | █░░░░░░░░░ |
| Legume green manure, Ohio budget | n/a | n/a | 1.50 | █░░░░░░░░░ |
| Urea (conventional) | 0.74 | n/a | 0.74 | ░░░░░░░░░░ |
| Anhydrous ammonia (conventional) | 0.60 | n/a | 0.60 | ░░░░░░░░░░ |
Sources: prices as in the table above [1][2][4][6][7]; availability from Oregon State University Extension EM 9235, May 2019 [5]. All dollar-per-pound figures are Crop Root Zone calculations. *Assumptions: feed-grade feather meal is taken at 12.8% N (80% protein ÷ 6.25); feed-grade blood meal at 13% N, the fertilizer label value, because USDA's report states no protein; sodium nitrate is treated as fully available because it is a soluble nitrate salt, which the Oregon tool does not cover. The legume row is $45 an acre divided by the 30 lb N credit in Ohio State's budget. Nitrogen-only cost; no credit for phosphate or potash. Bars scale $/lb available N.
Three points about the ranking. First, the calculator is conservative for feather meal: its one field trial returned 99% of the nitrogen in a 13.7% product [5], which would put truckload feather meal at $1.92 a pound of available nitrogen. Second, low-analysis pellets lose twice, once on price per pound of nitrogen and again on availability. Third, the retailer's liquid fish products, labelled 2-3-1 and 2-4-1 at $91.40 and $147.30 for five gallons [4], are not field-scale nitrogen sources at any plausible density, and we did not compute them because the pages state no weight per gallon.
Ground Truth: The package sets the price of organic nitrogen more than the material does. Feather meal costs 3.1 times as much per ton in a 50-pound bag as on a truck at the rendering plant, and that one step moves it from 4.3 times the cost of anhydrous to 13 times. A grain grower pricing nitrogen from a garden-and-market-farm price list is reading the wrong market. The first call is to a renderer or a feed-ingredient broker for a truckload quote. The second is to the certifier, because we did not verify that any particular feed-grade lot is approved for use as a fertilizer in organic production, and that approval is product by product.
2. Litter and legumes are the only sources near conventional prices
What's new: Ohio State's 2026 organic corn budget supplies its nitrogen with three tons of poultry litter at $57 a ton delivered and applied, assumed to carry 30 pounds of nitrogen, 40 of phosphate and 40 of potash per ton, plus a cover crop or green manure at $45 an acre credited with 30 pounds of nitrogen [6]. That is $1.90 per pound of total nitrogen in the litter and $1.50 per pound of credited legume nitrogen.
Evidence: Litter's cost per pound of nitrogen depends on whether the field can use the phosphate and potash that ride along. We value those at conventional retail, the way our earlier manure pieces did: phosphate at 72.5 cents a pound (DAP at $934 a ton less its nitrogen at the urea price) and potash at 41.6 cents (potash at $499 a ton, 60% K2O) [1].
| Litter case | Net cost of the nitrogen, $/st | $/lb total N | $/lb available N at 42% | $/lb available N at 60% |
|---|---|---|---|---|
| Nitrogen only, no value on P and K | 57.00 | 1.90 | 4.52* | 3.17* |
| Full credit for 40 lb P2O5 and 40 lb K2O ($45.62) | 11.38* | 0.38* | 0.90* | 0.63* |
Source: Crop Root Zone calculation from Ohio State University Extension, Jan 2, 2026 [6]; DTN/Progressive Farmer, Oct 7, 2026 [1]; Oregon State University Extension, May 2019 [5]. Basis: one ton of litter at 30-40-40, delivered and applied. *Calculated. The 60% column is the availability our August litter piece used [11]. The budget does not say whether its 30 lb is total or available nitrogen; we treat it as total.
The credited case is the cheapest nitrogen in this article, and it has a ceiling. Supplying 100 pounds of available nitrogen from litter at 42% takes 7.9 tons an acre and applies 317 pounds of phosphate, by our calculation. Our August piece found the phosphate in litter caps the sensible rate well below what a corn crop's nitrogen need would call for (TRZ-0096, Aug 13, 2026) [11]. The Ohio budget's three tons already applies 120 pounds of phosphate, a maintenance rate at its stated soil test of 25 ppm phosphorus [6].
For legumes, Oregon State's table predicts 25 pounds of available nitrogen per dry ton of cover crop residue at 3.0% nitrogen and 32 pounds at 3.5% [5]. A stand of two dry tons an acre at 3.5%, our assumption, would release 64 pounds, or 70 cents a pound at the Ohio budget's $45. The $45 does not include the cost of a season in which the field grows no cash crop, and that is the larger cost on rented ground.
Ground Truth: Litter and feather meal fit together, and the phosphate decides the split. Litter at the rate the soil test's phosphate allows is nitrogen at under a dollar a pound. Past that rate the phosphate has no value to that field and the next pound of litter nitrogen costs $4.52. Truckload feather meal at $2.54 carries no phosphate. So the low-cost program is litter to the phosphate limit, the legume credit, and feather meal for the balance, in that order. A program that meets the whole nitrogen need with litter is buying its last tons at nearly twice the feather meal price and loading phosphorus as well.
3. Sodium nitrate is the only soluble source, and the rule caps it at a fifth of the crop's need
What's new: Nothing in the rule has changed. Sodium nitrate remains on the National List of prohibited nonsynthetic substances "unless use is restricted to no more than 20% of the crop's total nitrogen requirement" (7 CFR 205.602, as published by Cornell's Legal Information Institute, accessed Oct 12, 2026) [8]. We could not load the government's own eCFR page, which redirected to a block notice.
Evidence: Ohio State's budget lists Chilean nitrate at 15-0-2 as an optional line at $1,800 a ton, 90 cents per pound of product, and budgets none [6]. The bagged list price we found for the same analysis is $2,464 a ton [4]. Those are $6.00 and $8.21 per pound of nitrogen. For a corn crop with a total requirement of 150 pounds of nitrogen, our assumption, the cap is 30 pounds, which is 200 pounds of product and $180 an acre at the Ohio price or $246 at the bagged price.
Sodium nitrate is priced well above truckload feather meal per pound of nitrogen. What it buys is timing. It is available on the day it is applied, and the meals are not. Oregon State cites incubation work in which specialty meals released 53% of their nitrogen in four weeks at 50°F and 63% at 77°F [5], so a cold spring delays the meals by weeks.
4. What the organic premium can carry
What's new: Ohio State's budget prices organic corn at $9.20 a bushel, twice the December 2026 futures price at the time it was written, and 140 bushels an acre. At that price it returns $75 an acre above total costs of $1,263 [6]. The market has since moved above the budget. USDA's September 30 report shows new-crop forward contracts averaging $11.23 FOB the farm in a range of $9.75 to $13.00, and old-crop spot corn at $12.20 delivered to feed mills [3]. DTN's national cash index for conventional corn was $4.60 on September 30 (DTN, Oct 1, 2026) [10].
Evidence: The table prices 100 pounds of first-year-available nitrogen per acre from each source. The rate is our assumption for comparison, not a recommendation.
| Source and price basis | Product for 100 lb available N, lb/acre | $/acre | Bushels of organic corn at $11.23 |
|---|---|---|---|
| Anhydrous (conventional) | 122* | 59.70* | 13.0† |
| Urea (conventional) | 217* | 74.24* | 16.1† |
| Legume green manure at Ohio's $1.50/lb | n/a | 150.00* | 13.4* |
| Feather meal, feed grade, bulk FOB | 1,042* | 253.91* | 22.6* |
| Poultry litter, nitrogen only | 15,873* | 452.38* | 40.3* |
| Sodium nitrate, Ohio budget price | 667* | 600.00* | 53.4* |
| Feather meal, bagged | 1,026* | 783.59* | 69.8* |
| Sodium nitrate, bagged | 667* | 821.33* | 73.1* |
| Blood meal, feed grade, bulk FOB | 1,026* | 856.41* | 76.3* |
| Pelleted poultry manure 4-3-2, tote | 5,556* | 1,250.00* | 111.3* |
| Soybean meal, bagged | 1,905* | 1,253.33* | 111.6* |
| Blood meal, bagged | 1,026* | 1,353.85* | 120.6* |
| Pelleted layer manure 5-4-3, bagged | 3,333* | 1,570.83* | 139.9* |
| Fish meal, bagged | 1,481* | 2,382.22* | 212.1* |
Source: Crop Root Zone calculation from the Section 1 tables [1][2][4][5][6][7] and USDA AMS, Sep 30, 2026 [3]. Formula: $/acre = 100 × $/lb available N; bushels = $/acre ÷ $11.23. *Calculated. †Bushels of conventional corn at DTN's $4.60 national cash index [10]. Freight and spreading are not included except for litter. The sodium nitrate rows are arithmetic only: the rule would not allow 100 lb of nitrogen from it on a crop needing less than 500 lb. The legume row scales a 30 lb credit and is shown for cost comparison.
Repriced at $11.23 with every cost line held as published, the Ohio budget's corn revenue rises from $1,288 to $1,572 an acre and its return above total costs from $75 to $359, by our calculation. Adding back the $171 litter line leaves about $530 an acre that could be spent on purchased nutrients before that return reaches zero. Truckload feather meal at $254 fits inside it with room for freight and spreading. Bagged feather meal at $784 does not, and no other bagged product comes close.
The second test is against conventional corn. Purdue's analysis of 2021–2025 farm records found a 24% yield drag for organic corn and an average net return $312 an acre above conventional, with an organic-to-conventional price ratio of 2.07 in 2025 (Langemeier, Purdue University, Jun 12, 2026) [9]. This week's ratio is 2.44, taking $11.23 over $4.60; the two prices are on different bases, a forward farm price and a cash index. A 140-bushel organic crop grosses $1,572. The conventional crop implied by Purdue's drag is 184 bushels and $847. The gross advantage is about $725 an acre, our estimate.
$725 an acre
Organic corn's gross revenue advantage over conventional at this week's prices: 140 bushels at $11.23 against 184 bushels at $4.60. One hundred pounds of available nitrogen costs $60 as anhydrous, $254 as truckload feather meal and $784 as bagged feather meal. (Crop Root Zone estimate from USDA AMS, Sep 30, 2026; DTN, Oct 1 and Oct 7, 2026; Purdue University, Jun 12, 2026; Ohio State University Extension, Jan 2, 2026)
Soybeans do not change the answer. Ohio State budgets organic soybeans at $23.75 a bushel with one ton of litter and no purchased nitrogen [12], and USDA's report has new-crop forwards at $22.15 FOB the farm [3]. The corn year carries the rotation's nitrogen bill.
Two gaps remain. Iowa State's organic budgets were last updated in March 2020 [13], and we did not use them. We found no public 2026 price for bulk pelleted layer manure by the truckload, which is how Corn Belt organic grain farms buy it. The pellet figures above are a bagged price and a California tote price, and they overstate what a truckload buyer near an egg complex pays by an amount we cannot measure.
Ground Truth: Crop Root Zone's read is that the organic corn premium is large enough to pay four to five times the conventional price for nitrogen and not thirteen times. That puts the line between truckload and bag. A grower with access to litter, a legume in the rotation and a truckload feather meal quote under $600 a ton delivered is buying nitrogen for 20 to 40 bushels an acre out of 140. A grower who covers a nitrogen shortfall in June from bagged product is spending 70 bushels or more to protect a crop whose whole advantage over conventional is 65 bushels at $11.23. The decision this fall is therefore a procurement one. Book the litter, seed the legume, get the bulk meal quote and the certifier's sign-off before spring, and treat sodium nitrate as a 30-pound rescue for a cold start. Feather meal asks rose 23% in a year and blood meal trades 59%, so the truckload price is moving, and the corn price that pays for it is $2.03 above the budget it is being compared with.
References
- Quinn, R., "UAN32 Leads Fertilizer Prices Higher," DTN Retail Fertilizer Trends, DTN/Progressive Farmer, Oct 7, 2026 (retail survey week of Sep 28–Oct 2, 2026: anhydrous $979/ton, urea $683, DAP $934, potash $499) — https://www.dtnpf.com/agriculture/web/ag/crops/article/2026/10/07/uan32-leads-fertilizer-prices-higher
- USDA Agricultural Marketing Service, Livestock, Poultry and Grain Market News, "National Animal By-Product Feedstuff Report" (AMS 3510), Oct 9, 2026, for the week of Oct 5–9, 2026 (Feathermeal 80%; Commodity Blood Meal Ruminant) — https://www.ams.usda.gov/mnreports/ams_3510.pdf
- USDA Agricultural Marketing Service, Livestock, Poultry and Grain Market News, "National Organic Grain and Feedstuff Report" (AMS 3802), Sep 30, 2026, for Sep 14–25, 2026; next report due Oct 14, 2026 — https://www.ams.usda.gov/mnreports/ams_3802.pdf
- Seven Springs Farm Supply, online fertilizer catalog, list prices as displayed on Oct 12, 2026 (feather meal 13-0-0, blood meal 13-0-0, soybean meal 7-1-2, fish meal 9-4.5-0, Harmony Ag Organic 5-4-3, Allganic Nitrogen Plus 15-0-2, liquid fish products; catalog pages 1 to 4 of 10 read) — https://www.7springsfarm.com/collections/fertilizers
- Sullivan, D.M.; Andrews, N.; Sullivan, C.; Brewer, L.J., "OSU Organic Fertilizer & Cover Crop Calculator: Predicting Plant-available Nitrogen," Oregon State University Extension Service EM 9235, May 2019 (Tables 2, 3 and 7; Equation A; the Hartz and Johnstone 2006 incubation results are as cited in this publication, the original paper returned an access error) — https://extension.oregonstate.edu/sites/default/files/documents/em9235.pdf
- Richer, E.; Ward, B.; Ortez, O., "Organic Corn Production Budget — 2026," Ohio State University Extension, updated Jan 2, 2026 (spreadsheet; poultry litter nutrient source, 500 acres) — https://farmoffice.osu.edu/sites/aglaw/files/site-library/farmmgtpdf/enterprisebudgets/corn-organic2_Jan_2026.xlsx
- Peaceful Valley Farm Supply (GrowOrganic), "Nutri-Rich 4-3-2 Pellets (2000 lb tote)," product page, list price as displayed on Oct 12, 2026 — https://www.groworganic.com/products/spc-nutri-rich-432-pellets-2000-lb-tote
- 7 CFR 205.602, "Nonsynthetic substances prohibited for use in organic crop production," paragraph (h), as published by Cornell Law School Legal Information Institute, accessed Oct 12, 2026 (68 FR 61992, Oct 31, 2003, as amended at 83 FR 66572, Dec 27, 2018) — https://www.law.cornell.edu/cfr/text/7/205.602
- Langemeier, M., "Conventional and Organic Enterprise Net Returns," Purdue University Center for Commercial Agriculture, Jun 12, 2026 (title as given in the page address; FINBIN data, 2021–2025; the article's tables are images and were not readable, figures are from its text) — https://ag.purdue.edu/commercialag/home/resource/2026/06/conventional-and-organic-enterprise-net-returns/
- Kennedy, M., "Corn Basis Weaker," DTN Daily Basis Comments, DTN/Progressive Farmer, Oct 1, 2026 (title as given in the page address; DTN National Corn Index $4.60 for Sep 30) — https://www.dtnpf.com/agriculture/web/AG/news/article/2026/10/01/corn-basis-weaker
- Crop Root Zone, TRZ-0096, "Half the Value of a Ton of Poultry Litter Is Now Phosphate. That Is Also Why You Cannot Spread It," Aug 13, 2026.
- Richer, E.; Ward, B., and co-authors, "Organic Soybean Production Budget — 2026," Ohio State University Extension, updated Jan 2, 2026 (spreadsheet) — https://farmoffice.osu.edu/sites/aglaw/files/site-library/farmmgtpdf/enterprisebudgets/soy-organic%202_Jan_2026.xlsx
- Chase, C.; Delate, K., "Organic Crop Production Enterprise Budgets," Iowa State University Extension and Outreach, Ag Decision Maker File A1-18, updated Mar 2020 (landing page read; budget spreadsheets not used) — https://www.extension.iastate.edu/agdm/crops/html/a1-18.html
Disclosures
Crop Root Zone is an independent publication. Nothing here is investment advice. Market calls, where included, reflect the editors' own read and are not a recommendation to buy or sell any security.
A Thousand Gallons of Dairy Slurry Carries $28.86 of Nutrients at October Prices. A Crop Can Use $18.79 of It the First Year. Wisconsin's Average Dragline Charge Is $17.50.
At Wisconsin's book analysis of 24-8-21 and the October 7 retail survey, injected dairy slurry's first-year credit clears the average custom application charge by about a dollar per 1,000 gallons, which buys less than a mile of tanker haul. Nitrogen alone is worth $7.16. At 2% solids the same gallon is worth $11.16 and costs the same to move.
A thousand gallons of liquid dairy manure at Wisconsin's book analysis for slurry, 24 pounds of nitrogen, 8 of phosphate and 21 of potash (University of Wisconsin–Extension, Nov 2012) [2], carried $28.86 of fertilizer nutrients at the retail prices DTN published on October 7 (DTN/Progressive Farmer, Oct 7, 2026) [1]. A crop does not get all of it. Using Wisconsin's own availability factors, the first-year credit is $18.79 when the manure is injected and $15.92 when it is left on the surface. Wisconsin's average custom charge to apply 1,000 gallons by dragline was $17.50 in the 2025 survey (University of Wisconsin–Madison Division of Extension, Aug 2026) [7]. The margin between the injected credit and that charge is $1.29. This piece works through what sits inside that margin, what widens it and how few miles of road it pays for.
1. What a thousand gallons carries, and what a crop can use
What's new: Seven of the eight fertilizers DTN tracks were higher than a month earlier in the week of September 28–October 2. Anhydrous averaged $979 a ton, urea $683, DAP $934 and potash $499. On the year, anhydrous is up 20%, urea 12%, and DAP and potash 3% each [1].
Evidence: We price nutrients the way our September swine manure piece did (TRZ-0194, Sep 15, 2026) [15]. Nitrogen is valued at the anhydrous price, the cheapest retail nitrogen. Phosphate is valued from DAP after subtracting its 360 pounds of nitrogen at the urea price. Potash is valued at 60% K2O. Wisconsin's guide credits liquid dairy manure with 50% of its total nitrogen in the first year when injected or incorporated within an hour, 40% when incorporated within 72 hours and 30% when left longer or never incorporated. It credits 80% of the phosphate and potash, not because the rest is unavailable but to allow for uneven spreading and load-to-load variation. It adds 10% of total nitrogen in the second year and 5% in the third [2].
| Nutrient | Retail basis | $/lb | Total lb per 1,000 gal | Total $ | First-year lb, injected | First-year $, injected | First-year $, surface |
|---|---|---|---|---|---|---|---|
| N | Anhydrous, $979/st | 0.597* | 24.0 | 14.33* | 12.0 | 7.16* | 4.30* |
| P2O5 | DAP, $934/st, less N at urea | 0.725* | 8.0 | 5.80* | 6.4 | 4.64* | 4.64* |
| K2O | Potash, $499/st | 0.416* | 21.0 | 8.73* | 16.8 | 6.99* | 6.99* |
| Total | 28.86* | 18.79* | 15.92* |
Source: DTN/Progressive Farmer, Oct 7, 2026 (retail averages, week of Sep 28–Oct 2, 2026) [1]; book analysis for dairy slurry, 4.1–11.0% dry matter, and availability factors from University of Wisconsin–Extension A2809, Nov 2012 [2]. Basis: dollars per 1,000 gallons, nutrient value only, before agitation, hauling and application. *Crop Root Zone calculation. Totals are summed before rounding.
Counting the second- and third-year nitrogen and all of the phosphate and potash, the manure returns $23.84 over three years, by our calculation. The remaining $5 or so is nitrogen that Wisconsin's factors never credit. Valued at urea's 74 cents a pound, the right basis where manure displaces spring urea or UAN, the injected nitrogen is worth $8.91 and the first-year total $20.53.
Our unit prices are slightly above the September piece's 57.2 cents for nitrogen, 72.0 for phosphate and 41.1 for potash, because the survey is four weeks newer. Our phosphate figure is below the 77 cents used in yesterday's wood ash piece (TRZ-0265, Oct 8, 2026) [16], which netted DAP's nitrogen at the anhydrous price. On that method phosphate is 78 cents and the first-year total rises by 36 cents.
A cross-check: the University of Wisconsin's Chippewa County extension office valued the same book manure, incorporated within one to three days, at $17.55 per 1,000 gallons in April 2023 (UW–Madison Extension Chippewa County, Apr 24, 2023) [17]. At this week's prices that case is $17.35, by our calculation.
Ground Truth: Dairy slurry is a low-analysis product moved at the same cost per gallon as a high-analysis one. Injected deep-pit hog manure was worth $70.60 per 1,000 gallons in our September piece [15]. Book dairy slurry is worth $18.79 on the same basis, 27% as much, and the tanker charges the same for either load. That ratio, not the fertilizer price, is why hog manure gets sold and dairy manure gets placed. A dairy that prices a manure agreement on the $28.86 total is asking a neighbor to pay for $10 of nutrients his agronomist will not let him credit next spring.
2. The book and the water move the value more than the price does
What's new: The state books do not agree. Penn State's Agronomy Guide lists liquid dairy manure at 28 pounds of nitrogen per 1,000 gallons, half ammonium and half organic (Penn State Extension, Jun 1, 2023) [4]. Minnesota's tables, drawn from MidWest Plan Service data, list 31-15-19 for dairy cows and 32-14-28 for heifers (Minnesota Department of Agriculture and University of Minnesota Extension, Nov 2012) [5]. Wisconsin separates slurry from thin liquid under 4% dry matter, which it puts at 14-4-14 [2].
Evidence:
| Book value | N-P2O5-K2O, lb/1,000 gal | Total $ | First-year $, injected | |
|---|---|---|---|---|
| Minnesota, dairy heifers, liquid | 32-14-28 | 40.89* | 26.98* | ██████████ |
| Minnesota, dairy cows, liquid | 31-15-19 | 37.28* | 24.27* | █████████░ |
| Penn State, dairy liquid | 28-13-25 | 36.53* | 24.21* | █████████░ |
| Wisconsin, dairy slurry, 4.1–11.0% dry matter | 24-8-21 | 28.86* | 18.79* | ███████░░░ |
| Wisconsin, dairy liquid, under 4.0% dry matter | 14-4-14 | 17.08* | 11.16* | ████░░░░░░ |
Sources: Minnesota Department of Agriculture and University of Minnesota Extension, Nov 2012 [5]; Penn State Extension, Jun 1, 2023 [4], with phosphate and potash as indexed from Penn State's milk and manure nutrient calculator page [18]; University of Wisconsin–Extension A2809, Nov 2012 [2]. Prices as in Section 1 [1]. *Crop Root Zone calculation. To keep the rows comparable, every row uses Wisconsin's factors of 50% of nitrogen and 80% of phosphate and potash; each state's own factors differ, as Section 3 shows. Bars scale total value.
The Wisconsin table rests on manure samples tested in the state from 1998 to 2012, and its typical dry matter is 6% for slurry and 2% for thin liquid [2]. The spread between those two rows is water. A dragline or tanker is paid by the gallon, so dilution cuts the value and leaves the bill alone.
| Dry matter | N-P2O5-K2O, lb/1,000 gal | First-year $, injected | Left after $17.50 dragline charge |
|---|---|---|---|
| 2% (Wisconsin liquid) | 14-4-14 | 11.16* | −6.34* |
| 4% (interpolated) | 19-6-17.5* | 14.97* | −2.53* |
| 6% (Wisconsin slurry) | 24-8-21 | 18.79* | +1.29* |
Source: Crop Root Zone calculation from University of Wisconsin–Extension A2809 [2], DTN prices [1] and the 2025 Wisconsin custom rate survey [7]. Basis: dollars per 1,000 gallons. *Calculated. The 4% row is our straight-line interpolation between Wisconsin's two typical analyses, not a published value.
On that line each point of dry matter is worth about $1.91 per 1,000 gallons, and the first-year credit equals the dragline charge at about 5.3% solids. Both are our estimates.
We could not obtain current book values from Michigan State or Cornell. Michigan State's extension pages returned no content on October 9. Cornell's dairy nitrogen pages work from a farm's own analysis and give no state average.
Ground Truth: Solids content is the number to know before choosing where a load goes. The thicker fraction is the only dairy manure worth trucking. Thin liquid at 2% solids is worth less than it costs to apply and belongs on the nearest field that can take the volume. A storage pumped without thorough agitation sends the cheap gallons to the far fields and the valuable ones to the home farm, or the reverse, and neither the dairy nor the neighbor knows which. A dry matter test per day of pumping costs little against a $7.63 swing per 1,000 gallons.
3. Nitrogen: the method and the season
What's new: The guides disagree more on nitrogen than on anything else, and the disagreement is largest for fall application. Wisconsin's table makes no distinction by season [2]. Cornell's does: for fall application it assumes 100% of the ammonium nitrogen is lost to leaching or denitrification even when the manure is incorporated. In spring it credits 65% of the ammonium when manure is incorporated within a day, falling to nothing after five days. For sidedress injection into a growing crop it credits all of it (Cornell University, Nitrogen Management on Dairy Farms, accessed Oct 9, 2026) [6].
Evidence: The table applies each guide to the same manure: Penn State's book value of 14 pounds of ammonium nitrogen and 14 pounds of organic nitrogen per 1,000 gallons [4].
| Guide and case | First-year N credited, lb | Share of total N | $ at 59.7¢/lb |
|---|---|---|---|
| Penn State, spring, immediate incorporation | 16.1 | 58%* | 9.61* |
| Minnesota, sweep injection or incorporated within 12 hours | 15.4* | 55% | 9.19* |
| Wisconsin, injected or incorporated within 1 hour | 14.0* | 50% | 8.36* |
| Minnesota, knife injection | 14.0* | 50% | 8.36* |
| Cornell, spring, incorporated within 1 day | 14.0* | 50%* | 8.36* |
| Wisconsin, incorporated within 1 to 72 hours | 11.2* | 40% | 6.69* |
| Wisconsin, not incorporated | 8.4* | 30% | 5.01* |
| Penn State, spring, no incorporation | 6.3 | 23%* | 3.76* |
| Minnesota, not incorporated within 96 hours | 5.6* | 20% | 3.34* |
| Fall, Cornell's rule: ammonium credit zero | 4.9* | 18%* | 2.93* |
Sources: Penn State Extension, updated Mar 18, 2026 [3]; Minnesota Department of Agriculture and University of Minnesota Extension, Nov 2012 [5]; University of Wisconsin–Extension A2809, Nov 2012 [2]; Cornell University, accessed Oct 9, 2026 [6]. Basis: 1,000 gallons at 28 lb total N, half ammonium. *Crop Root Zone calculation. The Cornell rows apply Cornell's ammonium factors with Penn State's 0.35 factor for organic nitrogen, because we could not retrieve Cornell's own organic nitrogen factors; they are our estimate, not a Cornell figure.
Penn State's two spring cases are 16.1 and 6.3 pounds per 1,000 gallons, a gap its author values at $69 an acre at 7,000 gallons and $1 nitrogen [3]. At this week's anhydrous price the same gap is $41 an acre, by our calculation. The fall case costs more. Moving from spring injection to Cornell's fall rule gives up 11.2 pounds, or $6.69 per 1,000 gallons and $67 an acre at 10,000 gallons.
Minnesota credits a further 25% of dairy manure nitrogen in the second year [5], against Wisconsin's 10% [2]. Wisconsin's guide also notes that for manure under 2% dry matter with more than 75% of its nitrogen as ammonium, the credit can be figured as the ammonium plus a quarter of the rest, if it is injected [2].
Ground Truth: Fall application hurts dairy manure less than it hurts hog manure, and that should change which fields get it. Phosphate and potash are 62% of injected dairy slurry's first-year value, and neither one leaves over winter. The practical split is to send October and November manure to fields where the soil test calls for phosphate and potash and to budget its nitrogen at the organic fraction only, then hold spring and sidedress gallons, injected, for corn ground where nitrogen is the purchase being replaced. A plan that credits fall manure at Wisconsin's 50% in a state whose neighbor's guide credits the ammonium at zero is carrying a nitrogen assumption worth checking with a pre-sidedress nitrate test.
4. The haul: what the surveys charge, and how far the margin goes
What's new: Wisconsin's dragline rate rose 17% in a year, from $14.90 per 1,000 gallons in the 2024 survey to $17.50 in the 2025 survey, with reports from $10 to $30 [7][8]. Iowa's 2026 survey, mailed in early February, averaged $16.85 for dragline application and $18.15 for injection, with injection quotes from $11 to $29 (Iowa State University Extension, Mar 2026) [9]. The Iowa survey assumed diesel at $2.89 a gallon [9]. Midwest retail diesel averaged $3.625 in the week of February 2 and $6.286 in the week of October 5, a rise of 73% (U.S. Energy Information Administration, accessed Oct 9, 2026) [14]. The two diesel series are on different bases.
Evidence: None of the three surveys prices distance. The public figures that do are older.
| Source | Operation | Rate, $/1,000 gal | Responses or basis |
|---|---|---|---|
| Wisconsin, 2025 season | Dragline application | 17.50 | 7 reports, range 10.00–30.00, median 16.50 |
| Wisconsin, 2024 season | Dragline application | 14.90 | 10 reports, range 10.00–30.00 |
| Iowa, 2026 | Dragline application | 16.85 | 9 reports, median 16.00 |
| Iowa, 2026 | Tanker, injected | 18.15 | 16 reports, median 17.00, range 11.00–29.00 |
| Michigan, 2012, modelled | Tank spreaders, injected, 2.5-mile average haul | 14.80 | 1,400-cow dairy, owned equipment |
| Michigan, 2012, modelled | Tank spreaders, injected, 4-mile average haul | 16.40 | Same dairy |
| Iowa, fall 2013 survey | Commercial application at 1 mile | 13.00 | 41 commercial applicators |
| Iowa, fall 2013 survey | Each added mile | 3.50 | Same survey |
| Michigan, 2012, modelled | Each added mile | 1.07* | Difference between the 2.5- and 4-mile cases |
| Vermont worksheet example | Each added one-way mile | 2.82 | $110/hour, 15 mph, 5,200-gallon load |
Sources: University of Wisconsin–Madison Division of Extension, Aug 2026 and 2025 [7][8]; Iowa State University Extension, Mar 2026 [9]; T. Harrigan, Michigan State University, Feb 24, 2012 [11]; D. Andersen, Iowa State University, May 9, 2016 [10]; S. Bosworth, University of Vermont, Mar 2008 [13]. Basis: custom or modelled charge per 1,000 gallons, fuel and labor included. *Crop Root Zone calculation: (16.40 − 14.80) ÷ 1.5 miles.
The per-mile figures span a factor of three, and all three predate this year's fuel prices. Harrigan's field timing explains why distance bites: a tank spreader's hauling rate fell 20% with a one-mile haul, 40% at two miles and 50% at three (Progressive Dairy, Oct 31, 2011) [12]. The Vermont worksheet gives the method for a grower's own quote: hourly rate, divided by average road speed, divided by the load, times two for the return trip [13].
The next table takes Iowa's $18.15 as the tanker charge before any added miles, because it is the only 2026 tanker figure we found, and asks how far the remainder goes at the high and low per-mile figures.
| Nutrients the receiving field can credit | Value, $/1,000 gal | Left after $17.50 dragline | Left after $18.15 tanker | Miles at $3.50 | Miles at $1.07 |
|---|---|---|---|---|---|
| N only (soil test excessively high) | 7.16* | −10.34* | −10.99* | none | none |
| N plus half of P2O5 and K2O (soil test high) | 12.98* | −4.52* | −5.17* | none | none |
| N and K2O | 14.15* | −3.35* | −4.00* | none | none |
| N, P2O5 and K2O, first year | 18.79* | +1.29* | +0.64* | 0.2* | 0.6* |
| N, P2O5 and K2O over three years | 23.84* | +6.34* | +5.69* | 1.6* | 5.3* |
| Penn State book, first year | 24.21* | +6.71* | +6.06* | 1.7* | 5.7* |
| Every pound in the load | 28.86* | +11.36* | +10.71* | 3.1* | 10.0* |
Source: Crop Root Zone calculation from Sections 1 and 2 and the rates above [1][2][7][9][10][11]. Basis: Wisconsin book slurry, injected, except the Penn State row; dollars per 1,000 gallons. Soil-test rows follow Wisconsin's rule of half the optimum-category rate on high-testing soils and none on excessively high [2]. *Calculated. The Iowa survey does not state the haul distance included in its $18.15, and the per-mile figures are from 2012 and 2013, so the distances are indicative only.
$1.29
What is left of injected dairy slurry's first-year nutrient credit per 1,000 gallons after Wisconsin's average dragline charge, on a field that needs all three nutrients. On a field testing excessively high in phosphorus and potassium, the application costs $10.34 more than the nitrogen is worth. (Crop Root Zone calculation from DTN/Progressive Farmer, Oct 7, 2026; University of Wisconsin–Extension, Nov 2012; University of Wisconsin–Madison Division of Extension, Aug 2026)
Wisconsin's guide sets the phosphate and potash rate at crop removal on soils testing optimum, half that on soils testing high and zero on soils testing excessively high. It also warns that corn silage and alfalfa remove large amounts of potassium and draw high-testing soils down quickly [2]. Minnesota's removal table puts corn silage at 3.1 pounds of phosphate and 7.3 pounds of potash per ton as fed [5]. A 25-ton crop, our assumed yield, removes about 78 and 183 pounds. Ten thousand gallons of book slurry applies 80 and 210. On silage ground at optimum soil test, then, the phosphate and potash are a full-value maintenance application at about 10,000 gallons an acre. That rate credits 120 pounds of nitrogen when injected and costs $175 an acre to apply by dragline, against $188 of fertilizer replaced, by our calculation. We found no current custom rate for liquid manure in Pennsylvania or Michigan. A trade-press summary of Pennsylvania's rates returned an error, and Michigan State's rate reports did not load.
Ground Truth: At book values and survey rates, the fertilizer market pays for applying dairy slurry and for almost none of the road. Every mile past the first is a cost of owning cows and storage, and it should be budgeted there. That has a consequence for manure agreements. A crop farmer who is asked to pay application on hauled dairy manure is paying more than the nutrients return in the first year on any soil test short of low. The arrangement the numbers support is the reverse of the hog-manure deal: the dairy pays the hauling and most of the application, and the receiving farm pays for the pounds it can credit on its own soil test, at a discount for the nitrogen risk. The surveys behind the $17.50 and $18.15 were fielded in February and March. Midwest diesel was $3.63 in early February and is $6.29 now. A fall quote that has moved with fuel will already have used up the $1.29.
5. What to check before the pump starts
What's new: Retail fertilizer has added 41 cents to the first-year value of 1,000 gallons of book slurry since the September 9 survey our swine manure piece used, by our calculation [15]. The variables under a manager's control each move it more.
Evidence:
| Check | What it is worth at this week's prices | Where the reading comes from |
|---|---|---|
| Dry matter of the lot being pumped | About $1.91 per 1,000 gal per point of solids* | Lab test during agitation |
| Soil test P and K of the receiving field | $11.62 of the $18.79 first-year credit, only if the field needs both | Current soil tests |
| Hours to incorporation | $2.87 per 1,000 gal between injection and no incorporation, on Wisconsin's factors | Application record |
| Season | $6.69 per 1,000 gal between spring injection and Cornell's fall rule, on a 28-lb manure | Calendar and cover crop plan |
| Custom quote against $17.50 | Each added dollar removes 0.3 to 0.9 mile of haul that pays* | Applicator quote, with the mileage stated |
Sources: DTN/Progressive Farmer, Oct 7, 2026 [1]; University of Wisconsin–Extension A2809, Nov 2012 [2]; Cornell University, accessed Oct 9, 2026 [6]; University of Wisconsin–Madison Division of Extension, Aug 2026 [7]; Andersen, May 9, 2016 [10]; Harrigan, Feb 24, 2012 [11]. All dollar figures are Crop Root Zone calculations. *Estimates, from the interpolation in Section 2 and the $3.50 and $1.07 per-mile figures in Section 4.
Ground Truth: Crop Root Zone's read is that the useful number for a dairy this fall is not the $28.86 a thousand gallons carries but the cost per cow of getting it onto ground that can use it. Harrigan put agitation, pumping, transport and application at $100 to $160 a cow a year in Michigan in 2011 [12]. The nutrient credit offsets most of that only when the gallons are thick, the fields are close and the soil tests are not already high. A dairy that has outgrown its nearby land base has three levers that the fertilizer market does not: remove water before hauling, move solids and not liquid to the distant fields, and add land within dragline reach. Each one changes the arithmetic in the tables above by more than the 41 cents retail fertilizer has added since early September.
References
- Quinn, R., "UAN32 Leads Fertilizer Prices Higher," DTN Retail Fertilizer Trends, DTN/Progressive Farmer, Oct 7, 2026 (retail survey week of Sep 28–Oct 2, 2026: anhydrous $979/ton, urea $683, DAP $934, potash $499) — https://www.dtnpf.com/agriculture/web/ag/crops/article/2026/10/07/uan32-leads-fertilizer-prices-higher
- Laboski, C.A.M.; Peters, J.B., "Nutrient Application Guidelines for Field, Vegetable, and Fruit Crops in Wisconsin," University of Wisconsin–Extension A2809, revised Nov 2012 (Tables 9.1, 9.2 and 9.3; Chapter 7 soil-test categories) — https://cropsandsoils.extension.wisc.edu/files/2026/03/A2809-web.pdf
- White, C., "Calculating the Value of Immediate Manure Incorporation," Penn State Extension, updated Mar 18, 2026 — https://extension.psu.edu/calculating-the-value-of-immediate-manure-incorporation
- Penn State Extension, Pennsylvania Nutrient Management Program, "Newly Released Penn State Agronomy Guide Tables" (Tables 1.2-10 to 1.2-12), Jun 1, 2023 — https://extension.psu.edu/programs/nutrient-management/news/newly-released-penn-state-agronomy-guide-tables
- Minnesota Department of Agriculture and University of Minnesota Extension, "Nutrient & Manure Management Tables" (Table 3 from MWPS-18 Section 1, 2004; Table 4 from Manure Management in Minnesota, FO-3553-C, 2007; Table 5 crop removal), Nov 2012 — https://www.mda.state.mn.us/sites/default/files/2018-05/nutmantables.pdf
- Cornell University, Nitrogen Management on Dairy Farms, "Ammonium N" (undated web page), accessed Oct 9, 2026 — https://dairyn.cornell.edu/pages/20cropsoil/250credits/254ammonium.shtml
- University of Wisconsin–Madison Division of Extension, "Custom Rates for 2025 Wisconsin Farm Operations" (survey launched Mar 2026, 135 respondents), posted Aug 2026 — https://farms.extension.wisc.edu/files/2026/08/Custom-Rates-for-2025-Wisconsin-Farm-Operations.pdf
- University of Wisconsin–Madison Division of Extension, "Custom Rates for 2024 Wisconsin Farm Operations" (survey launched Mar 2025, 161 respondents), 2025 — https://juneau.extension.wisc.edu/files/2025/06/Custom-Rates-for-2024-Wisconsin-Farm-Operations-.pdf
- Johanns, A.; Hart, C., "2026 Iowa Farm Custom Rate Survey," Iowa State University Extension and Outreach, Ag Decision Maker File A3-10, FM 1698, revised Mar 2026 — https://www.extension.iastate.edu/agdm/crops/pdf/a3-10.pdf
- Andersen, D., Iowa State University, "What does manure application cost?" The Manure Scoop, May 9, 2016 (survey of 41 commercial applicators, fall 2013) — http://themanurescoop.blogspot.com/2016/05/what-does-manure-application-cost.html
- Harrigan, T., Michigan State University, article on the economics of trucking manure, first published in Manure Manager, Feb 24, 2012, as reposted by the Lake Improvement Association (title not confirmed against the original) — https://lakeimprovement.com/economics-trucking-manure/
- Harrigan, T., Michigan State University, "What is efficient liquid manure transport and land application?" Progressive Dairy, Oct 31, 2011 — https://agproud.com/topics/manure/what-is-efficient-liquid-manure-transport-and-land-application
- Bosworth, S., University of Vermont Extension, "How Far Can You Afford to Haul Manure?" worksheet, Mar 2008 — https://www.uvm.edu/d10-files/documents/2024-08/Manure_HAUL_Worksheet.pdf
- U.S. Energy Information Administration, Weekly Midwest (PADD 2) No. 2 Diesel Retail Prices, accessed Oct 9, 2026 (weeks of Feb 2 and Oct 5, 2026) — https://www.eia.gov/dnav/pet/hist/LeafHandler.ashx?n=PET&s=EMD_EPD2D_PTE_R20_DPG&f=W
- Crop Root Zone, TRZ-0194, "A Thousand Gallons of Deep-Pit Hog Manure Carries $28 of Nitrogen at September Prices. Iowa's Average Charge to Inject It Is $18.15," Sep 15, 2026.
- Crop Root Zone, TRZ-0265, "A Ton of Average Wood Ash Carries 645 Pounds of Lime Value and 47 Pounds of Potash. It Is Worth $37 Delivered and Spread Where the Soil Needs Both, and $18 Where It Needs Only Lime," Oct 8, 2026.
- Clark, J., University of Wisconsin–Madison Division of Extension, Chippewa County, "Estimating the Value of Manure," Apr 24, 2023 — https://chippewa.extension.wisc.edu/2023/04/24/estimating-the-value-of-manure
- Penn State Extension, Pennsylvania Nutrient Management Program, "Milk-Manure Nutrient Calculator" guidance page (dairy liquid book values of 28 lb N, 13 lb P2O5 and 25 lb K2O per 1,000 gallons, as indexed by web search; the page returned an error on Oct 9, 2026) — https://abe.psu.edu/programs/nutrient-management/scc/policies-guidance/milk-manure-nutrient-calculator-nbs-crop-printouts
Disclosures
Crop Root Zone is an independent publication. Nothing here is investment advice. Market calls, where included, reflect the editors' own read and are not a recommendation to buy or sell any security.
A Ton of Average Wood Ash Carries 645 Pounds of Lime Value and 47 Pounds of Potash. It Is Worth $37 Delivered and Spread Where the Soil Needs Both, and $18 Where It Needs Only Lime.
Priced at ag lime's 2.7 cents a pound and $498 retail potash, average boiler ash is worth $17.55 a ton as lime and $37.04 with its potash. Free ash pays to about 47 miles on lime value alone. Published analyses range from 22% to 92% calcium carbonate equivalent.
Biomass boilers at paper mills, sawmills and wood-fired power plants turn out ash that is part lime and part low-analysis potash, and much of it goes to landfill. The University of Georgia's bulletin puts U.S. output near 3 million tons a year, with about 80% land-applied in the Northeast and less than 10% in the Southeast (Risse and Gaskin, University of Georgia, reviewed Mar 2013) [3]. The same bulletin gives the average analysis of 37 industrial samples: 43% calcium carbonate equivalent (CCE), 2.6% potassium, 0.53% phosphorus and 75% solids. Retail potash averaged $498 a ton in the week of September 21–25 (DTN/Progressive Farmer, Sep 30, 2026) [1], and bulk ag lime costs about 2.7 cents per pound of effective neutralizing material, delivered and spread (TRZ-0257, Oct 5, 2026) [2]. Put those together and an average ton of ash, as it comes off the truck, is worth $17.55 as lime and $37.04 as lime plus potash, by our calculation. The second number is the break-even delivered-and-spread price on ground that needs both. The first is all the ash is worth on ground that needs only lime, and it runs out about 47 miles from the boiler.
1. What is in a ton
What's new: Nothing about the material is new. What changed is the price of what it replaces. Wisconsin's extension bulletin valued average ash at $24 to $38 a ton in 1995, with potash at 11 cents a pound of K2O and northern Wisconsin lime at $20 to $30 a ton (Kopecky, Meyers and Wasko, University of Wisconsin–Extension, 1995) [4]. Potash now costs 41.5 cents a pound of K2O at retail [1]. The published analyses are old, but they are the ones the state guides still rest on.
Evidence: Four public sources bracket the composition. Georgia's table is the broadest. Wisconsin's covers 16 fly-ash and bottom-ash samples from the northern part of the state. Alberta's covers energy-system ash from forest-products plants. New Hampshire's describes ash generally and notes that commercial ash is somewhat less concentrated than wood-stove ash (Saunders, University of New Hampshire Extension, Jun 2018) [6].
| Constituent | Georgia, mean (range), 37 samples | Wisconsin, range, 16 samples | Alberta | New Hampshire |
|---|---|---|---|---|
| Calcium carbonate equivalent, % | 43 (22–92) | NI grade 40–49 to 80–89 | 55–65, up to 100 | 25–59 |
| Potassium, as K2O, % | 3.1 (0.1–15.7) | 1.3–4.6 | not given | about 6* |
| Phosphorus, as P2O5, % | 1.2 (0.2–3.2) | 1.1–2.3 | not given | about 4.6* |
| Magnesium, % | 1.0 (0.1–2.5) | 1.2–2.2 | not given | about 1 |
| Calcium, % | 15 (2.5–33) | 22–45 | not given | about 25 |
| Zinc, mg/kg | 233 (35–1,250) | 100–5,000* | not given | not given |
| Boron, mg/kg | 123 (14–290) | 0–210 | not given | not given |
| Solids, % of delivered weight | 75 (31–100) | not given | about 90 to 99 | not given |
Sources: Risse and Gaskin, University of Georgia Bulletin 1142, reviewed Mar 2013 [3]; Kopecky, Meyers and Wasko, University of Wisconsin–Extension A3635, 1995 [4]; Lickacz, Alberta Agriculture Agdex 534-2, Feb 2002 [5]; Saunders, University of New Hampshire Extension, Jun 2018 [6]. Basis: percent or mg/kg of ash; the Georgia bulletin does not state whether its concentrations are on a dry basis, and we treat them as dry. *Crop Root Zone conversion: elemental K × 1.205 and P × 2.291; Wisconsin zinc from the published 0.01–0.5%. Wisconsin's neutralizing index folds in fineness and is not a CCE.
Converted to pounds, a dry ton of the Georgia average holds 860 pounds of CCE, 63 pounds of K2O, 24 pounds of P2O5 and 20 pounds of magnesium. A ton as received, at 75% solids, holds 645, 47, 18 and 15. That is roughly a 0-1-2 fertilizer on a delivered basis, attached to a liming material a little more than half as strong as the ag lime Iowa State tested for the trials in TRZ-0257, which carried 1,124 pounds of effective material a ton [2].
Two points about availability matter for the pricing that follows. Potassium in ash behaves like fertilizer potassium. In greenhouse corn, uptake of K differed little between ash and fertilizer sources (Erich, Journal of Environmental Quality, 1991) [9], and in a laboratory study on ten acid soils about 55% of the ash's total potassium was in suspension within five minutes (Ohno, Journal of Environmental Quality, 1992) [10]. Phosphorus is weaker. Ash looked like fertilizer phosphate only when compared on a citrate-extractable basis, not on total P [9]. We read both papers as abstracts only.
On fineness, Alberta's guide does not apply a particle-size factor to ash at all, on the grounds that the particles are small and field tests showed them highly reactive once incorporated [5]. New York's lime law does apply one: wood ash sold as a liming material must carry at least 30% CCE and meet the same sieve standard as limestone, 80% through a 20-mesh screen and 30% through 100-mesh (New York Agriculture and Markets Law § 142-bb, accessed Oct 8, 2026) [15].
2. What a ton is worth at October prices
What's new: At this fall's prices the potash in an average ton of ash is worth slightly more than the lime. In Wisconsin's 1995 table the lime was worth three times the potash at the midpoint [4].
Evidence: The unit values are these. Ag lime: $30.58 a ton delivered and spread, the University of Missouri's March 2026 survey average, over 1,124 effective pounds, or 2.72 cents a pound, as worked out in TRZ-0257 [2]. Potash: $498 a ton of 0-0-60 at retail, or 41.5 cents a pound of K2O [1]. Phosphate: DAP at $926 a ton less its 360 pounds of nitrogen at anhydrous ammonia's 60 cents a pound, over 920 pounds of P2O5, or 77 cents a pound [1]. The DTN figures are for the week of September 21–25, the most recent survey we could find on October 8.
| Component of one ton, as received | Pounds | Unit value | $/ton of ash | |
|---|---|---|---|---|
| Lime (calcium carbonate equivalent) | 645 | 2.72¢/lb | 17.55* | █████████░ |
| Potash (K2O) | 47 | 41.5¢/lb | 19.50* | ██████████ |
| Lime plus potash | 37.04* | |||
| Phosphate (total P2O5, not all available) | 18 | 77¢/lb | 14.09* | ███████░░░ |
| All three, phosphate at full credit | 51.13* | |||
| Magnesium, zinc, boron, manganese | 15 lb Mg | not priced | 0.00 |
Source: Crop Root Zone calculation. Analysis: Georgia 37-sample mean at 75% solids [3]. Prices: DTN/Progressive Farmer retail averages, week of Sep 21–25, published Sep 30, 2026 [1]; ag lime per effective pound from TRZ-0257 [2]. Basis: dollars per short ton of ash as delivered, with lime valued delivered and spread and nutrients at retail before application. Ash is given full fineness credit, an assumption. Totals are summed before rounding. *Calculated. Bars scale dollars per ton; 19.50 = 10 blocks.
$37 a ton
Break-even delivered-and-spread price for average wood ash on ground that needs both lime and potash. On ground that needs only lime it is $17.55. (Crop Root Zone calculation from University of Georgia, reviewed Mar 2013; DTN/Progressive Farmer, Sep 30, 2026; TRZ-0257, Oct 5, 2026)
The average hides most of the story. Georgia's bulletin says most ashes fall between 25% and 60% CCE [3], and Wisconsin's potash range is 26 to 92 pounds a ton [4]. A weak, wet ash at 25% CCE, 26 pounds of K2O and 75% solids is worth $18.29 a ton for lime and potash together, by our calculation. A strong, dry one at 60% CCE, 92 pounds and 90% solids is worth $63.74. Both scenarios are ours, assembled from the ends of the published ranges, and no single sample in those tables is known to match either.
The lime value also moves with the local lime price. Each $10 a ton on delivered-and-spread ag lime of the Iowa-tested quality adds $5.74 to the lime value of a ton of average ash, by our calculation. That is why the Wisconsin authors pointed at the north of their state, which has no limestone deposits [4].
A per-acre example makes the trade concrete. Suppose a soil test calls for 2,000 pounds of effective calcium carbonate an acre. That is 1.78 tons of the ag lime above, or $54.41 delivered and spread. It is 3.10 tons of average ash as received. That ash also puts down 146 pounds of K2O, 56 pounds of total P2O5, 47 pounds of magnesium, about 1.1 pounds of zinc and 0.6 pound of boron an acre, by our calculation from the Georgia means [3]. The potash alone would cost $60.45 at retail [1].
Ground Truth: The one market price we found says buyers have been paying for the lime and getting the potash free. In Aroostook County, Maine, ash delivered to more than 60 farms was reported to cost less than half as much as commercial lime, which starts around $35 a ton (Bangor Daily News, Mar 26, 2019) [8]. Half of $35 is $17.50. Our lime-only value for an average ton is $17.55. That is a coincidence of two rough numbers seven years apart, but the logic behind it holds: ash is sold against lime, and the potash rides along unpriced. The grower who captures the second $19.50 is the one whose soil test is low in potassium and low in pH on the same field. On a field already high in potassium, ash is a damp, half-strength lime, and should be bought only at a half-strength lime price.
3. The haul: where it stops paying
What's new: We found no 2026 published rate for hauling ash. The nearest public proxy is Iowa's custom-rate survey for hauling grain by truck, which gives three distances and so separates the fixed cost of a load from the cost of a mile (Iowa State University Extension, Mar 2026) [7].
Evidence: Iowa respondents reported 13.5 cents a bushel for a 5-mile haul, 20 cents for 25 miles and 40.5 cents for 100 miles, one way [7]. On 56-pound corn that is $4.82, $7.14 and $14.46 a ton. Between 25 and 100 miles the rate rises 9.8 cents a ton-mile on top of about $4.70 a ton for loading, unloading and waiting. Spreading lime averaged $8.30 a ton in the same survey, and loading and spreading solid manure $7.20 a ton on seven responses [7]. The table charges ash the lime-spreading rate and assumes the ash itself is free at the plant.
| One-way haul, miles | Haul, $/ton | Haul plus spreading, $/ton | Margin on lime value alone, $/ton | Margin on lime plus potash, $/ton |
|---|---|---|---|---|
| 5 | 4.82 | 13.12 | +4.43* | +23.92* |
| 25 | 7.14 | 15.44 | +2.11* | +21.60* |
| 47 | 9.25* | 17.55* | 0.00* | +19.49* |
| 50 | 9.58* | 17.88* | −0.33* | +19.16* |
| 100 | 14.46 | 22.76 | −5.21* | +14.28* |
Source: Crop Root Zone calculation from the 2026 Iowa Farm Custom Rate Survey [7], with ash values from Section 2. Basis: dollars per short ton of ash as received; grain-truck rates converted at 56 lb a bushel; spreading at $8.30 a ton; ash free at the plant. *Calculated or interpolated; the 47- and 50-mile haul rates are straight-line interpolations between the surveyed 25- and 100-mile rates.
Free ash valued only as lime breaks even at about 47 miles. Valued as lime plus potash it is still $14.28 a ton ahead at 100 miles, the limit of the survey. Extending the same line puts the break-even near 245 miles, which is an extrapolation well outside the data and should be read as farther than anyone will truck it. If the plant or a broker charges $10 a ton at the gate, ash never pays as lime alone at any distance, and the lime-plus-potash break-even falls to about 144 miles on the same extrapolation.
For the 2,000-pound example, free ash hauled 25 miles and spread costs about $48 an acre, against $54 for ag lime alone and about $115 for the lime plus the potash it displaces, before the potash is spread.
Three things make those distances optimistic. Georgia's bulletin notes that most ash is low in density, so a truck may fill before it reaches its weight limit, and we found no public bulk-density figure to price that [3]. Moisture is freight paid on water: at Georgia's low end of 31% solids, a ton of 43% ash delivers 267 pounds of CCE, not 645, by our calculation. And Wisconsin's bulletin says fresh ash is too dusty to spread until water is added, while Georgia's says too much water makes it cake [3][4]. Georgia lists transportation cost, low analysis and handling as the three main constraints on land application [3].
4. Four limits on the rate
What's new: The rate is set by whichever limit binds first: the lime requirement, the potassium and salt load, the metals, or the state's paperwork. On most fields it is the lime requirement, and the uncertainty in that number is large.
Evidence:
Variability and pH overshoot. Georgia's rule is to divide the recommended lime rate by the ash's CCE [3]. Alberta's adds moisture: divide again by the dry fraction [5]. The 37 Georgia samples ran from 22% to 92% CCE [3]. Alberta attributes the spread to how completely the fuel burns and says ash from uncontrolled burners varies widely [5]. A rate set on the average analysis and spread from a different load misses badly in either direction.
| CCE of the load actually spread | Effective CaCO3 from 3.10 tons/acre, lb | Share of the 2,000-lb target |
|---|---|---|
| 22% | 1,023* | 51% |
| 25% | 1,163* | 58% |
| 43% | 2,000* | 100% |
| 60% | 2,791* | 140% |
| 92% | 4,279* | 214% |
Source: Crop Root Zone calculation from the CCE range in University of Georgia Bulletin 1142 [3]. Basis: 3.10 tons an acre of ash as received at 75% solids, the rate that meets a 2,000-lb requirement at the 43% mean. *Calculated.
Ash also moves pH faster than limestone. Alberta's field trials showed pH changing faster with ash than with limestone [5], and New Hampshire's guide gives limestone six months to a year to take full effect [6]. Speed is an advantage ahead of alfalfa and a hazard when the load is stronger than the certificate. Lime cannot be taken back, and on some soils overshoot buys a recurring micronutrient bill, as an earlier Crop Root Zone piece on lakebed soils laid out (TRZ-0134) [16].
Potassium and salt. Wisconsin's table shows a 10-ton rate applying 260 to 910 pounds of K2O an acre [4]. Its field plots took ash at up to 20 tons an acre with no harm noted [4], and a later summary by two of the same authors reported that biomass yields generally rose with ash rates up to 20 tons an acre and fell above that (Kopecky and Meyers, 2009, abstract as indexed) [12]. That is a ceiling for crop injury, not an agronomic rate. At a lime-requirement rate near 3 tons, average ash supplies about 146 pounds of K2O. At 10 tons it supplies far more than a soil test calls for, and on hay ground fed to dry cows surplus potassium in the forage is a ration problem, a standard dairy caution that we did not re-source for this piece. The salt shows up at planting. New Hampshire warns against applying ash to germinating seeds because its salt content can hurt germination [6]. Georgia says not to apply immediately before planting or during emergence, and to keep pesticide applications three to five days away because ash can absorb them [3]. Ash should not be mixed with urea, ammonium sulfate or ammonium nitrate, which release ammonia in contact with high-pH material [6].
Metals. Clean wood ash is low in regulated metals, with two exceptions worth checking on any certificate. The table sets Georgia's analyses against New Hampshire's quality limits for certified ash (New Hampshire Env-Sw 1700, accessed Oct 8, 2026) [13].
| Metal | Georgia mean, mg/kg | Georgia maximum, mg/kg | New Hampshire limit, mg/kg | Maximum as % of limit |
|---|---|---|---|---|
| Arsenic | 6 | 10 | 41 | 24* |
| Cadmium | 3 | 26 | 39 | 67* |
| Chromium | 57 | 386 | 1,200 | 32* |
| Copper | 70 | 207 | 1,500 | 14* |
| Lead | 65 | 137 | 300 | 46* |
| Mercury | 1.9 | 5 | 17 | 29* |
| Molybdenum | 19 | 123 | 75 | 164* |
| Nickel | 20 | 63 | 420 | 15* |
| Selenium | 0.9 | 11 | 100 | 11* |
| Zinc | 233 | 1,250 | 2,800 | 45* |
Sources: University of Georgia Bulletin 1142, 37 samples from studies published 1986–1995 [3]; New Hampshire Code of Administrative Rules, Env-Sw 1700, dry-weight limits [13]. Basis: mg/kg of ash. *Crop Root Zone calculation.
Every mean is about a quarter of the limit or less. One maximum, molybdenum, is over it, and cadmium's reaches two-thirds. Wisconsin's 16 samples ran to 22 ppm cadmium, and the bulletin calculates that a ton of ash an acre applies less than 1% of that state's cumulative loading limit for the regulated metals [4]. New Hampshire's guide states the practical rule: never use ash from garbage, pressure-treated or painted wood [6].
Permits. The rules differ by state. None we read puts much on the grower, but the ash needs a paper trail.
| Jurisdiction | Status of wood ash | What is required |
|---|---|---|
| New Hampshire | Certified under Env-Sw 1700 | Certification for anyone generating or distributing more than 500 tons a year; metals limits; testing at least quarterly; soil-test-supported rates; records kept three years |
| Maine | Exempt from the residuals chapter | Generator files written documentation that the ash substitutes for a commercial agricultural product, used at similar agronomic rates |
| New York | Regulated as a liming material | Minimum 30% CCE; limestone sieve standard; registration, license, label and weigh slip |
| Georgia | Exempt from the fertilizer act; does not meet the lime regulation | Recommended procedure, voluntary: soil test, supplier records, landowner release form; 50-foot setback from water, 100 feet on erodible ground |
| Wisconsin | Solid waste, with a landspreading exemption | Written approval from the Department of Natural Resources under NR 518.04(5); ash and soil tests; setbacks set in the permit |
| Alberta | Annual authorization to forestry facilities | 50-metre setback from wells and water; no application on frozen soil; incorporate within three days |
Sources: New Hampshire Env-Sw 1700 [13]; Maine Department of Environmental Protection, Chapter 419, Section 1(B)(3), last revised Apr 12, 2015 [14]; New York Agriculture and Markets Law § 142-bb [15]; University of Georgia Bulletin 1142 [3]; University of Wisconsin–Extension A3635 [4]; Alberta Agriculture Agdex 534-2 [5]. The Georgia, Wisconsin and Alberta rows are as described in extension bulletins dated 2013, 1995 and 2002; we did not check the current code in those jurisdictions.
Ground Truth: The variability table is the reason to buy ash by the effective pound and not by the ton or the load. Ask for the CCE and the moisture of the lot being delivered, not the plant's annual average, and set the rate on the product of the two. An ash at 60% CCE and 90% solids carries 1,080 effective pounds a ton, nearly as much as quarry lime. One at 25% and 75% carries 375. The same truck, the same freight bill and the same spreader setting deliver either one. A grower who pays $15 a ton spread for the first is buying lime at 1.4 cents a pound. The same $15 for the second is 4.0 cents, half again the price of ag lime, before any potash credit.
5. The field-trial record
What's new: We found no replicated field trial in the United States that compares wood ash with ag lime on corn or soybeans at equal effective rates. The record is forage, small grains and canola, most of it from Wisconsin and Alberta, most of it more than twenty years old.
Evidence:
| Study | Design | Result |
|---|---|---|
| Wisconsin, Price County, reported 1995 | Alfalfa field plots; ash at 2.5 to 20 tons/acre against commercial lime and fertilizer at soil-test rates | Yields comparable; no statistically significant differences; no harm at 20 tons |
| Wisconsin, River Falls, reported 1995 | Greenhouse alfalfa and barley; ash at 5 to 20 tons/acre against lime and fertilizer | Ash yields significantly greater |
| Alberta, central, 1999–2000 | Mixed forage, seven harvests; check, lime, ash, lime plus annual phosphate; preliminary | 3,238, 4,652, 5,965 and 5,009 kg/ha |
| Alberta, three-year field study, published 2004 | Barley and canola on acid soils; ash at 6, 12.5 and 25 t/ha | Barley dry matter +72%, grain +50%; canola seed +124% at the two higher rates with nitrogen |
| Wisconsin and Minnesota summary, 2009 | Review of greenhouse and field forage work | Yields rose with ash to 20 tons/acre, fell above it; usually above the limed and fertilized control |
| Maine, greenhouse, 1991 | Corn uptake of P and K from ash against fertilizer | K equal to fertilizer; P lower on a total basis |
Sources: Kopecky, Meyers and Wasko, 1995 [4]; Lickacz, 2002 [5]; Patterson et al., Agronomy Journal, 2004 [11]; Kopecky and Meyers, 2009 [12]; Erich, 1991 [9]. The 2004, 2009 and 1991 rows are from abstracts. The 2004 abstract does not state the comparator for its percentage gains; we take it to be the unamended control. The 2009 repository page could not be opened on Oct 8, 2026.
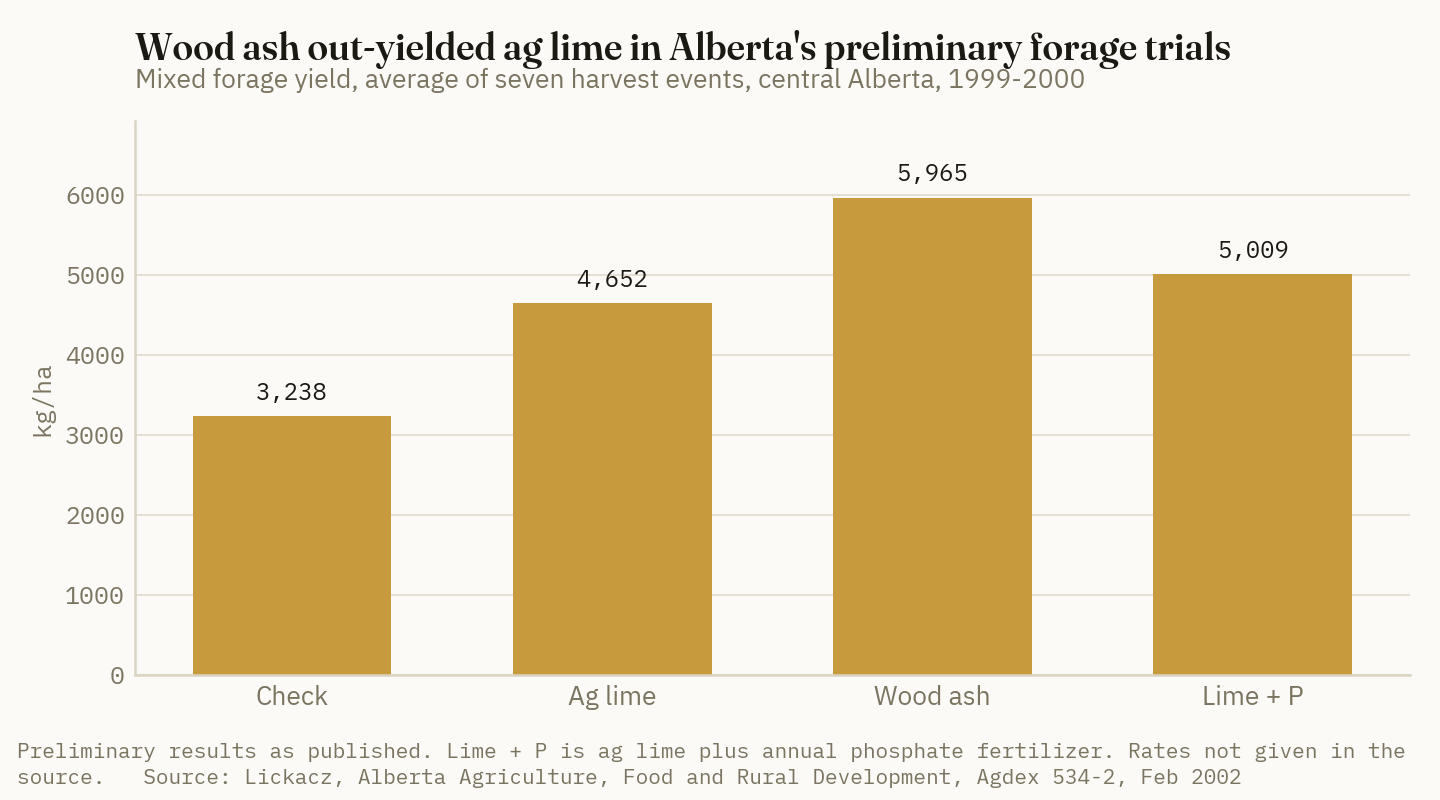
The Alberta comparison is the only one here that separates the lime effect from a nutrient effect. Ash beat lime by 28% and beat lime plus annual phosphate by 19%, by our calculation from the published bars [5]. The author attributes the margin to phosphorus being more available than expected and to the faster pH change. Potassium and sulfur, which the same guide says ash supplies, were not separated out. The trial was labelled preliminary in 2002, and the guide says plainly that no study had yet shown how long the liming benefit of ash lasts [5].
Georgia's bulletin summarizes the wider literature in one sentence that should be read with care: ash has a liming effect of 8% to 90% of lime's total neutralizing power and can raise plant growth by up to 45% over limestone [3]. The first half of that sentence is the variability problem again. The second half is an upper bound, and the bulletin does not say whether the limestone plots in those studies received potassium and phosphorus to match.
The guides also disagree on perennial forage. Alberta's does not recommend ash on established stands because it cannot be incorporated [5]. Wisconsin's and New Hampshire's treat topdressing with a manure or lime spreader as normal practice [4][6]. The Wisconsin alfalfa result supports the second view. We would not treat the Alberta caution as settled.
Ground Truth: The yield record supports a narrow claim: where the comparison was matched, as in Wisconsin's alfalfa plots, ash did about what lime plus fertilizer did, and where ash won, it won against plots short of the nutrients it carries. That is the comparison the value table in Section 2 already assumes. So the trials do not add a yield premium on top of the $37. They are consistent with it. The risk the trials cannot price is supply. Two biomass plants that sent 30,000 tons a year to Aroostook County farms closed within a year of each other [8]. Ash is a correction to make when a boiler is running within reach. It is not a fertility program to plan a rotation around.
References
- Quinn, R., "DTN Retail Fertilizer Trends," DTN/Progressive Farmer, Sep 30, 2026 (week of Sep 21–25, 2026: potash $498/ton, DAP $926, anhydrous $977, anhydrous $0.60 per lb N) — https://www.dtnpf.com/agriculture/web/ag/news/article/2026/09/30/anhydrous-leads-fertilizer-prices-25
- Crop Root Zone, TRZ-0257, "Ag Lime Costs 2.7 Cents a Pound of Effective Neutralizing Material, Delivered and Spread. Pelletized Lime Costs 11 to 21. In Six Iowa Trials, 200 Pounds an Acre Moved pH by a Tenth," Oct 5, 2026 (ag lime $30.58 a ton delivered and spread from University of Missouri Extension G302, Mar 2026; 1,124 lb ECCE per ton from Mallarino and Haq, Iowa State University, 2017).
- Risse, M.; updated by Gaskin, J., "Best Management Practices for Wood Ash as Agricultural Soil Amendment," University of Georgia Cooperative Extension Bulletin 1142, updated 2002, reviewed Mar 2013 — https://fieldreport.caes.uga.edu/publications/B1142/best-management-practices-for-wood-ash-as-agricultural-soil-amendment/
- Kopecky, M.J.; Meyers, N.L.; Wasko, W., "Using Industrial Wood Ash as a Soil Amendment," University of Wisconsin–Extension A3635, 1995 — https://corn.aae.wisc.edu/Management/pdfs/a3635.pdf
- Lickacz, J., "Wood Ash – An Alternative Liming Material for Agricultural Soils," Alberta Agriculture, Food and Rural Development, Agdex 534-2, Feb 2002 — https://www1.agriculture.alberta.ca/$department/deptdocs.nsf/all/agdex3435/$file/534-2.pdf
- Saunders, O., "Guide to Using Wood Ash as an Agricultural Soil Amendment," University of New Hampshire Cooperative Extension, created May 2014, updated Jun 2018 — https://extension.unh.edu/resources/files/Resource004042_Rep5718.pdf
- Johanns, A.; Hart, C., "2026 Iowa Farm Custom Rate Survey," Iowa State University Extension and Outreach, Ag Decision Maker File A3-10, FM 1698, revised Mar 2026 (hauling grain to market by truck, one way: $0.135/bu at 5 miles, $0.200 at 25 miles, $0.405 at 100 miles; spreading lime $8.30/ton; loading and spreading solid manure $7.20/ton) — https://www.extension.iastate.edu/agdm/crops/pdf/a3-10.pdf
- Brino, A., "ReEnergy closures to impact some area farms," Bangor Daily News, Mar 26, 2019 — https://www.bangordailynews.com/2019/03/26/news/reenergy-closures-to-impact-some-area-farms/
- Erich, M.S., "Agronomic Effectiveness of Wood Ash as a Source of Phosphorus and Potassium," Journal of Environmental Quality 20(3):576–581, 1991 (abstract) — https://doi.org/10.2134/jeq1991.00472425002000030012x
- Ohno, T., "Neutralization of Soil Acidity and Release of Phosphorus and Potassium by Wood Ash," Journal of Environmental Quality 21(3):433–438, 1992 (abstract) — https://doi.org/10.2134/jeq1992.00472425002100030022x
- Patterson, S.J.; Acharya, S.N.; Thomas, J.E.; Bertschi, A.B.; Rothwell, R.L., "Barley Biomass and Grain Yield and Canola Seed Yield Response to Land Application of Wood Ash," Agronomy Journal 96(4):971–977, 2004 (abstract) — https://doi.org/10.2134/agronj2004.0971
- Kopecky, M.J.; Meyers, N.L., "Wood ash from bioenergy systems as a soil amendment for crop production," 11th North American Agroforestry Conference, Columbia, Missouri, 2009 (abstract as indexed; the repository page refused the connection on Oct 8, 2026) — https://hdl.handle.net/10355/84708
- New Hampshire Code of Administrative Rules, Chapter Env-Sw 1700, "Requirements for Land Application of Wood Ash," accessed Oct 8, 2026 — https://gc.nh.gov/rules/state_agencies/env-sw1700.html
- Maine Department of Environmental Protection, 06-096 CMR Chapter 419, "Agronomic Utilization of Residuals," Section 1(B)(3), last revised Apr 12, 2015 — https://www.maine.gov/sos/sites/maine.gov.sos/files/content/assets/096c419.doc
- New York Agriculture and Markets Law, Article 9-A, § 142-bb, accessed Oct 8, 2026 — https://www.nysenate.gov/legislation/laws/AGM/142-BB
- Crop Root Zone, TRZ-0134, "Lime Costs $30 a Ton and Is Nearly Impossible to Take Back. On Lakebed Soils It Buys You an Annual Manganese Bill," Aug 27, 2026.
Disclosures
Crop Root Zone is an independent publication. Nothing here is investment advice. Market calls, where included, reflect the editors' own read and are not a recommendation to buy or sell any security.
A Molybdenum Seed Treatment Needs a Sixth of a Bushel of 2027 Soybeans. Liming the Same Acre to pH 6.0 Needs 5.3. Alabama Found a Molybdenum Response on One Soil in Eight.
Sodium molybdate at Arkansas's seed-treatment rate costs 36 cents to $5.77 an acre at two public prices, against $33 to $67 for ag lime. Trials put the response below pH 5.8 and find none on limed ground. On a one-year lease it postpones lime; it never replaces it.
The cheapest line a soybean grower can add to a 2027 seed order is a fraction of an ounce of molybdenum. Soybean nodules need it to fix nitrogen, and it is the only micronutrient whose availability rises with soil pH; molybdate solubility increases roughly a hundredfold for each pH unit (The Fertilizer Institute, Jan 2024) [16]. Arkansas recommends 0.2 to 0.4 ounces of molybdenum an acre on the seed (University of Arkansas, Feb 2013) [1]. At the two public sodium molybdate prices we found, that rate costs 36 cents to $5.77 an acre [17][18]. November 2027 soybeans last settled at $12.53½ (West Plains LLC, Oct 6, 2026) [20], so the treatment needs between 0.03 and 0.46 bushels to pay. Liming the same acre to pH 6.0 costs about $67 and needs 5.3 bushels, on the figures in our October 5 piece on lime costs [22]. The price gap is not in dispute. The question is what the ounce buys, and the public trial record answers it narrowly: a real response on unlimed ground below about pH 5.8, nothing once lime has gone on, and no effect on the other things acid soil does to a soybean crop.
1. What the states recommend, and how old the basis is
What's new: Nothing in the science is new, and that is the point. Every southern soybean state still carries a molybdenum recommendation, each with a different pH trigger. The field trials behind them were mostly run between 1960 and 1977.
Evidence: The triggers run from pH 5.5 to 6.5 depending on the state and the soil.
| State | Soil pH trigger | Seed-treatment rate | Position on lime |
|---|---|---|---|
| Arkansas | Below 5.8 on sandy and silt loam soils when lime cannot be applied | 0.2–0.4 oz Mo/acre | Seed treatment is not to replace a liming program |
| Mississippi | 5.5 or below on Delta soils (below 6.2 on Delta sandy and silt loams in P3777); elsewhere all soils but the high-pH Blackland Prairie | ½ oz sodium molybdate per bushel of seed | Not a substitute; below 5.5 apply both |
| Tennessee | 6.5 or below | 0.2 oz Mo (½ oz sodium molybdate) per bushel of seed | Lime may be omitted above water pH 5.6 if seed is treated |
| Kentucky | Below 6.2 at seeding | 1–2 oz sodium molybdate/acre (0.4–0.8 oz Mo) | Liming to 6.2 removes the need |
| Alabama | Well below 6.0 where lime is not applied | 1 oz sodium or ammonium molybdate per bushel of seed | Lime recommended below 5.8, or 5.5 on clays |
| Georgia | None stated | Recommended as a seed treatment; no rate stated | Lime to 6.0–6.5, at least three months ahead |
| North Carolina | None stated; highly acid soils | None stated | Liming usually corrects it |
| Missouri | None; no molybdenum recommendation in the soybean guide | — | Hold salt pH at 5.5 (water pH 6.0) or above |
Sources: University of Arkansas, MP197 ch. 5, updated Feb 2013 [1]; Mississippi State University Extension, P3777 and Information Sheet 1038 [2][3]; University of Tennessee, accessed Oct 6, 2026 [4]; University of Kentucky, AGR-1, 2020–2021 [5]; Auburn University, Bulletin 452, Dec 1973 [6]; University of Georgia [7][26]; NC State Extension, Jul 2025 and Oct 2025 [8][9]; University of Missouri Extension, G4410, reviewed Sep 2017 [24]. Rates are as published; states express them per acre or per bushel of seed.
The dates matter. Kentucky's recommendation was first issued in 1969 at the same 0.4 to 0.8 ounces and the same pH 6.2 it carries today (Sims, Thompson and Phillips, University of Kentucky, 1969) [25]. The molybdenum trials cited in the Arkansas handbook are from 1964 and 1966 [1]. Alabama's guidance is a 1973 bulletin [6]. Georgia's field work dates to 1960–1962 [13]. We found no public, replicated molybdenum seed-treatment trial on soybeans in the United States from the last 25 years. Tennessee is the only state we found that writes the substitution down as a rule: above water pH 5.6, the lime recommendation may be skipped if the seed is treated [4].
Ground Truth: A recommendation that has not changed since 1969 is either settled or unexamined, and here it is some of both. The chemistry is settled. What has not been re-tested is the size of the response in a 60-bushel crop, with modern varieties and seed that may already carry molybdenum in its fungicide treatment, as Arkansas notes some do [1]. A grower should read the state trigger as a statement about risk, not as a measured 2026 yield response. At these costs that is an acceptable basis for a decision, as long as nobody quotes a bushel figure with it.
2. What the trials measured, and how often it was nothing
What's new: Read together, the public trials say the response is real, large where it occurs, and confined to a small share of acid sites. They also say lime erases it.
Evidence:
| Trial | Soil and pH | Molybdenum treatment | Result |
|---|---|---|---|
| Parker and Harris, 1962 | Not stated in the summary we read | Mo on unlimed soil vs. lime alone | Lime alone gave the same yield as molybdenum on unlimed soil |
| Georgia, 1969 | Moderately acid shaly soils | Seed treatment vs. foliar sprays at several timings | Significant yield response; seed treatment equal to early and pre-bloom sprays, better than later sprays |
| Iowa, 1968 | Several soils, pH 5.8–6.7; one calcareous | 1.3 oz Mo/acre on seed | +4 to 5 bu/acre at two sites; none on other soils in the same pH range; −3.4 bu/acre on the calcareous soil |
| Alabama, 1964–72 | Eight locations, clay to sandy loam, pH 4.9–5.9 | Seed treatment | Response on one soil, a clay at pH 4.9; liming that soil removed it |
| Tennessee, 1975–76 | Collins silt loam, unlimed | Slurry seed treatment, 0.1–0.5 oz Mo/acre | Every rate out-yielded the check in both years |
| Tennessee, 1977 | Loring silt loam limed to pH 5.2, 5.9 and 6.5 | Soil-applied, 2.9 and 11.4 oz Mo/acre | No molybdenum effect; all lime rates raised yield of one variety |
| Indiana, about 1960 | Four field locations; eight acid soils in the greenhouse | Foliar in the field; treated seed in the greenhouse | Plants took up molybdenum; no yield increase in either |
| Minnesota, 2011–13 | Twelve locations; pH not stated in the summary | 0.5 lb Mo/acre broadcast, in a nutrient-omission design | No positive effect at any location |
Sources: Parker and Harris, 1962, as summarized by The Fertilizer Institute [16]; Boswell and Anderson, 1969 (abstract) [11]; deMooy, 1970 (abstract) [10]; Rogers, Adams and Thurlow, 1973 [6]; Seaton, 1979 (thesis abstract) [12]; Lavy, Sands and Barber, 1960 [14]; Mallarino et al., 2015 [15]. Metric rates and yields converted by Crop Root Zone at 60 lb per bushel. The Tennessee abstract gives no yields in bushels.
Where the sources count their sites, the share that responded is small.
| Trial set | Sites or years with a yield response | Share | |
|---|---|---|---|
| Tennessee, unlimed Collins silt loam, 1975–76 | 2 of 2 years | 100% | ██████████ |
| Alabama, eight locations, 1964–72 | 1 of 8 | 13% | █░░░░░░░░░ |
| Indiana, four field locations, about 1960 | 0 of 4 | 0% | ░░░░░░░░░░ |
| Minnesota, twelve locations, 2011–13 | 0 of 12 | 0% | ░░░░░░░░░░ |
Source: Crop Root Zone tally from Seaton, 1979 [12]; Rogers, Adams and Thurlow, 1973 [6]; Lavy, Sands and Barber, 1960 [14]; Mallarino et al., 2015 [15]. The Tennessee row is one soil in two years, not two sites. Iowa's 1968 work is omitted because the abstract does not give the number of non-responsive sites [10].
1 soil in 8
Alabama locations, pH 4.9 to 5.9, where a molybdenum seed treatment raised soybean yield in 1964–72. It was a clay at pH 4.9, and lime removed the response. (Rogers, Adams and Thurlow, Auburn University, Dec 1973)
The Midwest record points the same way. A five-university review states that Iowa research from the 1960s to the 1990s found soybean response to molybdenum only "in extremely acidic soils which should have been limed" (Mallarino et al., 2015) [15]. Arkansas reports the mirror image on its own ground: on some clayey soils below pH 5.8, molybdenum did nearly as well as lime alone or lime plus molybdenum [1]. Tennessee extension staff were testing it for the same reason in 1964, when 60% of West Tennessee soil samples tested between pH 5.0 and 6.0 and growers would not lime rented soybean ground (McCutchen, University of Tennessee, 1965) [13].
One Georgia finding explains some of the inconsistency. Seed grown on limed soil with foliar molybdenum carried enough of the element to supply the next crop and raise yield on deficient soil, with little carried into the generation after that (Gurley and Giddens, 1969) [27]. Planting seed is rarely grown on the acid field it is planted into. Some of the non-responses may be seed that arrived already supplied.
3. The price, in 2027 bushels
What's new: We found no public dealer price for a commercial hopper-box or plant-applied molybdenum treatment. Two public prices bracket the raw material: a U.S. industrial contract price and a one-pound retail pack.
Evidence: U.S. sodium molybdate averaged about $24,458 to $25,325 a metric ton, CFR, in the first quarter of 2024 (Procurement Resource, 2024) [18]. That is $11.09 to $11.49 a pound. A one-pound retail pack of 39% molybdenum sodium molybdate lists at $89.99 (Greenway Biotech, Oct 6, 2026) [17]. A farm buying a 25-pound agricultural package, the size on one manufacturer's label [19], pays something between the two. Our working figure for a commercial seed-applied product is $2 an acre. It is an estimate.
| Treatment | Basis | $/acre | Break-even, bu/acre |
|---|---|---|---|
| Molybdenum, Arkansas rate, 0.2–0.4 oz Mo | 0.51–1.03 oz sodium molybdate at the industrial price | 0.36–0.74 | 0.03–0.06 |
| Molybdenum, Arkansas rate | Same, from a one-pound retail pack | 2.88–5.77 | 0.23–0.46 |
| Molybdenum, Kentucky rate, 1–2 oz sodium molybdate | Industrial price | 0.69–1.44 | 0.06–0.11 |
| Molybdenum, Kentucky rate | One-pound retail pack | 5.62–11.25 | 0.45–0.90 |
| Molybdenum, commercial seed-applied product | Crop Root Zone estimate | 2.00* | 0.16* |
| Base rhizobia inoculant | Nebraska 2026 budget | 2.50 | 0.20 |
| Ag lime, 1 ton CCE (1.09 tons of product) | Missouri average, delivered and spread | 33 | 2.6 |
| Ag lime to pH 6.0–6.1 from about 5.4 (2.19 tons) | Missouri average, delivered and spread | 67 | 5.3 |
Source: Crop Root Zone calculation. Sodium molybdate at 39% Mo [16][19]; prices from Procurement Resource, Q1 2024 [18], and Greenway Biotech, accessed Oct 6, 2026 [17]; rates from University of Arkansas [1] and University of Kentucky [5]. Inoculant cost from "A $2.50 Soybean Inoculant Needs a Fifth of a Bushel to Pay," Crop Root Zone, Sep 23, 2026 [23]. Lime costs from "Ag Lime Costs 2.7 Cents a Pound of Effective Neutralizing Material," Crop Root Zone, Oct 5, 2026 [22], which used Missouri's surveyed $30.58 a ton and Iowa State's trial rates. Break-even at $12.535 a bushel, the November 2027 prior settle, before basis [20]. *Estimate; no public quote obtained. The industrial price is 30 months old and is a chemical contract price, not a farm price.
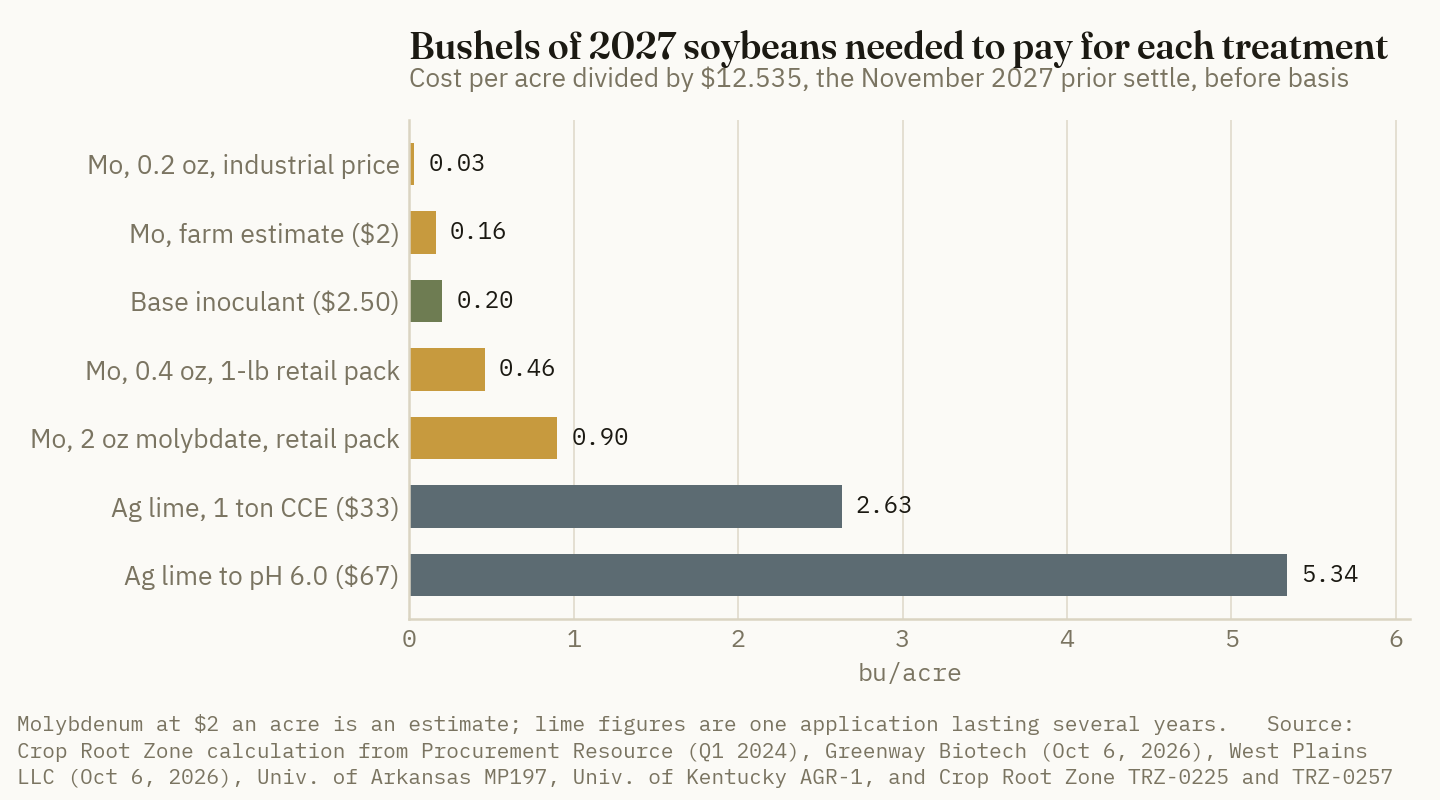
The ratio is old. In 1965 Tennessee put molybdenum at 35 to 75 cents an acre and limestone at $10 to $20 [13]. Lime cost 13 to 57 times as much then. At $2 against $33 to $67 it costs 17 to 34 times as much now, by our arithmetic.
Ground Truth: The break-even comparison flatters molybdenum, because it compares cost and ignores what each one returns. Auburn's 1973 bulletin called 8 bushels an acre a conservative first-year gain from liming soils at pH 5.0 to 5.4, and said the benefit lasts about three years [6]. Re-priced by us, 8 bushels is $100 an acre at the 2027 settle against $61 for two tons of lime at Missouri's average. Lime on a truly acid soybean field pays in its first crop on a 53-year-old response estimate. Molybdenum does not compete with lime on return. It competes on who writes the check and when the effect arrives.
4. What the ounce does not do
What's new: Four limits appear in the same publications that recommend the treatment.
Evidence:
It corrects one of three acid-soil problems. Kentucky's guide names all three in one sentence: holding pH at 6.2 or above keeps aluminum toxicity, manganese toxicity and molybdenum deficiency from occurring [5]. Mississippi State puts aluminum and manganese into toxic range below pH 5, with manganese toxicity and molybdenum deficiency overlapping at 5.0 to 5.5 [3]. Alabama identified manganese toxicity on a sandy loam at pH 4.9 in 1970 [6]. In Tennessee's 1977 trial only lime changed leaf and soil manganese; molybdenum up to 11 ounces an acre changed nothing [12].
It can kill the inoculant. Kentucky warns that rhizobia numbers fall quickly when inoculant is dry-packaged with sodium molybdate, and that mixing the two can seriously reduce live bacteria if the seed is not planted at once. Where a field needs both, the state's instruction is inoculant on the seed and one pound of sodium molybdate broadcast in 20 to 40 gallons of water [5]. An Australian study on lucerne and clover, not soybeans, found sodium molybdate cut rhizobia survival as storage lengthened, while ammonium molybdate and molybdic acid did not (Gault and Brockwell, 1980) [21]. North Carolina's guide says the opposite of Kentucky in one line: with an inoculant, apply molybdenum with the seed treatment [8]. The two can be reconciled only by timing and by source. That matters most on the fields our September inoculant piece singled out, ground new to soybeans [23], which is often the same unlimed, acid ground.
It can make forage unsafe. A sodium molybdate label carries the standard warning that molybdenum fertilizers may produce forage toxic to ruminants [19]. The mechanism is suppressed copper availability in cattle and sheep [16]. Kentucky caps forage legumes at two pounds of sodium molybdate an acre in five years [5]. A seed treatment is 1 to 2 ounces. Our read is that the risk sits with the broadcast pound, on fields that are grazed, hayed or rotated to forage legumes, and not with a seed treatment on soybeans cut for grain.
It can cost yield where it is not needed. Iowa's 1968 work measured a loss of 226 kilograms a hectare, about 3.4 bushels an acre, on a calcareous soil [10].
Lime has a lag that molybdenum does not. Released molybdenum may take weeks or months to appear after liming [16], and Georgia wants lime on at least three months before planting [26]. Arkansas accordingly allows the seed treatment where lime went on within the last year or where pH varies widely across a field [1].
5. A rule by pH band and tenure
What's new: The state triggers, the trial record and the lime economics combine into a rule. It is ours, built from the sources above.
Evidence:
| Water pH, top 6 inches | Owned or long lease | One-year lease |
|---|---|---|
| 6.2 and above | Nothing. No trial here shows a gain, and one calcareous site lost yield | Nothing |
| 5.8 to 6.2 | Optional. A $2 hedge that Kentucky and Tennessee recommend and that the trials mostly cannot find. Lime on the normal cycle | Optional, same hedge. No lime |
| 5.6 to 5.8 | Lime this fall. Add molybdenum for 2027 if lime goes on in spring or the field is variable | Treat the seed and skip lime. This is Tennessee's written rule |
| 5.2 to 5.6 | Lime and molybdenum both, as Mississippi State advises below 5.5 | Treat the seed, and price a one-ton lime rate anyway. At about $33 it needs 2.6 bushels |
| Below 5.2 | Lime first. Molybdenum does nothing for aluminum or manganese | Ask the landlord to share lime, or plant something else there |
Source: Crop Root Zone decision rule, drawing on state thresholds [1][2][4][5][6] and lime costs from our Oct 5, 2026 article [22]. Thresholds are in water pH; Missouri reports salt pH, about 0.5 lower [24]. The 5.2 line is our judgment from the Mississippi State and Alabama descriptions of toxicity near pH 5 [3][6]. No state publishes it.
On new soybean ground in any band below 6.2, keep sodium molybdate out of the inoculant slurry unless the seed is planted the same day, or use Kentucky's broadcast route [5].
Ground Truth: Molybdenum's cheapness is what makes it risky on rented acid ground. A seed treatment that greens up the crop removes the visible symptom that would have started the conversation about lime, and the field goes on acidifying while nobody is looking at it. A tenant with a one-year lease has every reason to treat the seed above pH 5.6 and stop there. A landlord should want the soil test in the lease file for the same reason. Below 5.6, the cheapest fix and the right one have parted company. Our October 5 piece found that a one-ton lime rate paid in the first corn crop at the responsive sites in Iowa's trials [22]. The ounce of molybdenum goes on the seed, and the lime bill is settled between tenant and landlord.
References
- Slaton, N.; Roberts, T.; Ross, J., "Fertilization and Liming Practices," Arkansas Soybean Production Handbook, MP197, chapter 5, University of Arkansas Division of Agriculture, updated Feb 2013 (molybdenum trials cited are Thompson and Hardy, 1964, and Thompson and Adams, 1966, which we did not read) — https://www.uaex.uada.edu/publications/pdf/mp197/chapter5.pdf
- Mississippi State University Extension, "Soybeans: Liming and Fertilization," Publication 3777, reviewed by C. Bryant; web edition accessed Oct 6, 2026 (publication date not captured) — https://extension.msstate.edu/publications/soybeans-liming-and-fertilization
- Mississippi State University Extension, "Micronutrients in Crop Production," Information Sheet 1038, 2019; read from the copy hosted by the Mississippi Soybean Promotion Board because the university page returned HTTP 403 on Oct 6, 2026 — https://www.mssoy.org/sites/default/files/documents/msu-info-sheet-1038-2019.pdf
- University of Tennessee Institute of Agriculture, "Soybeans," lime and fertilizer recommendations, UTcrops.com, undated; accessed Oct 6, 2026 — https://utcrops.com/soil/agronomic-crops/soybeans/
- University of Kentucky Cooperative Extension Service, "2020–2021 Lime and Nutrient Recommendations," AGR-1 — https://publications.mgcafe.uky.edu/sites/publications.ca.uky.edu/files/AGR1.pdf
- Rogers, H.T.; Adams, F.; Thurlow, D.L., "Lime Needs of Soybeans on Alabama Soils," Bulletin 452, Alabama Agricultural Experiment Station, Auburn University, Dec 1973 — http://hdl.handle.net/11200/2386
- University of Georgia Agricultural and Environmental Services Laboratories, "Soybean," Plant Analysis Handbook, undated; accessed Oct 6, 2026 — https://aesl.ces.uga.edu/publications/plant/Soybeans.html
- Hardy, D.; Kulesza, S.; Gatiboni, L., "Fertilization and Nutrient Management," North Carolina Soybean Production Guide, chapter 3, NC State Extension, Jul 31, 2025 — https://content.ces.ncsu.edu/north-carolina-soybean-production-guide/soybean-fertilization-and-nutrient-management
- Gatiboni, L.; Crozier, C., "Mid-Season Soybean Molybdenum Deficiency," AG-897-08, NC State Extension, Dec 4, 2020, revised Oct 16, 2025 — https://content.ces.ncsu.edu/mid-season-soybean-molybdenum-deficiency
- deMooy, C.J., "Molybdenum Response of Soybeans (Glycine max (L.) Merrill) in Iowa," Agronomy Journal 62(2):195–197, 1970 (abstract only, as indexed by FAO AGRIS) — https://agris.fao.org/search/en/records/65df4dce0f3e94b9e5d724ac
- Boswell, F.C.; Anderson, O.E., "Effect of Time of Molybdenum Application on Soybean Yield and on Nitrogen, Oil, and Molybdenum Contents," Agronomy Journal 61(1):58–60, 1969 (abstract only, as indexed by FAO AGRIS) — https://agris.fao.org/search/en/records/65df1c744c5aef494fdfd5b1
- Seaton, D.B., "Yield and Chemical Composition of Soybeans as Affected by Molybdenum and Lime," M.S. thesis, University of Tennessee, 1979 (abstract only) — https://trace.tennessee.edu/utk_gradthes/7800
- McCutchen, T.C., "Soybean Yield Response to Molybdenum," M.S. thesis, University of Tennessee, 1965 (abstract only) — https://trace.tennessee.edu/utk_gradthes/8623
- Lavy, T.; Sands, G.; Barber, S., "The Molybdenum Status of Some Indiana Soils," Proceedings of the Indiana Academy of Science, vol. 70, 1960 (Purdue University; funded in part by Climax Molybdenum Co.) — https://journals.indianapolis.iu.edu/index.php/ias/article/view/5498
- Mallarino, A.P.; Camberato, J.J.; Kaiser, D.E.; Laboski, C.A.M.; Ruiz-Diaz, D.A.; Vyn, T.J., "Micronutrients Fertilization for Corn and Soybean: A Research Update," North Central Extension-Industry Soil Fertility Conference proceedings, vol. 31, 2015 — https://www.agronext.iastate.edu/soilfertility/info/Mallarino%20Micros%20article_NCSFC%202015_31-44-57.pdf
- The Fertilizer Institute, "Molybdenum," Essential Elements fact sheet originally developed by the International Plant Nutrition Institute, posted Jan 2024 (source of our summary of Parker and Harris, Agronomy Journal 54:480–483, 1962, which we did not read) — https://www.tfi.org/wp-content/uploads/2024/01/tfi-molybdenum.pdf
- Greenway Biotech, Inc., "Sodium Molybdate" product page (39% Mo; one pound, $89.99; listed as backordered), accessed Oct 6, 2026 — https://www.greenwaybiotech.com/products/sodium-molybdate
- Procurement Resource, "Sodium Molybdate Price Trend and Forecast" (United States, about 24,458 USD/MT CFR in Jan 2024 and 25,325 USD/MT in Mar 2024), accessed Oct 6, 2026 — https://procurementresource.com/resource-center/sodium-molybdate-price-trends
- Brandt Consolidated, Inc., "Brandt Sodium Molybdate – Powder" specimen label (39% Mo; net weight 25 lb; ruminant forage warning), Aug 2018 — https://brandt.co/media/7673/brandt-sodium-molybdate-powder-label.pdf
- West Plains LLC, market quotes for CBOT November 2027 soybeans (prior settle $12.5350, taken as the Oct 5, 2026 settlement), accessed Oct 6, 2026 — https://www.westplainsllc.com/markets.aspx?c=ZSX27&cn=Soybeans
- Gault, R.; Brockwell, J., seed-applied molybdenum compounds and inoculant survival on lucerne and subterranean clover, Australian Journal of Experimental Agriculture and Animal Husbandry 20(102):63–71, 1980 (abstract only) — https://connectsci.au/AN/article-lookup/doi/10.1071/EA9800063
- Crop Root Zone, TRZ-0257, "Ag Lime Costs 2.7 Cents a Pound of Effective Neutralizing Material, Delivered and Spread. Pelletized Lime Costs 11 to 21. In Six Iowa Trials, 200 Pounds an Acre Moved pH by a Tenth.," Oct 5, 2026.
- Crop Root Zone, TRZ-0225, "A $2.50 Soybean Inoculant Needs a Fifth of a Bushel to Pay. On Ground That Has Grown Soybeans, Two Decades of University Trials Mostly Can't Find It. On New Ground, Manitoba Found 15.," Sep 23, 2026.
- Helsel, Z.R.; Minor, H.C., "Soybean Production in Missouri," University of Missouri Extension, G4410, reviewed Sep 2017 — https://extension.missouri.edu/publications/g4410
- Sims, J.L.; Thompson, W.C.; Phillips, S.H., "Molybdenum Recommendation for Legumes," Agronomy Notes 2(1), University of Kentucky, 1969 (repository summary) — https://uknowledge.uky.edu/pss_notes/130
- University of Georgia Extension, "Georgia Soybean Production Guide," 2023 — https://grains.caes.uga.edu/content/dam/caes-subsite/grains/docs/soybean/2023-Soybean-Production-Guide.pdf
- Gurley, W.H.; Giddens, J., "Factors Affecting Uptake, Yield Response, and Carryover of Molybdenum in Soybean Seed," Agronomy Journal 61(1):7–9, 1969 (abstract only, as indexed by FAO AGRIS) — https://agris.fao.org/search/en/records/65df8f7f0f3e94b9e5d9dd41
Disclosures
Crop Root Zone is an independent publication. Nothing here is investment advice. Market calls, where included, reflect the editors' own read and are not a recommendation to buy or sell any security.
Discussion
This issue prices a hired fall strip-till pass with banded dry fertilizer at $29.65 an acre in Iowa's survey, or $32.12 at $5.63 farm diesel, and finds that banding the fertilizer adds $6.45 to the bare pass. So: what are you being quoted per acre for custom strip-till this fall, how much of it is the fertilizer add-on and how much a fuel surcharge, and how many acres going to corn would you actually strip? If you own the bar, tell us what it cost and how many acres it covers a year, so we can set it against our 1,300-acre break-even.
Corrections are as welcome as answers. If you check our arithmetic against a primary source and find we have it wrong, tell us. The sharpest replies get answered in next week's Letters & Responses.