Issue 11 · 2026-09-28
Almost every feature in this issue turns a purchase into a bushel count. Polymer-coated urea has to find about six bushels to pay this fall. A fall nitrogen inhibitor needs about two, and a wheat seed treatment about two-thirds of one. A soybean inoculant needs a fifth of a bushel, and a humic product 0.8 to 3.1 bushels of corn. Once each cost is written as a hurdle, the useful question becomes whether independent, replicated trials clear it on ground like yours. Mostly they do on specific soils and in specific years, and mostly they do not anywhere else.
The other half of the issue puts a price on waiting. The urea curve charges $17 a ton to carry nitrogen from September to March, and it missed by $74 and $105 in the last two springs. The diesel curve prices April gallons 83 cents under today's record. A ground pile pays only if it is empty by February. A second year of corn costs $65 an acre in Illinois' 2027 budget, and only $10 of that is fertilizer.
Why now: harvest, fall application and 2027 input booking are all happening in the same few weeks, so these decisions get made together. We have tried to state each hurdle before the invoice arrives.
— Crop Root Zone, Editorial Desk.
Letters & Responses
No reader correspondence reached us this week. Email is the only way to write to this publication, and nothing on RZ-010 arrived in the eight days since it went up: no questions, no corrections, no pushback. We would rather say so than invent a letter.
Three questions remain open.
RZ-010's closing question is still open. We asked at what moisture you are starting corn, what your propane is contracted or delivered at per gallon, and whether moisture or stalk quality decides which fields go to the dryer first. It matters more now that harvest is further along. This issue's storage feature argues that the cost of a ground pile depends mostly on how long it has to hold, so the moisture a crop goes into storage at carries into the storage bill.
RZ-009's diesel question is also unanswered. We asked whether you are running your fall tillage pass, cutting it back or dropping it, and what you pay per gallon for delivered dyed diesel against last September. This issue's diesel feature finds the futures curve pricing April gallons well below today's record, which raises a related question: are you being offered a spring contract price, and at what discount to spot?
The standing question on nitrogen hedging remains open. A reader wrote to RZ-004 that a grower has no practical way to hedge a nitrogen bill the way grain can be hedged. This issue adds one more piece of evidence. The urea forward curve has charged a modest carry from fall to spring, and it has missed the spring price by far more than that carry in each of the last two seasons. The correspondent asked to remain anonymous and remains so.
Corrections, disagreements and quotes from your own operation are all welcome by email. We answer the sharpest ones here the following week.
In This Issue
This week's features, by department.
- Polymer-Coated Urea Needs Six Bushels to Pay This Fall. The Trials Find Them on Claypan and Sand, and Roughly One Year in Four Anywhere Else.At DTN's $659 urea and an estimated 16- to 22-cent coating premium per pound of N, an all-ESN-type 150-pound program costs $24 to $33 an acre more than plain urea: 4.9 to 6.7 bushels at Central Illinois' $4.93 bid. Against fall anhydrous the gap is about $50, or 10 bushels. University trials found gains of 15 to 39 bushels on undrained Missouri claypan and Minnesota sandy loam, and none on Iowa research farms, Waseca clay loam or Kentucky's well-drained soils. A one-third blend cuts the hurdle to about 2 bushels. Fall application is where the product's record is weakest.
- Liquid 10-34-0 Costs $1.06 a Pound of Phosphate and MAP Costs $0.93. At a Starter Rate the Gap Is About $2.50 an Acre. Whether the Starter Pays at All Is the Bigger Number.Liquid phosphate's premium over MAP has narrowed from 30% in fall 2022 to 14% this week and grew into spring in three of the last four seasons. On P-sufficient Indiana ground a 3-gallon pop-up paid in one of 21 trials, so the soil test matters more than the price sheet.
- The Urea Curve Charges $17 a Ton to Carry Nitrogen From September to March. In the Last Two Springs It Missed by $74 and $105.CME's Gulf urea contract settled at $458 a short ton for September and $475 for March 2027 on Sep 23. That is a 3.7% contango, worth about $3.33 an acre on a 180-lb spring urea program if it reaches the retail counter in full. Priced through the NOLA-to-retail spreads of recent springs, the curve points to spring 2027 retail urea of about $611 to $676 a ton. Today's price is $659, so the curve is saying spring costs about what September costs. The April and May 2027 contracts carry an untraded, unchanged $407.50 that we do not treat as a price, and the UAN contract has no usable forward at all. In the two springs we could reconstruct from published swap quotes, the curve two to three months out under-called the spring price by 20% and 28%. The contango is a rounding error inside the curve's own miss.
- September Anhydrous Beat the Following April in Three of the Last Four Seasons. At $938 a Ton, Fall Wins Only if Spring Tops About $1,041.DTN's mid-September retail prints since 2022 show anhydrous was $96 to $346 a ton cheaper than the next April in three seasons and $374 dearer in the fourth, the fall after the 2022 price shock. September has also been the low of every fall: prices rose $33 to $129 a ton into the application window in all four years. Illinois on-farm trials put fall ammonia's agronomic cost at 10 more pounds of N and about a bushel an acre. At today's $938 and $5.37 December corn, that cost means spring anhydrous has to clear roughly $1,041, 11% higher, before a fall application comes out ahead. In two of the four seasons the fall edge only just cleared that hurdle. The season it failed looks more like this one than the other three do.
- Weekly Fertilizer Price Reporting Cleared a Senate Committee on September 16. It Would Report the Plant Gate. The $230 Spread Between Illinois Anhydrous Quotes Sits at the Counter It Exempts.The Fertilizer Transparency Act rode into the Senate farm bill in a 12–11 committee vote. It would make manufacturers and wholesalers report prices and tonnage weekly, and it exempts retailers and every cooperative. USDA's own Sep 18 distributor reports show where the uncertainty actually sits: Illinois anhydrous asks run from $820 to $1,050 a ton, Iowa UAN32 from $375 to $685, and within-state spreads range from 11% to 68% of the average ask, while no product on DTN's national board moved 5% in a month. The bill would publish a clean wholesale number, which lets a grower back out the retail margin but not see it directly. Under the confidentiality rules Washington already uses for livestock, concentrated regional cells may not publish at all. Congress is out for six weeks, and the livestock precedent took 18 months from law to first report, so none of this reaches the 2027 booking season. Collecting three quotes is still the only price discovery a grower controls.
- Kansas' 2027 Wheat Acre Pays in Rotation and Fallow, Not in Continuous Wheat. Fertilizer Moved the Math by $4 to $9.We repriced all eleven K-State dryland wheat budgets at September retail fertilizer and a July 2027 KC settlement of $7.745 less 70 cents of basis. The fertilizer increase since K-State's November prices adds $3.83 to $8.89 an acre. The wheat price adds $59 to $110. Eight budgets now clear full cost. The three continuous-wheat budgets still lose $43 to $117 an acre and need 43 to 58 bushels to break even, against 37 to 41 planned. RMA's $8.11 projected price is 36.5 cents above the July board, and at 75% coverage it puts the revenue guarantee above direct cost in all eleven budgets. To pay its way, a grazed South Central acre has to earn about 56 to 83 cents per pound of gain.
- A Second Year of Corn Costs $65 an Acre in Illinois' 2027 Budget. Fertilizer Is $10 of It.farmdoc's 2027 budget for high-productivity central Illinois ground puts corn after corn $65 an acre behind corn after soybeans at $5.00 corn. A 10-bushel yield drag accounts for $50 of that and fertilizer for $10. At DTN's $0.58 per pound of N for anhydrous, the 14-pound gap between Illinois' corn-after-corn and corn-after-soybean N rates costs about $8, and the past year's 22% rise in anhydrous added only about $1.44 to it. Set against soybeans after corn, a second year of corn gives up $115 an acre. That gap closes only at $5.49 cash corn or $10.51 cash soybeans. If the second-year yield drag is closer to the 2% measured across Corn Belt fields, the corn price needed falls to $5.38.
- Skipping Fall P&K Ahead of Corn Saves About $87 an Acre. On Ground Testing Optimum, Only About $14 of It Is Real Money.At DTN's mid-September retail prices of $925 for DAP and $495 for potash, replacing one 210-bushel corn crop's phosphorus and potassium removal costs $87 to $99 an acre under Iowa State, Tri-State and Illinois removal rates. On High and Very High soils that is a true saving: Iowa State puts the odds of a yield response at 5% and under 1%, and in a 40-year Iowa trial, unfertilized plots on ground that needed no P or K at the start took 17 years to fall far enough for fertilizer to pay. On Optimum soils it is not a saving. The pounds have to go back, so skipping only earns interest plus a spreading pass, about $14 at flat prices. That is less than the upper-bound expected yield cost of $24. Skipping on Optimum ground pays only if DAP falls toward its 2024 level. On Low ground it loses under every price case.
- USDA's 1.922 Billion Bushels of Old-Crop Corn Needs the Summer Quarter to Have Run 9.1% Ahead of Last Year. The Spring Quarter Ran 6.6%.The September 30 Grain Stocks report replaces USDA's estimate of old-crop corn with a count. Over the last five years the count has differed from the September WASDE by an average of 109 million bushels. In every year the gap was mostly feed and residual use, a figure USDA does not measure directly. This year USDA's figure requires June-August use to have grown faster than it did in March-May. At the spring pace, September 1 stocks would be about 1.999 billion bushels, and the 2026/27 stocks-to-use ratio would rise from 9.7% to 10.2%. Soybean misses are smaller in bushels but larger against the carryout, and they come mostly from revisions to the prior year's crop.
- North Dakota Canola Is Bid 31% Over Last Year. Its Fertilizer Program Costs 6% More, and the Bill Fell From 6.0 Hundredweight an Acre to 4.8.Processors in eastern North Dakota bid $25.22/cwt for canola on September 21, against $19.27 a year ago, while a standard NDSU-style nitrogen, phosphate and sulfur program priced at September retail rose only from about $115 to $121 an acre. Gross revenue on a 2,000-lb crop rose about $119 an acre; fertilizer rose about $6. The price behind that gain comes mostly from China's lower duty and from crushers bidding for oil. It does not reflect a short crop: Canada harvests a record 23.2 million acres and North Dakota planted a record 2.35 million, Saskatchewan's harvest is running 39 points behind average, and ICE futures trade 16% above Ottawa's own price forecast for the crop year.
- The National Storage Squeeze Eased by 733 Million Bushels. A Ground Pile Still Pays Only if It Is Empty by February.The 2026 corn, soybean and sorghum crop plus carry-in is 733 million bushels smaller than last year's against 25.5 billion bushels of storage, but the squeeze moved to Iowa and the Ohio Valley, where basis sits at record lows for September. Built from extension, USDA and EIA figures, a covered, aerated pile costs about 16 to 37 cents a bushel to hold Iowa corn to early January and 28 to 50 cents to early March, before the cover and fans. Against a 13¾-cent December–March carry, a pile emptied in January pays if basis recovers. One held to March loses money in most cases. The gap between a 1% and a 4% storage loss, 14½ cents, is worth more than the whole carry.
- Hiring an Iowa Anhydrous Pass Costs About $17 an Acre at Today's Diesel. A New Toolbar Beats It Only Past About 1,500 Acres, and Only if the Tractor Is Treated as Free.Against Iowa's 2026 custom rate adjusted to $5.61 farm diesel, a new $140,544, 47.5-foot anhydrous bar pays for itself only above about 1,500 acres a year, and only if the tractor's ownership cost is treated as already paid. Charge the tractor to the pass and owning never beats hiring in Iowa. At Kansas's $21.51 and Nebraska's $19.69 averages, the line falls to 900 to 1,030 acres. Renting a bar at Iowa's $9.50 average beats owning one below about 2,200 acres. Diesel moved the break-even by 37 acres. How the tractor is counted moves it by thousands.
- Midwest Diesel Is at a Record $6.68. The Futures Curve Prices April 83 Cents Lower. Contract the Spring Gallons; Don't Fill the Tank for Them.Midwest on-highway diesel hit $6.68 a gallon in the week of September 21, 52% above its trailing-year average, and Illinois farm diesel was $5.61 on September 18. The diesel futures curve is steeply backwardated, with April 83 cents under October, so filling a tank now to hold for spring costs about a dollar a gallon more than contracting April delivery. EIA history puts the normal January-to-November swing at about 8%, which does not pay for a 2,000-gallon tank package on its own. A 2,500-gallon aggregate keeps a farm out of federal SPCC planning. Contracted spring gallons lose money only if prices fall further than the curve already assumes, which happened in two of six past diesel spikes.
- Diesel Added 48 to 73 Cents to Every Loaded Mile of a Grain Haul in a Year. USDA's 100-Mile Truck Rate Added 4, and Midwest Diesel Is Another $1.34 Higher Since.USDA's latest grain-truck survey priced a 100-mile haul at $4.84 a loaded mile, about 49 cents a bushel of corn, when Midwest diesel averaged $5.34. It is $6.68 this week. Repriced for fuel, that haul costs 53 to 55 cents, and Iowa's custom-rate survey, built on $2.89 diesel, is 10 to 15 cents light at 100 miles. Iowa's 90,000-pound harvest proclamation claws back about 8 cents but lapses October 10 with 4% of the state's corn harvested. At repriced rates, each extra loaded mile toward a better bid costs about half a cent a bushel, so a 20-cent basis gain pays for a little under 40 more miles.
- Humic Acid Earns Its Keep on Corn In-Furrow and in Drought Years. On Soybeans, the Public Trials Mostly Come Up Empty.Liquid humic and fulvic products cost about $4 to $16 an acre at common label rates. At the Central Illinois bids of $4.93 corn and $12.85 soybeans, that is 0.8 to 3.1 bushels of corn or 0.3 to 1.2 bushels of soybeans. A publicly funded three-year Illinois trial found in-furrow humic acid added about 5 bushels of corn and paid for itself. On soybeans the same trial lost money, and five on-farm comparisons in three states found no yield gain. A quart of product puts about a quarter-pound of humic acid on an acre that already holds some 70,000 pounds of organic matter, so any benefit comes from a signal to the roots, not from building soil. That is also why California lets a label claim only that humic acid may help micronutrient uptake.
- The Other Fall Nitrogen Inhibitor Needs Two Bushels to Pay. Missouri's Headline 7% Was a Win Over Nitrapyrin. Over Plain Anhydrous, the Gap Was 0.6 Bushels.Pronitridine (Centuro) costs about $10 an acre on 150 pounds of fall anhydrous at the label's 5-gallon rate, and nitrapyrin about $15. At Central Illinois' $4.92 corn bid, that is 2.0 and 3.0 bushels. Across 13 university site-years in three states, the two products yielded the same. The gains that exist were measured on poorly drained soils given 30% less nitrogen than recommended. Nebraska's farmer-run strips on silt loams found no yield effect in five fall comparisons. This fall a strong El Niño is expected to push the 50°F soil date 10 to 15 days late, so the timing decision is worth more than the choice of product.
- A Wheat Seed Treatment Needs Two-Thirds of a Bushel to Pay at Today's Bids. On Scabby Seed, Kansas Measured 4.5. On Clean Seed Sown on Time, Three of Four Commercial Treatments in a Ten-Site Midwest Study Showed No Yield Effect.Kansas custom operators charged $4.61 a bushel more in 2026 to clean wheat seed with a treatment than without one. That comes to $4.61 to $7.68 an acre for a fungicide at normal seeding rates, and an estimated $10 to $15 with a full-rate insecticide. At September's $6.89 to $6.97 wheat bids, that is 0.7 to 2.2 bushels. The replicated trials split along two lines. The seed lot decides whether the fungicide pays: it paid on seed from a scab year, on smut- or bunt-carrying seed, and on thin stands of light seed. It did not show up on clean, certified seed. The calendar decides whether the insecticide pays: it paid where wheat went in early into aphids, and it fades after the fly-safe date. So the two halves of the treatment should be bought as separate decisions.
- A $2.50 Soybean Inoculant Needs a Fifth of a Bushel to Pay. On Ground That Has Grown Soybeans, Two Decades of University Trials Mostly Can't Find It. On New Ground, Manitoba Found 15.Nebraska's 2026 budget carries a base rhizobia inoculant at $2.50 an acre, and at $13.25 November soybeans that needs 0.19 bushels. On fields with soybean history, 73 trials in five states, 17 Nebraska on-farm strips and 11 more in four states found almost nothing; the one pooled dataset that shows a gain, 0.9 bushels, was written by inoculant companies. New ground is the opposite case: 15 bushels in Manitoba. So the base product is a small, defensible hedge only where a field meets a named trigger. The premium seed-applied stack, at an estimated two to three times the price, has 103 site-years against it. Sort the fields before the 2027 seed order goes in.
State of the Industry
The fertilizer board sat still again this week. The grain board did not, and over the past year it has quietly moved further than fertilizer has.
Retail held and wholesale urea paused. In DTN's survey for September 14–18, no product moved more than 3.4% from a month earlier. UAN28 fell $15 to $421 a ton, anhydrous edged up to $945, and potash was unchanged at $495 [1]. Anhydrous is still the cheapest nitrogen at $0.58 a pound of N, and it is still the product that has risen most in a year, up 22% [1]. Wholesale urea stopped climbing. The Gulf benchmark was $457.25 a tonne on September 25, a touch under the prior Friday's $459.50, after gaining 9.5% over the month. China's looser export rules and progress on Hormuz shipping have cooled supply fears [2]. DAP was flat at $802.50 [3]. The potash headline came from Washington. On September 21 the president said the U.S. is working on a deal to buy Belarusian potash for less than Canada charges, and Canada supplies about 85% of U.S. imports [4]. Nothing moved at retail, and a StoneX analyst quoted by DTN pointed elsewhere: "We need help on phosphate and nitrogen" [1].
Grain did the moving. The U.S.–China meeting on September 24 extended the trade truce through January 2027 with a cap on tariffs, but nothing specific for agriculture came out of it. China booked 120,000 tons of new-crop soybeans that morning [5]. November soybeans still finished the week 15½ cents higher at $13.19. December corn added ¾ cent to $5.28¼, and December Chicago wheat lost 11 cents to $7.03¼ [6][7]. The longer comparison matters more. On September 25, north-central Illinois country elevators bid an average $4.93 for corn and $12.89 for soybeans, up 28% and 33% from a year earlier [8]. Over the same year, retail anhydrous rose 22%, and DAP and potash rose 2% each [1]. On phosphorus and potassium, the crop has outrun the input by a wide margin. On nitrogen for corn, it has only just stayed ahead.
Getting the crop out cost more again. U.S. on-highway diesel set another record at $6.529 a gallon in the week of September 21, up 24.4 cents in a week and $2.78 on the year [9]. USDA's barge cost indicator rose to 274.3 for the week ended September 23. That is 4% higher than a week earlier and about 41% higher than in late August [10]. Harvest is starting wet in parts of the Corn Belt, with more delays expected [11][12]. One Iowa grower put the cost of drying corn on the farm at 15 to 18 cents a bushel [11].
Better grain prices lower the bar for add-ons. The farm bill the Senate Agriculture Committee advanced on September 16 carries the Plant Biostimulant Act, which its backers say would bring regulatory clarity to the category [13]. The grain price matters more to this fall's buyers than the law does. At $4.93 corn, a $10-an-acre product needs 2.0 bushels to pay. At last year's $3.85 it needed 2.6 (our arithmetic from [8]).
| Benchmark | Level | Basis | Move |
|---|---|---|---|
| Anhydrous | $945/ton | Delivered retail, Sep 14–18 | +0.2% MoM; +22% YoY |
| Urea | $659/ton | Delivered retail, Sep 14–18 | −0.8% MoM; +6% YoY |
| UAN28 | $421/ton | Delivered retail, Sep 14–18 | −3.4% MoM; +1% YoY |
| Urea | $457.25/t | Gulf benchmark, Sep 25 | −0.5% w/w; +9.5% m/m |
| DAP | $925/ton | Delivered retail, Sep 14–18 | +1.0% MoM; +2% YoY |
| DAP | $802.50/t | Benchmark, Sep 25 | 0.0% w/w; +1.3% m/m |
| Potash | $495/ton | Delivered retail, Sep 14–18 | 0.0% MoM; +2% YoY |
| Dec corn | $5.28¼/bu | CBOT settlement, Sep 25 | +¾¢ w/w |
| Nov soybeans | $13.19/bu | CBOT settlement, Sep 25 | +15½¢ w/w |
| Dec Chicago wheat | $7.03¼/bu | CBOT settlement, Sep 25 | −11¢ w/w |
| Corn, cash | $4.93/bu | N-central Illinois elevator avg, Sep 25 | +28% YoY |
| Soybeans, cash | $12.89/bu | N-central Illinois elevator avg, Sep 25 | +33% YoY |
| U.S. diesel | $6.529/gal | On-highway retail, wk Sep 21 | +24.4¢ w/w; +$2.78 YoY |
| Barge cost indicator | 274.3 | USDA AgTransport, wk ended Sep 23 | +4.2% w/w |
Sources: DTN/Progressive Farmer, Sep 23, 2026 (retail, Sep 14–18); Trading Economics, accessed Sep 28, 2026 (urea and DAP, Sep 25; week-on-week moves computed against the Sep 18 prints); Brownfield Ag News, Sep 18 and Sep 25, 2026 (week-on-week futures moves computed from the two settlements); USDA AMS Illinois Grain Bids, Sep 25, 2026 (year-on-year moves computed from the report's year-ago averages); U.S. Energy Information Administration, Sep 22, 2026; USDA AgTransport indicators as relayed by IndexBox, week ended Sep 23, 2026.
The week's verdict: fertilizer stood still while grain, diesel and barge freight moved, and a year on, crop prices have outrun every nutrient except nitrogen, which they have only just outpaced.
References
- DTN/Progressive Farmer, "Fertilizer Prices Rise for Six of Eight Major Fertilizers," Sep 23, 2026. https://www.dtnpf.com/agriculture/web/ag/crops/article/2026/09/23/fertilizer-prices-rise-six-eight
- Trading Economics, Urea, accessed Sep 28, 2026. https://tradingeconomics.com/commodity/urea
- Trading Economics, Di-ammonium Phosphate, accessed Sep 28, 2026. https://tradingeconomics.com/commodity/di-ammonium
- BNN Bloomberg, "Trump: U.S. working on deal to buy potash from Belarus," Sep 21, 2026. https://www.bnnbloomberg.ca/business/international/2026/09/21/trump-working-on-deal-to-buy-potash-from-belarus-for-lower-price-than-canada/
- Brownfield Ag News, "Soybeans decline with no real fresh news from China meeting," Sep 24, 2026. https://www.brownfieldagnews.com/market-news/soybeans-decline-with-no-real-fresh-news-from-china-meeting/
- Brownfield Ag News, "Closing Grain and Livestock Futures: September 25, 2026." https://www.brownfieldagnews.com/market-news/closing-grain-and-livestock-futures-september-25-2026/
- Brownfield Ag News, "Closing Grain and Livestock Futures: September 18, 2026." https://www.brownfieldagnews.com/market-news/closing-grain-and-livestock-futures-september-18-2026/
- USDA Agricultural Marketing Service, Illinois Grain Bids, Sep 25, 2026. https://mymarketnews.ams.usda.gov/viewReport/3192
- U.S. Energy Information Administration, Gasoline and Diesel Fuel Update, Sep 22, 2026 (week of Sep 21). https://www.eia.gov/petroleum/gasdiesel/
- IndexBox, "USDA Grain Transport Costs: Truck and Barge Indicators Climb in Latest Week," relaying USDA AgTransport data for the week ended Sep 23, 2026. https://www.indexbox.io/blog/usda-grain-transport-cost-indicators-rise-across-most-modes-in-week-ended-september-23-2026/
- Brownfield Ag News, "Wet conditions could lead to higher propane bills this harvest," Sep 24, 2026. https://www.brownfieldagnews.com/news/wet-conditions-could-lead-to-higher-propane-bills-this-harvest/
- Brownfield Ag News, "Soybeans, corn end session mixed, both up on the week," Sep 25, 2026. https://www.brownfieldagnews.com/market-news/soybeans-corn-end-session-mixed-both-up-on-the-week/
- Biological Products Industry Alliance, "BPIA Applauds Senate Agriculture Committee Passage of Farm Bill," Sep 16, 2026. https://www.bpia.org/2026/09/bpia-applauds-senate-agriculture-committee-passage-of-farm-bill/
Weekly Briefing
Fertilizer
Retail prices edge up, still nothing moves 5% — DTN's survey for September 14–18 had six of eight products higher than a month earlier and two slightly lower. For the second week running, none moved 5% or more. DAP rose 1.8% to $925 a ton and anhydrous averaged $945, up 21.6% on the year. UAN32, at $458, is still the only product cheaper than a year ago. (DTN/Progressive Farmer, Sep 23, 2026)
A Belarus potash deal meets a sold-out seller — On September 21 President Trump said the U.S. was working on a "massive" deal to buy Belarusian potash for less than Canadian supply costs. A day later Alexander Lukashenko said Belarus had no spare tonnes because this year's output is already under contract. Canada supplied about 90% of U.S. potash imports in 2025, some 11.2 million tons. Belarus shipped an average of 635,000 tons a year to the U.S. in 2017–2021. The first cargo since 2022, about 30,000 tons, is due at New Orleans in October. (UPI, Sep 22, 2026; World Fertilizer, Sep 23, 2026)
Canpotex commits C$500 million to its Vancouver export terminal — The potash exporter will replace shiploaders and conveyors and rebuild the railcar dumper pit at Neptune Bulk Terminals, which it calls the world's largest potash export terminal. Completion is expected in 2028 and the terminal will keep operating during construction. It is the company's largest supply-chain investment to date. (World Fertilizer, Sep 28, 2026)
Egypt targets $3 billion in new fertilizer capacity — Egypt's Chemical and Fertilizers Export Council says five projects with Chinese, Indian and Egyptian investors could add 2–3 million tonnes of annual output over three years. The new output would supply the domestic market first. Fertilizers are already Egypt's second-largest export after gold. (Daily News Egypt, Sep 22, 2026)
Crops
The Trump–Xi summit extends the truce but adds no new farm purchases — The September 24 White House meeting extended the U.S.–China trade truce by two months, to January 10, but produced no new agricultural purchase commitments and no tariff cuts. China is more than halfway to its 25-million-tonne annual soybean pledge but behind on the broader $17 billion farm-goods commitment. December corn settled at $5.28¼ and November soybeans at $13.19 on September 25, down from $5.43 and $13.28 on September 21. (WWBL, Sep 27, 2026; Brownfield Ag News, Sep 21 and Sep 25, 2026)
Diesel sets a record during harvest — The national average for diesel reached an all-time high of $6.51 a gallon, and the central U.S. is averaging $6.68. A southeast Missouri grower puts his fuel bill 60% above last year and says one semi costs about $1,500 to fill. Agricultural economist Michael Langemeier says higher grain prices are "helping" but are not solving the input-cost problem. (Agri-Pulse, Sep 22, 2026; Harvest Public Media via KCUR, Sep 25, 2026)
The farm bill extension runs out Wednesday — The current extension of the 2018 Farm Bill expires September 30. The Senate Agriculture Committee advanced its bill 12–11 on party lines on September 16, after a 10–11 failure in August, but a floor vote is not expected before the November 3 midterms. Congress will need another short-term extension to avoid gaps in expiring authorities. (The National Desk, Sep 16, 2026; Michigan Farm News, Sep 9, 2026)
A heat-tolerant russet for southern growers — Texas A&M's potato breeding program has released Duncan Russet, which resists Potato Virus Y (a virus that can cut yields by up to 80%) and is bred for southern U.S. heat, where standard russets struggle. It is the program's fourth recent russet release. (Texas A&M AgriLife, via Phys.org, Sep 22, 2026)
Home & Garden
Plant a wall to cool a room — Horticulture researcher Ross Cameron writes that plants against a south-facing brick wall can cut its surface temperature by as much as 25°C. Ivy and honeysuckle do the most. A trellis about half a metre out leaves an insulating air gap, and a packet of nasturtium or morning glory seed is the cheap way to start. Next summer's project can begin with this fall's planting. (The Conversation, via Phys.org, Sep 25, 2026)
No, your tomatoes don't like Mozart — A plant scientist reviewing the evidence finds no reliable sign that any genre of music helps plants grow. The claim goes back to a 1973 book that was never peer reviewed. Plants do respond to some natural sounds, such as running water or chewing insects, but a playlist does nothing for them. It doesn't hurt them either. (The Conversation, via Phys.org, Sep 25, 2026)
The late-September checklist — Finish overseeding while cool-season grass can still root through October. Get tulips, daffodils, crocus and alliums in before the ground freezes. Dig dahlias and gladiolus once frost kills the tops, and collect seed from open-pollinated zinnias and cosmos once the seed heads have swelled. (The Berkshire Edge, Sep 24, 2026)
A slow-acting bait for termites — UC Riverside entomologists report that bistrifluron, a chitin-synthesis inhibitor, killed about 99% of termites under continuous exposure. It killed the whole colony by day 90 when only 5% had been exposed, because treated termites share it with nestmates before it acts. That could mean treating one spot instead of fumigating a whole house. (Journal of Economic Entomology, via ScienceDaily, Sep 19, 2026)
Micronutrients
India's micronutrient makers ask for one licence and one tax rate — At a September 21 roundtable in New Delhi, the Indian Micro-Fertilizers Manufacturers Association asked for a single national digital fertilizer licence and freer exports of non-subsidised specialty fertilizers, using a negative list in place of case-by-case approvals. It also asked for a uniform 5% GST on all plant-nutrition products notified under India's Fertiliser Control Order, to end inverted duty structures. Officials said they were open to the licensing idea. (Global Agriculture, Sep 19, 2026; ANI, Sep 21, 2026)
Sulfur is off its peak but still three times last year's price — Chinese sulfur traded at about CNY 7,736 a tonne on September 28. That is down 7.4% on the month and about 30% below June's record of CNY 11,084, but still up about 192% on the year. None of that easing has reached farm phosphate yet: DAP was up 1.8% on the month in the latest DTN survey. (Trading Economics, Sep 28, 2026; DTN/Progressive Farmer, Sep 23, 2026)
Organics
Sprouts agrees to stop misting ProduceMaxx on produce — Under a settlement with the Texas Attorney General, Sprouts Farmers Market will stop using ProduceMaxx on all produce nationwide within 90 days. ProduceMaxx is an EPA-registered hypochlorous-acid antimicrobial. Sprouts also agreed not to use any synthetic antimicrobial on organic produce. The office says thousands of U.S. stores have used the product off-label in misting systems. Albertsons stores in Texas settled earlier. (Dallas Express, Sep 21, 2026)
Canadian organic grain prices, late September — Prairie organic prices collected from growers and certified buyers on September 24 put Saskatchewan hard red spring wheat at C$18.50/bu spot, new-crop yellow peas at C$20.75/bu FOB, and brown flax at about C$48/bu. The next update is October 7. (Organic Grain Hub, Sep 24, 2026)
Organic dairy demand holds while Northeast pasture dries — The Northeast Organic Dairy Producers Alliance reports steady pay prices, some buyers shifting toward protein premiums, and organic cows fetching $3,000 and up. Northeast drought has worsened. Organic Valley unit sales were up 17.2% and Maple Hill's were up 36.7%. The alliance also reports that Origin Milk has run into payment trouble with a processor and suspended its bonuses for transitioning producers. (NODPA, Organic Dairy News, September 2026)
Up and Coming
A gene-edited soybean with 90% oleic acid — Sejong University researchers used CRISPR to edit the FAD2 and FATB gene families and produced soybean lines with 90.2% oleic acid (conventional soybeans have about 20%). Linoleic and linolenic acids are each below 1% and saturated fat is down more than 40%. Research-stage: the authors say yield and agronomic stability still need evaluation, and the lines face regulatory review in Korea. (Plant Biotechnology Journal, via Phys.org, Sep 23, 2026)
One engineered immune receptor recognizes two blast strains — John Innes Centre and Kobe University scientists redesigned a tandem-kinase immune receptor so it recognizes effector proteins from both the wheat and barley forms of the blast fungus, which rarely happens in nature. Proof of concept in wheat cells only: greenhouse plants are the next step. (Science Advances, via Phys.org, Sep 23, 2026)
A bee repellent to add to spray tanks — A UC Riverside machine-learning model screened more than 50 million compounds and flagged about 130 likely honey-bee repellents. All seven that were field-tested kept foragers away without harming them, which could let growers keep bees off freshly sprayed crops. Early-stage: patents are pending, and no product or registration exists yet. (eLife, via Phys.org, Sep 24, 2026)
An electronic nose for soil health — A Radboud University ecologist sampled soil air from 18 Dutch grasslands and found 16 of 75 odour compounds that tracked how intensively the land was managed. Fungal aldehydes responded most. She proposes a field "electronic nose" to replace monthly DNA testing. Concept stage: no sensor exists yet, and the article cites no peer-reviewed paper. (Phys.org, Sep 27, 2026)
Interesting
Ethephon in the fall delayed one cherry's spring bloom — Göttingen researchers sprayed ethephon on commercial orchards in autumn to push flowering past spring frosts. On April 9, 88% of untreated Kordia cherry trees were in bloom, against 56–63% of treated trees. Bellise cherry and Elstar and Kanzi apples did not respond, so results depend on variety. (BMC Plant Biology, via Phys.org, Sep 23, 2026)
Solar construction compacts sandy farmland — Building an agrivoltaic array in Brandenburg packed sandy soil to 1.67–1.99 g/cm³, against 1.14–1.34 undisturbed. Penetration resistance reached 3.7–4.1 MPa, beyond the level that restricts root growth. At that compaction the authors project winter rye yield losses of 22–43%, and sandy soils do not recover on their own. Designated traffic lanes and ground-protection plates cost several thousand euros a hectare. (Scientific Reports, via Phys.org, Sep 27, 2026)
Five foods likely to cost more in Europe this winter — The list is chocolate, potatoes, leafy greens, bread and olive oil. Drought may cut the European and UK potato harvest by 3.5 million tonnes below expectations, and 70% of Spain's olive groves are rain-fed. The authors also cite fertilizer and energy costs. (The Conversation, via Phys.org, Sep 22, 2026)
Spotted lanternfly reaches the EU — Hungary has confirmed Lycorma delicatula in Bács-Kiskun county, its first detection in the European Union, after a resident reported it. The pest arrived in the U.S. in 2014 and attacks grapevines and fruit trees. A 2020 Penn State study put its potential cost at $554 million a year in Pennsylvania alone. (AFP, via Phys.org, Sep 24, 2026)
Off the Wall Discovery
Injured roots send out a pressure wave — University of Würzburg researchers found that when an Arabidopsis root is injured, a drop in cell pressure travels outward at about 75 mm per second, some 10,000 times faster than known calcium signals. The wave triggers stress hormones in undamaged roots nearby. Model-plant basic research: the authors see eventual pest-resistance applications, but none exists yet. (Science Advances, via Phys.org, Sep 25, 2026)
Parasitic worms steer earwigs into water — The nematodes that parasitise earwigs push their hosts toward water so the worms can leave and breed. RNA sequencing by Otago, UBC and Brown researchers found the change involves coordinated gene activity in both animals: 673 earwig genes and 2,672 worm genes became more active during the manipulation. (Proceedings of the Royal Society B, via Phys.org, Sep 26, 2026)
Fungi for farming on Mars — A U.S.–Brazilian review argues that arbuscular mycorrhizal fungi and Trichoderma could help crops take up nutrients from lunar or Martian regolith. Speculative review: it reports no new experiments, and the authors say the fungi still need testing on real regolith rather than simulants. (Frontiers in Astronomy and Space Sciences, via ScienceDaily, Sep 25, 2026)
Polymer-Coated Urea Needs Six Bushels to Pay This Fall. The Trials Find Them on Claypan and Sand, and Roughly One Year in Four Anywhere Else.
At DTN's $659 urea and an estimated 16- to 22-cent coating premium per pound of N, an all-ESN-type 150-pound program costs $24 to $33 an acre more than plain urea: 4.9 to 6.7 bushels at Central Illinois' $4.93 bid. Against fall anhydrous the gap is about $50, or 10 bushels. University trials found gains of 15 to 39 bushels on undrained Missouri claypan and Minnesota sandy loam, and none on Iowa research farms, Waseca clay loam or Kentucky's well-drained soils. A one-third blend cuts the hurdle to about 2 bushels. Fall application is where the product's record is weakest.
Polymer-coated urea is the most expensive way to buy a pound of nitrogen in the Corn Belt this fall, and the least likely to be priced in public. Urea averaged $659 a ton at retail in the week of September 14 to 18, or 72 cents a pound of N. Anhydrous averaged $945, or 58 cents (DTN, Sep 23, 2026). Central Illinois elevators bid $4.93 for corn on September 25, and December 2027 futures settled at $5.28 (USDA AMS Illinois Grain Bids, Sep 25, 2026). Coated urea, sold mainly as Nutrien's ESN, is quoted dealer by dealer. The question for a grower weighing it for fall or early-spring application is the one extension agronomists have been asking since the product reached row crops: how many bushels does the coating have to return, and on which fields has it actually returned them? The university record from Minnesota, Missouri, Iowa, Illinois and Kentucky gives a clearer answer than the product's reputation does.
1. What the coating costs per pound of nitrogen
What's new: No public survey reports a 2026 retail price for polymer-coated urea. The DTN weekly survey covers eight products, and ESN is not among them (DTN, Sep 23, 2026). The best public reference points come from University of Minnesota Extension. In 2020 its nutrient management specialists wrote that polymer-coated urea usually costs 16 to 20 cents more per pound of N than urea (Spackman and Fernandez, UMN Extension, May 2020). In March 2022, near the last nitrogen price peak, they priced ESN at $1,040 a ton against urea at $885. At 44% and 46% N, that is a premium of 22 cents a pound of N (Fernandez and Vetsch, UMN Extension, Mar 21, 2022).
Evidence: Applying that 16- to 22-cent range to DTN's current urea gives the table below. The coated-urea rows are estimates, not quotes.
| Product | $/ton | Analysis | $/lb N | Basis |
|---|---|---|---|---|
| Anhydrous ammonia | 945 | 82-0-0 | 0.58 | Retail, delivered, DTN avg |
| Urea | 659 | 46-0-0 | 0.72 | Retail, delivered, DTN avg |
| UAN32 | 458 | 32-0-0 | 0.72 | Retail, delivered, DTN avg |
| UAN28 | 421 | 28-0-0 | 0.76 | Retail, delivered, DTN avg |
| Polymer-coated urea, low premium | 771* | 44-0-0 | 0.88* | Urea + $0.16/lb N |
| Polymer-coated urea, mid premium | 798* | 44-0-0 | 0.91* | Urea + $0.19/lb N |
| Polymer-coated urea, 2022 premium | 824* | 44-0-0 | 0.94* | Urea + $0.22/lb N |
Source: DTN/Progressive Farmer retail fertilizer survey, week of Sep 14–18, 2026 (published Sep 23, 2026). *Crop Root Zone estimates: DTN urea at $0.716/lb N plus the premium ranges reported by University of Minnesota Extension (May 2020; Mar 21, 2022), converted at 880 lb N per ton of 44% product. They are not 2026 retail quotes. A dealer quote should replace them.
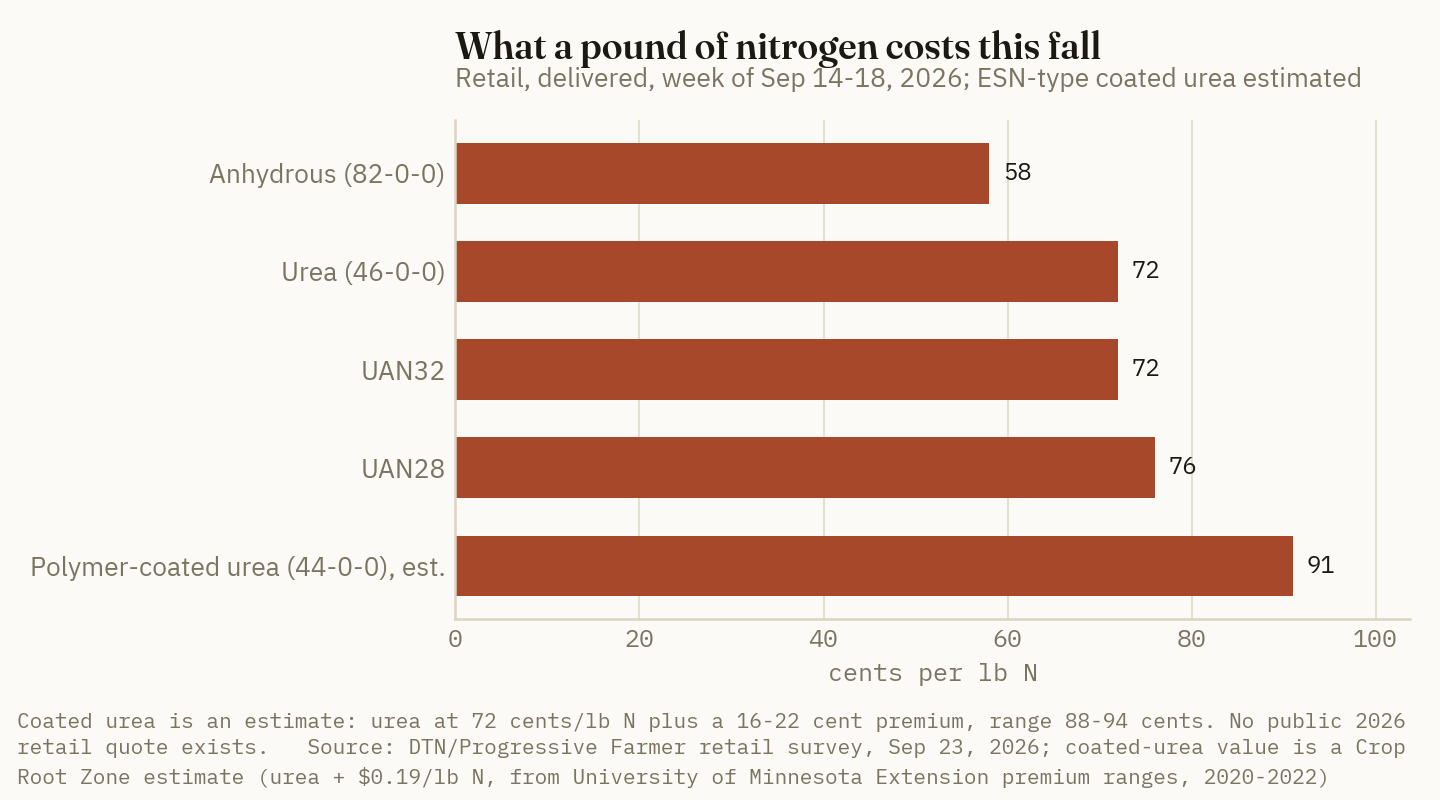
The spread in dollars per ton has held in a fairly narrow band while urea itself has moved. That changes what the coating costs as a share of the bill. In March 2022 the $155-a-ton spread was 18% of the urea price. At today's $659 urea, the same 16- to 22-cent premium is a $112 to $165 spread, or 17% to 25% of the urea price. Softer urea makes the coating a larger share of the nitrogen bill, not a smaller one.
Ground Truth: Urea is $226 a ton cheaper than it was in March 2022, and the coating has not become cheaper with it. The premium is a manufacturing cost, set by the polymer and the coating plant. It does not follow the nitrogen market. That means the case for coated urea is weaker in a year of moderate urea prices than in a spike. When urea was $885, the 22-cent coating cost the same as about 23 pounds of extra urea N per 100 pounds applied. At $659 the same 22 cents buys about 31 pounds, and even a 19-cent premium buys about 27. The alternative of simply applying more nitrogen got cheaper, and the coating did not.
2. The bushel hurdle, by program
What's new: Few growers apply a full rate of coated urea. University of Minnesota worked examples compare ESN alone with blends of two parts ESN to one part urea and one part ESN to two parts urea (UMN Extension, May 2020). The premium is paid only on the coated portion, so the blend ratio sets the hurdle.
Evidence: Dividing each program's premium by the corn price gives the yield gain it has to deliver over plain urea at the same rate.
| Program (150 lb N unless noted) | Coated lb N | Premium $/ac (16–22¢) | Bu to pay, $4.93 cash (mid) | Bu to pay, $5.28 Dec-27 (mid) |
|---|---|---|---|---|
| All coated, 180 lb N | 180 | 28.80–39.60* | 6.9 | 6.5 |
| All coated | 150 | 24.00–33.00* | 5.8 | 5.4 |
| 2:1 coated:urea | 100 | 16.00–22.00* | 3.9 | 3.6 |
| 1:1 coated:urea | 75 | 12.00–16.50* | 2.9 | 2.7 |
| 1:2 coated:urea | 50 | 8.00–11.00* | 1.9 | 1.8 |
| Fall coated vs fall anhydrous | 150 | 45.00–54.00* | 10.0 | 9.4 |
| Fall coated vs fall anhydrous + nitrapyrin | 150 | 30.00–39.00* | 7.0 | 6.5 |
Sources: DTN/Progressive Farmer (Sep 23, 2026) for urea at $0.716/lb N and anhydrous at $0.576/lb N; USDA AMS Illinois Grain Bids (Sep 25, 2026), Central Illinois country elevator average $4.93 and CBOT December 2027 settlement $5.28. *Premiums are Crop Root Zone estimates from the 16–22 cent range above; bushel columns use the 19-cent midpoint. The nitrapyrin cost of $0.10/lb N is a University of Minnesota Extension budgeting figure (Oct 21, 2025), not a 2026 quote.
5.8 bushels
The yield gain a full 150-lb coated-urea program must produce over plain urea to pay at $4.93 corn, at a mid-range 19-cent premium. A one-third blend needs 1.9. (Crop Root Zone estimate from DTN, Sep 23, 2026, and USDA AMS, Sep 25, 2026)
The last two rows matter most for a fall decision. A grower who spreads coated urea in the fall is almost never choosing between coated and uncoated urea. Minnesota's specialists describe fall urea in any form as a poor practice (Fernandez and Kaiser, UMN Extension, Oct 2020). The real fall alternative is anhydrous, which is 14 cents a pound of N cheaper than urea before any coating. The coated product must beat fall anhydrous by about 10 bushels, or fall anhydrous with an inhibitor by about 7, before it pays.
Ground Truth: The coated product carries a double premium in the fall. Growers pay once for choosing urea over ammonia and again for the coating. Together that is about 33 cents a pound of N, or roughly $50 an acre at 150 pounds. The same $50 buys about 86 more pounds of anhydrous. A fall coated-urea program only makes sense where anhydrous cannot go on at all, such as stony ground, fields with no toolbar access, or an operation with no ammonia supply, and not as a general way to protect fall nitrogen.
3. Where it has paid: water that sits, and water that runs through
What's new: The largest independent yield gains for polymer-coated urea in the Midwest come from two very different soils with the same problem. One is poorly drained claypan, where water sits on the claypan and nitrate is lost to denitrification. The other is coarse sand, where water moves through and nitrate is lost to leaching.
Evidence: On the Putnam silt loam claypan at Novelty, Missouri, University of Missouri researchers ran polymer-coated urea against non-coated urea from 2010 to 2013 with and without subsurface drainage. In the absence of drainage, the coated product raised corn yield 20% (Nash, Nelson, Motavalli and Anderson, Agronomy Journal 107(2), 2015). Yields in that study were low, at 4.76 to 5.75 Mg/ha, because 2010 was extremely wet and 2011 to 2013 brought drought. So the 20% gain is worth roughly 15 bushels, not 40. At the same site in 2008 to 2010, three high-rainfall years, deep-banded coated urea in strip-till raised yield 1.2 Mg/ha, about 19 bushels, over non-coated urea, whether applied in fall or preplant (Nash, Nelson and Motavalli, International Journal of Plant Production 7(3), 2013).
In Minnesota, on sandy loam near Becker in 2014 and 2015, ESN outyielded urea by 39 bushels when both were spring-applied at 120 pounds of N. The authors note that the gain matched what 200 pounds of preplant urea produced (Spackman and Fernandez, UMN Extension, May 2020). In Kentucky, studies at Lexington and Princeton found that on somewhat poorly drained soils, ESN applied at or before planting yielded significantly more than urea applied at the same time (Schwab and Murdock, UK Extension AGR-185, Apr 2010).
| Reported polymer-coated urea result vs plain urea | Bu/ac | 0–40 scale |
|---|---|---|
| Becker, Minn., sandy loam, spring, 120 lb N, 2014–15 | 39 | ██████████ |
| Novelty, Mo., claypan, strip-till band, fall or preplant, 2008–10 | 19 | █████░░░░░ |
| Novelty, Mo., claypan, undrained, 2010–13 (+20%) | ~15* | ████░░░░░░ |
| Break-even, full 150 lb coated, 19¢ premium, $4.93 corn | 5.8 | █░░░░░░░░░ |
| Break-even, 1:2 blend, 19¢ premium, $4.93 corn | 1.9 | ░░░░░░░░░░ |
| Waseca, Minn., clay loam, fall and spring | n.s. | ░░░░░░░░░░ |
| Two Iowa State research farms, 2013–14 | n.s. | ░░░░░░░░░░ |
| Southern Minn. fine-textured soils, 2014–15 | n.s. | ░░░░░░░░░░ |
| Kentucky well-drained soils | n.s. | ░░░░░░░░░░ |
Sources: UMN Extension (May 2020); Nash et al., Int. J. Plant Prod. 7(3), 2013 (1.2 Mg/ha converted at 15.93 bu per Mg/ha); Nash et al., Agron. J. 107(2), 2015; Vetsch and Randall, ASA-CSSA-SSSA Annual Meeting abstract, 2009; Barker and Sawyer, Crop, Forage & Turfgrass Management, 2017; Schwab and Murdock, UK AGR-185, Apr 2010. n.s. = no significant yield difference reported. *Estimate: the paper reports a 20% gain and a 4.76–5.75 Mg/ha yield range, not bushel values by treatment; ~15 bu assumes the uncoated, undrained check sat at the bottom of that range. Bars scaled to 40 bu = 10 blocks.
The trials that paid share three conditions. Water was in the wrong place early in the season. The nitrogen was spread on the surface or banded before the crop could use it. And the uncoated check was short of nitrogen as a result. When those conditions hold, the gains are two and a half to nearly seven times the break-even for a full coated program.
Ground Truth: The coating pays on two soil types, not one. It helps where water sits on a claypan or in a poorly drained swale, and where water runs through sand. It does little where the soil drains well and holds ammonium, which describes most of the central Corn Belt's best ground. A grower who knows which fields drowned out or showed yellow corn in the last three wet springs already has the most important input for this decision. That field history is worth more than the average yield response in any trial summary.
4. Where it hasn't: the well-drained majority, and the one-in-four problem
What's new: Iowa State researchers tested ESN and several urease and nitrification inhibitor products at two university research farms in 2013 and 2014 and found "no agronomic benefit" from any of them. They attributed the result to rain arriving soon after application, soils that held ammonium well, and cool soil temperatures that slowed nitrification (Barker and Sawyer, Crop, Forage & Turfgrass Management, 2017). At Waseca, on Minnesota clay loam, fall and spring ESN, urea and other sources at 112 kg N/ha gave no difference in yield, N uptake or nitrogen use efficiency between ESN and urea. The authors found "no economic advantage" for controlled-release sources (Vetsch and Randall, 2009). In Kentucky, the same studies that found gains on poorly drained soils found "no yield benefit" on well-drained ones, and ESN was not better than a split application of plain urea (AGR-185, Apr 2010).
Evidence: The Minnesota multi-site record gives the best estimate of how often the coating wins. Across 35 locations from 2014 to 2018, ESN yielded more than urea 26% of the time in corn after corn and 28% of the time in corn after soybeans (UMN Extension, May 2020). The authors report that ESN did not yield less than urea at any site, and that most sites were chosen for high nitrogen loss potential from weather or soil. In Illinois, University of Illinois trials at four sites from 2015 to 2018 found that broadcast ESN and SuperU at planting "produced the highest yields" among the treatments with all nitrogen applied at planting. That was a spring, at-planting result on corn after soybeans, not a fall one (Nafziger, farmdoc daily, Mar 29, 2019).
A win rate turns into a simple expected-value test. If the coating wins about 27% of the time and gives nothing otherwise, the average winning gain has to be large enough to cover the premium in all four years.
| Program at 19¢ premium, $4.93 corn | Break-even bu | Win rate (MN, 35 sites) | Needed average gain in a winning year |
|---|---|---|---|
| All coated, 150 lb N | 5.8 | 26–28% | ~21 bu* |
| 2:1 coated:urea | 3.9 | 26–28% | ~14 bu* |
| 1:2 coated:urea | 1.9 | 26–28% | ~7 bu* |
Sources: break-evens from Section 2; win rate from UMN Extension (May 2020). *Crop Root Zone arithmetic: break-even divided by a 27% win rate, assuming zero effect in non-winning years. The Minnesota sites were chosen for high loss potential, so the win rate on typical ground is likely lower.
A 21-bushel average gain in winning years is well within the range of the claypan and sand results in Section 3. It is well above anything seen on well-drained ground. That is why the same product can be a good buy on one farm and a waste on the next.
Ground Truth: The 26–28% win rate is the most misunderstood number in this debate. It was measured on sites chosen because they were likely to lose nitrogen. On a random, well-drained Corn Belt field, the chance the coating wins is lower, and the full-rate program needs 21-bushel wins to break even. Only the blends pass that test on ordinary ground, and only because they cost less. Put the coated share where the losses happen and plain urea or anhydrous everywhere else.
5. Fall 2026: warm soil, the wrong season and the right blend
What's new: Iowa State's agronomists put the odds of a very strong El Niño this fall and winter above 90%. They expect central Iowa soils to reach 50°F and falling 10 to 15 days later than the normal November 10 (Castellano, Andersen, Archontoulis and Baum, Iowa State ICM, Sep 10, 2026). That matters for coated urea because the coating's release rate depends on temperature. University of Wisconsin soil scientists noted that "the rate of urea release increases as temperature increases" (Bundy and Andraski, UW-Madison, 2007).
Evidence: The fall record for coated urea is the weakest part of its record. Across multiple years and regions of Minnesota, fall ESN outyielded fall urea only about 25% of the time. Averaged over all the studies, fall ESN yielded less than spring preplant urea (Fernandez and Kaiser, UMN Extension, Oct 2020; republished Jan 2024). At Novelty, preplant applications of coated urea, non-coated urea and anhydrous with or without nitrapyrin outyielded fall applications of the same sources by 1 to 1.2 Mg/ha, about 16 to 19 bushels (Nash et al., 2013). At Waseca, spring beat fall by 0.3 Mg/ha, about 5 bushels, across urea, ESN and a third source (Vetsch and Randall, 2009). In Kentucky wheat, fall ESN and fall urea yielded the same, while January ESN beat January urea (AGR-185, Apr 2010). A warm fall is when the coating releases fastest and the soil converts urea to nitrate fastest. Those are the conditions in which fall nitrogen is least protected.
| Fall 2026 decision | Well-drained silt loam | Poorly drained / claypan | Coarse / sandy |
|---|---|---|---|
| Fall-applied coated urea | Poor fit; anhydrous is ~10 bu cheaper to beat | Better than fall urea, but spring beat fall by 16–19 bu at Novelty | Avoid fall N of any form |
| Early-spring preplant, coated blend | Little evidence of gain; urea or UAN fine | Strongest case; 1:2 or 1:1 blend needs only 2–3 bu | Strong case; Becker +39 bu at 120 lb N |
| Full-rate coated, any season | Hurdle ~6 bu, rarely met | Can pay in wet springs | Can pay, but split urea often matches it |
| Alternative | Fall anhydrous after 50°F, or spring N | Spring N; split application | Split / sidedress urea |
Sources: Crop Root Zone synthesis of UMN Extension (May 2020; Oct 2020, rev. Jan 2024), Nash et al. (2013, 2015), Vetsch and Randall (2009), Barker and Sawyer (2017), UK AGR-185 (Apr 2010), Iowa State ICM (Sep 10, 2026) and break-evens from Section 2. The cells are this publication's reading of the trials, not trial outputs.
Minnesota's specialists come to the same conclusion. Polymer-coated urea works best applied preplant in wet conditions, not as a fall source or the only nitrogen source (Fernandez and Kaiser, UMN Extension, Oct 2020). Their worked example at sub-optimal rates on high-loss sites also favored blends. ESN alone added $49.50 an acre of revenue over urea, a 2:1 ESN-urea blend added $85.50, and a 1:2 blend added $72.50, at a 20-cent premium and $3.50 corn (UMN Extension, May 2020). Kentucky's extension guide adds a point about economics. Because the coating conserves nitrogen rather than creating yield, a grower captures the value only by cutting the total rate by the amount the coating is expected to save (AGR-185, Apr 2010). At Becker, 120 pounds of coated N did the work of 200 pounds of urea. On a claypan or sand field where that kind of saving is realistic, the rate cut pays for the coating by itself.
Ground Truth: For fall 2026, the decision is about the calendar and the field before it is about the product. On fields that can take anhydrous, wait for 50°F soil and use ammonia; fall coated urea has to beat it by about 10 bushels, and none of the trials reviewed here shows that it does. Keep the coated product for spring, on the claypan, swales and sands that have lost nitrogen before, and buy it as a one-third to one-half blend. At a 19-cent premium, that is $10 to $14 an acre and 2 to 3 bushels to recover. The Missouri and Minnesota results suggest that is a good bet on those acres, and one that is not needed on the rest.
References
- Quinn, R., DTN/Progressive Farmer, "Fertilizer Prices Rise for Six of Eight Major Fertilizers," Sep 23, 2026 (survey week Sep 14–18, 2026) — https://www.dtnpf.com/agriculture/web/ag/crops/article/2026/09/23/fertilizer-prices-rise-six-eight
- USDA AMS Livestock, Poultry and Grain Market News / Illinois Dept. of Agriculture, Illinois Grain Bids (report 3192), Sep 25, 2026 — https://www.ams.usda.gov/mnreports/ams_3192.pdf
- Spackman, J.; Fernandez, F., "Are controlled-release nitrogen fertilizers worth the cost?," University of Minnesota Extension Crop News, May 2020 (republished Jan 2024) — https://blog-crop-news.extension.umn.edu/2020/05/are-controlled-release-nitrogen.html
- Fernandez, F.; Vetsch, J., "High nitrogen fertilizer prices: Is now the time to try polymer-coated urea?," University of Minnesota Extension Crop News, Mar 21, 2022 — https://blog-crop-news.extension.umn.edu/2022/03/high-nitrogen-fertilizer-prices-is-now.html
- Fernandez, F.; Kaiser, D., "Should corn growers consider polymer-coated urea?," University of Minnesota Extension Crop News, Oct 2020 (republished Jan 1, 2024) — https://blog-crop-news.extension.umn.edu/2020/10/should-corn-growers-consider-polymer.html
- Carlson, B., "With high nitrogen fertilizer prices and low corn prices, can you decrease your nitrogen rate for 2026?," University of Minnesota Extension Crop News, Oct 21, 2025 — https://blog-crop-news.extension.umn.edu/2025/10/with-high-nitrogen-fertilizer-prices.html
- Nash, P.R.; Nelson, K.A.; Motavalli, P.P.; Anderson, S.H., "Corn Yield Response to Managed Drainage and Polymer-Coated Urea," Agronomy Journal 107(2):435–441, 2015 (abstract via FAO AGRIS) — https://doi.org/10.2134/agronj14.0273 ; https://agris.fao.org/search/en/records/65df8f607c7033e84bee212d
- Nash, P.; Nelson, K.; Motavalli, P., "Corn yield response to polymer and non-coated urea placement and timings," International Journal of Plant Production 7(3):374–392, 2013 (open access) — https://ijpp.gau.ac.ir/article_1110.html
- Schwab, G.J.; Murdock, L.W., Nitrogen Transformation Inhibitors and Controlled Release Urea, University of Kentucky Cooperative Extension AGR-185, Apr 2010 — https://publications.mgcafe.uky.edu/sites/publications.ca.uky.edu/files/agr185.pdf
- Barker, D.W.; Sawyer, J.E., "Evaluation of Nitrogen Fertilizer Additives for Enhanced Efficiency in Corn on Iowa Soils," Crop, Forage & Turfgrass Management, 2017 — https://doi.org/10.2134/cftm2017.02.0010
- Vetsch, J.; Randall, G., "Nitrogen Source, Timing, and Placement for Corn," ASA-CSSA-SSSA Annual Meeting abstract, Nov 2009, University of Minnesota Southern Research and Outreach Center, Waseca — https://scisoc.confex.com/scisoc/2009am/webprogram/Paper54202.html
- Nafziger, E., "Managing Nitrogen for Corn in 2019," farmdoc daily, University of Illinois, Mar 29, 2019 — https://farmdocdaily.illinois.edu/2019/03/managing-nitrogen-for-corn-in-2019.html
- Castellano, M.; Andersen, D.; Archontoulis, S.; Baum, M., "Fifty and Falling: What the Super El Niño Means for Anhydrous Ammonia and Manure Timing this Fall," Iowa State University Integrated Crop Management, Sep 10, 2026 — https://crops.extension.iastate.edu/post/fifty-and-falling-what-super-el-nino-means-anhydrous-ammonia-and-manure-timing-fall
- Bundy, L.; Andraski, T., "Polymer-Coated Urea (ESN) for Corn," University of Wisconsin-Madison Department of Soil Science, 2007 — https://extension.soils.wisc.edu/wcmc/polymer-coated-urea-esn-for-corn-2/
Disclosures
Crop Root Zone is an independent publication. Nothing here is investment advice. Market calls, where included, reflect the editors' own read and are not a recommendation to buy or sell any security.
Liquid 10-34-0 Costs $1.06 a Pound of Phosphate and MAP Costs $0.93. At a Starter Rate the Gap Is About $2.50 an Acre. Whether the Starter Pays at All Is the Bigger Number.
Liquid phosphate's premium over MAP has narrowed from 30% in fall 2022 to 14% this week and grew into spring in three of the last four seasons. On P-sufficient Indiana ground a 3-gallon pop-up paid in one of 21 trials, so the soil test matters more than the price sheet.
Retail 10-34-0, the liquid ammonium polyphosphate most North American corn planters carry as starter, averaged $718 a ton in DTN's survey for Sep 14-18, 2026. MAP averaged $967 and DAP $925 (DTN, Sep 23, 2026). A ton of 10-34-0 holds 680 pounds of P2O5, against 1,040 in MAP and 920 in DAP. So the liquid costs $1.056 a pound of phosphate, MAP costs $0.930 and DAP $1.005. That makes liquid phosphate 13.6% dearer than MAP. It is fall booking season for next spring's starter, so the fair question is whether the premium is worth paying. The answer here is that the premium is about $2.50 an acre at most. The larger question is the whole $12 to $21 an acre the starter costs, and the evidence on that depends on the soil test.
1. What a pound of phosphate costs in each form this week
What's new: All three phosphate products barely moved in the past month. 10-34-0 rose from $715 to $718, MAP from $959 to $967 and DAP from $916 to $925 against the Aug 17-21 survey week (DTN, Sep 23, 2026). Year on year, 10-34-0 is the fastest riser of the three at +8%, against +5% for MAP and +2% for DAP (DTN, Sep 23, 2026).
Evidence: The per-pound comparison has to credit the nitrogen, because all three carry some. MAP is 11-52-0, DAP is 18-46-0 and 10-34-0 is 10-34-0 by weight. We value that nitrogen two ways. The first uses the same survey week's anhydrous price, $945/ton or $0.58/lb N, which is the cheapest nitrogen on the board and so a conservative credit. The second uses urea at $659/ton or $0.72/lb N (DTN, Sep 23, 2026). The ranking holds under both.
| Product | Retail $/ton | lb P2O5/ton | lb N/ton | $/lb P2O5, no N credit | N credited at anhydrous | N credited at urea | Basis |
|---|---|---|---|---|---|---|---|
| 10-34-0 | 718 | 680 | 200 | 1.056 | 0.886 | 0.845 | Retail, national avg. |
| DAP (18-46-0) | 925 | 920 | 360 | 1.005 | 0.780 | 0.725 | Retail, national avg. |
| MAP (11-52-0) | 967 | 1,040 | 220 | 0.930 | 0.808 | 0.778 | Retail, national avg. |
Source: DTN retail fertilizer survey, week of Sep 14-18, 2026 (published Sep 23, 2026); per-pound values are Crop Root Zone calculations from those prices and the stated analyses.
Without a nitrogen credit, MAP is the cheapest phosphate and 10-34-0 the dearest. With a credit, DAP moves to the bottom because it carries the most nitrogen, and 10-34-0 stays on top under both credits. Its premium is 12.6 cents a pound of P2O5 over MAP on a raw basis. With nitrogen credited at anhydrous it is 7.8 cents over MAP and 10.6 cents over DAP.
$1.056/lb P2O5
Retail 10-34-0 at $718/ton, per pound of phosphate, before any nitrogen credit. MAP is $0.930 and DAP $1.005. (DTN survey, Sep 14-18, 2026; Crop Root Zone calculation)
Ground Truth: Ask for the liquid quote per pound of P2O5, not per ton or per gallon. At $718 a ton, 10-34-0 looks about $250 cheaper than MAP. Per unit of phosphate it is the most expensive of the three, whichever nitrogen credit you use. The per-ton gap makes the liquid look cheap and the per-pound number shows it is not.
2. The liquid premium is less than half what it was in 2022
What's new: The same arithmetic applied to the same mid-to-late-September survey week in each of the past five years shows how much the liquid premium has narrowed. In September 2022, 10-34-0 cost $861 a ton, or $1.266 a pound of P2O5, against $0.970 for MAP. That was a 30.5% premium (DTN, Sep 21, 2022). It fell to 20.1% in late September 2023 (DTN, Oct 4, 2023), then 11.6% in 2024 and 10.8% in 2025 (DTN, Sep 24, 2025). It is 13.6% this week.
Evidence:
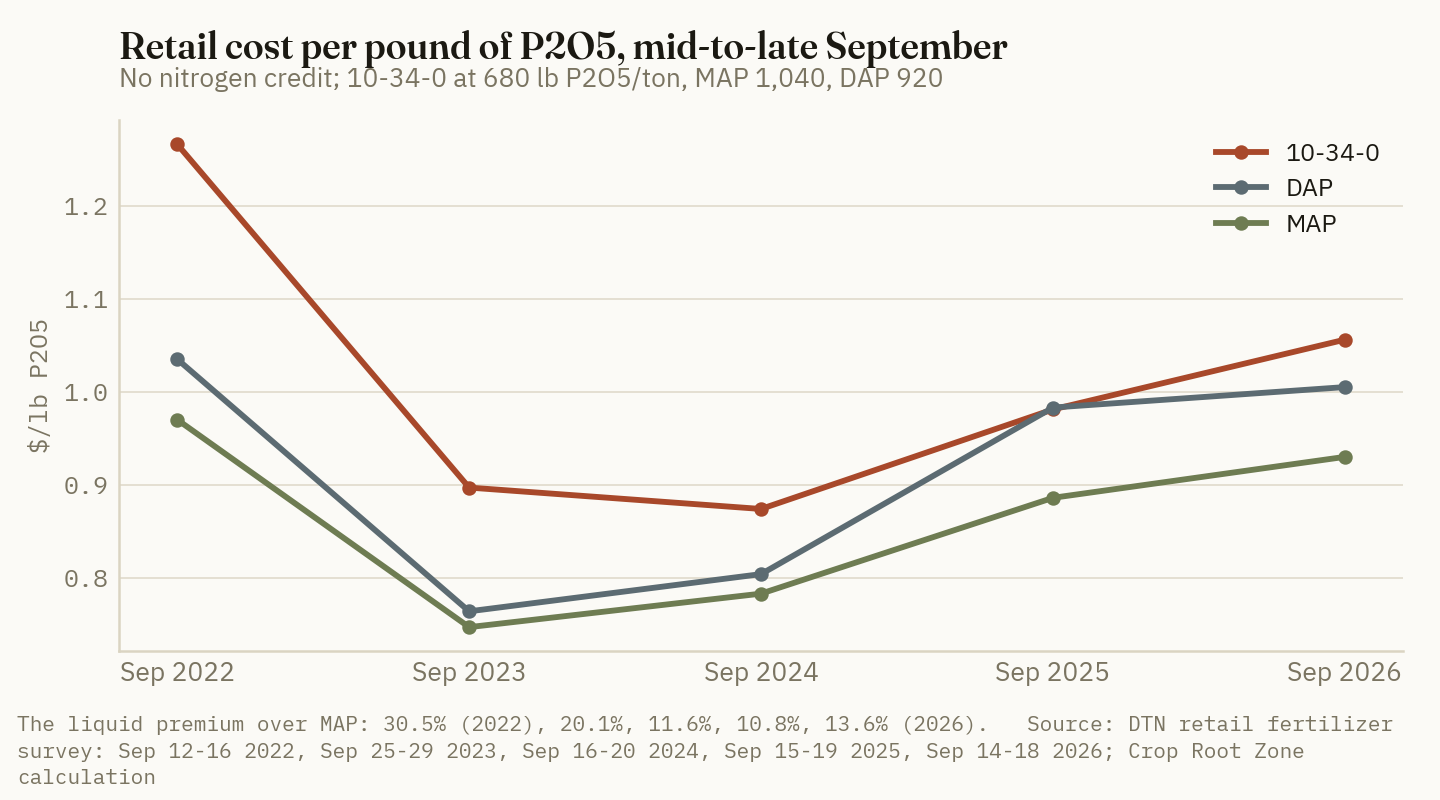
| Survey week | 10-34-0 $/ton | MAP $/ton | DAP $/ton | 10-34-0 $/lb P2O5 | MAP $/lb P2O5 | Liquid premium over MAP |
|---|---|---|---|---|---|---|
| Sep 12-16, 2022 | 861 | 1,009 | 952 | 1.266 | 0.970 | +30.5% |
| Sep 25-29, 2023 | 610 | 777 | 703 | 0.897 | 0.747 | +20.1% |
| Sep 16-20, 2024 | 594 | 814 | 740 | 0.874 | 0.783 | +11.6% |
| Sep 15-19, 2025 | 667 | 921 | 904 | 0.981 | 0.886 | +10.8% |
| Sep 14-18, 2026 | 718 | 967 | 925 | 1.056 | 0.930 | +13.6% |
Source: DTN retail fertilizer survey (national average, retail): Sep 21, 2022; Oct 4, 2023; Sep 24, 2025 (which gives both the 2025 week and the Sep 16-20, 2024 year-ago prices); Sep 23, 2026. The 2023 row is the fourth September week because it was the closest one we could retrieve. Per-pound values and premiums are Crop Root Zone calculations.
Two things stand out. First, the premium roughly halved between 2022 and 2024 and has stayed between 11% and 14% since. The price series does not show why. One explanation to test, which we have not verified, is that 10-34-0 lost some of the extra margin it carried during the 2022 price spike faster than the dry products did. Second, in September 2025 the liquid cost the same per pound of P2O5 as DAP: $0.981 against $0.983. A year later it is 5 cents over DAP again. 10-34-0 rose 8% over the year and DAP 2%, and that difference is the whole change (DTN, Sep 23, 2026).
Ground Truth: Before 2023 the liquid premium could reach 30%, and that was enough to argue for dry MAP banded with the planter or a starter cut to a token rate. At 11-14% the product price no longer decides anything much. What decides the starter now is agronomy and planter setup, which Section 4 covers.
3. The premium in dollars an acre and in bushels
What's new: Per-pound premiums are abstract. The planter puts on gallons. Ohio State's agronomy crops teaching material converts 10-34-0 at 11.65 pounds a gallon (Ohio State University Agronomic Crops Team, n.d.). Supplier labels vary a little around that figure. At 11.65 lb/gal, 3 gallons an acre delivers 11.9 lb P2O5 and 3.5 lb N, and 5 gallons delivers 19.8 lb P2O5 and 5.8 lb N.
Evidence: We priced the same phosphate delivered as MAP instead. The premium is what the liquid costs above that, less the value of the extra nitrogen the liquid carries.
| Starter rate | 10-34-0 cost/acre | Same P2O5 as MAP, cost/acre | Raw premium | Premium net of extra N (anhydrous credit) | Premium net of extra N (urea credit) |
|---|---|---|---|---|---|
| 3 gal/acre (11.9 lb P2O5) | $12.55 | $11.05 | $1.50 | $0.93 | $0.80 |
| 5 gal/acre (19.8 lb P2O5) | $20.91 | $18.41 | $2.50 | $1.55 | $1.33 |
Source: prices from DTN retail fertilizer survey, Sep 14-18, 2026 (published Sep 23, 2026); 11.65 lb/gal from Ohio State University Agronomic Crops Team; per-acre values are Crop Root Zone calculations.
To put that in grain, we use December 2026 corn futures, which closed at $5.275 on Sep 24 (Brownfield Ag News, Sep 24, 2026). This is only a scale. It excludes local basis, and the 2027 crop will be priced off a later contract. The bars below compare two things: the bushels it takes to cover the liquid premium, and the bushels it takes to cover the whole starter if it adds nothing to the crop's phosphate plan.
| What has to be paid for | Bushels of corn at $5.275 | |
|---|---|---|
| 5 gal 10-34-0, whole product | 3.96 | ██████████ |
| 3 gal 10-34-0, whole product | 2.38 | ██████░░░░ |
| 5 gal premium over MAP, net of N | 0.29 | █░░░░░░░░░ |
| 3 gal premium over MAP, net of N | 0.18 | ░░░░░░░░░░ |
Source: Crop Root Zone calculation from DTN retail prices (Sep 14-18, 2026) and the Dec 2026 corn futures close (Brownfield Ag News, Sep 24, 2026); N credited at anhydrous. The 3-gallon premium rounds to less than half a block.
The whole-product cost is 8 to 13 times the premium. If the starter phosphate replaces phosphate you would have broadcast anyway, the extra cost of going liquid is the net premium, less than a third of a bushel. If the starter goes on top of a full broadcast program, as it often does, the 2.4 to 4 bushels has to come from yield.
Ground Truth: The liquid-versus-dry price gap is worth at most about $2.50 an acre this fall, so haggling over it saves little. Check whether next spring's broadcast P rate is reduced to account for the starter phosphate. If it is not, the starter costs $12.55 to $20.91 an acre, and that is the number that needs a yield response to justify it.
4. What the trials say you get for the $12 to $21
What's new: Two land-grant data sets bracket the answer, and they differ mainly by soil-test phosphorus.
Evidence: Purdue's Camberato and Nielsen summarised 55 field-scale Indiana trials run from 2014 to 2022 (Purdue University, Jan 2023). In-furrow "pop-up" starter at 3 gal/acre of 10-34-0, or 5 gal of 6-24-6, raised yield in one of 21 trials, by 6.1 bu/acre. It lowered yield in two others, by 3.3 and 5.4 bu/acre, and had no detectable effect in the remaining 18. The report's body text counts 20 trials, not 21. The authors concluded that pop-up starter gave essentially no yield benefit and only about a 0.6-point drop in harvest moisture. Nitrogen-bearing 2x2 starter at 23-50 lb N raised yield in 24 of 55 trials, by an average of 7 bu/acre. The authors identified the nitrogen, not the phosphorus, as the main driver. Their report also says the difference between granular MAP or DAP phosphorus and 10-34-0 phosphorus is "only a few dollars per acre" at common prices, which our Section 3 arithmetic confirms for 2026.
North Dakota State's Carrington Research Extension Center tested 10-34-0 over eight site-years from 2008 to 2016 (NDSU Extension, A1851, rev. Apr 2022). Soil-test P ran 3 to 20 ppm Olsen, and most sites were at 8 ppm or less. There, banded and in-furrow 10-34-0 raised yield an average of 5 to 7 bu/acre, or 4% to 5%. The 3- and 6-gallon in-furrow rates produced similar gains, although not every site-year responded. Iowa State's Mallarino describes the same pattern more generally. Starter reliably increases early growth, but its grain-yield effect is much less consistent, and responses are more likely on low-testing, poorly drained, cool or reduced-tillage ground (Iowa State University Extension, Mar 2015).
| Trial set | Soil-test P context | Starter | Yield result | At $5.275 corn vs. whole-product cost |
|---|---|---|---|---|
| Purdue, Indiana, 2014-22 | Mixed commercial fields | 3 gal 10-34-0 in-furrow | +6.1 bu in 1 of 21 trials; −3.3 and −5.4 in 2; none in 18 | Trial average about −0.1 bu*, against a 2.4 bu cost |
| Purdue, Indiana, 2014-22 | Mixed commercial fields | 2x2, 23-50 lb N | +7 bu avg. in 24 of 55 trials | N-driven; not a phosphate-price question |
| NDSU Carrington, 2008-16 | Olsen 3-20 ppm, mostly ≤8 | 3 and 6 gal 10-34-0 | +5 to 7 bu avg. over 8 site-years | $26 to $37/acre of grain against $12.55 to $25.09 of product |
Source: Purdue University Soil Fertility Update, Jan 2023; NDSU Extension A1851, rev. Apr 2022; product costs from DTN retail prices, Sep 14-18, 2026; Dec 2026 corn close from Brownfield Ag News, Sep 24, 2026. *Crop Root Zone arithmetic: (6.1 − 3.3 − 5.4) ÷ 21 trials; this is an illustration, not a statistical estimate.
On low-P North Dakota ground, the average response covers the starter's cost at every combination of rate and response in that range. The margin runs from barely (5 bushels at 6 gallons) to nearly three times over (7 bushels at 3 gallons). On Indiana fields in the Purdue set, the 3-gallon pop-up did not cover its cost on average. The per-pound price difference between 10-34-0 and MAP does not change either result.
Ground Truth: Decide on a field-by-field basis with the soil test, not the price sheet. On ground testing low in P, or on cold, wet or no-till ground, 10-34-0 at current prices pays for itself with room to spare. On ground testing optimum or higher, the 3-gallon pop-up has no demonstrated return, and cutting its $12.55 an acre saves more than any product switch. If the planter already runs a 2x2 system, the Purdue data point to its nitrogen as the reason it pays.
5. Fall price or spring price: when to book the starter
What's new: 10-34-0 is used mainly in spring, but retailers quote and book it in fall. In three of the last four seasons, the spring price was higher than the fall price.
Evidence: We compared each mid-to-late-September price with the mid-to-late-April price that followed.
| Season | 10-34-0 Sep → Apr | Change | MAP Sep → Apr | Change | Liquid premium over MAP, Sep → Apr |
|---|---|---|---|---|---|
| 2022-23 | 861 → 740 | −14.1% | 1,009 → 809 | −19.8% | 30.5% → 39.9% |
| 2023-24 | 610 → 641 | +5.1% | 777 → 830 | +6.8% | 20.1% → 18.1% |
| 2024-25 | 594 → 656 | +10.4% | 814 → 821 | +0.9% | 11.6% → 22.2% |
| 2025-26 | 667 → 722 | +8.2% | 921 → 939 | +2.0% | 10.8% → 17.6% |
Source: DTN retail fertilizer survey (national average, retail): September weeks as in Section 2; April weeks Apr 10-13, 2023 (DTN, Apr 19, 2023), Apr 15-19, 2024 (DTN, Apr 24, 2024), Apr 21-25, 2025 and Apr 20-24, 2026 (DTN, Apr 29, 2026). Survey weeks differ by up to about 10 days from year to year. Changes and premiums are Crop Root Zone calculations.
In three of the four seasons, 10-34-0 rose more from September to April than MAP did, or fell less. In the two most recent seasons it rose 8% to 10% while MAP rose 1% to 2%. That gap is what pushed the spring liquid premium to 17.6% to 22.2%. The exception, 2023-24, was a season when all phosphate firmed. MAP rose slightly faster than the liquid that year, and the premium narrowed by two points. Four seasons is a small sample and one of them falls in the 2022-23 price collapse, so treat this as a pattern, not a rule. For scale: at 5 gallons an acre, the 2025-26 fall-to-spring rise added $1.60 an acre.
Ground Truth: The one timing pattern in this data is that the liquid premium has usually been narrowest in fall. If a field is going to get 10-34-0 next spring, booking it at the fall price has avoided a seasonal rise in three of four recent years. On current prices that is worth about $1 to $2 an acre. It is not a reason to put starter on ground where Section 4 says it does not pay. The saving is smaller than the premium in Section 3, and both are small next to the $12.55 to $20.91 an acre of the product itself.
What to watch
- The 10-34-0 year-on-year rate. It is the fastest-rising phosphate at +8% (DTN, Sep 23, 2026). If it keeps outpacing MAP through winter, the spring premium will likely reach the 18-22% seen in the past two Aprils.
- October DTN surveys. If the premium over MAP moves above about 15% before winter, the spring widening seen in the past two seasons will have started early.
- Next spring's broadcast P rate. This fall's P&K plan sets whether the starter phosphate is replacing broadcast phosphate or adding to it, and that is what separates the $1.55 premium from the $20.91 bill.
References
- DTN/Progressive Farmer (R. Quinn), "Fertilizer Prices Rise for Six of Eight Major Fertilizers," Sep 23, 2026 (survey week Sep 14-18, 2026; month-ago Aug 17-21, 2026). https://www.dtnpf.com/agriculture/web/ag/crops/article/2026/09/23/fertilizer-prices-rise-six-eight
- DTN/Progressive Farmer, "DAP Continues to Lead Fertilizer Prices Higher," Sep 24, 2025 (survey week Sep 15-19, 2025; year-ago Sep 16-20, 2024). https://www.dtnpf.com/agriculture/web/ag/crops/article/2025/09/24/dap-continues-lead-fertilizer-prices
- DTN/Progressive Farmer, "Fertilizer Prices Moving in Two Different Directions," Oct 4, 2023 (survey week Sep 25-29, 2023). https://www.dtnpf.com/agriculture/web/ag/crops/article/2023/10/04/fertilizers-moving-two-different
- DTN/Progressive Farmer, "Retail Fertilizer Prices Mixed in Mid-September 2022," Sep 21, 2022 (survey week Sep 12-16, 2022). https://www.dtnpf.com/agriculture/web/ag/crops/article/2022/09/21/retail-fertilizer-prices-mixed-mid
- DTN/Progressive Farmer, "Anhydrous Again Leads All Eight Major Fertilizer Prices Lower," Apr 19, 2023 (survey week Apr 10-13, 2023). https://www.dtnpf.com/agriculture/web/ag/crops/article/2023/04/19/anhydrous-leads-eight-major-prices
- DTN/Progressive Farmer, "All Major Fertilizer Prices Continue Higher for Fourth Consecutive Week," Apr 24, 2024 (survey week Apr 15-19, 2024). https://www.dtnpf.com/agriculture/web/ag/crops/article/2024/04/24/major-fertilizer-prices-continue
- DTN/Progressive Farmer, "10-34-0 Leads Fertilizer Prices Higher," Apr 29, 2026 (survey week Apr 20-24, 2026; year-ago Apr 21-25, 2025). https://www.dtnpf.com/agriculture/web/ag/crops/article/2026/04/29/10-34-0-leads-fertilizer-prices
- Ohio State University Agronomic Crops Team, "Exercise 2: Determining a Phosphorus Nutrient Recommendation and Fertilizer Rate," n.d. (10-34-0 at 11.65 lb/gal). https://agcrops.osu.edu/sites/agcrops/files/imce/Exercise%202.%20Determining%20Phosphorus%20Nutrient%20Recommendation%20and%20Fertilizer%20Rate.%20docx-1.pdf
- J. Camberato and R.L. Nielsen, "Corn Response to Starter Fertilizer in Indiana," Purdue University Soil Fertility Update, Jan 2023. https://www.agry.purdue.edu/ext/corn/research/updates/CornRespStarter.pdf
- G. Endres et al., "Corn Response to Phosphorus Starter Fertilizer in North Dakota," NDSU Extension A1851, revised Apr 2022. https://www.ndsu.edu/agriculture/extension/publications/corn-response-phosphorus-starter-fertilizer-north-dakota
- A. Mallarino, "Starter Fertilization Sometimes Boosts Corn Yield," Iowa State University Extension, Integrated Crop Management, Mar 2015. https://crops.extension.iastate.edu/cropnews/2015/03/starter-fertilization-sometimes-boosts-corn-yield
- Brownfield Ag News, "Closing Grain and Livestock Futures: September 24, 2026," Sep 24, 2026 (Dec 2026 corn $5.27½). https://www.brownfieldagnews.com/market-news/closing-grain-and-livestock-futures-september-24-2026/
Disclosures
Crop Root Zone is an independent publication. Nothing here is investment advice. Market calls, where included, reflect the editors' own read and are not a recommendation to buy or sell any security.
The Urea Curve Charges $17 a Ton to Carry Nitrogen From September to March. In the Last Two Springs It Missed by $74 and $105.
CME's Gulf urea contract settled at $458 a short ton for September and $475 for March 2027 on Sep 23. That is a 3.7% contango, worth about $3.33 an acre on a 180-lb spring urea program if it reaches the retail counter in full. Priced through the NOLA-to-retail spreads of recent springs, the curve points to spring 2027 retail urea of about $611 to $676 a ton. Today's price is $659, so the curve is saying spring costs about what September costs. The April and May 2027 contracts carry an untraded, unchanged $407.50 that we do not treat as a price, and the UAN contract has no usable forward at all. In the two springs we could reconstruct from published swap quotes, the curve two to three months out under-called the spring price by 20% and 28%. The contango is a rounding error inside the curve's own miss.
On Sep 23 the CME urea contract for granular FOB US Gulf settled at $458 a short ton for September and $475 for March 2027 (Farmbucks, relaying CME/DTN data, Sep 23, 2026). That $17 is everything the futures market is charging to move a ton of urea from this month's barge market to the last priced month before spring application. At urea's 46% nitrogen it works out to 1.85 cents a pound of N, or $3.33 an acre on a 180-lb spring program. Retail urea averaged $659 a ton in the Sep 14–18 survey (DTN/Progressive Farmer, Sep 23, 2026). If spring retail follows the curve, a grower who waits pays about what one who buys today pays. That is the headline read, and it rests on two further questions this piece works through. The first is what the curve actually covers, since the April and May contracts that line up with the application window do not trade. The second is how good this curve has been at calling a spring. We rebuilt two recent seasons from published swap quotes. In both, the curve came in well under the spring price.
1. What the curve says, and where it stops
What's new: The Gulf urea chain is almost flat from now to the end of the first quarter. It dips $4 to $6 into November and December, then steps up $21 in January and holds there through March.
Evidence: The CME contract settles each month on the average of daily ICIS and Profercy US Gulf barge assessments for that month, in short tons (CME Group contract specifications; see TRZ-0126). The September contract is therefore already mostly set by barges traded this month, and we use it as "today."
| Contract month | Settle, $/st | vs. Sep, $/st | vs. Sep | vs. Sep, $/lb N | vs. Sep, $/acre at 180 lb N |
|---|---|---|---|---|---|
| Sep 2026 | 458.00 | — | — | — | — |
| Oct 2026 | 460.00 | +2.00 | +0.4% | +0.0022 | +0.39 |
| Nov 2026 | 455.00 | −3.00 | −0.7% | −0.0033 | −0.59 |
| Dec 2026 | 454.00 | −4.00 | −0.9% | −0.0043 | −0.78 |
| Jan 2027 | 475.00 | +17.00 | +3.7% | +0.0185 | +3.33 |
| Feb 2027 | 475.00 | +17.00 | +3.7% | +0.0185 | +3.33 |
| Mar 2027 | 475.00 | +17.00 | +3.7% | +0.0185 | +3.33 |
| Apr 2027 | 407.50* | — | — | — | — |
| May 2027 | 407.50* | — | — | — | — |
Source: Farmbucks urea (US Gulf) futures chain, last update Sep 23, 2026, 15:52 CT, data from DTN, CME Group and ICE; TradingView CBOT UFV contract pages, accessed Sep 24, 2026. Basis: FOB US Gulf barge, $/short ton, monthly-average settlement. $/lb N and $/acre are Crop Root Zone calculations at 920 lb N per short ton of urea and 180 lb N per acre. *April and May 2027 show "no trades" and an identical, unchanged $407.50. We treat these as placeholder settlements, not market prices. The reasons are below.
The chain a grower can actually read stops at March. TradingView lists the April and May 2027 contracts, with expiries of May 4 and June 2, 2027, at $407.50 each. Neither has traded, and neither moved in the 24 hours in which March fell $2.50. Over the past month the March contract rose 14.5% (TradingView, accessed Sep 24, 2026). An April value unchanged through that rally is not tracking the market. Taken at face value, it would put a $67.50 (14%) drop between the March and April averages, right as spring demand peaks. None of the 2025 curves we reconstruct in Section 3 had anything close to that. On Feb 19, 2025, April traded $10 under March. On Mar 25, 2025, it was about $13 under. So we treat March 2027, at $475, as the curve's spring number, and we note that the curve's usual shape puts April at or a little below March.
UAN is worse. CME lists a UAN FOB NOLA contract. The October 2026 and March 2027 months both show $487.50, no trades and no change (TradingView, accessed Sep 24, 2026). A UAN barge value of $487.50 would sit above today's retail UAN32 at $458 and UAN28 at $421 (DTN/Progressive Farmer, Sep 23, 2026). That is not a wholesale price. There is no public UAN forward curve for spring 2027 that we could find. A UAN buyer is left using the urea curve as a proxy, on the working assumption that liquid N follows dry N. That assumption has held loosely in recent seasons. It is not a hedge relationship.
Ground Truth: The one readable forward curve for spring nitrogen is flat. The $17 step from September to March is smaller than the one-week swing in this month's barge market. It does not tell a grower to buy now or to wait. What it does say is that the people who trade Gulf urea for a living see no reason, at today's prices, to pay up for spring. The curve's usefulness comes from its level, not its slope.
2. From a Gulf barge to a spring acre
What's new: Priced through the NOLA-to-retail spreads seen in recent seasons, the $475 March contract implies spring 2027 retail urea of about $611 to $676 a ton. That is $0.66 to $0.73 a pound of N, against $0.72 today.
Evidence: Nobody buys urea at a Gulf barge. The spread between NOLA and the retail counter is the part the curve cannot see, and it moves. We measured it at four points where a DTN retail survey and a published NOLA barge level line up.
| Point | DTN retail urea, $/ton | NOLA barge, $/st | Spread, $/ton |
|---|---|---|---|
| Mid-April 2025 | 577 | 410 (Apr 14–18 range $400–420) | 167 |
| Late February 2026, pre-war | 611 | 475 (week average) | 136 |
| Mid-April 2026 | 858 | 710 (week to Apr 17, range $640–780) | 148 |
| Mid-September 2026 | 659 | 458 (Sep contract) | 201 |
Source: DTN/Progressive Farmer retail surveys Apr 14–18, 2025 (Apr 23, 2025), Feb 23–27, 2026 (Mar 4, 2026), Apr 13–17, 2026 (Apr 22, 2026) and Sep 14–18, 2026 (Sep 23, 2026). NOLA: Genesis Fertilizers, Apr 23, 2025 (prior-week range); CRU via DTN/Progressive Farmer, Mar 4, 2026; Advanced Turf Solutions market summary, Apr 27, 2026 (prior-week range); CME September 2026 settle via Farmbucks, Sep 23, 2026. Spread is a Crop Root Zone calculation, retail short ton minus barge short ton. Barge midpoints are range midpoints.
Today's $201 spread is wider than any of the three spring readings, but it is narrowing. In mid-August retail urea was $678 (DTN/Progressive Farmer, Aug 19, 2026), and StoneX's Josh Linville put August NOLA trading "around $380" (WWBL, Aug 12, 2026). That was a spread of roughly $298. Since then the barge has risen about $78 while retail has fallen $19. The retail counter is still passing along a decline, not a rally. That matters for the next table. Spring-season spreads have run $136 to $167, and the September spread is carrying margin that spring competition has tended to squeeze out.
| Spread assumption | Spread, $/ton | Implied spring retail, $/ton | $/lb N | $/acre at 180 lb N | vs. today, $/acre |
|---|---|---|---|---|---|
| Late Feb 2026 (tightest) | 136 | 611 | 0.664 | 119.54 | −9.39 |
| Mid-Apr 2026 | 148 | 623 | 0.677 | 121.89 | −7.04 |
| Mid-Apr 2025 | 167 | 642 | 0.698 | 125.61 | −3.32 |
| Today's spread holds | 201 | 676 | 0.735 | 132.26 | +3.33 |
| Today, for reference | — | 659 | 0.716 | 128.93 | — |
Source: Crop Root Zone calculation from the March 2027 settle of $475/st (Farmbucks, Sep 23, 2026) plus each spread in the previous table. Per-pound and per-acre values use 920 lb N per ton and a 180 lb N spring urea program. These are arithmetic scenarios, not forecasts.
The curve's central message, then: on a spring-applied 180-lb urea program, spring 2027 costs somewhere between $9 an acre less and $3 an acre more than today. Two other public references are worth setting next to it, because neither is a futures market and both land higher. Agricultural economist Greg Ibendahl's econometric model, which is driven by the European gas futures curve and fitted to DTN retail prices since 2009, has national retail urea rising from $678 to a peak of $705 in April 2027 (Ibendahl, Agricultural Economics, Sep 6, 2026). That would be $0.766 a pound of N, or $137.93 an acre, about $9 above today. His stated twelve-month error on urea is $109 a ton. A North Dakota State University team published Strait of Hormuz scenarios in April. Their spring 2027 NOLA top-off prices were $542 a ton if shipping reopened quickly, $590 under contested transit and $791 under extended conflict (farmdoc daily, Apr 29, 2026). The futures sit $67, or 14%, under even the mildest of those.
$17/st
The whole contango from the September 2026 Gulf urea contract to March 2027. On a 180-lb spring urea program it comes to $3.33 an acre, if it passes to retail dollar for dollar. (Crop Root Zone calculation from CME settlements relayed by Farmbucks, Sep 23, 2026)
3. How good has this curve been at calling a spring?
What's new: We could not reach any archive of past CME settlement curves. CME's settlement pages refused automated access, and a public web archive was offline when we checked. We could, however, rebuild the spring 2025 curve and the late-2025 curve for the first quarter of 2026 from dated swap quotes that a Canadian fertilizer distributor published weekly, citing the broker Direct Hedge. In both seasons the curve came in low.
Evidence: The cleanest case is one contract followed through its own season. The May 2025 NOLA urea swap was bid $360 and offered $380 on Feb 19, 2025. It slipped to $345/$355 by Mar 25, recovered to $380/$395 by Apr 23 and jumped to $445/$455 by Apr 30, after a 10% barge rally that the same report tied to "strong spring demand, tightening supply, and new tariffs." It reached $480/$490 in mid-May and was still $440/$448 in the last week of May, when most of the month's assessments were already in (Genesis Fertilizers, Feb 19, Mar 26, Apr 23, Apr 30, May 14 and May 28, 2025).
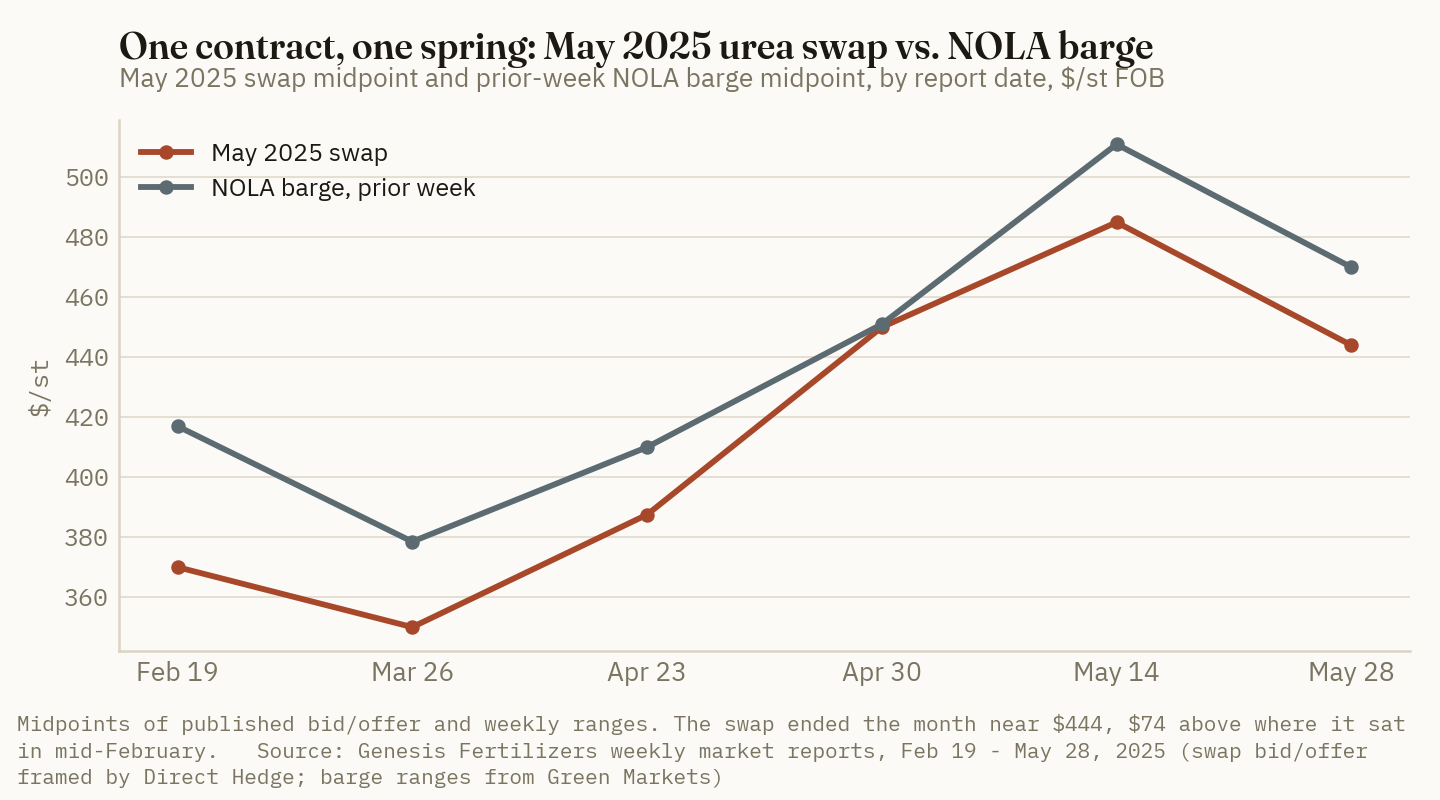
Three spring points can be scored against what was realized:
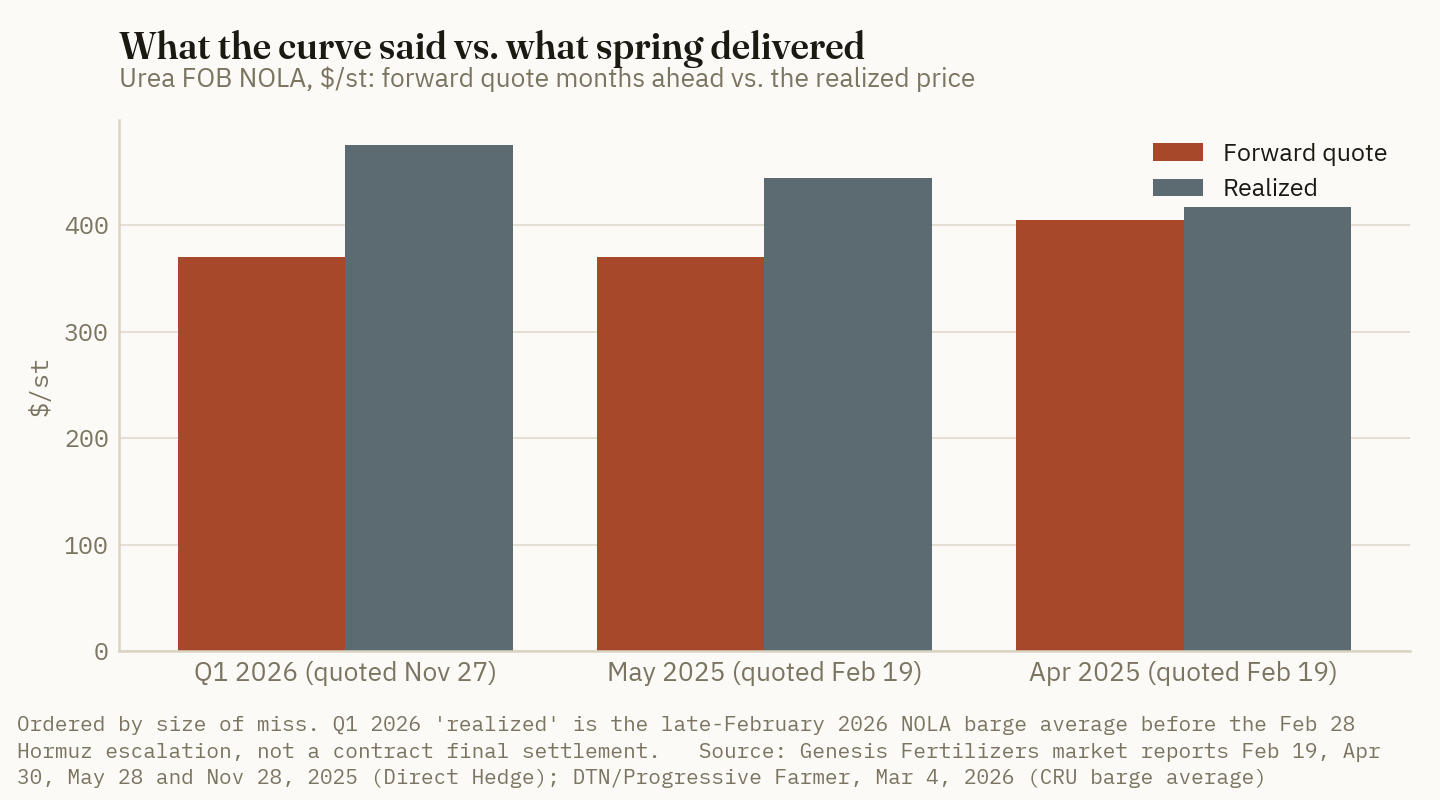
| Contract | Quoted (date) | Realized | Miss, $/st | Miss | Miss, $/acre at 180 lb N | |
|---|---|---|---|---|---|---|
| Q1 2026 | 370 (Nov 27, 2025) | 475 (late-Feb barge avg.) | +105 | +28.4% | +20.54 | ██████████ |
| May 2025 | 370 (Feb 19, 2025) | 444 (late-May swap) | +74 | +20.0% | +14.48 | ███████░░░ |
| May 2025 | 350 (Mar 26, 2025) | 444 (late-May swap) | +94 | +26.9% | +18.39 | █████████░ |
| Apr 2025 | 365 (Mar 26, 2025) | 417.5 (Apr 30 swap) | +52.5 | +14.4% | +10.27 | █████░░░░░ |
| Apr 2025 | 405 (Feb 19, 2025) | 417.5 (Apr 30 swap) | +12.5 | +3.1% | +2.45 | █░░░░░░░░░ |
| Today's contango, Sep→Mar | 458 | 475 | +17 | +3.7% | +3.33 | ██░░░░░░░░ |
Source: Swap bid/offer midpoints from Genesis Fertilizers weekly market reports (Feb 19, Mar 26, Apr 30 and Nov 28, 2025), which cite Direct Hedge. Late-February 2026 barge average from CRU via DTN/Progressive Farmer, Mar 4, 2026. Today's curve from Farmbucks, Sep 23, 2026. Miss is realized minus quoted. Per-acre values are Crop Root Zone calculations at 920 lb N per ton and 180 lb N per acre, assuming full pass-through. The Q1 2026 "realized" figure is a physical barge average, not a contract final settlement. Bars scale the $/st miss, with Q1 2026 at ten blocks.
Two details keep this from being a story about wars. First, the Q1 2026 miss was mostly in place before the Feb 28 Hormuz escalation. March-loading barges had already traded at $495 a short ton on Feb 28, and first-half April at $487–$492 (Argus Media, Mar 2, 2026). The curve had stood at $365–$375 for the whole quarter three months earlier (Genesis Fertilizers, Nov 28, 2025). The war then added $50 to $80 in a single session. Second, the one near-hit is the April 2025 contract quoted on Feb 19, and it was only a hit because the curve fell $40 over the next five weeks and then recovered. A buyer who used the curve on Mar 26 was $52.50 low.
The curve has earned some credit, and it should get it. In late March of this year, with NOLA barges at $670–$705 (Advanced Turf Solutions, Mar 30, 2026), the March 2027 contract was priced near $460. We back that out of TradingView's six-month change of +3.26%, so it is approximate. That was a discount of more than $200 to spot, and it said the war spike would not last into the next season. It didn't: NOLA fell as low as $340 over the summer (WWBL, Aug 12, 2026). Where the curve has been wrong is on the spring itself. Its standard shape has prices easing after the application rush. In both springs we rebuilt, the rush was bigger than the curve had allowed for.
Ground Truth: The sample is short, but the two springs we could reconstruct missed in the same direction and by similar amounts: 20% to 28% low at two to three months out, or $14 to $21 an acre on a 180-lb urea program. That is four to six times the $3.33 of contango on the curve today. A grower should not read the flat curve as "waiting costs $3 an acre." The better reading is that the curve prices the spring as an ordinary month, and the last two springs were not. For budgeting, treat the curve's $475 as a floor on the spring barge price, not as its midpoint.
4. What this means for a spring 2027 program
What's new: The forward curve gives a grower a test for a spring urea prepay quote. It does not give a price to pay.
Evidence: Combine the curve with spring-season spreads and a retail spring urea quote around $611 to $642 a ton, or $0.66 to $0.70 a pound of N, is what a normal spring on the current curve implies. A quote at about today's $659 to $676 means the retailer is holding September's wider margin into spring. The Ibendahl model's $705 April figure is the price at which a quote begins to build in a spring rally that the futures are not pricing.
| Retail spring urea quote, $/ton | $/lb N | $/acre at 180 lb N | What it implies |
|---|---|---|---|
| 611–642 | 0.664–0.698 | 119.54–125.61 | Curve plus a normal spring spread |
| 659–676 | 0.716–0.735 | 128.93–132.26 | Today's price, or the curve plus today's wide spread |
| ~705 | 0.766 | 137.93 | Model forecast of a spring rise (Ibendahl, Sep 6, 2026) |
| 858 | 0.933 | 167.87 | What April 2026 actually cost (DTN, Apr 22, 2026) |
Source: Crop Root Zone calculations from Farmbucks/CME, Sep 23, 2026; DTN/Progressive Farmer, Sep 23, 2026 and Apr 22, 2026; Ibendahl, Sep 6, 2026. Per-acre values at 920 lb N per ton and 180 lb N per acre.
Three caveats limit how far the arithmetic goes. First, the path from barge to retail is not one for one. This desk has measured retail urea capturing under a third of a large international move over a five-month window (TRZ-0121). A $17 Gulf contango may reach the counter as less than $17, and a $105 spring miss may reach it as less than $105, though April 2026 retail at $858 suggests a spring spike passes through faster than a summer decline does. Second, the chain may be thin. Every UFV contract page we read showed "no trades," and we could not verify volume or open interest. Where a month does not trade, its settlement is set by the exchange from assessments and quotes rather than from prints. Third, the March contract settles on a March average. A grower applying in late April is exposed to the weeks the curve does not price, and in 2025 those were the weeks that moved most.
What to watch between now and the spring:
Whether April and May 2027 start to trade. A first real print in either month would show the curve's actual shape across the application window. A value well below March would be the first market signal of an expected post-season decline. A value at or above March would mean someone is paying for the spring risk this piece argues is underpriced.
The spread, not just the barge. The September spread of $201 is $34 to $65 wider than any spring reading above. If NOLA holds near $458 while retail stays near $659 into November, the retail margin is holding and spring quotes will be anchored to it. If retail follows the August-to-September narrowing and drifts toward $620 to $640, the curve's lower scenarios become the likely ones.
The Q1 step. The $21 jump between the December and January contracts is the curve's entire spring premium. If it widens through the fall, the market is starting to price the spring demand it has missed in each of the last two years.
References
- Farmbucks, "Urea (US Gulf) Futures (CBOT UFV)" contract chain, last update Sep 23, 2026, 15:52 CT, data from DTN, CME Group and ICE — https://farmbucks.com/futures/fertilizer/urea-us-gulf
- TradingView, Urea (Granular) FOB US Gulf futures contract list and UFVH2027, UFVJ2027, UFVK2027 contract pages, accessed Sep 24, 2026 — https://www.tradingview.com/symbols/CBOT-UFV1!/contracts/ ; https://www.tradingview.com/symbols/CBOT-UFVJ2027/ ; https://www.tradingview.com/symbols/CBOT-UFVK2027/
- TradingView, UAN FOB NOLA futures UNOV2026 and UNOH2027 contract pages, accessed Sep 24, 2026 — https://www.tradingview.com/symbols/CBOT-UNOV2026/ ; https://www.tradingview.com/symbols/CBOT-UNOH2027/
- CME Group, Urea (Granular) FOB US Gulf futures contract specifications (short-ton contract, settlement on the monthly average of ICIS and Profercy US Gulf assessments), as summarized in Crop Root Zone TRZ-0126, Aug 25, 2026 — https://www.cmegroup.com/markets/agriculture/fertilizer/urea-granular-fob-us-gulf.contractSpecs.html
- DTN/Progressive Farmer, "Fertilizer Prices Rise for Six of Eight Major Fertilizers," Sep 23, 2026 (retail survey Sep 14–18, 2026) — https://www.dtnpf.com/agriculture/web/ag/crops/article/2026/09/23/fertilizer-prices-rise-six-eight
- DTN/Progressive Farmer, "5 Fertilizer Prices Slightly Lower Than Last Month; 3 Higher," Aug 19, 2026 (retail survey Aug 10–14, 2026) — https://www.dtnpf.com/agriculture/web/ag/crops/article/2026/08/19/5-fertilizer-prices-slightly-lower-3
- DTN/Progressive Farmer, "Seven of Eight Major Fertilizers are Higher Priced to End February," Mar 4, 2026 (retail survey Feb 23–27, 2026; NOLA barge data from CRU Group) — https://www.dtnpf.com/agriculture/web/ag/crops/article/2026/03/04/seven-eight-major-fertilizers-higher
- DTN/Progressive Farmer, "6 Fertilizer Prices See Sizeable Moves Higher," Apr 22, 2026 (retail survey Apr 13–17, 2026) — https://www.dtnpf.com/agriculture/web/ag/news/article/2026/04/22/6-fertilizer-prices-see-sizeable
- DTN/Progressive Farmer, "UAN32 Retail Price Up 9%, UAN28 Price Up 7% From Last Month," Apr 23, 2025 (retail survey Apr 14–18, 2025) — https://www.dtnpf.com/agriculture/web/ag/crops/article/2025/04/23/uan32-retail-price-9-uan28-price-7
- Argus Media, "Nola urea prices surge on US-Iran conflict," Mar 2, 2026 — https://www.argusmedia.com/en/news-and-insights/latest-market-news/2794957-nola-urea-prices-surge-on-us-iran-conflict
- Genesis Fertilizers, "Urea NOLA Futures Curve Jumps Again," Feb 19, 2025 — https://genesisfertilizers.com/2025/02/19/urea-nola-futures-curve-jumps-again/
- Genesis Fertilizers, "Forward Curve Fell Significantly in Last Month," Mar 26, 2025 — https://genesisfertilizers.com/2025/03/26/forward-curve-fell-significantly-in-last-month/
- Genesis Fertilizers, "Urea NOLA Forward Curve Jumps Up Again," Apr 23, 2025 — https://genesisfertilizers.com/market-report/urea-nola-forward-curve-jumps-up-again/
- Genesis Fertilizers, "US Urea Prices Surge to Highest Level Since 2022," Apr 30, 2025 — https://genesisfertilizers.com/2025/04/30/us-urea-prices-surge-to-highest-level-since-2022/
- Genesis Fertilizers, "Chinese Export Uncertainty Pressures Urea," May 14, 2025 — https://genesisfertilizers.com/2025/05/14/chinese-export-uncertainty-pressures-urea/
- Genesis Fertilizers, "Western Canada, NOLA Urea Spread Blows Out Again," May 28, 2025 — https://genesisfertilizers.com/2025/05/28/western-canada-nola-urea-spread-blows-out-again/
- Genesis Fertilizers, "Global urea activity subdued through November," Nov 28, 2025 — https://genesisfertilizers.com/2025/11/28/global-urea-activity-subdued-through-november/
- Advanced Turf Solutions, "US Fertilizer Market Summary 3/30/2026" — https://www.advancedturf.com/wp-content/uploads/2026/03/ATS-Fertilizer-Market-Update-3_30_2026.pdf
- Advanced Turf Solutions, "US Fertilizer Market Summary 4/27/2026" — https://www.advancedturf.com/wp-content/uploads/2026/04/ATS-Fertilizer-Market-Update-4_27_2026.pdf
- WWBL (The Bullet), "Fertilizer Markets at a Crossroads: StoneX's Josh Linville Reveals the Biggest Risks—and Where Growers Should Buy Now," Aug 12, 2026 — https://www.wwbl.com/2026/08/12/fertilizer-markets-at-a-crossroads-stonexs-josh-linville-reveals-the-biggest-risks-and-where-growers-should-buy-now/
- Greg Ibendahl, "The Nitrogen Forecast," Agricultural Economics (Substack), Sep 6, 2026 — https://agricultural.substack.com/p/the-nitrogen-forecast
- Shawn Arita, Ming Wang, Jiyeon Kim, Rwit Chakravorty and Sandro Steinbach, "Strait of Hormuz Disruption Scenarios and Fertilizer Purchasing Risks for U.S. Crop Producers," farmdoc daily, Apr 29, 2026 — https://farmdocdaily.illinois.edu/2026/04/strait-of-hormuz-disruption-scenarios-and-fertilizer-purchasing-risks-for-u-s-crop-producers.html
- Crop Root Zone, TRZ-0121, Aug 24, 2026 (retail pass-through of the international urea move) and TRZ-0126, Aug 25, 2026 (urea futures contract mechanics and basis risk).
Disclosures
Crop Root Zone is an independent publication. Nothing here is investment advice. Market calls, where included, reflect the editors' own read and are not a recommendation to buy or sell any security.
September Anhydrous Beat the Following April in Three of the Last Four Seasons. At $938 a Ton, Fall Wins Only if Spring Tops About $1,041.
DTN's mid-September retail prints since 2022 show anhydrous was $96 to $346 a ton cheaper than the next April in three seasons and $374 dearer in the fourth, the fall after the 2022 price shock. September has also been the low of every fall: prices rose $33 to $129 a ton into the application window in all four years. Illinois on-farm trials put fall ammonia's agronomic cost at 10 more pounds of N and about a bushel an acre. At today's $938 and $5.37 December corn, that cost means spring anhydrous has to clear roughly $1,041, 11% higher, before a fall application comes out ahead. In two of the four seasons the fall edge only just cleared that hurdle. The season it failed looks more like this one than the other three do.
Retail anhydrous averaged $938 a ton in the second week of September (DTN/Progressive Farmer, Sep 16, 2026). A grower pricing fall nitrogen this week is really making two bets. The first is that anhydrous bought now will cost less than anhydrous bought next April. The second is that nitrogen applied in November will do as much work as nitrogen applied in April. DTN's retail surveys let us score the first bet for the last four seasons, and university field trials let us put a price on the second. In three of four seasons September anhydrous was cheaper than the following April, by $96, $98 and $346 a ton. In the fourth it was $374 dearer. The agronomic cost of going early, priced at this week's anhydrous and corn, works out to a hurdle of about 11%: spring anhydrous has to reach roughly $1,041 before $938 in the fall is the better buy. Two of the three winning seasons cleared that hurdle by about three points. The season that failed was the fall after a price shock, when retail was still coming down from a spring peak. That is also where the market sits this September.
1. Four Septembers, four Aprils
What's new: Measured at the same point each year, mid-September against the following mid-April, the fall price of anhydrous has not given a consistent discount. It gave a modest one in two seasons, a very large one in one, and a large premium in the other.
Evidence: The table uses DTN's national average retail price for the second or third survey week of September and the third survey week of the following April, when spring pre-plant application is at its peak. Per-pound and per-acre figures convert the dollar difference at anhydrous's 82% N content, which is 1,640 lb of N per ton.
| Season | Sep $/ton | Following Apr $/ton | Apr minus Sep, $/ton | Change | $/lb N | $/acre at 180 lb N |
|---|---|---|---|---|---|---|
| 2022/23 | 1,369 | 995 | −374 | −27.3% | −0.228 | −41.05 |
| 2023/24 | 696 | 794 | +98 | +14.1% | +0.060 | +10.76 |
| 2024/25 | 685 | 781 | +96 | +14.0% | +0.059 | +10.54 |
| 2025/26 | 768 | 1,114 | +346 | +45.1% | +0.211 | +37.98 |
| 2026/27 | 938 | — | — | — | — | — |
Source: DTN/Progressive Farmer national average retail anhydrous. September survey weeks Sep 12–16, 2022 (Sep 21, 2022); Sep 11–15, 2023 (Sep 20, 2023); Sep 16–20, 2024 (Sep 27, 2024); Sep 8–12, 2025 (Sep 17, 2025); Sep 7–11, 2026 (Sep 16, 2026). April survey weeks Apr 17–21, 2023 (Apr 26, 2023); Apr 15–19, 2024 (Apr 24, 2024); Apr 14–18, 2025 (Apr 23, 2025); Apr 13–17, 2026 (Apr 22, 2026). $/lb N and $/acre are Crop Root Zone calculations at 1,640 lb N per ton. A positive number means the September buyer paid less.
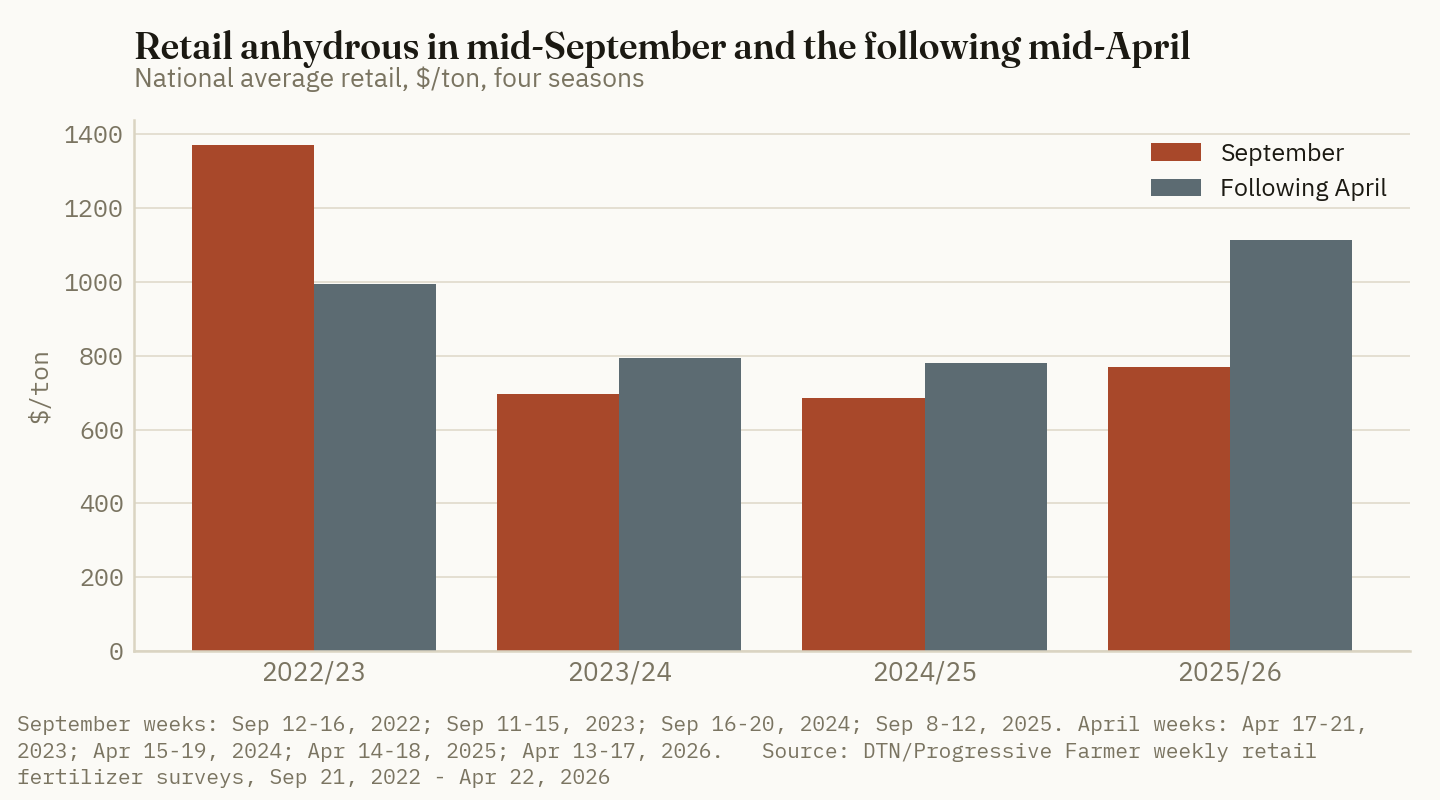
Two of the four seasons were quiet ones. In 2023/24 and 2024/25 the spring price came in about $97 a ton over September, a 14% premium, or close to $10.50 an acre at 180 pounds of N. That is what the fall discount amounted to in the two seasons without a shock.
The other two seasons were driven by a shock, and they went opposite ways. In September 2022 anhydrous averaged $1,369, up 80% on the year (DTN/Progressive Farmer, Sep 21, 2022). By the third week of April 2023 it had dropped to $995, the first sub-$1,000 print since October 2021 (DTN/Progressive Farmer, Apr 26, 2023). A grower who bought in September paid $41 an acre more than one who waited. In 2025/26 the shock came in the spring instead. Anhydrous rose from $768 in September to $1,114 by mid-April. It was 20% higher in a single month (DTN/Progressive Farmer, Apr 22, 2026), and by the week of Mar 23–27 it was already above $1,000 (DTN/Progressive Farmer, Apr 1, 2026). A September buyer saved about $38 an acre.
Urea followed the same pattern but with a different amount in each season. The spring-over-September difference was −22.5% in 2022/23 ($808 to $626), +5.6% in 2023/24 ($554 to $585), +19.0% in 2024/25 ($485 to $577) and +36.0% in 2025/26 ($631 to $858), on the same DTN survey weeks. Urea is not a product growers normally put down in the fall, but its sign matched anhydrous's in all four seasons. That points to a market-wide cause rather than one tied to anhydrous alone.
Ground Truth: Four seasons is a short record, but it points one way. In a normal year the fall discount is worth about $10 an acre, and a price shock can swing it by about $40 an acre in either direction. So the decision is less about the season and more about whether the market is heading into a shock or coming out of one. A grower who bought early in fall 2022, right after a spike, locked in the peak. A grower who bought early in fall 2025, before one, avoided it. Buying early paid when a spike came after the purchase and cost money when the purchase came after a spike.
2. September is the low of the fall, not the fall price
What's new: The September print is not the price most growers pay for fall anhydrous. In each of the last four autumns, the national average rose between mid-September and the start of the application window.
Evidence: The next DTN reading taken in late October or November, set against the September figures above:
| Fall | Sep $/ton | Application-window $/ton (survey week) | Rise, $/ton | Rise | |
|---|---|---|---|---|---|
| 2022 | 1,369 | 1,434 (Nov 7–11) | +65 | +4.7% | █████░░░░░ |
| 2023 | 696 | 825 (Oct 23–27) | +129 | +18.5% | ██████████ |
| 2024 | 685 | 718 (Nov 18–22) | +33 | +4.8% | ███░░░░░░░ |
| 2025 | 768 | 858 (Nov 3–7) | +90 | +11.7% | ███████░░░ |
Source: DTN/Progressive Farmer national average retail anhydrous, Nov 16, 2022; Nov 1, 2023; Nov 27, 2024; Nov 12, 2025; September prints as in the table in Section 1. Bars scale the $/ton rise, with 2023 at ten blocks. The later survey weeks differ from year to year because each is a published survey from late October or November, when fall application is typically under way, not a fixed calendar date.
The rise comes from demand. When harvest wraps up and soils cool, application rigs start running, and retail anhydrous prices go up as the rigs roll. Last fall shows the pattern in detail. Anhydrous went from $768 in the Sep 8–12 survey to $813 in the Sep 29–Oct 3 survey, up 6% in a month and at its highest level since December 2023 (DTN/Progressive Farmer, Oct 8, 2025). By Nov 3–7 it was $858 (DTN/Progressive Farmer, Nov 12, 2025), and it was still $867 in the week of Dec 8–12 (DTN/Progressive Farmer, Dec 17, 2025). It then sat near $861 until mid-February (DTN/Progressive Farmer, Feb 18, 2026). The spring run-up started after that.
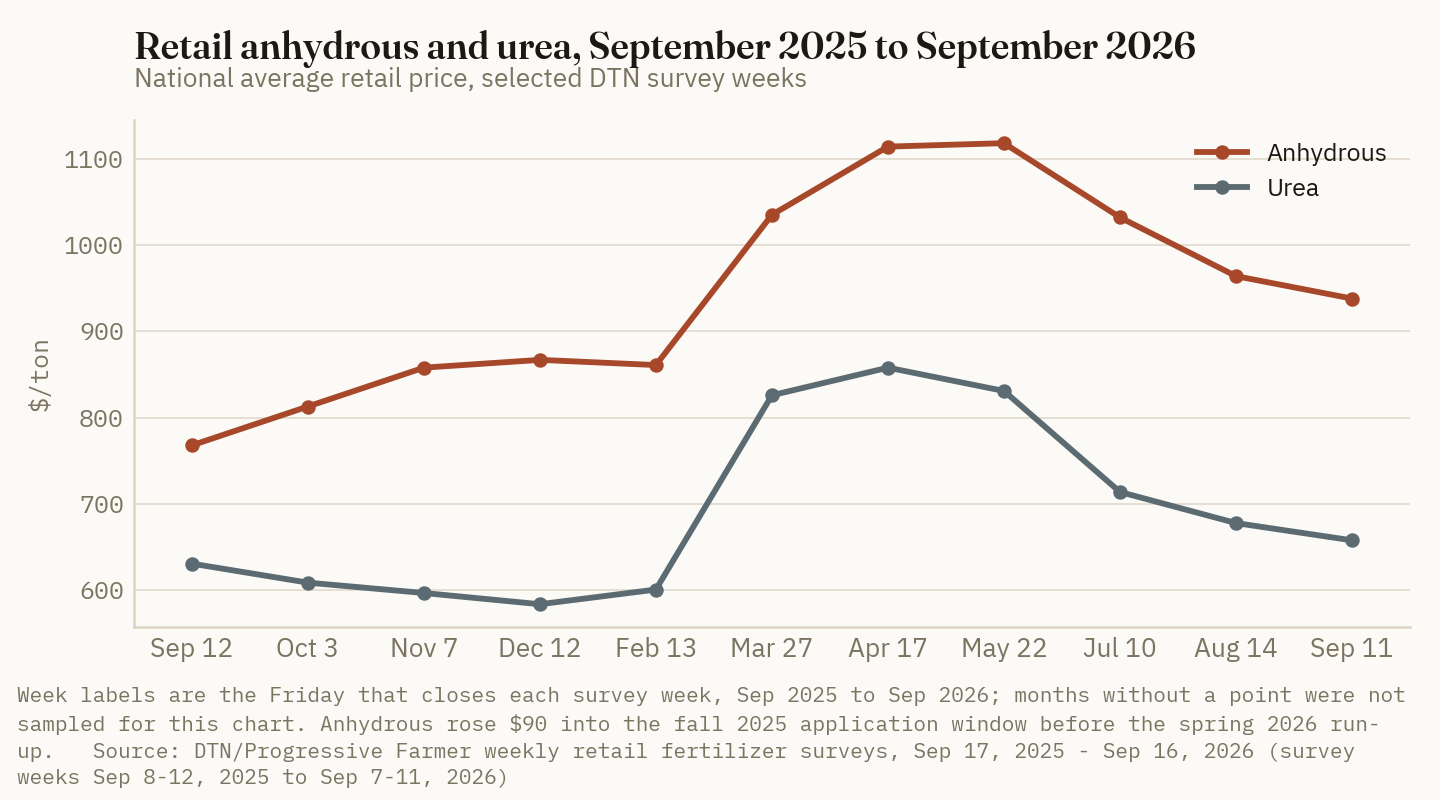
That changes how the first table should be read. Take a grower who priced fall anhydrous at application in November 2025 rather than in September. That grower paid $858, not $768, and the spring saving shrank from $346 a ton to $256. In the quiet 2024/25 season the equivalent adjustment is even more telling. The November price was $718, which leaves only $63 of spring premium out of the $96 measured from September. So the fall discount mostly goes to growers who commit in September. Growers who wait for the rig to arrive give up a quarter to a third of it. In a quiet season what remains, $63 a ton or about $7 an acre in 2024/25, is an 8.8% spring premium, which falls short of the agronomic hurdle set out in Section 3.
Ground Truth: Growers who are going to apply anhydrous this fall anyway have had one consistent result across four years: pricing it in September beat pricing it at application, every time, by $33 to $129 a ton. That is a narrower question than fall versus spring, and it is the only timing question with a clean record. If the fall application is already decided on agronomic grounds, the September quote is the one to take seriously. If it is not decided, the rest of this piece matters more than the price.
3. What fall nitrogen costs back in the field
What's new: A fall ton is not the same product as a spring ton. The price comparison has to account for the fact that nitrogen put on in November loses some of its value before the crop can use it.
Evidence: The most useful public benchmark comes from 16 Illinois on-farm trials, run from 2014 to 2018, that compared fall-applied and spring-applied ammonia side by side. The economically optimal rate averaged 186 lb N per acre for fall ammonia and 176 lb for spring. Yield at those rates was 235 bushels for fall and 236 for spring. Fall-applied N needed about 10 more pounds to do the same job and gave up about a bushel. The author ran the economics at $0.30 a pound of N and $3.75 corn (University of Illinois, farmdoc, Sep 30, 2020). Those prices are far from today's, so we re-price the same agronomic gap at this week's numbers: anhydrous at $938 a ton, or $0.572 per lb N (DTN/Progressive Farmer, Sep 16, 2026), and December corn at $5.3675 (Brownfield Ag News, Sep 22, 2026).
| Fall-penalty assumption | Fall lb N | Spring lb N | Yield give-up, bu | Spring price that ties $938 fall, $/ton | Spring rise needed |
|---|---|---|---|---|---|
| Rate only (Illinois trial average) | 186 | 176 | 0 | 991 | +5.7% |
| Rate and yield (Illinois trial average) | 186 | 176 | 1 | 1,041 | +11.0% |
| Doubled rate penalty, warm-winter case* | 196* | 176 | 1 | 1,095* | +16.7%* |
Source: Rate and yield gaps from E. Nafziger, "Is Fall a Good Time to Apply Nitrogen?", University of Illinois farmdoc, Sep 30, 2020 (16 on-farm trials, 2014–2018). Prices from DTN/Progressive Farmer, Sep 16, 2026 and Brownfield Ag News, Sep 22, 2026. Break-even prices are Crop Root Zone calculations: the spring price at which 176 lb of spring N plus the value of the bushel given up costs the same as 186 lb of fall N at $938. *The warm-winter row is an illustrative scenario, not a trial result. It assumes the fall rate penalty doubles to 20 lb.
$1,041/ton
The spring anhydrous price at which a fall application at this week's $938 breaks even, after the Illinois trials' average 10-lb N and 1-bushel fall penalty is priced at $5.37 December corn. (Crop Root Zone calculation from farmdoc, Sep 30, 2020; DTN/Progressive Farmer, Sep 16, 2026; Brownfield Ag News, Sep 22, 2026)
Compare that 11% hurdle with the first table. The 14% spring premiums of 2023/24 and 2024/25 cleared it by about three points, which works out to about $3 an acre at these rates. That is a real gain, but a small one, and it assumes fall anhydrous goes on under good conditions: cold soils, a stabilizer where warranted, and a field that suits fall N. Only 2025/26 cleared the hurdle by a wide margin, and that season was decided by an event, not by the calendar.
This year the conditions matter more than usual. Iowa State University agronomists put the odds of a very strong El Niño this fall and winter above 90%, and gave a 69% chance that it will be stronger by October–December than any in the record going back to 1950. Central Iowa soils normally cool to 50°F and falling around November 10. This year they warn that date "may land 10 to 15 days later" (Iowa State University Extension and Outreach, Sep 10, 2026). The same authors recommend nitrification inhibitors with fall ammonia and manure N, and say growers should track soil temperature on the Iowa Environmental Mesonet rather than by the calendar. A later, warmer window makes fall nitrogen more exposed to loss. It also pushes application later into November, which is exactly the stretch where the retail price has climbed in each of the last four falls.
Ground Truth: At today's prices, the agronomic cost of fall anhydrous uses up almost all of the fall discount a normal season has delivered. A fall application in 2026 therefore depends on the spring price rising by more than a quiet year's 14%. It does not rest on the usual seasonal pattern. A grower on ground where fall N performs well, with cold soils and an inhibitor, can still come out ahead. A grower on ground where it performs poorly is effectively betting that a second spring shock is coming, not collecting a normal seasonal discount.
4. Where 2026 sits: after a spike, like 2022
What's new: This September's anhydrous price comes after a spring spike and several months of decline. Of the four seasons in the record, only 2022 looked like that, and 2022 was the season the fall buyer lost.
Evidence: Retail anhydrous reached $1,118 in the week of May 18–22 (DTN/Progressive Farmer, May 27, 2026), the highest of the surveys cited here, and has fallen for most of the summer since: $1,032 in the week of Jul 6–10 (DTN/Progressive Farmer, Jul 15, 2026), $964 in the week of Aug 10–14 (DTN/Progressive Farmer, Aug 19, 2026) and $938 now. At the wholesale level the drop has been twice as large in percentage terms. The Tampa ammonia contract fell from $825 a tonne in May to $555 in September, a fourth straight monthly decline. Fertilizer Daily ties the May peak to an escalation of the Strait of Hormuz conflict, and attributes the decline since to Chinese urea export quotas, a tentative Hormuz shipping arrangement and higher Trinidad output (Fertilizer Daily, Sep 10, 2026).
| Benchmark | Spring high (date) | Latest (date) | Change | Basis |
|---|---|---|---|---|
| Tampa ammonia contract | 825 (May 2026) | 555 (Sep 2026) | −32.7% | $/MT, CFR Tampa monthly contract |
| Retail anhydrous | 1,118 (May 18–22) | 938 (Sep 7–11) | −16.1% | $/ton, delivered retail, US average |
| Retail urea | 866 (Apr 27–May 1) | 658 (Sep 7–11) | −24.0% | $/ton, delivered retail, US average |
| World urea | — | 459 (Sep 22) | +9.9% month, +21.6% year | $/MT, Trading Economics benchmark |
Source: Fertilizer Daily, Sep 10, 2026; DTN/Progressive Farmer, May 6, May 27 and Sep 16, 2026; Trading Economics, urea, accessed Sep 23, 2026. Tampa and world urea are wholesale benchmarks in metric tonnes. Retail figures are in short tons and are not directly comparable to them in level, only in direction. Retail highs are the highest of the DTN surveys cited in this piece, not a confirmed season peak.
The comparison with 2022 is structural, not a claim about levels. In both years the September retail price was still well above the previous year's (+80% in 2022, +22% now), and in both years the wholesale ammonia price was already falling faster than retail. In 2022/23 the retail price caught up with wholesale over the winter, and the spring buyer came out $374 a ton ahead. A 16% retail decline against a 33% wholesale decline leaves the same kind of room this year, if wholesale holds.
The case against the analogy is in the last row of the table. World urea has turned up again, +9.9% in the month to Sep 22 (Trading Economics, Sep 23, 2026). Urea sets much of the price of spring nitrogen. The anhydrous discount a September buyer gets is also measured against a spring market that has already priced one Hormuz scare. A second disruption would put 2026/27 in the 2025/26 column rather than the 2022/23 one.
Ground Truth: The four-season record does not say fall anhydrous is cheap or expensive in 2026. It says the answer depends on the direction of wholesale nitrogen between now and April, and not on the calendar. At $938, with an 11% agronomic hurdle and wholesale ammonia already down a third from its peak, a fall purchase is not a seasonal discount. It is a position that the post-spike decline has finished. Growers who read the market that way have a case for booking. Growers who do not can wait, keep the agronomic 10 pounds, and give up only the quiet-year $3 or so an acre if they turn out to be wrong in an ordinary way.
5. What to watch before the rigs roll
The October Tampa ammonia settlement. We found no October 2026 settlement reported in public sources as of Sep 23. After four consecutive declines, a flat or higher settlement would be the first sign that the wholesale decline behind the 2022 analogy is ending. A further cut would widen the gap between wholesale and retail that a spring buyer is counting on.
Whether anhydrous repeats its autumn climb. In each of the last four falls the national average rose $33 to $129 a ton between mid-September and the application window (Section 2). If DTN's October surveys show anhydrous flat or lower while rigs are running, that would be a break in the pattern. It would suggest retail is still catching down to wholesale.
Soil temperature, not the calendar. Iowa State's projected 10-to-15-day delay in the 50°F date moves central Iowa application toward late November (Iowa State University Extension and Outreach, Sep 10, 2026). Each week of delay puts fall N on warmer ground or into a shorter window. That adds to the agronomic hurdle in Section 3.
December corn. The yield side of the hurdle is priced in bushels. At $5.37 corn the one-bushel fall penalty is worth about $50 a ton of anhydrous in the break-even. Every 50-cent move in December futures shifts the break-even spring price by about $5 a ton. That is small next to the price swings in the first table, and it is the smallest of the four things to watch.
References
- DTN/Progressive Farmer, Russ Quinn, "Fertilizer Prices Continue Lower for 6 of 8 Major Nutrients," Sep 16, 2026 (retail survey Sep 7–11, 2026) — https://www.dtnpf.com/agriculture/web/ag/crops/article/2026/09/16/fertilizer-prices-continue-lower-6-8
- DTN/Progressive Farmer, Russ Quinn, "DAP Leads Fertilizer Prices Up Again," Sep 17, 2025 (retail survey Sep 8–12, 2025) — https://www.dtnpf.com/agriculture/web/ag/crops/article/2025/09/17/dap-leads-fertilizer-prices
- DTN/Progressive Farmer, "6 Fertilizer Prices See Sizeable Moves Higher," Apr 22, 2026 (retail survey Apr 13–17, 2026) — https://www.dtnpf.com/agriculture/web/ag/news/article/2026/04/22/6-fertilizer-prices-see-sizeable
- DTN/Progressive Farmer, "Retail Fertilizer Prices Mixed in Mid-September 2022," Sep 21, 2022 (retail survey Sep 12–16, 2022) — https://www.dtnpf.com/agriculture/web/ag/crops/article/2022/09/21/retail-fertilizer-prices-mixed-mid
- DTN/Progressive Farmer, "Anhydrous Fertilizer Price Drops Below $1,000 Per Ton for the First Time Since October 2021," Apr 26, 2023 (retail survey Apr 17–21, 2023) — https://www.dtnpf.com/agriculture/web/ag/crops/article/2023/04/26/anhydrous-drops-1-000-per-ton-first
- DTN/Progressive Farmer, "Anhydrous Price Climbs While Other Retail Fertilizer Prices Continue to Fall," Sep 20, 2023 (retail survey Sep 11–15, 2023) — https://www.dtnpf.com/agriculture/web/ag/crops/article/2023/09/20/anhydrous-price-climbs-retail-prices
- DTN/Progressive Farmer, "All Major Fertilizer Prices Continue Higher for Fourth Consecutive Week," Apr 24, 2024 (retail survey Apr 15–19, 2024) — https://www.dtnpf.com/agriculture/web/ag/crops/article/2024/04/24/major-fertilizer-prices-continue
- DTN/Progressive Farmer, "Potash, 10-34-0, UAN32 Lead Major Fertilizer Prices Lower," Sep 27, 2024 (retail survey Sep 16–20, 2024) — https://www.dtnpf.com/agriculture/web/Ag/crops/article/2024/09/27/potash-10-34-0-uan32-lead-major
- DTN/Progressive Farmer, "UAN32 Retail Price Up 9%, UAN28 Price Up 7% From Last Month," Apr 23, 2025 (retail survey Apr 14–18, 2025) — https://www.dtnpf.com/agriculture/web/ag/crops/article/2025/04/23/uan32-retail-price-9-uan28-price-7
- DTN/Progressive Farmer, "Fertilizer Prices Evenly Mixed," Nov 16, 2022 (retail survey Nov 7–11, 2022) — https://www.dtnpf.com/agriculture/web/ag/crops/article/2022/11/16/fertilizer-prices-evenly-mixed
- DTN/Progressive Farmer, "Anhydrous Again Leads Most Retail Fertilizer Prices Higher," Nov 1, 2023 (retail survey Oct 23–27, 2023) — https://www.dtnpf.com/agriculture/web/ag/crops/article/2023/11/01/anhydrous-leads-retail-fertilizer
- DTN/Progressive Farmer, "Once Again, Most Retail Fertilizer Prices Higher," Nov 27, 2024 (retail survey Nov 18–22, 2024) — https://www.dtnpf.com/agriculture/web/ag/crops/article/2024/11/27/retail-fertilizer-prices-higher
- DTN/Progressive Farmer, "Anhydrous, DAP Lead Retail Fertilizer Prices Higher," Oct 8, 2025 (retail survey Sep 29–Oct 3, 2025) — https://www.dtnpf.com/agriculture/web/ag/crops/article/2025/10/08/anhydrous-dap-lead-retail-fertilizer
- DTN/Progressive Farmer, "Anhydrous Again Leads Half of Retail Fertilizer Prices Higher," Nov 12, 2025 (retail survey Nov 3–7, 2025) — https://www.dtnpf.com/agriculture/web/ag/crops/article/2025/11/12/anhydrous-leads-half-retail-prices
- DTN/Progressive Farmer, "Most Fertilizers Lower in Price Than Last Month," Dec 17, 2025 (retail survey Dec 8–12, 2025) — https://www.dtnpf.com/agriculture/web/ag/crops/article/2025/12/17/fertilizers-lower-price-last-month
- DTN/Progressive Farmer, "All Eight Major Fertilizers See Prices Move Higher Compared to Last Month," Feb 18, 2026 (retail survey Feb 9–13, 2026) — https://www.dtnpf.com/agriculture/web/ag/crops/article/2026/02/18/eight-major-fertilizers-see-prices
- DTN/Progressive Farmer, "4 Fertilizer Prices Rise Double-Digits; Anhydrous Jumps Above $1,000 Per Ton," Apr 1, 2026 (retail survey Mar 23–27, 2026) — https://www.dtnpf.com/agriculture/web/ag/crops/article/2026/04/01/4-fertilizer-prices-rise-double-1
- DTN/Progressive Farmer, "Some Fertilizer Prices Fall for First Time in 14 Weeks," May 27, 2026 (retail survey May 18–22, 2026) — https://www.dtnpf.com/agriculture/web/ag/crops/article/2026/05/27/fertilizer-prices-fall-first-time-14
- DTN/Progressive Farmer, "UAN Fertilizers Lead Nutrient Prices Downward," Jul 15, 2026 (retail survey Jul 6–10, 2026) — https://www.dtnpf.com/agriculture/web/ag/crops/article/2026/07/15/uan-fertilizers-lead-nutrient-prices
- DTN/Progressive Farmer, "5 Fertilizer Prices Slightly Lower Than Last Month; 3 Higher," Aug 19, 2026 (retail survey Aug 10–14, 2026) — https://www.dtnpf.com/agriculture/web/ag/crops/article/2026/08/19/5-fertilizer-prices-slightly-lower-3
- Fertilizer Daily, Kim Clarksen, "Tampa ammonia price drops to $555/t in September — 4th straight monthly decline from $825 peak," Sep 10, 2026 — https://www.fertilizerdaily.com/20260910-tampa-ammonia-price-555-september-2026-fourth-monthly-decline/
- Trading Economics, Urea, accessed Sep 23, 2026 ($459.00/MT on Sep 22, 2026; +9.94% month, +21.59% year) — https://tradingeconomics.com/commodity/urea
- Emerson Nafziger, "Is Fall a Good Time to Apply Nitrogen?", University of Illinois, farmdoc, Sep 30, 2020 — https://farmdoc.illinois.edu/field-crop-production/is-fall-a-good-time-to-apply-nitrogen.html
- Iowa State University Extension and Outreach, Integrated Crop Management, Mike Castellano, Daniel Andersen, Sotirios Archontoulis and Mitchell Baum, "Fifty and Falling: What the Super El Niño Means for Anhydrous Ammonia and Manure Timing this Fall," Sep 10, 2026 — https://crops.extension.iastate.edu/post/fifty-and-falling-what-super-el-nino-means-anhydrous-ammonia-and-manure-timing-fall
- Brownfield Ag News, "Closing Grain and Livestock Futures: September 22, 2026," Sep 22, 2026 (December corn $5.36¾) — https://www.brownfieldagnews.com/market-news/closing-grain-and-livestock-futures-september-22-2026/
- DTN/Progressive Farmer, "UAN, Anhydrous Lead Fertilizer Prices Higher in Last Week of April," May 6, 2026 (retail survey Apr 27–May 1, 2026) — https://www.dtnpf.com/agriculture/web/ag/crops/article/2026/05/06/uan-anhydrous-lead-fertilizer-prices
Disclosures
Crop Root Zone is an independent publication. Nothing here is investment advice. Market calls, where included, reflect the editors' own read and are not a recommendation to buy or sell any security.
Weekly Fertilizer Price Reporting Cleared a Senate Committee on September 16. It Would Report the Plant Gate. The $230 Spread Between Illinois Anhydrous Quotes Sits at the Counter It Exempts.
The Fertilizer Transparency Act rode into the Senate farm bill in a 12–11 committee vote. It would make manufacturers and wholesalers report prices and tonnage weekly, and it exempts retailers and every cooperative. USDA's own Sep 18 distributor reports show where the uncertainty actually sits: Illinois anhydrous asks run from $820 to $1,050 a ton, Iowa UAN32 from $375 to $685, and within-state spreads range from 11% to 68% of the average ask, while no product on DTN's national board moved 5% in a month. The bill would publish a clean wholesale number, which lets a grower back out the retail margin but not see it directly. Under the confidentiality rules Washington already uses for livestock, concentrated regional cells may not publish at all. Congress is out for six weeks, and the livestock precedent took 18 months from law to first report, so none of this reaches the 2027 booking season. Collecting three quotes is still the only price discovery a grower controls.
On Sep 16 the Senate Agriculture Committee advanced its Farm Bill 2.0 on a 12–11 party-line vote, and the 34-amendment manager's package it adopted carries the Fertilizer Transparency Act (Farm Policy News, Sep 16, 2026). The Act would require every manufacturer and wholesaler of nitrogen, phosphate and potash to report prices and quantities to USDA at least weekly. USDA would publish national, regional and state figures on a dashboard. Retailers that do not manufacture are exempt, and so are all cooperatives (S. 4152, introduced Mar 19, 2026). Two days later USDA's own distributor reports for Illinois, Iowa and the Pacific Northwest showed where the price uncertainty actually sits. Illinois anhydrous asks ran from $820 to $1,050 a ton. Iowa UAN32 ran from $375 to $685. Pacific Northwest urea ran from $857 to $1,350 (USDA AMS, Sep 18, 2026). Those spreads sit downstream of the plant gate, in the part of the chain the bill leaves to voluntary reporting. The bill is a real improvement at wholesale. It does not measure what a grower pays.
1. What the committee passed, and who it leaves out
What's new: The Fertilizer Transparency Act, introduced in the Senate on Mar 19 by Sen. John Thune with Sens. Klobuchar, Grassley and Baldwin, and in the House on Mar 26 as H.R. 8104, is now part of the committee-passed farm bill (Congress.gov, S. 4152 and H.R. 8104; Farm Policy News, Sep 16, 2026).
Evidence: The bill amends the Agricultural Marketing Act of 1946, the same statute that underpins livestock mandatory reporting. Its main provisions, from the introduced Senate text:
| Provision | What S. 4152 says |
|---|---|
| Who must report | Manufacturers and wholesalers of nitrogen, phosphorus, potassium or fertilizer products, through corporate officers or designated representatives |
| What | Prices as marketed and quantities manufactured and marketed, with domestic and foreign sources kept separate and affiliate transactions tracked |
| How often | At least weekly, both reporting and publication |
| Where published | National, regional and state breakdowns "as appropriate," on a dashboard for farmers and market participants |
| Retail side | A separate Market News program of weekly retail price surveys, with no mandate on respondents |
| Exempt | "All cooperatives and retailers (except for retailers that are also manufacturers)" |
| Confidentiality | Data aggregated to keep company identities and confidential business information from being disclosed; no FOIA release |
| Deadline or penalty | None specified in the introduced text |
Source: S. 4152, Fertilizer Transparency Act of 2026, introduced Mar 19, 2026 (GovInfo text, sections 210B(a)–(i)). Crop Root Zone summary; quoted language is from the bill.
Two definitions carry more weight than the rest. A "wholesaler" is defined as any entity "not including a cooperative" that buys and sells fertilizer for resale. A "cooperative" includes Capper-Volstead associations, Section 521 farmer cooperatives, and any entity "operating on a cooperative basis for the benefit of its members." Farmer-owned regional and local cooperatives do a large share of both wholesale distribution and retail sales in the Corn Belt. Those volumes sit outside the mandate unless a cooperative volunteers or is also a manufacturer. We could not find a current public estimate of the cooperative share of US fertilizer tonnage, so we do not put a number on it.
The House sponsor's office describes today's alternative plainly: USDA "publishes the data annually, on a voluntary basis" (Rep. Dusty Johnson, Mar 26, 2026). The political pressure behind the bill has grown since spring. The FTC opened a formal fertilizer investigation and issued subpoenas, which Chairman Andrew Ferguson described at a Texas farmer meeting on May 28 (DTN/Progressive Farmer, May 28, 2026). On Sep 11 USDA Deputy Secretary Stephen Vaden heard from more than 170 farmers from 13 states at a hearing in Ogden, Iowa, and urged them to submit accounts anonymously to support the federal inquiry (Radio Iowa, Sep 14, 2026; Brownfield Ag News, Sep 11, 2026).
Ground Truth: The bill is aimed at the producers, and that is where the political argument is. The price a grower actually pays is set one or two steps further down the chain, by distributors and retailers, many of them cooperatives, and the mandate does not reach them. If it becomes law, the Act will answer "what did the plant charge?" much better than anything public today. It will answer "was my quote fair?" only by subtraction: a grower takes the local quote, subtracts the published wholesale figure, and judges whether the difference looks like freight, storage and a reasonable margin. That is still worth having. It is not the same as seeing the retail spread.
2. What a grower can see today, and how late it arrives
What's new: The free public price record is a patchwork of sources at different points in the chain, on different schedules. The freshest free NOLA wholesale print in a trade journal this month was four weeks old when it was published.
Evidence: The table below lists the public or freely relayed prints a grower could have found in mid-September, with the date each price describes and the date it became public.
| Source | Chain level | Frequency | Latest print | Price date | Made public | Lag, days |
|---|---|---|---|---|---|---|
| USDA AMS Illinois report | Distributor ask, FOB | Bi-weekly | Anhydrous $907.50/st | Sep 18 | Sep 18 | 0 |
| DTN retail survey | Retail, national average | Weekly | Anhydrous $938/st | Sep 7–11 | Sep 16 | 5 |
| Global urea benchmark, via Fertilizer Daily | International urea, no US basis | Daily/weekly | Urea $453/MT | Sep 14 | Sep 17 | 3 |
| Tampa ammonia contract, via Fertilizer Daily | One bilateral wholesale contract, CFR Tampa | Monthly | $555/MT (≈$503/st) | September | Sep 10 | n/a |
| Fertilizer International (free issue) | NOLA urea barge, FOB | Bi-monthly | Up to $405/st | Aug 20 | Sep 15 | 26 |
| CF Industries 8-K | Producer realized ammonia price, all channels | Quarterly | $677/ton | Apr–Jun average | Aug 5 | 36 |
| USDA prices-paid data | Farm level | Annual, voluntary | n/a | n/a | n/a | n/a |
Sources: USDA AMS, Illinois Production Cost Report, Sep 18, 2026; DTN/Progressive Farmer, Sep 16, 2026; Fertilizer Daily, Sep 17, 2026 (Profercy urea) and Sep 10, 2026 (Tampa); Fertilizer International 534, Sep 15, 2026 (NOLA assessment dated Aug 20); CF Industries Q2 2026 results (Form 8-K, Exhibit 99.1), Aug 5, 2026; Rep. Dusty Johnson, Mar 26, 2026 (annual voluntary USDA data). Lag counts calendar days from the end of the price period to publication. The CF lag is counted from quarter end, Jun 30. Tampa converted at 1.10231 MT per short ton.
The patchwork has three gaps. First, US wholesale prices for the individual products are mostly behind subscriptions. The Texas A&M policy center that briefed the Senate on this in 2024 noted that "much of it is behind some type of paywall" (AFPC, Briefing Paper 24-1, Mar 2024). Second, the free producer-level number comes quarterly, as an average across grades, regions and the spring season, more than a month after the quarter closes. Third, the state distributor reports that do arrive on time are thin. On Sep 18 the Illinois UAN32 line was a single quote at $525. The Iowa report showed anhydrous down $201.60 and UAN32 down $160.05 from two weeks earlier. The Pacific Northwest report printed a change of $0.00 on all nine fertilizer lines (USDA AMS, Sep 18, 2026). Two-week moves that large in Iowa are more likely to reflect a change in which distributors reported than a real market move. A full page of zero changes in the Pacific Northwest suggests stale quotes rather than a flat market. Either way, the published average moves with who happened to answer the phone.
That is the problem mandatory reporting was designed to fix in livestock. When a voluntary panel shifts from week to week, the average shifts with it. A required panel removes the question of who answered.
3. Where the spread actually sits
What's new: Measured on USDA's own Sep 18 reports, the gap between the lowest and highest distributor ask within one state is several times larger than any month-on-month move on the national board.
Evidence: DTN's Sep 7–11 survey had no product moving 5% or more on the month. Anhydrous, for example, was $26 lower (DTN/Progressive Farmer, Sep 16, 2026). The state reports tell a different story.
| Report, Sep 18 | Product | Low ask | High ask | Average | Spread, $/st | Spread, % of avg | $/acre at 180 lb N | |
|---|---|---|---|---|---|---|---|---|
| Iowa | UAN32 | 375 | 685 | 456.20 | 310 | 68.0% | 87.19 | ██████████ |
| Pacific NW | Urea | 857 | 1,350 | 1,085.60 | 493 | 45.4% | 96.46 | ███████░░░ |
| Illinois | Urea | 595 | 890 | 722.00 | 295 | 40.9% | 57.72 | ██████░░░░ |
| Illinois | UAN28 | 400 | 585 | 506.88 | 185 | 36.5% | 59.46 | █████░░░░░ |
| Pacific NW | UAN32 | 687 | 957.09 | 822.05 | 270 | 32.9% | 75.96 | █████░░░░░ |
| Illinois | Anhydrous | 820 | 1,050 | 907.50 | 230 | 25.3% | 25.24 | ████░░░░░░ |
| Iowa | Anhydrous | 768 | 950 | 823.40 | 182 | 22.1% | 19.98 | ███░░░░░░░ |
| Illinois | DAP | 840 | 975 | 928.57 | 135 | 14.5% | n/a | ██░░░░░░░░ |
Source: USDA AMS, Illinois (ams_3195), Iowa (ams_2863) and Pacific Northwest (ams_3657) Production Cost Reports, Sep 18, 2026. Distributor asks, $/short ton, FOB, current delivery. Spreads, percentages and $/acre are Crop Root Zone calculations: the $/acre column is the high-minus-low ask converted to nitrogen at nominal analysis (82%, 46%, 32%, 28%) and multiplied by 180 lb N, product only. Bars scale the % column, with Iowa UAN32 at ten blocks. The 180 lb rate is an arithmetic illustration, not a rate recommendation.
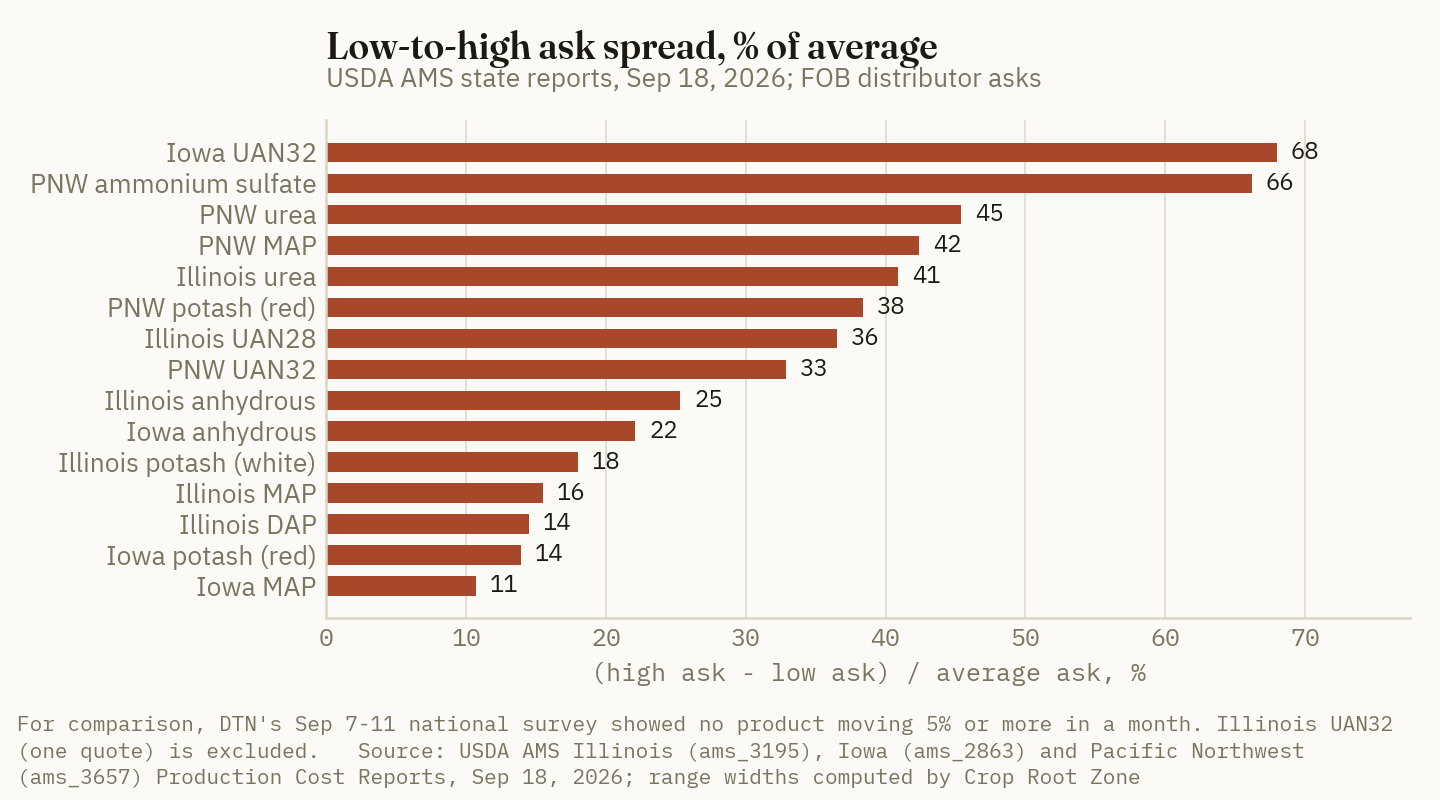
$230/ton
The gap between the lowest and highest Illinois anhydrous ask on USDA's Sep 18 report. That is about 46% of the entire September Tampa ammonia contract (≈$503/st), and nearly nine times the national month-on-month move in retail anhydrous. (USDA AMS, Sep 18, 2026; Fertilizer Daily, Sep 10, 2026; DTN/Progressive Farmer, Sep 16, 2026; Crop Root Zone calculation)
Some of that range is legitimate. Asks differ by terminal, by freight distance, by whether the ton is already in the tank or still has to be bought, and by what services come bundled with it. A published range is also not a transaction price. Still, the orders of magnitude matter. Nitrogen spreads of $20 to $96 an acre inside one state report are as large as or larger than most of the product-choice decisions this publication has priced this season. The national gap between anhydrous and UAN32, for comparison, is about $25.58 an acre at the same rate (Crop Root Zone calculation from DTN, Sep 16, 2026).
Ground Truth: The national average is the least useful number in fertilizer pricing for an individual grower, and it is the one the retail-survey half of the bill would mostly reproduce. The money is in the dispersion. A weekly wholesale print would give each grower a floor to measure against. On anhydrous, for example, "Tampa plus freight plus terminal" can be put next to a local quote. What a grower actually needs to do with the new data is simple: subtract it from each quote in hand. A retailer quoting $1,050 in a market where others ask $820, against a published wholesale figure near $500, will be harder to defend in 2028 than today. That is the practical case for the Act. It works on the retail margin indirectly, by giving the buyer a reference point.
4. The confidentiality arithmetic
What's new: The Act requires USDA to aggregate so that no company's identity or business information can be inferred. The closest precedent, livestock mandatory reporting, shows what that rule costs in concentrated markets. US fertilizer production is more concentrated than beef packing.
Evidence: In 2001, under its first confidentiality rule, requiring at least three reporters and no single reporter above 60% of volume, USDA withheld 703 of 2,376 scheduled daily cattle and swine reports between Apr 2 and Jun 14, about 30%. It replaced that rule with the "3/70/20" guideline now in use. At least three entities must report at least half the time over 60 days, no entity may supply more than 70% of the data, and no entity may be the sole reporter more than 20% of the time (Federal Register, Aug 7, 2001). The table below shows how fertilizer production compares.
| Nutrient | US HHI | US four-firm share | North America HHI | World HHI | World four-firm share | Equal-size firms implied by US HHI |
|---|---|---|---|---|---|---|
| Phosphate | 4,553 | 100% | 4,533 | 152 | 25% | 2.2 |
| Potash | 3,455 | 100% | 4,255 | 1,011 | 84% | 2.9 |
| Nitrogen | 2,382 | 77% | 2,242 | 368 | 13% | 4.2 |
Source: Fischer, Outlaw, Bryant, Raulston and Knapek, "Concentration and Competition in the U.S. Fertilizer Industry," AFPC Briefing Paper 24-1, Texas A&M University, Mar 2024 (capacity-based, 2022, from Bloomberg Green Markets plant data). The last column is Crop Root Zone arithmetic (10,000 ÷ HHI), the number of equal-size firms that would produce the same index. For scale, the 2023 DOJ/FTC Merger Guidelines treat an HHI above 1,800 as highly concentrated.
30%
Share of scheduled daily cattle and swine reports USDA withheld in spring 2001 under its first confidentiality rule: 703 of 2,376. US phosphate and potash production are more concentrated than the markets that rule was written for. (Federal Register, Aug 7, 2001)
Production concentration is not the same as the number of reporters in a price cell. Importers and trading houses count as wholesalers under the bill, and on imported urea and phosphate they add reporters. Nationally, weekly urea and UAN series would probably clear a 3/70/20-type test. The problems are regional and product-specific. Examples include ammonia into a single river terminal, potash in a region served mostly by one supplier, and a phosphate grade from one plant. In those cells one company can easily exceed 70% of reported volume. The bill promises state and regional numbers only "as appropriate," which leaves USDA room to suppress them (Crop Root Zone reading of S. 4152; estimate, since USDA has not proposed a fertilizer confidentiality rule).
Ground Truth: The Act's promise is weakest where concentration is highest, and those are the markets whose pricing prompted it. Expect the national urea, UAN and imported-phosphate series to publish reliably. Expect many state-level ammonia, potash and domestic phosphate cells to be blank or rolled up into large regions. For a Corn Belt grower that means the new wholesale number will usually be a Gulf or national figure plus freight. That is about what Tampa and NOLA already give a subscriber today, except that the new figure will be free, weekly and based on required reports. The gain is real, but it comes mostly from making existing paid information free, not from new visibility into local markets.
5. The calendar, and what to do before any of it exists
What's new: The farm bill still needs a Senate floor vote, 60 votes to overcome a filibuster, and a deal with the House. Both chambers are expected to be out of Washington for about six weeks around the midterm elections (Farm Policy News, Sep 16, 2026).
Evidence: The livestock precedent shows how long it takes to go from law to first report. The Livestock Mandatory Reporting Act was enacted in October 1999 as part of P.L. 106-78, and mandatory reporting took effect in April 2001, about 18 months later (AFPC Briefing Paper 24-1, quoting the Congressional Research Service). The fertilizer bill sets no deadline for USDA to stand up its program. If it were enacted in a lame-duck session this winter and USDA matched the livestock pace, the first mandatory weekly fertilizer prints would arrive around mid-2028 (Crop Root Zone estimate). That would be after the 2027 fall application season and probably too late for most 2028 spring booking. Meanwhile, the Fertilizer Institute has asked for a crop-inputs economist in USDA's Office of the Chief Economist rather than a new reporting mandate (Western Ag Network, Aug 12, 2026). That position is worth watching as the bill moves toward conference.
For the 2026–27 season, then, the public record stays as described in section 2. The table below turns the Sep 18 Illinois ranges into a per-acre cost of accepting a single quote at the high end instead of the average.
| Illinois, Sep 18, 180 lb N | Average ask, $/acre | High ask, $/acre | Cost of taking the high quote, $/acre | Per 1,000 acres |
|---|---|---|---|---|
| Anhydrous | 99.60 | 115.24 | 15.64 | 15,640 |
| Urea | 141.26 | 174.13 | 32.87 | 32,870 |
| UAN28 | 162.93 | 188.04 | 25.11 | 25,110 |
Source: USDA AMS, Illinois Production Cost Report, Sep 18, 2026. Crop Root Zone calculation at nominal N content and 180 lb N/acre, product only, with no application, inhibitor or delivery charge. Asks are FOB distributor and are not transaction prices.
Ground Truth: The bill will not be in place in time to price the 2027 crop's nitrogen, so each grower has to do the reporting it would have done. The livestock rule offers a usable standard: no decision on fewer than three independent quotes, and no single supplier setting the reference. In practice that means three written quotes per product, each converted to dollars per pound of nutrient, each with its basis (FOB or delivered, when, in whose tank), and each set against the freshest free wholesale figure: Tampa for ammonia, NOLA for urea and potash, even if the NOLA print is weeks old. On the Illinois ranges above, the difference between the average and the high quote is $16 to $33 an acre on nitrogen alone. That is more than most spring input decisions are worth, and the only tool it takes is a phone.
References
- Farm Policy News (University of Illinois), "Ag Committee Advances Farm Bill 2.0 to Uncertain Future in Full Senate," Sep 16, 2026 — https://farmpolicynews.illinois.edu/2026/09/farm-bill-2-0-advances-to-uncertain-future-in-full-senate/
- S. 4152, Fertilizer Transparency Act of 2026, introduced Mar 19, 2026 (introduced text, GovInfo) — https://www.govinfo.gov/content/pkg/BILLS-119s4152is/html/BILLS-119s4152is.htm
- Congress.gov, S. 4152 and H.R. 8104, Fertilizer Transparency Act of 2026 (bill status pages, accessed Sep 22, 2026) — https://www.congress.gov/bill/119th-congress/senate-bill/4152 ; https://www.congress.gov/bill/119th-congress/house-bill/8104
- Office of Rep. Dusty Johnson, "Johnson Legislation Gives Producers Fertilizer Price Transparency," Mar 26, 2026 — https://dustyjohnson.house.gov/media/press-releases/johnson-legislation-gives-producers-fertilizer-price-transparency
- DTN/Progressive Farmer, "At Texas Gathering, FTC Announces Fertilizer Antitrust Investigation Amid Farmer Complaints," May 28, 2026 — https://www.dtnpf.com/agriculture/web/ag/crops/article/2026/05/28/texas-gathering-ftc-announces-amid
- Radio Iowa, O. Kay Henderson, "During Iowa stop, USDA deputy urges farmers to anonymously report fertilizer woes," Sep 14, 2026 — https://www.radioiowa.com/2026/09/14/during-iowa-stop-usda-deputy-urges-farmers-to-anonymously-report-fertilizer-woes/
- Brownfield Ag News, "Farmers share fertilizer concerns with USDA Deputy Secretary Vaden at Iowa hearing," Sep 11, 2026 — https://www.brownfieldagnews.com/news/farmers-share-fertilizer-concerns-with-usda-deputy-secretary-vaden-at-iowa-hearing/
- USDA AMS, Illinois Production Cost Report (Bi-weekly), Sep 18, 2026 — https://www.ams.usda.gov/mnreports/ams_3195.pdf
- USDA AMS, Iowa Production Cost Report (Bi-weekly), Sep 18, 2026 — https://www.ams.usda.gov/mnreports/ams_2863.pdf
- USDA AMS, Pacific Northwest Production Cost Report (Bi-weekly), Sep 18, 2026 — https://www.ams.usda.gov/mnreports/ams_3657.pdf
- DTN/Progressive Farmer, Russ Quinn, "Fertilizer Prices Continue Lower for 6 of 8 Major Nutrients," Sep 16, 2026 (retail survey Sep 7–11, 2026) — https://www.dtnpf.com/agriculture/web/ag/crops/article/2026/09/16/fertilizer-prices-continue-lower-6-8
- Fertilizer Daily, "Urea climbs to $453 per tonne as tight granular supply lifts Profercy nitrogen index 6 points," Sep 17, 2026 — https://www.fertilizerdaily.com/20260917-urea-price-453-september-2026-profercy-nitrogen-index/
- Fertilizer Daily, "Tampa ammonia price drops to $555/t in September — 4th straight monthly decline from $825 peak," Sep 10, 2026 — https://www.fertilizerdaily.com/20260910-tampa-ammonia-price-555-september-2026-fourth-monthly-decline/
- Fertilizer International 534 (Sep–Oct 2026), "Market Insight," BCInsight / CRU Group, Sep 15, 2026 (NOLA assessment dated Aug 20, 2026) — https://www.bcinsight.crugroup.com/2026/09/15/market-insight-41/
- CF Industries Holdings, Inc., second-quarter 2026 results (Form 8-K, Exhibit 99.1), Aug 5, 2026 — https://www.sec.gov/Archives/edgar/data/1324404/000132440426000017/cf-08052026_ex991xearnings.htm
- Bart L. Fischer, Joe L. Outlaw, Henry L. Bryant, J. Marc Raulston and George M. Knapek, "Concentration and Competition in the U.S. Fertilizer Industry," AFPC Briefing Paper 24-1, Agricultural and Food Policy Center, Texas A&M University, Mar 2024 — https://afpc.tamu.edu/research/publications/725/BP-24-1_AFPC-Fertilizer-Markets-May-2024.pdf
- Federal Register, USDA AMS, "Livestock Mandatory Reporting: Confidentiality Guideline," Aug 7, 2001 — https://www.govinfo.gov/content/pkg/FR-2001-08-07/html/01-19876.htm
- U.S. Department of Justice and Federal Trade Commission, Merger Guidelines, Dec 18, 2023 — https://www.justice.gov/atr/2023-merger-guidelines
- Western Ag Network, "Fertilizer Industry Pushes for Greater Market Transparency in Farm Bill," Aug 12, 2026 — https://westernagnetwork.com/fertilizer-industry-pushes-for-greater-market-transparency-in-farm-bill
Disclosures
Crop Root Zone is an independent publication. Nothing here is investment advice. Market calls, where included, reflect the editors' own read and are not a recommendation to buy or sell any security.
Kansas' 2027 Wheat Acre Pays in Rotation and Fallow, Not in Continuous Wheat. Fertilizer Moved the Math by $4 to $9.
We repriced all eleven K-State dryland wheat budgets at September retail fertilizer and a July 2027 KC settlement of $7.745 less 70 cents of basis. The fertilizer increase since K-State's November prices adds $3.83 to $8.89 an acre. The wheat price adds $59 to $110. Eight budgets now clear full cost. The three continuous-wheat budgets still lose $43 to $117 an acre and need 43 to 58 bushels to break even, against 37 to 41 planned. RMA's $8.11 projected price is 36.5 cents above the July board, and at 75% coverage it puts the revenue guarantee above direct cost in all eleven budgets. To pay its way, a grazed South Central acre has to earn about 56 to 83 cents per pound of gain.
Kansas wheat growers have until Wednesday, September 30, to settle their 2027 crop insurance, and the price that insurance runs on is already fixed. USDA's Risk Management Agency set the 2027 Kansas winter wheat projected price at $8.11 a bushel, with a volatility factor of 0.25 (USDA RMA, PM-26-056, Sep 17, 2026). The 2026 figure was $5.61 (FCSAmerica, per USDA RMA). The July 2027 Kansas City contract then slipped, settling at $8.0575 on September 15 (K-State, Sep 16, 2026) and $7.745 on September 25 (USDA AMS, Sep 25, 2026). We repriced all eleven of Kansas State's dryland wheat cost-return budgets against those numbers. The result sorts the 2027 acre by rotation, not by fertilizer. Wheat in a rotation, in wheat-fallow and in the southeast now covers every cost K-State charges, rent and machinery included. Continuous wheat still does not. The fertilizer increase since K-State set its prices moves the answer by less than $9 an acre in any budget.
1. Eleven budgets, repriced
What's new: K-State's 2026 Farm Management Guide wheat budgets are dated November 1, 2025 (Ibendahl, O'Brien, Lancaster and co-authors). They are the most recent Kansas wheat budgets published, and no 2027 set had been posted to AgManager.info as of this writing. They price the wheat crop at $5.22 to $5.56 a bushel, depending on region. Their fertilizer lines use roughly $850 a ton for anhydrous, $598 for urea and $932 for MAP. Those product prices are our back-calculation from each budget's pounds and dollars.
Evidence: DTN's retail survey for September 14–18, 2026 put anhydrous at $945 a ton, urea at $659, MAP at $967 and potash at $495. On a nitrogen basis that is $0.58 per pound of N for anhydrous and $0.72 for urea (DTN/Progressive Farmer, Sep 23, 2026).
| Product | K-State budget, Nov 2025* | DTN retail, Sep 14–18, 2026 | Change |
|---|---|---|---|
| Anhydrous ammonia (82-0-0), $/st | 850* | 945 | +11.2% |
| Urea (46-0-0), $/st | 598* | 659 | +10.2% |
| MAP (11-52-0), $/st | 932* | 967 | +3.8% |
| Potash (0-0-60), $/st | 487* | 495 | +1.6% |
Source: K-State Department of Agricultural Economics, 2026 Farm Management Guide wheat cost-return budgets, Nov 1, 2025; DTN/Progressive Farmer, Sep 23, 2026. Basis: average retail, delivered to farm. *Crop Root Zone calculation: product dollars divided by product pounds in each budget's detailed fertilizer section (for example, $28.90 for 68 lb of anhydrous).
We repriced each budget one product at a time. Anhydrous, urea, MAP and potash pounds were held at K-State's rates and multiplied by the September retail price. Lime was left at K-State's cost. We scaled the crop insurance premium by the ratio of the new $8.11 projected price to the old $5.61, because premium rises with liability. That scaling is an estimate. It ignores any change in rating or the volatility factor. We recomputed operating interest at each budget's own rate, and carried every other line at K-State's figure. For price, we took the July 2027 KC settlement of $7.745 on September 25 and subtracted 70 cents. Kansas country elevators bid ordinary-protein HRW at 60 to 80 cents under December futures that day (USDA AMS, Kansas Daily Grain Bids, Sep 25, 2026). The result, a planning price of about $7.05, is our estimate and not a quote. Harvest basis against July can run wider or narrower than today's spot basis against December.
This is a different cut from the one we ran on September 18. That piece repriced a single budget, South Central continuous wheat, and priced its 60 pounds of N as urea. K-State's budget actually specifies anhydrous. Repriced product by product at the $8.11 insurance price, the same acre comes to $303.84, not $311.01.
2. Where the acre breaks even
What's new: At about $7.05 cash, eight of the eleven budgets return money above total cost. The three that do not are all continuous wheat.
Evidence:
| K-State budget (dryland, middle yield) | Planning yield, bu | N, lb | Total cost, repriced, $/ac* | Break-even price at planning yield, $/bu* | Break-even yield at $7.05, bu* | Return above total cost at $7.05, $/ac* |
|---|---|---|---|---|---|---|
| South Central, rotation | 62 | 101 | 309.10 | 4.99 | 43.9 | +127.69 |
| North Central, rotation | 62 | 101 | 347.98 | 5.61 | 49.4 | +88.81 |
| Northwest, wheat-fallow | 60 | 83 | 339.72 | 5.66 | 48.2 | +82.98 |
| Southeast | 61 | 110 | 357.17 | 5.86 | 50.7 | +72.58 |
| Northwest, W-S/C-F | 60 | 83 | 351.88 | 5.86 | 49.9 | +70.82 |
| Northeast, rotation | 68 | 122 | 423.78 | 6.23 | 60.2 | +55.28 |
| Southwest, W-S/C-F | 54 | 75 | 330.38 | 6.12 | 46.9 | +50.05 |
| Southwest, wheat-fallow | 54 | 74 | 344.42 | 6.38 | 48.9 | +36.01 |
| South Central, continuous | 37 | 60 | 303.84 | 8.21 | 43.1 | −43.17 |
| North Central, continuous | 37 | 60 | 343.65 | 9.29 | 48.8 | −82.99 |
| Northeast, continuous | 41 | 74 | 406.13 | 9.91 | 57.6 | −117.29 |
Source: Crop Root Zone calculation from K-State Department of Agricultural Economics, 2026 Farm Management Guide wheat cost-return budgets (all dated Nov 1, 2025); DTN/Progressive Farmer retail survey, Sep 14–18, 2026; USDA AMS Kansas Daily Grain Bids, Sep 25, 2026; USDA RMA PM-26-056, Sep 17, 2026. Total cost includes K-State's cash rent and machinery capital recovery. *Estimated cells: repriced as described in Section 1. The $7.05 price is the July 2027 KC settlement of $7.745 less an assumed 70-cent basis. W-S/C-F is wheat–sorghum or corn–fallow.
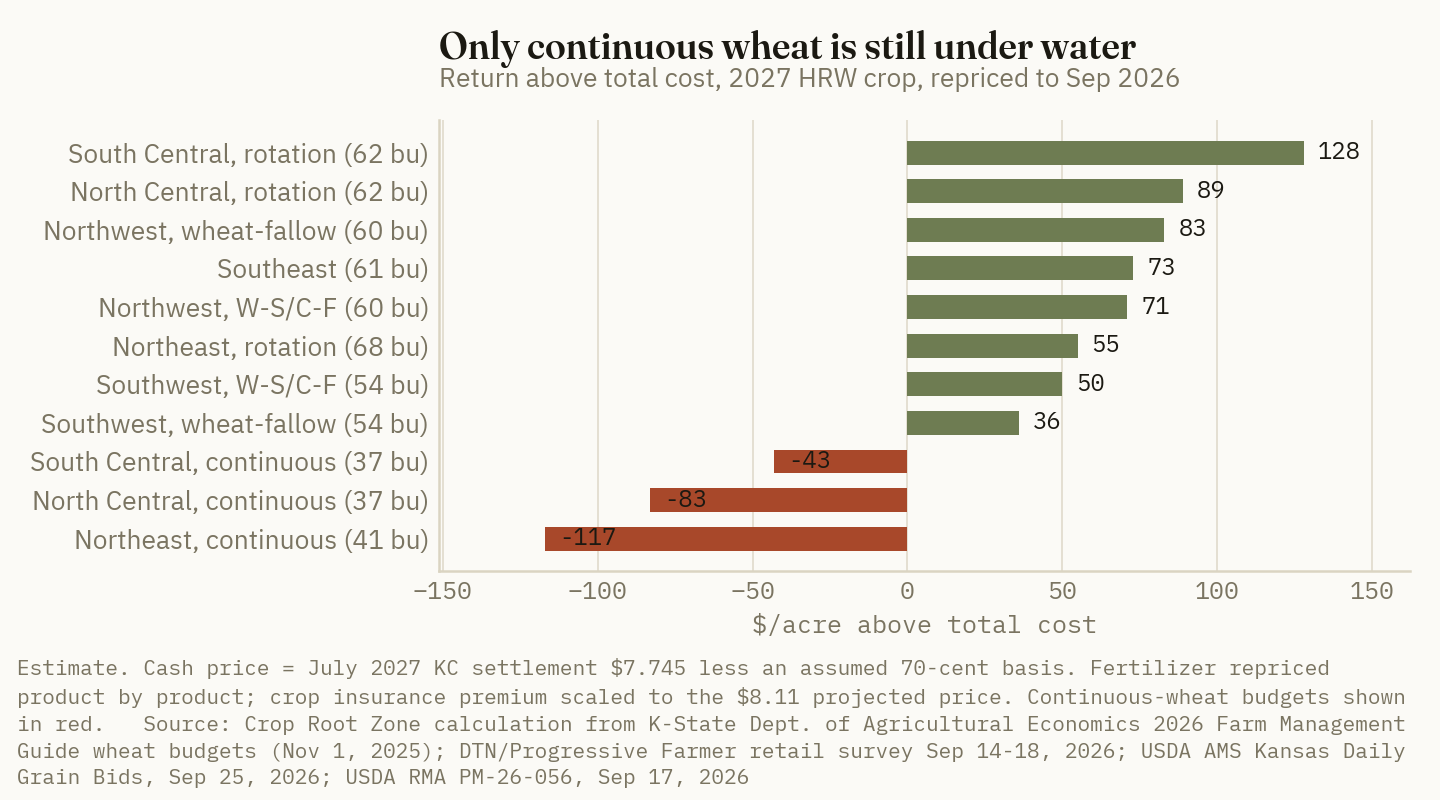
The table's lesson is the yield K-State assigns to each system. Rotation and fallow wheat carry planning yields of 54 to 68 bushels. Continuous wheat carries 37 to 41. The break-even yields for all eleven budgets fall in a fairly narrow band, 43 to 60 bushels, because costs per acre do not differ by much. What separates the budgets is whether the planning yield sits above that band or below it. For every rotation and fallow budget it sits above. For every continuous budget it sits below, by 6 to 17 bushels.
On K-State's own November prices, only one of the eleven budgets, South Central rotation wheat, covered total cost (+$40.89). Our repricing adds between $59 and $110 of revenue per acre through price, against less than $15 of added cost in any budget. That flips seven budgets from red to black.
Ground Truth: The question for fields that went to wheat after wheat is not whether $7 wheat pays. It is whether the field's own record looks like K-State's 37-bushel continuous yield or like its 62-bushel rotation yield. A continuous-wheat field that has held near 50 bushels because of moisture, residue and weed control belongs with the rotation rows. One that averages in the high 30s does not become profitable at this price, even with fertilizer held flat. The 2027 acres most exposed are second- and third-year wheat in central Kansas, which drilled early because the price was attractive. For those fields the case for seeding rests on direct-cost coverage and the insurance floor in Section 4, not on a full-cost profit.
3. Fertilizer's share, and why it barely moves the answer
What's new: Retail nitrogen is up about 10–11% on K-State's November prices. The nitrogen-heavy budgets have fertilizer as their largest single direct cost. Even so, fertilizer is not what changed the outcome.
Evidence: Repriced fertilizer ranges from $63.57 an acre (North Central continuous) to $136.33 (Northeast rotation). That is 18.5% to 35.6% of total cost, and $1.18 to $2.00 per budgeted bushel.
| K-State budget | Fertilizer, $/ac (repriced) | Share of total cost | $/bu of planning yield | |
|---|---|---|---|---|
| South Central, rotation | 110.11 | 35.6% | 1.78 | ██████████ |
| Southeast | 118.63 | 33.2% | 1.94 | █████████ |
| Northeast, rotation | 136.33 | 32.2% | 2.00 | █████████ |
| North Central, rotation | 110.11 | 31.6% | 1.78 | █████████ |
| Northwest, W-S/C-F | 81.62 | 23.2% | 1.36 | ███████ |
| Southwest, W-S/C-F | 73.60 | 22.3% | 1.36 | ██████ |
| South Central, continuous | 64.05 | 21.1% | 1.73 | ██████ |
| Northwest, wheat-fallow | 71.01 | 20.9% | 1.18 | ██████ |
| Northeast, continuous | 78.49 | 19.3% | 1.91 | █████ |
| North Central, continuous | 63.57 | 18.5% | 1.72 | █████ |
| Southwest, wheat-fallow | 63.86 | 18.5% | 1.18 | █████ |
Source: Crop Root Zone calculation from K-State 2026 Farm Management Guide wheat budgets (Nov 1, 2025) and DTN/Progressive Farmer retail survey, Sep 14–18, 2026. All values are estimates. Bars scaled to share of total cost, longest = ten blocks. Fertilizer includes lime where K-State budgets it.
The rotation budgets carry the largest fertilizer share because they carry the most nitrogen. They budget 101 to 122 pounds of N, all as urea, plus MAP. The wheat-fallow budgets use 74 to 83 pounds as anhydrous, the cheapest nitrogen on the September board at $0.58 a pound. The fallow year also spreads machinery and rent across a larger denominator.
The increase is small next to the price move. Across the eleven budgets, the September repricing adds $3.83 to $8.89 an acre in fertilizer. Moving wheat from K-State's $5.22–$5.56 to about $7.05 adds $59 to $110 of revenue on the same planning yields. That is 11 to 20 times as large.
$3.83 to $8.89 an acre
What ten months of retail fertilizer movement added to K-State's eleven wheat budgets. The wheat price change over the same period added $59 to $110 of revenue per acre, 11 to 20 times as much. (Crop Root Zone calculation from K-State, Nov 1, 2025; DTN/Progressive Farmer, Sep 23, 2026; USDA AMS, Sep 25, 2026)
One fertilizer decision still carries real money. For the urea-based budgets, switching the fall nitrogen from urea at $0.72 per pound of N to anhydrous at $0.58 saves 14 cents a pound. South Central rotation takes about 94 of its 101 pounds as urea, so the switch is worth about $13 an acre where the equipment and timing allow. That is nearly twice the whole ten-month repricing on that budget ($7.25).
Ground Truth: For the 2027 wheat acre, the fertilizer question is what form of nitrogen to buy, not how much to cut. A grower who trims the rate on a rotation field to save $7 is giving up yield on the one budget line that decides break-even. A grower who moves the same pounds from urea to anhydrous saves nearly twice as much and gives up no yield. The fertilizer price that most deserves a hard look this fall is the phosphate on continuous-wheat ground. K-State's own agronomists recommend phosphorus at planting on dry seedbeds to support early development (K-State Agronomy eUpdate, Sep 17, 2026). Seedbeds are dry across much of central Kansas this year, and phosphate is the input the continuous budget can least afford to drop.
4. The insurance price is above the board
What's new: The $8.11 projected price is the average of July 2027 closes between August 15 and September 14. It is now 36.5 cents above where that contract settled on September 25. For a revenue-protection policy, the guarantee is set at the higher of the projected price and the harvest price. So the 2027 revenue floor was fixed near the top of the recent range, and the board has since come off.
Evidence: Using each budget's planning yield as a stand-in for the grower's approved (APH) yield:
| K-State budget | 75% RP guarantee at $8.11, $/ac* | Direct cost, repriced, $/ac* | Guarantee minus direct cost* | Guarantee minus total cost* |
|---|---|---|---|---|
| South Central, rotation | 377.11 | 218.28 | +158.83 | +68.01 |
| North Central, rotation | 377.11 | 228.14 | +148.98 | +29.14 |
| Northeast, rotation | 413.61 | 261.92 | +151.69 | −10.17 |
| Southeast | 371.03 | 246.07 | +124.96 | +13.86 |
| Northwest, wheat-fallow | 364.95 | 224.48 | +140.47 | +25.23 |
| Southwest, wheat-fallow | 328.45 | 208.18 | +120.28 | −15.96 |
| South Central, continuous | 225.05 | 195.16 | +29.89 | −78.79 |
| North Central, continuous | 225.05 | 207.72 | +17.33 | −118.60 |
| Northeast, continuous | 249.38 | 225.34 | +24.04 | −156.75 |
Source: Crop Root Zone calculation from USDA RMA, PM-26-056 attachment (2027 Kansas winter wheat projected price $8.11, sales closing Sep 30, 2026); K-State 2026 Farm Management Guide wheat budgets; DTN/Progressive Farmer, Sep 23, 2026. The two W-S/C-F budgets are omitted. Their guarantees equal the wheat-fallow guarantees in the same regions; the Northwest W-S/C-F guarantee clears total cost by $13.07, and the Southwest one falls $1.93 short. *Estimates. The guarantee equals 75% × planning yield × $8.11 and assumes the APH equals K-State's planning yield. The guarantee is measured at futures-based insurance prices, while grain is sold at cash, so a grower's realized floor is lower by basis on the bushels actually sold. Direct cost includes the scaled premium estimate.
At 75% coverage the guarantee exceeds direct cost in all eleven budgets. That includes the three continuous-wheat acres, though by only $17 to $30. It exceeds total cost in five of the eleven, counting both W-S/C-F budgets. For a continuous-wheat acre in South Central Kansas, the policy turns an expected $43 loss on full cost into a revenue floor that roughly covers seed, fertilizer, fuel, chemicals and premium. It does not cover rent or machinery capital recovery.
Ground Truth: The 36.5-cent gap between the insurance price and the board is the part of this fall's math most likely to be overlooked. Because the guarantee uses the higher of the projected and harvest prices, a grower who forward-sells some of the 2027 crop at today's lower board still has the $8.11 revenue floor behind the unsold bushels. That is the standard reason revenue protection and forward sales work together. It carries more weight this year because the floor sits above the market. Coverage level is worth more attention than usual, too. On a 62-bushel rotation acre, each 5-point step in coverage adds about $25 of guaranteed revenue. The premium for that step will come on the quote, and it is the number to weigh against the $25 before Wednesday.
5. The alternatives: spring crops, grazing and the calendar
What's new: Central Kansas spring crops still earn more per acre than wheat on the same repricing. The gap has narrowed sharply since November.
Evidence: We applied the same fertilizer repricing to K-State's South Central and North Central sorghum and soybean budgets. Sorghum was priced at December 2027 corn of $5.28 less an 80-cent basis, within the 55- to 90-cent range of Kansas sorghum bids on September 25. Soybeans were priced at the September 2027 contract of $12.9175 less $1.00, in line with Kansas country-elevator soybean basis (USDA AMS, Sep 25, 2026). Both prices are our estimates. The sorghum and soybean insurance premiums are left at K-State's values, because their 2027 projected prices will not be set until February.
| Return above total cost, $/acre | K-State, Nov 2025 | Repriced, Sep 2026* |
|---|---|---|
| South Central — continuous wheat (37 bu) | −93.61 | −43.17 |
| South Central — rotation wheat (62 bu) | +40.89 | +127.69 |
| South Central — grain sorghum (110 bu, $4.48*) | +202.44 | +186.82 |
| South Central — soybeans (40 bu, $11.92*) | +149.39 | +203.88 |
| North Central — continuous wheat (37 bu) | −137.08 | −82.99 |
| North Central — rotation wheat (62 bu) | −3.88 | +88.81 |
| North Central — grain sorghum (120 bu, $4.48*) | +192.03 | +160.62 |
| North Central — soybeans (45 bu, $11.92*) | +134.49 | +200.74 |
Source: K-State 2026 Farm Management Guide cost-return budgets for wheat, grain sorghum and soybeans, South Central and North Central Kansas, Nov 1, 2025; repriced by Crop Root Zone with DTN/Progressive Farmer (Sep 23, 2026) and USDA AMS Kansas Daily Grain Bids (Sep 25, 2026) prices. *Estimated values.
In South Central Kansas, the gap between rotation wheat and sorghum narrowed from $162 an acre on K-State's November prices to $59. For continuous wheat against sorghum it narrowed from $296 to $230. These are one-season comparisons, and they overstate the choice. In most of the state wheat and sorghum are not substitutes on the same acre in the same year. Wheat precedes the summer crop, or alternates with it through fallow. For a field that went to wheat or sorghum this year, the real alternative to drilling now is to leave it idle until spring. Its rotational value, and the moisture it stores in the meantime, are not captured in a single budget.
Grazing. Dual-purpose wheat is the other alternative, and the higher wheat price raises the bar for it. K-State's guidance for grazed wheat calls for seeding at 90 to 120 pounds an acre (K-State Agronomy eUpdate, Sep 10, 2026), with 120 recommended for dryland central and eastern Kansas. The grain-only budgets here use 60 to 90. It adds 30 to 40 pounds of nitrogen for every 1,000 pounds of dry forage or 100 pounds of beef harvested (K-State MF3375, Aug 2017). The same publication reports a long-run grain yield loss of about 14% for the dual-purpose system in north-central Oklahoma. In K-State's 2024–25 Hutchinson trial, fall forage averaged 1,556 pounds of dry matter an acre, and simulated grazing cut grain yield by an average of 12.4 bushels, from 58.0 to 45.6 (K-State MF3312). The trial report states that roughly 100 pounds of beef can be produced for every 1,000 pounds of wheat forage.
| South Central acre, grazed vs. grain-only | Extra seed | Extra N, 45 lb at $0.58 | Grain given up at $7.05 | Total cost of grazing | Needed per lb of gain* | Same at K-State's $5.45 |
|---|---|---|---|---|---|---|
| Continuous (37 bu), 14% yield loss | 21.00 | 26.10 | 36.49 (5.2 bu) | 83.59 | $0.56 | $0.50 |
| Rotation (62 bu), 14% yield loss | 10.50 | 26.10 | 61.15 (8.7 bu) | 97.75 | $0.65 | $0.56 |
| Rotation, 12.4 bu loss (Hutchinson 2024–25) | 10.50 | 26.10 | 87.36 (12.4 bu) | 123.96 | $0.83 | $0.69 |
Source: Crop Root Zone calculation. Seed at K-State's $0.35/lb, raised to 120 lb/acre; nitrogen at DTN's $0.58/lb N for anhydrous (Sep 23, 2026); yield-loss rates from K-State MF3375 and MF3312. *Estimates, assuming 1,500 lb of fall and winter dry matter producing about 150 lb of gain per acre. Excludes fencing, water and management, which are usually the cattle owner's costs.
At $7 wheat, a South Central grazing arrangement has to return roughly 56 to 83 cents per pound of gain to the landowner just to match the grain-only acre. The rally added 6 to 14 cents to that bar. We do not have a verified 2026 Kansas wheat-pasture rental rate to set against it. Growers should compare the table with whatever their local cattle buyer is actually offering per pound of gain or per head-day.
The calendar. Kansas was 10% planted on September 20, against 8% a year earlier and a 13% five-year average. Across the 18 major states the crop was 17% planted, against 19% and 21% (USDA NASS, Crop Progress, Sep 21, 2026). Oklahoma, the heart of dual-purpose country, was 4% planted against a 14% average. Nebraska was 22% against 35%. Kansas topsoil was 63% short or very short, and pasture and range were rated 39% poor or very poor (USDA NASS Kansas, Sep 21, 2026). K-State's soil-water model had 75% of the state below the crop water-stress threshold on September 16. It projected 88% by October 1 without more rain (K-State Agronomy eUpdate, Sep 17, 2026). The report for the week ending September 27 is due after this issue closes.
Ground Truth: Two things are pulling Kansas wheat acres in opposite directions this fall, and the budgets show which one is stronger. The price pulls acres in: at about $7.05, eight of eleven K-State systems clear full cost, and the insurance floor covers direct cost on all of them. Dry soil pulls acres out, and it pulls grazing out first. Short fall forage means fewer head-days per acre, just when the higher grain price has raised what grazing must earn. Our read is that 2027 Kansas seedings will rise on rotation and fallow ground, and dual-purpose acres will not keep pace unless October rain arrives. The acres we would scrutinize hardest are continuous wheat on fields with no documented yield above the high 30s. On those fields, $7 wheat still does not cover full cost, and the insurance guarantee covers direct costs with only $17 to $30 to spare.
What to watch. Three dated items land in the next two weeks. The first is the September 30 sales-closing deadline for Kansas winter wheat insurance, the same day USDA publishes its Small Grains Summary with final 2026 production (K-State, Sep 16, 2026). The second is the October Crop Progress reports. If Kansas planting runs more than five points behind average into mid-October, that is the sign that moisture, not price, is setting the 2027 acreage. The third is the July 2027 KC contract. At our assumed 70-cent basis, each 10-cent move on the board shifts a 62-bushel rotation acre by $6.20. The same move shifts the insurance floor by nothing unless the board finishes above $8.11 at harvest.
References
- USDA Risk Management Agency, PM-26-056, "2026 Crop Year Common Crop Insurance Policy Harvest Prices and 2027 CY Common Crop Insurance Policy and Area Risk Protection Insurance Projected Prices and Volatility Factors," and attachment, Sep 17, 2026 — https://www.rma.usda.gov/policy-procedure/bulletins-memos/product-management-bulletin/pm-26-056-2026-crop-year-cy-common ; https://www.rma.usda.gov/sites/default/files/2026-09/PM-26-056-attachment.pdf
- FCSAmerica, Crop Insurance Price Guarantees (USDA RMA fall price discovery, Kansas winter wheat, 2025 and 2026 crop years), accessed Sep 28, 2026 — https://www.fcsamerica.com/insurance/resources/crop-insurance-prices
- USDA AMS Livestock, Poultry and Grain Market News, Kansas Daily Grain Bids (futures settlements and country/terminal elevator basis), Sep 25, 2026 — https://www.ams.usda.gov/mnreports/ams_2886.pdf
- USDA AMS Livestock, Poultry and Grain Market News, Kansas City Board of Trade Daily Wheat Bids, Sep 25, 2026 — https://www.ams.usda.gov/mnreports/ams_3223.pdf
- D. O'Brien (prepared for), "U.S. Hard Red Winter Wheat Market Outlook — Supply-Demand & Price Outlook Through December 31, 2026," K-State Research and Extension, AgManager.info, Sep 16, 2026 — https://www.agmanager.info/sites/default/files/newsletters/Wheat_Outlook_9-16-26.pdf
- K-State Department of Agricultural Economics (G. Ibendahl, D. O'Brien, S. Lancaster, with S. Duncan, D. Shoup, J. Holman and L. Haag), 2026 Farm Management Guides for Non-Irrigated Crops: Wheat (Continuous) budgets for North Central, Northeast and South Central KS; Wheat (Rotation) budgets for North Central, Northeast and South Central KS; Wheat budget for Southeast Kansas; Wheat (W-F) and Wheat (W-S/C-F Rotation) budgets for Northwest and Southwest KS; Grain Sorghum and Soybean budgets for North Central and South Central Kansas; all dated Nov 1, 2025 — https://www.agmanager.info/farm-budgets/2026-farm-management-guides-non-irrigated-crops
- DTN/Progressive Farmer, R. Quinn, "Fertilizer Prices Rise for Six of Eight Major Fertilizers," Sep 23, 2026 (retail survey Sep 14–18, 2026) — https://www.dtnpf.com/agriculture/web/ag/crops/article/2026/09/23/fertilizer-prices-rise-six-eight
- USDA National Agricultural Statistics Service, Crop Progress, Sep 21, 2026 (week ending Sep 20, 2026) — https://esmis.nal.usda.gov/sites/default/release-files/796068/prog3826_0.pdf
- USDA NASS Northern Plains Regional Field Office, Kansas Crop Progress and Condition, Sep 21, 2026 (week ending Sep 20, 2026) — https://www.nass.usda.gov/Statistics_by_State/Kansas/Publications/Crop_Progress_and_Condition/2026/KS-weekly0921.pdf
- K-State Agronomy eUpdate, Issue 1121: "Considerations When Planting Wheat into Dry Soil" and A. Patrignani, "Kansas Soil Moisture Update – September 16, 2026," Sep 17, 2026 — https://www.agronomy.k-state.edu/eupdates/2026/issue-1121-september-17/planting-wheat-into-dry-soil.html ; https://www.agronomy.k-state.edu/eupdates/2026/issue-1121-september-17/kansas-soil-moisture-update-sept-16-2026.html
- K-State Agronomy eUpdate, Issue 1120, "Small Grain Forage Options For This Fall," Sep 10, 2026 — https://www.agronomy.k-state.edu/eupdates/2026/issue-1120-september-10/small-grain-forages-for-fall.html
- R. P. Lollato et al., Dual-Purpose Wheat: Management for Forage and Grain Production, K-State Research and Extension MF3375, Aug 2017 — https://bookstore.ksre.ksu.edu/item/dual-purpose-wheat-management-for-forage-and-grain-production_MF3375
- K-State Research and Extension, Dual-Purpose Wheat Variety Performance 2025, MF3312 (Hutchinson, KS, 2024–25 trials) — https://bookstore.ksre.ksu.edu/item/dual-purpose-wheat-variety-performance-2025_MF3312
Disclosures
Crop Root Zone is an independent publication. Nothing here is investment advice. Market calls, where included, reflect the editors' own read and are not a recommendation to buy or sell any security.
A Second Year of Corn Costs $65 an Acre in Illinois' 2027 Budget. Fertilizer Is $10 of It.
farmdoc's 2027 budget for high-productivity central Illinois ground puts corn after corn $65 an acre behind corn after soybeans at $5.00 corn. A 10-bushel yield drag accounts for $50 of that and fertilizer for $10. At DTN's $0.58 per pound of N for anhydrous, the 14-pound gap between Illinois' corn-after-corn and corn-after-soybean N rates costs about $8, and the past year's 22% rise in anhydrous added only about $1.44 to it. Set against soybeans after corn, a second year of corn gives up $115 an acre. That gap closes only at $5.49 cash corn or $10.51 cash soybeans. If the second-year yield drag is closer to the 2% measured across Corn Belt fields, the corn price needed falls to $5.38.
The University of Illinois' first 2027 crop budgets put corn after corn on high-productivity central Illinois farmland at a loss of $29 an acre after cash rent. The same budget puts corn after soybeans at a $36 profit and soybeans after corn at an $86 profit (farmdoc, Aug 2026). Those budgets use $5.00 corn and $12.00 soybeans. The budgets were published September 1 (farmdoc daily, Sep 1, 2026), and this fall's decisions on anhydrous and on which fields go to corn are being made against them. The gap between the two corn sequences is $65 an acre. It is tempting to call that a fertilizer problem. Anhydrous averaged $945 a ton at retail in mid-September, 22% above a year earlier (DTN/Progressive Farmer, Sep 23, 2026), and corn after corn needs more nitrogen. The budget does not support that reading. Fertilizer makes up $10 of the $65. The rest is a 10-bushel yield drag and a little extra pesticide. So the decision on a second year of corn depends on the corn price and on how much yield a given field loses. The anhydrous price has little to do with it.
1. What the 2027 budget charges for a second year of corn
What's new: farmdoc's 2027 budgets carry four corn and soybean sequences for each Illinois region. On high-productivity central Illinois ground, corn after soybeans is budgeted at 245 bushels and corn after corn at 235. Soybeans after corn are budgeted at 77 bushels and soybeans after soybeans at 75 (farmdoc, Aug 2026). The budgets use a 2027 price of $5.00 corn and $12.00 soybeans. farmdoc derives those prices from "current harvest futures for the 2027 crop, adjusted for typical basis in Illinois" (farmdoc daily, Sep 1, 2026).
Evidence: The lines that differ between sequences are yield, fertilizer, pesticides and drying. Power, overhead and land costs are the same for both corn sequences and the same for both soybean sequences.
| Central Illinois, high productivity, 2027 | Corn after soybeans | Corn after corn | Soybeans after corn | Soybeans after soybeans |
|---|---|---|---|---|
| Yield, bu/acre | 245 | 235 | 77 | 75 |
| Gross revenue, $/acre | 1,242 | 1,192 | 941 | 917 |
| Fertilizers, $/acre | 263 | 273 | 77 | 77 |
| Pesticides, $/acre | 119 | 125 | 72 | 77 |
| Total direct costs, $/acre | 579 | 594 | 256 | 261 |
| Total non-land costs, $/acre | 885 | 900 | 534 | 539 |
| Operator and land return, $/acre | 357 | 292 | 407 | 378 |
| Cash rent, $/acre | 321 | 321 | 321 | 321 |
| Farmer return, $/acre | 36 | −29 | 86 | 57 |
| Break-even price incl. land, $/bu | 4.92 | 5.20 | 11.10 | 11.47 |
Source: G. Schnitkey and N. Paulson, "2027 Crop Budgets," Table 2, Central Illinois, High Productivity Farmland, farmdoc, University of Illinois, original release Aug 2026. Prices $5.00 corn, $12.00 soybeans, cash basis. Gross revenue includes $17 an acre of ARC/PLC.
The pattern repeats in every region. Corn after corn trails corn after soybeans by $65 in northern Illinois and by $66 in both low-productivity central Illinois and southern Illinois. In all four regions it is the only corn budget with a negative farmer return at $5.00, apart from southern Illinois, where both corn sequences lose money (farmdoc, Aug 2026). The break-even line makes the same point per bushel. A second year of corn needs $5.20 to cover land. First-year corn needs $4.92.
2. The $65 is mostly bushels, not nitrogen
What's new: The corn-after-corn penalty in the budget splits into four lines. We repriced the fertilizer line at September retail anhydrous.
Evidence: Holding the budget's own numbers, the $65 gap in operator and land return breaks down as follows.
| Component of the $65 penalty | $/acre | |
|---|---|---|
| Yield: 10 fewer bushels at $5.00 | 50 | ██████████ |
| Fertilizer: $273 vs. $263 | 10 | ██ |
| Pesticides: $125 vs. $119 | 6 | █ |
| Drying: $13 vs. $14 (fewer bushels to dry) | −1 | |
| Total | 65 |
Source: Crop Root Zone calculation from farmdoc 2027 Crop Budgets, Table 2 (Aug 2026). Bars scaled to the yield line.
The budget's $10 fertilizer difference matches the university's nitrogen guidance. Illinois' maximum return to nitrogen (MRTN) rate for central Illinois was 172 lb N an acre for corn after soybeans and 186 lb for corn after corn at spring 2026 prices, which were $0.61 a pound of N for anhydrous and $4.50 corn (farmdoc daily, Mar 31, 2026). The gap is 14 pounds. DTN's Sep 14–18 retail survey put anhydrous at $945 a ton, or $0.58 a pound of N. A year earlier it was $777 (DTN/Progressive Farmer, Sep 23, 2026). The 14 extra pounds cost about $8.07 an acre at today's price and about $6.63 at last year's. That is a difference of $1.44.
$1.44 an acre
What a 22% rise in retail anhydrous over the past year added to the extra nitrogen for corn after corn. The same rise added about $19 an acre to the full 186-lb corn-after-corn N rate. (Crop Root Zone calculation from DTN/Progressive Farmer, Sep 23, 2026, and farmdoc daily, Mar 31, 2026)
Two caveats apply. First, the MRTN rates above were calculated at the spring 2026 price ratio. The current ratio of $0.58 N to $5.00 corn is a little lower, which would nudge both MRTN rates up slightly without much change to the gap between them. Second, farmdoc's fertilizer line also includes phosphorus and potassium, and the budget does not state the nitrogen price it assumed. So the $10 in the budget and our $8 are two estimates of the same thing, not the same calculation.
Ground Truth: High anhydrous prices make every corn acre more expensive relative to a soybean acre. At 186 lb, the past year's price rise added about $19 an acre to the nitrogen bill, or about 8 cents a bushel on 235 bushels. It does almost nothing to the choice between the two corn sequences. That choice turns on 14 pounds of N, and even a large move in the anhydrous price changes 14 pounds by only a dollar or two. A grower cutting a second year of corn because anhydrous went up is responding to the wrong number. The cost that matters is the 10 bushels the field is expected to lose.
3. The one-year decision: $115, and the prices that close it
What's new: For a field that grew corn in 2026, the choice for 2027 is between corn after corn and soybeans after corn. In farmdoc's budget that is a $29 loss against an $86 profit, a gap of $115 an acre (farmdoc, Aug 2026).
Evidence: The $115 has two parts. $65 of it is the rotation penalty from Section 2. The other $50 is the gap between soybeans after corn ($86) and corn after soybeans ($36). That $50 gap exists even in a clean rotation, because the budget has soybeans ahead of corn at these prices. farmdoc notes that projected soybean returns exceeding corn's continues a trend of the past 15 years (farmdoc daily, Sep 1, 2026). This matters for how the $115 is read. Over two years, a field with the same crop mix — one corn crop and one soybean crop — gives up only $65 by growing corn first. Soybeans then corn earns $86 + $36 = $122. Corn then soybeans earns −$29 + $86 = $57. The difference is $65. The full $115 is lost only when the second year of corn adds a corn acre that would otherwise have been a soybean acre.
We held every other budget line constant and solved for the price that makes corn after corn equal to soybeans after corn:
| Price needed for corn after corn to match soybeans after corn | Cash price | Change from budget |
|---|---|---|
| Corn, with soybeans held at $12.00 | $5.49 | +$0.49 |
| Soybeans, with corn held at $5.00 | $10.51 | −$1.49 |
| Implied soybean/corn price ratio at the corn threshold | 2.19 | budget: 2.40 |
Source: Crop Root Zone calculation from farmdoc 2027 Crop Budgets, Table 2 (Aug 2026). Corn at 235 bu/acre and soybeans at 77 bu/acre; crop insurance premiums and all other lines held at budget values.
On the futures board, December 2027 corn settled at $5.2725 on September 24 and $5.285 on September 23. Both settlements were relayed from USDA AMS's daily grain futures report (IndexBox/USDA AMS, Sep 24, 2026). The $5.49 threshold is a cash price. If basis stays where farmdoc assumed, the December 2027 contract would need to rise about 49 cents above the level that produced farmdoc's $5.00 cash assumption. We could not obtain a public-tier settlement for November 2027 soybeans. The AMS report lists soybean months only through September 2027. So we do not quote a current new-crop soybean/corn ratio here.
4. How big the penalty really is on a given field
What's new: The budget uses one number, 10 bushels (4.1%), for every second-year corn acre. Field data shows a penalty that is smaller in the first year of continuous corn, larger after that, and much larger on dry ground.
Evidence: Seifert, Roberts and Lobell studied 748,374 field observations across six Corn Belt states from 2007 to 2012. They found an average continuous-corn yield penalty of 4.3%. It was about 2% in the first year of corn after corn and about 5.5% once the sequence ran three or more years, where it levelled off. The penalty was 4.3% on rainfed fields against 1.7% under irrigation (Seifert et al., 2017, as summarized by Ortez and Elmore, UNL CropWatch, Apr 8, 2020). The Nebraska summary also reports penalties of 5% to 15% on dryland acres in western Nebraska and South Dakota (Ortez and Elmore, Apr 8, 2020).
Applied to the central Illinois budget, those penalties shift the break-even as follows:
| Yield penalty vs. corn after soybeans (245 bu) | Corn-after-corn yield | Farmer return at $5.00, $/acre | Corn price to match soybeans after corn | Soybean price to match at $5.00 corn |
|---|---|---|---|---|
| None (0 bu) | 245 | 21 | $5.27 | $11.16 |
| 2.0% (5 bu), first year of corn after corn | 240 | −4 | $5.38 | $10.83 |
| 4.1% (10 bu), farmdoc budget | 235 | −29 | $5.49 | $10.51 |
| 5.5% (13.5 bu), third year and later | 231.5 | −47 | $5.57 | $10.28 |
| 10% (24.5 bu), dryland-scale penalty | 220.5 | −102 | $5.85 | $9.56 |
Source: Crop Root Zone calculation from farmdoc 2027 Crop Budgets, Table 2 (Aug 2026); penalty rates from Seifert, Roberts and Lobell (2017) as summarized in UNL CropWatch (Apr 8, 2020). Fertilizer (+$10), pesticide (+$6) and drying (−$1) differences held at farmdoc values in every row; the 10% row applies a western-dryland penalty to Illinois ground for illustration only.
The top row has a finding of its own. With no yield drag at all, corn after corn still trails soybeans after corn by $65 at $5.00 corn. That is the $50 corn-versus-soybean gap plus $15 of extra fertilizer, pesticide and drying costs. Even a field that loses no yield needs about $5.27 cash corn to match beans.
Ground Truth: A field's own yield record by sequence decides this question better than the budget's standard 10 bushels. Where the 2027 corn would be the first year of corn after corn, the field average suggests closer to 5 bushels, and the break-even falls to about $5.38. That is 11 cents below the budget answer, a gap a modest move in the December 2027 contract could close. Where the field would be in its third straight year of corn, or on ground that loses yield in dry years, the break-even is $5.57 or higher, which needs corn more than half a dollar above the budget's price level. Our read is that a second year of corn in 2027 makes sense only on ground with a documented small penalty, with some of the crop priced ahead if December 2027 futures rally toward the break-even. It does not make sense as a hedge against high anhydrous prices, because the anhydrous price is not the part of the penalty that is large.
5. How many acres face the question
What's new: USDA's September Crop Production report put 2026 corn plantings at 96.777 million acres, down from 98.788 million in 2025. Soybeans were 86.865 million, up from 81.215 million (USDA NASS, Sep 11, 2026).
Evidence: Corn can follow soybeans only on ground that grew soybeans the year before. Comparing each year's corn acres with the previous year's soybean acres therefore gives a floor on how much corn did not follow soybeans. That corn followed corn, or wheat, hay or another crop. The survey does not track sequences directly, so this is a floor and not a count.
| 2026 corn planted vs. 2025 soybeans planted | 2026 corn, M acres | 2025 soybeans, M acres | Corn that could not have followed soybeans, M acres (floor) |
|---|---|---|---|
| Illinois | 11.10 | 10.30 | 0.80 |
| Iowa | 13.25 | 9.45 | 3.80 |
| United States | 96.78 | 81.22 | 15.56 |
Source: USDA NASS, Crop Production, Sep 11, 2026 (planted area, all purposes, 2025 and 2026). Floor values are Crop Root Zone calculations; actual corn-after-corn area is higher wherever any 2025 soybean ground went back to soybeans or to another crop.
Two back-to-back years of heavy corn planting leave a large base of 2026 corn ground heading into 2027 decisions. In Iowa, at least 3.8 million acres of 2026 corn went in on ground that was not in soybeans the year before. That is before any 2027 choice has been made. The standard central Illinois budget understates the cost of that pattern for any field already past its first year of corn, because the budget's single 10-bushel figure sits below the field average for third-year corn.
What to watch. Three numbers will settle most of these decisions before anhydrous goes on this fall. The first is December 2027 corn. The break-even rises from a budget cash level of $5.00 to between $5.38 and $5.57 depending on the field, so a rally of 40 to 60 cents with basis unchanged is the range to watch. The second is the new-crop soybean price. Each $1 decline in cash beans narrows the gap by $77 an acre. Each 10-cent rise in cash corn narrows it by $23.50. farmdoc will revise these budgets as prices move. The third is each field's own yield history by sequence, which is the one input a grower does not have to forecast.
References
- G. Schnitkey and N. Paulson, "2027 Crop Budgets" (Tables 1–4, Northern, Central High and Low Productivity, and Southern Illinois), farmdoc, University of Illinois, original release Aug 2026 — https://farmdoc.illinois.edu/assets/management/crop-budgets/crop_budgets_2026_Aug.pdf
- N. Paulson, G. Schnitkey, C. Zulauf and B. Zwilling, "Illinois Crop Budgets for 2027," farmdoc daily, University of Illinois, Sep 1, 2026 — https://farmdocdaily.illinois.edu/2026/09/illinois-crop-budgets-for-2027.html
- DTN/Progressive Farmer, R. Quinn, "Fertilizer Prices Rise for Six of Eight Major Fertilizers," Sep 23, 2026 (retail survey Sep 14–18, 2026) — https://www.dtnpf.com/agriculture/web/ag/crops/article/2026/09/23/fertilizer-prices-rise-six-eight
- N. Paulson, G. Schnitkey, C. Zulauf and L. Gentry, "High Fertilizer Prices Suggest Reconsidering Application Rates," farmdoc daily, University of Illinois, Mar 31, 2026 — https://farmdocdaily.illinois.edu/2026/03/high-fertilizer-prices-suggest-reconsidering-application-rates.html
- C. A. Seifert, M. J. Roberts and D. B. Lobell, "Continuous Corn and Soybean Yield Penalties across Hundreds of Thousands of Fields," Agronomy Journal 109:541–548, 2017 — https://doi.org/10.2134/agronj2016.03.0134
- O. Ortez and R. Elmore, "Yield Penalties for Continuous Corn and Soybean in the Midwest, US," University of Nebraska–Lincoln CropWatch, Apr 8, 2020 — https://cropwatch.unl.edu/2020/yield-penalties-continuous-corn-and-soybean-midwest-us
- USDA National Agricultural Statistics Service, Crop Production, Sep 11, 2026 — https://esmis.nal.usda.gov/sites/default/release-files/796056/crop0926.pdf
- USDA AMS Livestock, Poultry and Grain Market News, National Daily Sunflower, Canola, Millet and Flaxseed Report (CBOT futures settlements), Sep 23 and Sep 24, 2026, as relayed by IndexBox — https://www.indexbox.io/blog/usda-national-daily-sunflower-canola-millet-and-flaxseed-report-for-sept-24-2026/ and https://www.indexbox.io/blog/usda-daily-grain-futures-and-canola-bids-report-for-september-23-2026/
Disclosures
Crop Root Zone is an independent publication. Nothing here is investment advice. Market calls, where included, reflect the editors' own read and are not a recommendation to buy or sell any security.
Skipping Fall P&K Ahead of Corn Saves About $87 an Acre. On Ground Testing Optimum, Only About $14 of It Is Real Money.
At DTN's mid-September retail prices of $925 for DAP and $495 for potash, replacing one 210-bushel corn crop's phosphorus and potassium removal costs $87 to $99 an acre under Iowa State, Tri-State and Illinois removal rates. On High and Very High soils that is a true saving: Iowa State puts the odds of a yield response at 5% and under 1%, and in a 40-year Iowa trial, unfertilized plots on ground that needed no P or K at the start took 17 years to fall far enough for fertilizer to pay. On Optimum soils it is not a saving. The pounds have to go back, so skipping only earns interest plus a spreading pass, about $14 at flat prices. That is less than the upper-bound expected yield cost of $24. Skipping on Optimum ground pays only if DAP falls toward its 2024 level. On Low ground it loses under every price case.
Retail DAP averaged $925 a ton and potash $495 in the third week of September (DTN/Progressive Farmer, Sep 23, 2026). A grower who puts back what a 210-bushel corn crop removes would spend about $87 an acre on the two nutrients at those prices. That is roughly 16 bushels of December corn at $5.29 (Brownfield Ag News, Sep 23, 2026). Every agronomist fielding calls this fall gets the same question: can I skip it this year? University guidance gives the agronomic answer, and it depends on the soil test. This piece adds the economic answer, which also depends on the soil test but turns on a different point. On some ground, skipping means the money is never spent. On other ground the same pounds have to be bought later, so skipping is really a wager on next year's price. The line between those two cases falls between the Optimum and High categories. On ground testing Optimum, the saving from a skip shrinks from about $87 to about $14.
1. What one skipped application is worth at September prices
What's new: Phosphate prices are well above their level of two years ago, and potash is not. In the Sep 14–18 survey DAP was $925, MAP $967 and potash $495. All three moved less than 5% on the month for a second straight week (DTN/Progressive Farmer, Sep 23, 2026). Illinois dealer asks on Sep 18 were close to those figures: DAP $928.57, MAP $935.00 and white potash $500.42 (USDA AMS, Sep 18, 2026). The Illinois DAP average in early August was 24% above the same week of 2024. Potash was just 0.7% above its 2024 level (farmdoc daily, Aug 11, 2026).
Evidence: The nutrient cost per pound is what matters for a removal-based program:
| Product | $/ton | Nutrient, lb/ton | $/lb nutrient | Basis |
|---|---|---|---|---|
| DAP (18-46-0) | 925 | 920 P2O5 | 1.01 | Delivered retail, US avg, Sep 14–18 |
| DAP, crediting its N at anhydrous price | 925 | 920 P2O5 | 0.78 | As above, 360 lb N valued at $0.576/lb |
| MAP (11-52-0) | 967 | 1,040 P2O5 | 0.93 | Delivered retail, US avg, Sep 14–18 |
| Potash (0-0-60) | 495 | 1,200 K2O | 0.41 | Delivered retail, US avg, Sep 14–18 |
| DAP, Illinois | 928.57 | 920 P2O5 | 1.01 | Dealer ask, FOB, Sep 18 |
| Potash, white 0-0-62, Illinois | 500.42 | 1,240 K2O | 0.40 | Dealer ask, FOB, Sep 18 |
Source: DTN/Progressive Farmer, Sep 23, 2026 (retail survey Sep 14–18, 2026); USDA AMS Illinois Production Cost Report, Sep 18, 2026. Per-pound values are Crop Root Zone calculations. The N credit values DAP's nitrogen at DTN retail anhydrous of $945/ton ($0.576/lb N).
The next step is to multiply those per-pound costs by removal. Each of the three main Corn Belt recommendation systems publishes its own grain removal coefficients. The table below applies each one to the same yields, 210 bushels of corn and 70 of soybeans. Iowa State uses those two yields as its defaults when a field's actual yield is unknown (Iowa State University, PM 1688, Feb 2023).
| Removal basis | Corn lb P2O5 / K2O per bu | Corn-year cost, $/acre | Soy lb P2O5 / K2O per bu | Soy-year cost, $/acre | Corn year in bu of corn |
|---|---|---|---|---|---|
| Iowa State (PM 1688) | 0.32 / 0.22 | 86.62 | 0.72 / 1.20 | 85.32 | 16.4 |
| Tri-State (IN, MI, OH) | 0.35 / 0.20 | 91.22 | 0.80 / 1.15 | 89.51 | 17.2 |
| Illinois (2017 values) | 0.37 / 0.24 | 98.91 | 0.75 / 1.17 | 86.57 | 18.7 |
Source: Removal coefficients from Iowa State University Extension PM 1688, Feb 2023; Tri-State Fertilizer Recommendations, Bulletin 974, 2020; E. Nafziger, University of Illinois farmdoc, Sep 7, 2017. Prices from DTN/Progressive Farmer, Sep 23, 2026; December corn $5.29 (Brownfield Ag News, Sep 23, 2026). Yields of 210 bu corn and 70 bu soybeans. Costs are Crop Root Zone calculations at $1.01/lb P2O5 (DAP, no N credit) and $0.41/lb K2O.
Two details change the size of the number. The first is the application pass. Custom dry bulk spreading averaged $8.15 an acre in Iowa's 2026 survey, from 59 responses (Iowa State University Ag Decision Maker, Mar 2026). That is saved only if the skip removes a trip across the field entirely. The second is the nitrogen in DAP. If the grower counts that nitrogen toward the corn N rate, the phosphate costs $0.78 a pound instead of $1.01, and the Iowa State corn-year bill drops from $86.62 to $71.47. The coefficients matter too. Illinois' 0.37 lb P2O5 per bushel and Iowa's 0.32 are both set near the 75th percentile of measured grain concentrations. Illinois researchers pointed out this summer that this means the book value overstates actual removal for about three grain samples in four (farmdoc daily, Jul 27, 2026). The rest of this piece uses the Iowa State coefficients, the lowest of the three and so the most conservative about what a skip saves.
Ground Truth: Phosphate makes up 78% of the Iowa State corn-year bill: $67.57 of $86.62. Potash in that year costs $19.06. The soybean year looks different, with potash at $34.65 of $85.32. A grower who wants to cut ahead of corn and has only one nutrient to cut should cut phosphate. That is where the money is, and phosphate is the nutrient whose price is furthest above normal. Cutting potash ahead of corn saves about as much as the spreading pass.
2. What the soil test gives up
What's new: How far one skipped year moves the soil test depends on which way it is measured. Measured by removal arithmetic, the drop is several parts per million. Measured in field trials, it is smaller.
Evidence: Iowa State's guide puts the average cost of raising post-harvest soil-test P by 1 ppm at 16 to 18 lb P2O5 in a corn-soybean rotation (Bray P1 or colorimetric Mehlich-3). For K the figure is 8 to 10 lb K2O per ppm on dried samples. The same guide says actual amounts range from 10 to 35 lb P2O5 and 6 to 20 lb K2O, depending on conditions that are hard to identify (Iowa State University, PM 1688, Feb 2023). Run in reverse, one corn crop's 67 lb of P2O5 comes to 3.7 to 4.2 ppm of soil-test P. The field record shows smaller drops. Minnesota's soil fertility specialist reports that High-testing soils fall about 2 ppm a year without P (University of Minnesota Extension, Oct 3, 2022). An Iowa State trial ran for 40 years at the Northeast Research Farm, starting from 28 ppm P (Bray) and 213 ppm K. Soil-test P in its unfertilized plots fell to a plateau of about 6 ppm after 30 years, and soil-test K fell to about 100 ppm after 25 years. It took 17 years for those plots to fall into the range between Low and Optimum where fertilizer began to pay (Mallarino and Pecinovsky, Iowa State University, Sep 2024).
| Category (Iowa State, corn and soybeans) | Bray P1 / Mehlich-3 P, ppm | K, ammonium acetate or Mehlich-3, dried, ppm | Years before a mid-category field reaches Low: P | Years: K |
|---|---|---|---|---|
| Very high | 35+ | 271+ | 6–11* | 17–27* |
| High | 26–34 | 221–270 | 4–7* | 11–17* |
| Optimum | 18–25 | 171–220 | 1–2* | 4–6* |
| Low | 10–17 | 126–170 | Already below | Already below |
Source: Category boundaries from Iowa State University Extension PM 1688, Feb 2023. *Years are Crop Root Zone estimates, measured from the category midpoint (from 38 ppm P and 290 ppm K for Very High) to the top of the Low category. The fast end uses removal arithmetic: 3.5 ppm P and about 7 ppm K a year, averaged over a corn and a soybean crop at 210 and 70 bu. The slow end uses field-observed declines of 2 ppm P a year (University of Minnesota Extension, Oct 3, 2022) and about 4.5 ppm K a year (the Iowa State Northeast Research Farm average, 213 to 100 ppm over 25 years). These are illustrative, not predictions for any field.
The other systems draw their lines in similar places, although their methods are not identical. Tri-State sets its corn and soybean maintenance range at 20–40 ppm Mehlich-3 P, and 120–170 ppm Mehlich-3 K on loam and clay soils (100–130 ppm on sands with CEC below 5). Below that range it recommends building. Within it, the recommendation is roughly crop removal "sometime within the rotation." Above it, the recommendation is "do not fertilize" (Tri-State Fertilizer Recommendations, Bulletin 974, 2020). Illinois Extension says maintenance may be needed between 40 and 70 lb/acre of soil P, which is 20 to 35 ppm, and that fertilizer may not be needed above 60 to 70 lb/acre (University of Illinois Extension, accessed Sep 24, 2026). Minnesota treats 20 ppm Bray P1 as the point above which soils are unlikely to respond (University of Minnesota Extension, Oct 3, 2022).
The table makes the practical point. A field in the middle of the High category has four or more years of P before it reaches Low, even at the fast rate. A field in the middle of Optimum has one to two. The Iowa State guide also warns that lab results alone vary by about ±10%, and that the common dried-sample K test is unreliable on poorly drained fine-textured soils (PM 1688, Feb 2023). A 21 ppm Optimum reading can therefore be an 18 in the field.
Ground Truth: Removal arithmetic and the trial record disagree, and the gap is the soil's buffer. If one skipped year actually costs 1 to 2 ppm of P rather than 4, then rebuilding that drop at 16 to 18 lb per ppm takes 16 to 36 lb of P2O5, or $16 to $36 at today's DAP. Full replacement of the 67 lb removed would cost $67.57. The maintenance approach assumes the whole removal is owed back. The soil test suggests only part of it shows up on the next report. The Northeast Research Farm trial shows what happens to the rest: the buffer is drawn down quietly for years, and then the response arrives. Our break-even below assumes full replacement, which is the conservative case.
3. What the trials show about yield
What's new: The probability of a yield response is the key figure in every university system, and it falls steeply between the Optimum and High categories.
Evidence: Iowa State sets its categories so that the share of P and K applications producing a yield response is about 80% in Very Low, 55% in Low, 25% in Optimum, 5% in High and under 1% in Very High (PM 1688, Feb 2023). Iowa State's March guidance this year repeated the same bands, with Low at about 65%, and said High-testing fields can "safely wait" to resume removal rates until they fall back to Optimum (Iowa State University Extension, Mar 26, 2026). Response size falls with the category as well. On Very Low P soils, corn responses run 10 to 100 bu/acre and soybean responses 3 to 30. In Optimum, responses are "small, variable, and most frequently positive." In High and Very High they are "small and near zero" (Iowa State University Extension, Sep 15, 2023). Ohio has the largest public dataset, 457 P trials and 458 K trials from 1976 to 2021. Yield responded to P in 23.4% of trials and to K in 25.3%. Average gains in the trials that responded were 8.8% for P and 11.0% for K. Mehlich-3 levels above 20 ppm P and 130 ppm K showed a low probability of response (Culman et al., Soil Science Society of America Journal, Jul 26, 2023).
To turn those figures into dollars, we multiply each category's response probability by a response size and then by the value of the crop. For response size we use Ohio's 8.8% average for responsive P trials. That average comes mostly from lower-testing sites, so it overstates the size of a typical response in Optimum and High. The results below are therefore upper bounds.
| Iowa State category | Response probability | Expected yield cost of skipping, corn year, $/acre | |
|---|---|---|---|
| Very low | ~80% | 78.21 | ██████████ |
| Low | ~55% | 53.77 | ███████░░░ |
| Optimum | ~25% | 24.44 | ███░░░░░░░ |
| High | ~5% | 4.89 | █░░░░░░░░░ |
| Very high | <1% | <0.98 | ░░░░░░░░░░ |
Source: Response probabilities from Iowa State University Extension PM 1688, Feb 2023. Response size of 8.8% of yield from Culman et al., SSSAJ, Jul 26, 2023. Crop value is 210 bu at $5.29 December corn, or $1,110.90 an acre (Brownfield Ag News, Sep 23, 2026). The cost in each row is probability × 8.8% × $1,110.90, a Crop Root Zone calculation and an upper bound, because responses in Optimum and above run smaller than the Ohio all-category average. Soybean-year equivalents at 70 bu and $13.18 November soybeans are $20.30 (Optimum) and $4.06 (High). Bars scale the corn-year cost, with Very Low at ten blocks.
4. The break-even, category by category
What's new: Once the pounds skipped have to be bought back later, the saving from a skip is no longer the cost of the fertilizer. It becomes a price trade.
Evidence: On High and Very High ground, no replacement is owed while the soil test stays at or above Optimum. That is the Iowa State recommendation in any case: nothing for a single crop year in High, and half of removal if the application covers two crops before the next sample (PM 1688, Feb 2023). The saving is the whole $86.62, plus $8.15 if the pass is eliminated. That is 8.5% of the corn crop's gross value. Against a 5% response probability, a skip would lose money only if the average response exceeded the entire crop. On Optimum ground, Iowa State recommends removal every year or twice the annual amount every second year, so the 67 lb of P2O5 and 46 lb of K2O come back next fall. What the grower earns by waiting is a year's interest on $86.62. At an assumed 7% cost of money that is $6.06. If next year's double-rate application goes on in one trip, the grower also saves an $8.15 pass. The rest of the result depends on where DAP is next fall.
| Next-fall DAP, $/ton | Why this price | Skip gain before yield risk, corn year, $/acre | Break-even response size at 25% odds |
|---|---|---|---|
| 736 | Back to Aug 2024 Illinois level | 28.02 | 10.1% |
| 852 | Back to Aug 2025 Illinois level | 19.55 | 7.0% |
| 925 | Unchanged | 14.21 | 5.1% |
| 1,050 | Up 13.5%, illustrative | 5.08 | 1.8% |
Source: Current DAP from DTN/Progressive Farmer, Sep 23, 2026. The 2024 and 2025 levels are implied by farmdoc daily's statement that Illinois DAP on Aug 7, 2026 ($912.22) was 24% and 7% above the same week of 2024 and 2025 (farmdoc daily, Aug 11, 2026). The $1,050 case is an illustrative scenario, not a forecast. Potash is held at $495; farmdoc put it within 2.5% of both prior years. Gains are Crop Root Zone calculations: 7% carry on $86.62, plus the $8.15 pass (Iowa State University Ag Decision Maker, Mar 2026), plus 67.2 lb P2O5 × the change in $/lb. The break-even response is the average yield gain, if a response occurs, that would make the expected yield cost equal the skip gain, at Iowa State's 25% Optimum probability and $1,110.90 gross. Each $55 a ton move in potash shifts the gain by about $2.
$14/acre
What a grower keeps by skipping one corn-year P&K application on Optimum-testing ground if prices hold, compared with $87 on High-testing ground. The difference is the replacement owed on Optimum ground. (Crop Root Zone calculation from Iowa State University PM 1688, Feb 2023; DTN/Progressive Farmer, Sep 23, 2026; Iowa State University Ag Decision Maker, Mar 2026)
Putting the pieces together gives a framework by category:
| Category | What the skip is | Saving, corn year, $/acre | Expected yield cost, upper bound, $/acre | Verdict at flat prices |
|---|---|---|---|---|
| Very high | Recommended practice; no replacement owed | 86.62–94.77 | <0.98 | Skip |
| High | Recommended for one crop year; no replacement while above Optimum | 86.62–94.77 | 4.89 | Skip |
| Optimum, upper half | Deferral; replacement owed next year | 6.06–14.21 | Less than 24.44 | Close; a price bet |
| Optimum, lower half | Deferral, with a likely fall into Low | 6.06–14.21 | 24.44, plus the Low-rate penalty | Do not skip |
| Low / Very low | Deferral against 55–80% response odds | 6.06–14.21 | 53.77–78.21 | Do not skip |
Source: Crop Root Zone framework and calculations from the tables above. The range in the saving column runs without and with the $8.15 saved pass. "Upper half" and "lower half" of Optimum are this publication's distinction, not a university category.
The Low-rate penalty is what makes the bottom half of Optimum a separate case. If a skip pushes a field from Optimum into Low, Iowa State's corn recommendation goes from 67 to 85 lb P2O5 and from 46 to 110 lb K2O (PM 1688, Feb 2023). At today's prices the extra 18 lb of P2O5 and 64 lb of K2O add $44.50 an acre to the next corn-year bill. That is three times the flat-price gain from skipping. A field at 18 or 19 ppm P, or around 175 ppm K on a dried test, is one crop away from paying it.
Ground Truth: On Optimum ground, skipping is a fertilizer-price position, not a cost cut. At flat prices it earns about $14 an acre against an expected yield cost of up to $24, so it pays only if Optimum responses really are smaller than Ohio's average. If DAP retraces to its 2024 level by next fall the skip earns about $28, and the risk is worth taking on the upper half of Optimum. A grower who expects phosphate to stay where it is, or to rise, should apply on Optimum ground and skip only on High. That is the reverse of what most growers do when prices are high: they cut across the whole farm evenly.
5. How to make the call this fall
Sample before skipping, not after. Every number above depends on the category, and the category depends on a sample. Iowa State suggests a new soil test every two years for most systems, and allows three to four years when fields sit near Optimum under maintenance (PM 1688, Feb 2023). Its March guidance recommended two-year sampling this year because removal does not track soil-test values closely in the short run (Iowa State University Extension, Mar 26, 2026). Tri-State recommends sampling every 3 to 4 years in units of no more than 25 acres (Bulletin 974, 2020). A skip on a field sampled in 2022 rests on an out-of-date reading.
Skip by zone, not by field. A field average can hide a mix of High and Low ground. On a whole-field skip, the High acres gain $87 and the Low acres give up an expected $54 of yield and move closer to the $44.50 Low-rate penalty. The framework applies to each management zone. It does not apply to a field average.
Cut phosphate before potash in the corn year, and the reverse in the soybean year. Phosphate is 78% of the corn-year bill. Potash is 41% of the soybean-year bill. Potash is also the nutrient priced close to its old level against corn, which TRZ-0199 set out on Sep 16. The dollar savings follow the phosphate.
Watch DAP through the winter. The break-even table turns on one number: next fall's DAP price. Retail DAP has moved less than 5% in each of the past two survey weeks and remains 24% above its 2024 level (DTN/Progressive Farmer, Sep 23, 2026; farmdoc daily, Aug 11, 2026). A decline toward $850 would make an Optimum-ground skip look sensible after the fact. A rise past $1,000 would mean a grower on Optimum ground skipped at the cheaper price and has to rebuy at the dearer one.
References
- DTN/Progressive Farmer, Russ Quinn, "Fertilizer Prices Rise for Six of Eight Major Fertilizers," Sep 23, 2026 (retail survey Sep 14–18, 2026) — https://www.dtnpf.com/agriculture/web/ag/crops/article/2026/09/23/fertilizer-prices-rise-six-eight
- DTN/Progressive Farmer, Russ Quinn, "Fertilizer Prices Continue Lower for 6 of 8 Major Nutrients," Sep 16, 2026 (retail survey Sep 7–11, 2026) — https://www.dtnpf.com/agriculture/web/ag/crops/article/2026/09/16/fertilizer-prices-continue-lower-6-8
- USDA AMS, Livestock, Poultry and Grain Market News, Illinois Production Cost Report (Bi-weekly), Sep 18, 2026 — https://www.ams.usda.gov/mnreports/ams_3195.pdf
- N. Paulson, G. Schnitkey, R. Batts, B. Zwilling and C. Zulauf, "Fertilizer and Fuel Prices Higher Heading into Fall 2026," farmdoc daily, University of Illinois, Aug 11, 2026 — https://farmdocdaily.illinois.edu/2026/08/fertilizer-and-fuel-prices-higher-heading-into-fall-2026.html
- Iowa State University Extension and Outreach, PM 1688, "A General Guide for Crop Nutrient and Limestone Recommendations in Iowa," revised Feb 2023 — https://store.extension.iastate.edu/product/A-General-Guide-for-Crop-Nutrient-and-Limestone-Recommendations-in-Iowa
- A. Mallarino, "Newly Updated Phosphorus and Potassium Guidelines," Iowa State University Integrated Crop Management, Feb 28, 2023 — https://crops.extension.iastate.edu/cropnews/2023/02/newly-updated-phosphorus-and-potassium-guidelines
- A. Mallarino, "Fall Phosphorus and Potassium Fertilization Decisions with Variable Prices and Updated Soil-Test Interpretations," Iowa State University Integrated Crop Management, Sep 15, 2023 — https://crops.extension.iastate.edu/cropnews/2023/09/fall-phosphorus-and-potassium-fertilization-decisions-variable-prices-and-updated
- A. Mallarino, "Phosphorus and Potassium Management with High and Uncertain Prices This Spring," Iowa State University Integrated Crop Management, Mar 26, 2026 — https://crops.extension.iastate.edu/cropnews/2026/03/phosphorus-and-potassium-management-high-and-uncertain-prices-spring
- A. P. Mallarino and K. Pecinovsky, "Phosphorus and Potassium Fertilization for Corn and Soybean During 40 Years in Northeast Iowa — Final Study Report," Iowa State University, Sep 2024 — https://www.agronext.iastate.edu/soilfertility/info/NERF%20LTPK%20trial%20Final%20Report%202024.pdf
- S. Culman, A. Fulford, G. LaBarge, H. Watters, L. Lindsey, A. Dorrance and L. Deiss, "Probability of crop response to phosphorus and potassium fertilizer: Lessons from 45 years of Ohio trials," Soil Science Society of America Journal 87(5):1207–1220, Jul 26, 2023 — https://doi.org/10.1002/saj2.20564
- Tri-State Fertilizer Recommendations for Corn, Soybean, Wheat, and Alfalfa, Bulletin 974, The Ohio State University, Michigan State University and Purdue University, 2020 (executive summary pages) — https://extensionpubs.osu.edu/content/sample/e974.pdf
- E. Nafziger, "New Grain Phosphorus and Potassium Numbers," University of Illinois farmdoc, Sep 7, 2017 — https://farmdoc.illinois.edu/field-crop-production/uncategorized/new-grain-phosphorus-and-potassium-numbers.html
- L. Bergschneider, Y. Freiberg and A. Margenot, "Rethinking Phosphorus and Potassium, Part 2: Grain Removal Values," farmdoc daily, University of Illinois, Jul 27, 2026 — https://farmdocdaily.illinois.edu/2026/07/rethinking-phosphorus-and-potassium-part-2-grain-removal-values.html
- University of Illinois Extension, "Soil Phosphorus," accessed Sep 24, 2026 — https://extension.illinois.edu/crops/soil-phosphorus
- D. Kaiser, "No P, no problem? Skipping phosphorus fertilizer application may make agronomic, economic sense," University of Minnesota Extension Crop News, Oct 3, 2022 — https://blog-crop-news.extension.umn.edu/2022/10/no-p-no-problem-skipping-phosphorus.html
- Iowa State University Extension and Outreach, Ag Decision Maker A3-10, "2026 Iowa Farm Custom Rate Survey," Mar 2026 — https://www.extension.iastate.edu/agdm/crops/pdf/a3-10.pdf
- Brownfield Ag News, "Closing Grain and Livestock Futures: September 23, 2026," Sep 23, 2026 (December corn $5.29, November soybeans $13.18) — https://www.brownfieldagnews.com/market-news/closing-grain-and-livestock-futures-september-23-2026/
Disclosures
Crop Root Zone is an independent publication. Nothing here is investment advice. Market calls, where included, reflect the editors' own read and are not a recommendation to buy or sell any security.
USDA's 1.922 Billion Bushels of Old-Crop Corn Needs the Summer Quarter to Have Run 9.1% Ahead of Last Year. The Spring Quarter Ran 6.6%.
The September 30 Grain Stocks report replaces USDA's estimate of old-crop corn with a count. Over the last five years the count has differed from the September WASDE by an average of 109 million bushels. In every year the gap was mostly feed and residual use, a figure USDA does not measure directly. This year USDA's figure requires June-August use to have grown faster than it did in March-May. At the spring pace, September 1 stocks would be about 1.999 billion bushels, and the 2026/27 stocks-to-use ratio would rise from 9.7% to 10.2%. Soybean misses are smaller in bushels but larger against the carryout, and they come mostly from revisions to the prior year's crop.
At noon Eastern on September 30, USDA's National Agricultural Statistics Service (NASS) will publish its survey count of the corn and soybeans that were still in storage on September 1 (USDA ESMIS, Grain Stocks schedule). That count replaces the old-crop estimate in the September WASDE, which puts corn at 1.922 billion bushels and soybeans at 325 million (USDA WASDE-675, Sep 11, 2026). Whatever the count shows, the 2026/27 balance sheet starts from it. The report comes out the day before October, the month in which December corn futures set the crop-insurance harvest price. December corn settled at $5.36¾ on September 22 and November soybeans at $13.25½ (Brownfield Ag News, Sep 22, 2026).
In most years the September stocks report is covered as a feature of the trading calendar. For a balance sheet this tight it matters more than that. USDA projects 2026/27 corn ending stocks at 1.567 billion bushels, or 9.7% of use. Over the last five years the September count has moved the old-crop number by an average of 109 million bushels, which is about 0.7 points of stocks-to-use. This piece looks at where those misses came from, what USDA's current figure assumes about the summer, and what that means for someone pricing grain into harvest.
1. The count has missed USDA's September figure by 109 million bushels on average
What's new: From 2021 to 2025, NASS's September 1 corn stocks differed from the old-crop ending stocks in that September's WASDE by between 49.5 and 206.6 million bushels. Three of the five counts came in below USDA's estimate and two above (USDA WASDE, Sep 2021-Sep 2025; USDA NASS Grain Stocks, Sep 2021-Sep 2025).
Evidence: The table compares each September's WASDE estimate with the NASS count published two to three weeks later, as first released.
| Sept. 1 of | Sept. WASDE old-crop corn (mil bu) | NASS count (mil bu) | Miss (mil bu) | Miss as % | Sept. WASDE old-crop soybeans (mil bu) | NASS count (mil bu) | Miss (mil bu) |
|---|---|---|---|---|---|---|---|
| 2021 | 1,187 | 1,236.5 | +49.5 | +4.2% | 175 | 256.2 | +81.2 |
| 2022 | 1,525 | 1,376.9 | −148.1 | −9.7% | 240 | 273.8 | +33.8 |
| 2023 | 1,452 | 1,361.3 | −90.7 | −6.2% | 250 | 268.2 | +18.2 |
| 2024 | 1,812 | 1,760.5 | −51.5 | −2.8% | 340 | 342.0 | +2.0 |
| 2025 | 1,325 | 1,531.6 | +206.6 | +15.6% | 330 | 316.5 | −13.5 |
| 2026 | 1,922 | Sep 30 | 325 | Sep 30 | |||
| Average absolute miss, 2021-25 | 109.3 | 7.7% | 29.7 |
Source: USDA WASDE-616, -628, -640, -652, -664 (September 2021-2025) and WASDE-675 (Sep 11, 2026); USDA NASS Grain Stocks, Sep 30, 2021; Sep 30, 2022; Sep 29, 2023; Sep 30, 2024; Sep 30, 2025. NASS counts are as first released; NASS later revised the 2025 corn count to 1,551.3 and the soybean count to 324.8 (Grain Stocks, Jun 30, 2026). Misses and averages are Crop Root Zone calculations.
| Corn: size of the September miss | Mil bu | |
|---|---|---|
| 2021 (above WASDE) | 49.5 | ██░░░░░░░░ |
| 2022 (below) | 148.1 | ███████░░░ |
| 2023 (below) | 90.7 | ████░░░░░░ |
| 2024 (below) | 51.5 | ██░░░░░░░░ |
| 2025 (above) | 206.6 | ██████████ |
Source: Crop Root Zone calculation from the table above.
The market reacts to these misses. Last year's count was 207 million bushels above USDA's September figure. That afternoon December corn fell 6 cents to $4.15½, and November soybeans fell 8¾ cents to $10.01¾ (Pro Farmer, Sep 30, 2025).
Measured against the new-crop balance sheet, a typical miss is large. Carried through to 2026/27 with nothing else changed, a 109-million-bushel error moves projected corn ending stocks from 1.567 billion to between 1.458 and 1.676 billion bushels. That is a stocks-to-use range of 9.0% to 10.4% on USDA's 16.18 billion bushels of total use (USDA WASDE-675, Sep 11, 2026; Crop Root Zone calculation).
2. The corn misses are feed and residual. The soybean misses are last year's crop.
What's new: The September Grain Stocks report does two things. It counts stocks, and it revises the previous year's corn and soybean production using end-of-year stocks, export and crush data, and farm program acreage (USDA NASS Grain Stocks, Sep 30, 2025). Splitting each miss into those two parts shows that the corn and soybean errors come from different places.
Evidence: Any part of a stocks miss that the production revision does not explain has to be use that USDA overestimated or underestimated. Exports and crush are reported directly. For corn, that leaves mainly feed and residual. For soybeans, it leaves the residual line.
| Sept. 1 of | Corn miss | Prior-year corn production revision | Corn miss not explained by production | Soybean miss | Prior-year soybean production revision | Soybean miss not explained by production |
|---|---|---|---|---|---|---|
| 2021 | +49.5 | −71.0 | +120.5 | +81.2 | +80.8 | +0.4 |
| 2022 | −148.1 | −41.4 | −106.7 | +33.8 | +30.2 | +3.6 |
| 2023 | −90.7 | −15.0 | −75.7 | +18.2 | −5.9 | +24.1 |
| 2024 | −51.5 | −1.1 | −50.5 | +2.0 | −2.6 | +4.6 |
| 2025 | +206.6 | +25.0 | +181.6 | −13.5 | +7.7 | −21.2 |
Million bushels. Source: USDA NASS Grain Stocks, Sep 2021-Sep 2025 (production revisions as stated in each report's highlights); miss from the Section 1 table. The unexplained column is a Crop Root Zone approximation that ignores small changes to imports and to other use lines; a positive figure means USDA had overestimated use.
In all five years, most of the corn miss was use that USDA had estimated wrongly, not a change to the crop. In 2021 the stocks count was higher than expected even though NASS cut the 2020 crop by 71 million bushels. That means use was about 120 million bushels lower than USDA had estimated. Soybeans were the reverse. The 81-million-bushel soybean miss in 2021 was almost all the upward revision to the 2020 crop, and the 2022 miss was mostly the same kind of revision.
This year both risks are larger than usual. USDA puts 2025/26 corn feed and residual at 6.350 billion bushels. That is a record, and it is 16.8% above the 5.438 billion used in 2024/25 (USDA WASDE-675, Sep 11, 2026). Feed and residual is the one large corn use that nobody measures. USDA estimates it as whatever is left after the other uses and the stocks count. Ahead of the September WASDE, DTN's lead analyst called the category "incredibly large" and said USDA might wait for the September 30 survey before making a large change to demand (DTN/Progressive Farmer, Sep 9, 2026). USDA left the old-crop figure alone in September. On the soybean side, the crop being revised is the 2025 crop, with a record yield of 53.0 bushels an acre and production of 4.262 billion bushels (USDA WASDE-675, Sep 11, 2026).
Ground Truth: The September 30 corn count will not tell us anything new about exports. Weekly inspections had already reached 83.8 million tonnes for the marketing year by August 27, against 67.0 million a year earlier (Brownfield Ag News, Aug 31, 2026). What the count will settle is feed and residual, a figure USDA derives rather than measures, at the record level USDA has put it. In each of the last five years, that line produced most of the corn miss. A record crop feeding a record estimate of an unmeasured use makes it the line to watch this year too.
3. What USDA's 1.922 billion requires of the summer quarter
What's new: NASS counted 5.295 billion bushels of corn in all positions on June 1, 2026, up 14% from a year earlier. On-farm stocks were 2.959 billion, up 16% (USDA NASS Grain Stocks, Jun 30, 2026). USDA's September 1 estimate of 1.922 billion therefore implies that about 3.373 billion bushels left storage between June and August.
Evidence: Quarterly stocks counts give the disappearance for every quarter of the marketing year. The 2025/26 quarters that NASS has already counted grew more slowly as the year went on. USDA's figure requires that slowdown to reverse in the final quarter.
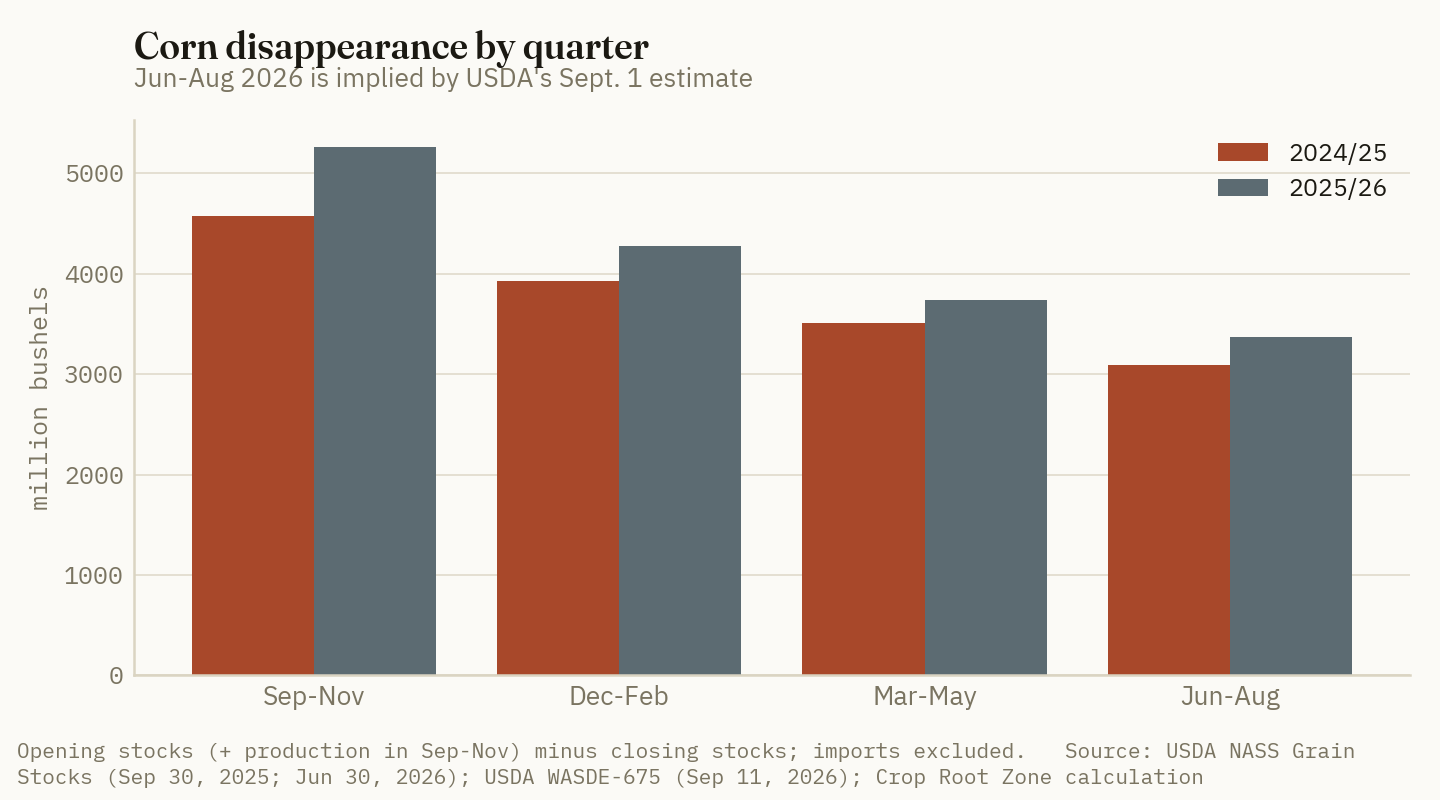
| Quarter | 2024/25 disappearance (mil bu) | 2025/26 disappearance (mil bu) | Change |
|---|---|---|---|
| Sep-Nov | 4,580 | 5,267 | +15.0% |
| Dec-Feb | 3,928 | 4,276 | +8.9% |
| Mar-May | 3,505 | 3,735 | +6.6% |
| Jun-Aug | 3,092 | 3,373* | +9.1%* |
Source: USDA NASS Grain Stocks, Sep 30, 2025 and Jun 30, 2026 (latest revised quarterly stocks); USDA WASDE-675, Sep 11, 2026 (2024/25 and 2025/26 production). Disappearance = opening stocks, plus production in Sep-Nov, minus closing stocks. Imports (25-30 million bushels a year) are excluded, which understates each quarter by roughly the same amount in both years. *Implied by USDA's 1.922-billion-bushel September 1 estimate; not yet measured. Crop Root Zone calculation.
+9.1%
Year-on-year growth in June-August corn disappearance that USDA's 1.922-billion-bushel September 1 estimate requires. NASS measured 6.6% for March-May. (USDA NASS Grain Stocks, Jun 30, 2026; USDA WASDE-675, Sep 11, 2026; Crop Root Zone calculation)
A 9.1% summer is possible. Export inspections were still running above a year earlier in late August (Brownfield Ag News, Aug 31, 2026). But it is not the obvious path, because it would reverse two straight quarters of slowing growth. The table carries each measured quarterly growth rate through to September 1 and then to the 2026/27 balance sheet, leaving everything else in the WASDE unchanged.
| If June-August use grew at... | YoY | June-Aug use (mil bu) | Sept. 1 stocks (mil bu) | vs. USDA (mil bu) | 2026/27 ending stocks (mil bu) | Stocks-to-use |
|---|---|---|---|---|---|---|
| the March-May pace | +6.6% | 3,296 | 1,999* | +77 | 1,644* | 10.2%* |
| the December-February pace | +8.9% | 3,367 | 1,928* | +6 | 1,573* | 9.7%* |
| USDA's implied pace | +9.1% | 3,373 | 1,922 | 0 | 1,567 | 9.7% |
| the September-November pace | +15.0% | 3,555 | 1,740* | −182 | 1,384* | 8.6%* |
Source: USDA NASS Grain Stocks, Jun 30, 2026; USDA WASDE-675, Sep 11, 2026 (2026/27 ending stocks 1,567 and total use 16,180 million bushels). *Crop Root Zone scenario, not a forecast: each row changes only 2025/26 ending stocks and carries the difference one-for-one into 2026/27. A production revision to the 2025 crop would change these figures.
For a sense of scale, USDA's own August-to-September revision cut 2026/27 ending stocks by 86 million bushels and raised its season-average corn price by $0.30, to $4.80 (USDA WASDE-675, Sep 11, 2026). That month's change also included a smaller crop, so it is not a price elasticity. It does show that USDA priced a change the size of the March-May scenario at around 30 cents.
4. Soybeans: a smaller miss against a much smaller carryout
What's new: NASS counted 1.061 billion bushels of soybeans on June 1, up 5%. March-May disappearance was up 18% (USDA NASS Grain Stocks, Jun 30, 2026). USDA's 325-million-bushel September 1 estimate implies June-August disappearance of about 736 million bushels. That is 7.8% above the 683 million implied for the same quarter a year earlier using NASS's revised counts (Crop Root Zone calculation).
Evidence: Soybean use has not slowed. The quarter before the summer ran more than twice as fast as the growth USDA now needs, so the soybean use assumption looks less stretched than the corn one. The risk is in the crop number. The average absolute soybean miss over five years was 29.7 million bushels. Against a 2026/27 carryout of 310 million bushels, that is 9.6%. The corn miss is 7.0% of its carryout. At 6.8% stocks-to-use, the soybean balance sheet has less room than corn's, and the misses have mostly been upward revisions to the previous crop: +80.8 million in 2021 and +30.2 million in 2022 (USDA WASDE-675, Sep 11, 2026; USDA NASS Grain Stocks, Sep 2021 and Sep 2022).
| Soybeans | Bushels (mil) | % of 2026/27 carryout | |
|---|---|---|---|
| 2026/27 projected ending stocks | 310 | 100% | ██████████ |
| Largest miss, 2021-25 (2021) | 81.2 | 26% | ███░░░░░░░ |
| Average absolute miss, 2021-25 | 29.7 | 10% | █░░░░░░░░░ |
| 2025 miss | 13.5 | 4% | ░░░░░░░░░░ |
Source: USDA WASDE-675, Sep 11, 2026; Section 1 table. Percentages are Crop Root Zone calculations.
5. What this means for grain coming out of the field
What's new: As of September 20, 13% of the 18-state corn crop and 12% of soybeans had been harvested. A year earlier the figures were 10% and 8%, and the five-year averages are 11% and 8%. The crops were rated 57% and 58% good to excellent (USDA NASS Crop Progress, Sep 21, 2026).
Evidence: The report will be read in three places.
- The pricing window. The report comes out the last trading day before October, the month whose December-futures average sets the harvest price for revenue protection. A large corn miss moves the start of that average. Growers pricing harvest-delivered bushels before September 30 are taking a position on the count, whether or not they mean to.
- Bin space. June 1 on-farm corn stocks were up 16% from a year earlier (USDA NASS Grain Stocks, Jun 30, 2026). Last year's September 1 on-farm corn was 643 million bushels (USDA NASS Grain Stocks, Sep 30, 2025). If the September on-farm figure is well above that, more old crop is sitting in bins that the 2026 harvest needs, and that tends to show up in harvest basis before it shows up in futures.
- The 2025 crop revision. Over the last five years, NASS has revised the prior year's corn crop by anywhere from −71.0 to +25.0 million bushels (USDA NASS Grain Stocks, Sep 2021-Sep 2025). A downward revision to the 2025 crop combined with a stocks count at or above 1.922 billion would mean feed and residual use was even smaller than USDA thought. That would be the most bearish pairing for demand.
Ground Truth: Before September 30, don't treat USDA's 1.567-billion-bushel corn carryout as the midpoint. Our read is that it is the tighter end of a range whose likelier center is closer to 1.60 to 1.65 billion. On the arithmetic here, a count above 1.922 billion needs only that summer use grew at the same rate as spring use. A count below it needs summer use to have grown faster than in any quarter since the fall. None of this is a price forecast. It means a grower deciding whether to set harvest-delivery prices before or after the report is not choosing between two equally likely outcomes. For soybeans, the more useful thing to watch on the day is the revision to the 2025 crop, not the stocks figure.
References
- USDA ESMIS, Grain Stocks publication page and release schedule (release Sep 30, 2026, 12:00 p.m. ET), accessed Sep 23, 2026. https://esmis.nal.usda.gov/publication/grain-stocks
- USDA World Agricultural Outlook Board, World Agricultural Supply and Demand Estimates, WASDE-675, Sep 11, 2026. https://www.usda.gov/oce/commodity/wasde/wasde0926.pdf
- Brownfield Ag News, "Closing Grain and Livestock Futures: September 22, 2026," Sep 22, 2026. https://www.brownfieldagnews.com/market-news/closing-grain-and-livestock-futures-september-22-2026/
- USDA WAOB, WASDE-616, -628, -640, -652 and -664 (September 2021, 2022, 2023, 2024, 2025), U.S. Feed Grain and Corn and U.S. Soybeans and Products tables, via USDA ESMIS. https://esmis.nal.usda.gov/publication/world-agricultural-supply-and-demand-estimates
- USDA NASS, Grain Stocks, Sep 30, 2021; Sep 30, 2022; Sep 29, 2023; Sep 30, 2024, via USDA ESMIS. https://esmis.nal.usda.gov/publication/grain-stocks
- USDA NASS, Grain Stocks, Sep 30, 2025. https://esmis.nal.usda.gov/sites/default/release-files/xg94hp534/4q77hr39m/1257ct53j/grst0925.pdf
- USDA NASS, Grain Stocks, Jun 30, 2026. https://esmis.nal.usda.gov/sites/default/release-files/795959/grst0626.txt
- Pro Farmer, "After the Bell: September stocks report weighs on grain markets," Sep 30, 2025. https://www.profarmer.com/news/after-bell/after-bell-september-stocks-report-weighs-grain-markets
- DTN/Progressive Farmer, Rhett Montgomery, "After Historic Late-August Price Rallies, USDA Returns With New Forecasts," Sep 9, 2026. https://www.dtnpf.com/agriculture/web/ag/news/article/2026/09/09/historic-late-august-price-rallies
- Brownfield Ag News, "Corn export inspections continue to stand out," Aug 31, 2026. https://www.brownfieldagnews.com/news/corn-export-inspections-continue-to-stand-out/
- USDA NASS, Crop Progress, Sep 21, 2026. https://www.nass.usda.gov/Publications/Todays_Reports/reports/prog3826.pdf
Disclosures
Crop Root Zone is an independent publication. Nothing here is investment advice. Market calls, where included, reflect the editors' own read and are not a recommendation to buy or sell any security.
North Dakota Canola Is Bid 31% Over Last Year. Its Fertilizer Program Costs 6% More, and the Bill Fell From 6.0 Hundredweight an Acre to 4.8.
Processors in eastern North Dakota bid $25.22/cwt for canola on September 21, against $19.27 a year ago, while a standard NDSU-style nitrogen, phosphate and sulfur program priced at September retail rose only from about $115 to $121 an acre. Gross revenue on a 2,000-lb crop rose about $119 an acre; fertilizer rose about $6. The price behind that gain comes mostly from China's lower duty and from crushers bidding for oil. It does not reflect a short crop: Canada harvests a record 23.2 million acres and North Dakota planted a record 2.35 million, Saskatchewan's harvest is running 39 points behind average, and ICE futures trade 16% above Ottawa's own price forecast for the crop year.
On September 21, canola processors at Enderlin, North Dakota, bid $25.22 per hundredweight for current delivery. A year earlier the same bid was $19.27, so the price is up 30.9% (USDA AMS National Daily Sunflower, Canola, Millet and Flaxseed Report, Sep 21, 2026). November canola on ICE settled at C$835.20 a tonne, 36.8% above the C$610.40 it settled at on September 22, 2025 (GX94 Radio closing prices, Sep 21, 2026 and Sep 22, 2025). Over the same year, the urea, MAP and ammonium sulfate that make up a canola fertilizer program rose between 4% and 9%. Priced in canola, that program now costs about 4.8 hundredweight an acre, down from 6.0 a year ago. Canola needs more sulfur than most crops, and the rally has cut its fertilizer bill, measured in crop, by a fifth. This piece works through that arithmetic, where the price comes from, and why the ratio is a better reason to price bushels and lock in inputs than to plant more canola in 2027.
1. The price: a duty cut and a crush bid, not a short crop
What's new: Cash bids at all four North Dakota and Minnesota processor points in the USDA report are between 30% and 38% above a year ago. November ICE canola has risen C$224.80 a tonne in twelve months, or about C$5.10 a bushel: C$18.94 against C$13.84 (USDA AMS, Sep 21, 2026; GX94 Radio, Sep 21, 2026 and Sep 22, 2025; Crop Root Zone conversion at 44.092 bu/tonne).
Evidence: Canola has not outrun the rest of the Northern Plains grain market by much. Every major grain contract is 29% to 58% above a year ago:
| Contract / bid | Sep 21, 2026 | Sep 22, 2025 | YoY | Basis |
|---|---|---|---|---|
| Canola, ICE November (C$/tonne) | 835.20 | 610.40 | +36.8% | Futures settlement |
| Canola, Enderlin, ND ($/cwt) | 25.22 | 19.27 | +30.9% | Processor bid, delivered truck, current |
| Canola, West Fargo, ND ($/cwt) | 25.00 | 18.85 | +32.6% | Processor bid, delivered truck, current |
| Canola, Hallock, MN ($/cwt) | 23.89 | 18.30 | +30.5% | Processor bid, delivered truck, current |
| Spring wheat, MGEX December ($/bu) | 7.46¼ | 5.64 | +32.3% | Futures settlement |
| Soybeans, CBOT November ($/bu) | 13.28 | 10.11 | +31.4% | Futures settlement |
| Corn, CBOT December ($/bu) | 5.43 | 4.21¾ | +28.7% | Futures settlement |
| Hard red winter wheat, KC December ($/bu) | 7.94½ | 5.02¼ | +58.2% | Futures settlement |
Source: GX94 Radio closing commodity prices, Sep 21, 2026 and Sep 22, 2025; USDA AMS National Daily Sunflower, Canola, Millet and Flaxseed Report, Sep 21, 2026 (year-ago cash column as published in that report). Percentages are Crop Root Zone calculations.
Three separate forces explain canola's share of the rally.
- China's duty. A year ago Canadian canola seed faced a 75.8% provisional anti-dumping deposit in China, in force since August 14, 2025. Following the January 2026 agreement in principle, China's final determination set a 5.9% anti-dumping duty on seed. With the 9% most-favoured-nation tariff, the total is 14.9% from March 1, 2026, and canola meal is at 0% through December 31 (Canola Council of Canada, China update, 2026). So the September 2025 price was depressed by a trade penalty that has since mostly gone.
- The crush. Statistics Canada put Canada's 2025/26 canola crush at a record 12.83 million tonnes, including a record 1.322 million tonnes in July (as reported by The Western Producer, Aug 28, 2026). On September 8 the ICE board crush margin for the November/October spread was C$249.18 a tonne, against C$187.01 a year earlier (The Western Producer, ICE Canadian Canola Board Margin Index, Sep 8, 2026). In April it had topped C$350 (The Western Producer, Apr 2026). AAFC expects domestic use to rise to 13.7 million tonnes in 2026/27 as new crushing capacity comes on line (AAFC, Outlook for Principal Field Crops, Aug 20, 2026).
- Vegetable oil and energy. On the days canola moves, the stated reasons are usually soyoil, European rapeseed and crude. On August 28 November canola rose C$19.70 on a broad vegetable oil rally. On September 2 it fell C$16.10 when soyoil fell (The Western Producer, ICE closing reviews, Aug 28 and Sep 2, 2026).
None of the three is a shortfall of canola seed. That matters for Section 4.
2. The fertilizer bill, measured in canola
What's new: The inputs a canola crop uses barely moved this year. DTN's national retail survey for September 7–11 had urea at $658 a ton and MAP at $962, 4.3% and 4.9% above the same week of 2025 ($631 and $917). Potash was up 1.2%, at $494 against $488 (DTN, Sep 16, 2026 and Sep 17, 2025). Ammonium sulfate is not in the DTN survey. The USDA's Pacific Northwest distributor survey, one of the few public series that tracks it, averaged $770.20 a ton on September 18, 8.8% above the $708.10 it reported on August 22, 2025 (USDA AMS Pacific Northwest Production Cost Report, Sep 18, 2026 and Aug 22, 2025).
Evidence: NDSU's canola guidance sets the program. Soil nitrate plus fertilizer N is capped at 120 lb/acre in the warmer, drier west and 150 lb in the cooler, moister east, and the rate is not adjusted for yield goal. A row starter of 30 lb P2O5 is sufficient at medium soil-test P. Sulfur is the unusual line: NDSU recommends applying it "regardless of soil test," as sulfate, because a 2,000-lb crop contains about 27 lb of S, about 15 lb in the seed and 12 lb in the straw, and elemental S alone has not reliably made a crop (NDSU Extension SF1122, Franzen, reviewed Feb 2023).
We priced a representative eastern North Dakota program: 110 lb of fertilizer N (150 lb cap less a 40-lb soil nitrate credit), 30 lb P2O5 as MAP and 20 lb S as ammonium sulfate. Nitrogen carried by the MAP and the ammonium sulfate is credited, and urea supplies the rest.
| Product | Rate (lb/acre) | Price now ($/ton) | Price yr ago ($/ton) | Cost now ($/acre) | Cost yr ago ($/acre) | Basis |
|---|---|---|---|---|---|---|
| Urea (46-0-0) | 187 | 658 | 631 | 61.62 | 59.09 | Retail, national avg. (DTN) |
| MAP (11-52-0) | 58 | 962 | 917 | 27.75 | 26.45 | Retail, national avg. (DTN) |
| Ammonium sulfate (21-0-0-24S) | 83 | 770.20* | 708.10* | 32.09 | 29.50 | Distributor ask, PNW (USDA AMS) |
| Program total | 121.46 | 115.05 | ||||
| Canola price ($/cwt) | 25.22 | 19.27 | Enderlin, ND processor bid | |||
| Program cost in canola (cwt/acre) | 4.82 | 5.97 | ||||
| Program as % of gross revenue, 2,000 lb/acre | 24.1% | 29.9% |
Source: DTN retail fertilizer survey, week of Sep 7–11, 2026 (published Sep 16, 2026) and second week of September 2025 (published Sep 17, 2025); USDA AMS Pacific Northwest Production Cost Report, Sep 18, 2026 and Aug 22, 2025; USDA AMS canola bids, Sep 21, 2026; program design from NDSU SF1122. Rates, costs and ratios are Crop Root Zone calculations. *Ammonium sulfate is a Pacific Northwest distributor average used as a proxy. No public North Dakota series exists, and a Northern Plains retail price could differ by $50–100 a ton in either direction (estimate). Application cost is excluded.
4.8 cwt
Hundredweight of canola needed to pay for a 110-N, 30-P2O5, 20-S program at September 2026 prices. A year ago it took 6.0, so the fertilizer bill fell 19% measured in canola. (Crop Root Zone calculation from DTN, Sep 16, 2026; USDA AMS, Sep 18 and Sep 21, 2026)
In dollars, gross revenue on a 2,000-lb crop is up about $119 an acre ($504 against $385), while the fertilizer program is up about $6.40. Every nutrient shows the same shift when priced in canola:
| Hundredweight of canola to buy one ton | Now | Year ago | |
|---|---|---|---|
| MAP | 38.1 | ████████░░ |
|
| MAP, yr ago | 47.6 | ██████████ |
|
| Ammonium sulfate | 30.5 | ██████░░░░ |
|
| Ammonium sulfate, yr ago | 36.7 | ████████░░ |
|
| Urea | 26.1 | █████░░░░░ |
|
| Urea, yr ago | 32.7 | ███████░░░ |
|
| Potash | 19.6 | ████░░░░░░ |
|
| Potash, yr ago | 25.3 | █████░░░░░ |
Source: Crop Root Zone calculation. Fertilizer prices as in the table above, divided by the Enderlin, ND canola bid of $25.22/cwt (Sep 21, 2026) and $19.27/cwt (year ago), USDA AMS.
Two details matter for planning.
Sulfur is now about a quarter of the bill. At these prices ammonium sulfate is 26% of the program's cost, for 20 lb of S. Once the 21% nitrogen in it is valued at urea's $0.72/lb N (DTN, Sep 16, 2026), the sulfate sulfur costs about 97 cents a pound. That is the premium for the form NDSU says actually makes a crop.
The ratio is not the same everywhere. Priced entirely off the Pacific Northwest survey, where urea averages $1,085.60 and MAP $1,235.67, the same program costs about $169 an acre, up 22% from the $139 it cost on the August 2025 survey (USDA AMS PNW, Sep 18, 2026 and Aug 22, 2025). The fertilizer bill still rose less than the canola price there, but the gain is about a third of the national figure. Growers should check the ratio against their own retailer's quote, not the national average.
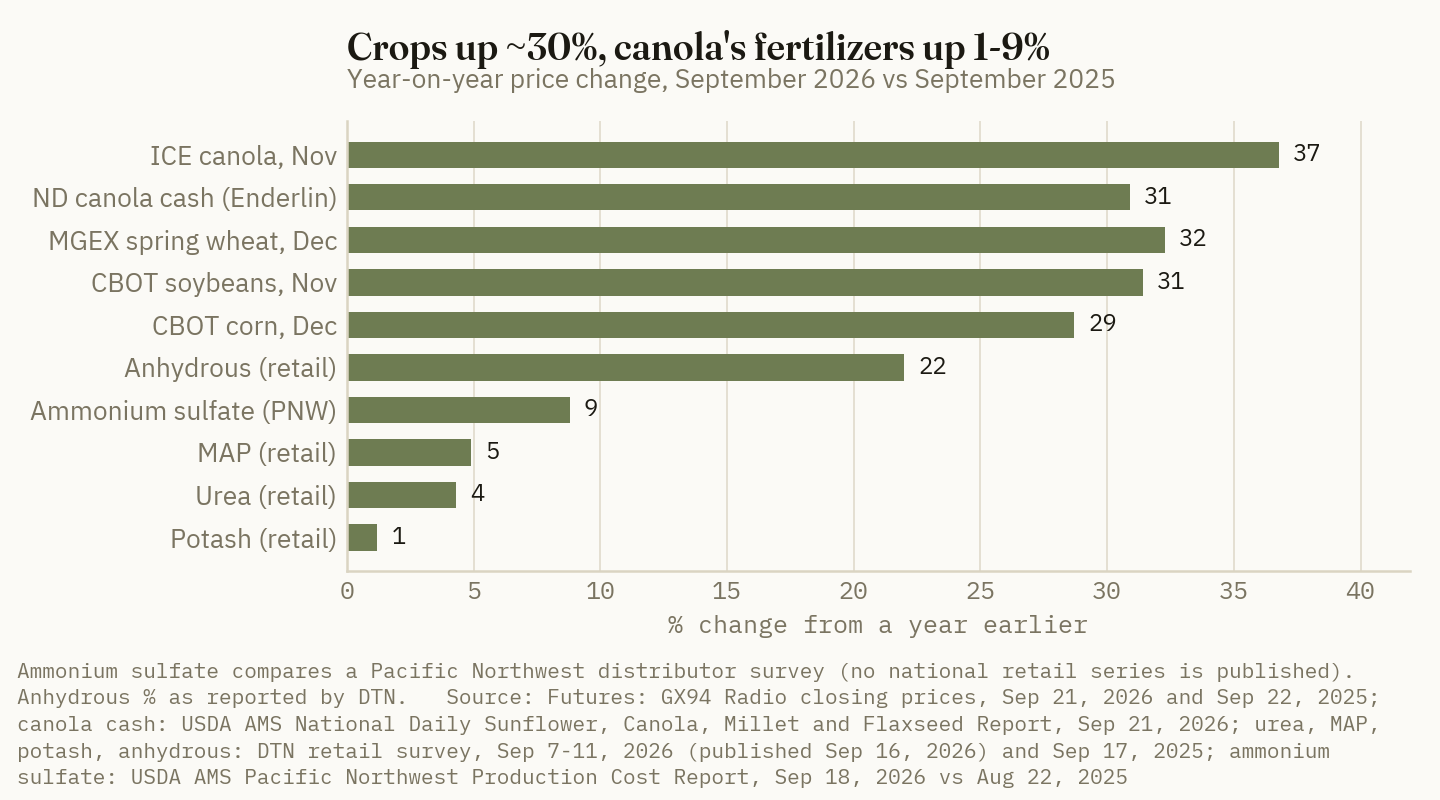
Ground Truth: Priced in the crop, canola's fertilizer bill has fallen by a fifth. Almost all of that gain is on the revenue side and almost none on the input side. So the grower can bank it only by pricing the crop, not by waiting for fertilizer to get cheaper. The decision this implies has an order to it. Fall nitrogen can go on after October 1, once 4-inch soil temperatures fall below 50°F (NDSU SF1122), so the N for 2027 canola can be bought and applied at today's ratio. Sulfur is different. NDSU warns that fall-applied sulfate is at risk of leaching in a wet spring, and this fall has already been wet across much of the region: 34% of Saskatchewan cropland topsoil is rated surplus. The right move on S is to price it now and apply it in spring. On the revenue side, a grower who books fertilizer at 4.8 cwt an acre without also selling some canola has locked in the cost side of the ratio and left the revenue side unhedged. If canola falls back to last year's $19.27, the ratio goes back to 6.3 cwt an acre.
3. The supply: records in both countries, and a slow, wet Prairie harvest
What's new: Statistics Canada's September 16 model-based estimate puts Canadian canola at 22.1 million tonnes, down 0.8% from 2025. Yield is expected to fall 8.3% to 41.8 bu/acre, which is offset by a record 23.2 million harvested acres, up 8.0% (Statistics Canada, The Daily, Sep 16, 2026). On the US side, NASS has planted canola at a record 2.965 million acres, 26.8% above 2025, with North Dakota at a record 2.35 million, up 29.8% and 79% of the US total (USDA NASS Acreage, Jun 30, 2026; Crop Production, Sep 11, 2026).
Evidence:
| Canola supply indicator | 2026 | 2025 | Change | Source basis |
|---|---|---|---|---|
| Canada harvested area (mil acres) | 23.2 | ~21.5 | +8.0% | StatCan model, Sep 16 |
| Canada yield (bu/acre) | 41.8 | ~45.6 | −8.3% | StatCan model, Sep 16 |
| Canada production (mil tonnes) | 22.1 | ~22.3 | −0.8% | StatCan model, Sep 16 |
| Saskatchewan production (mil tonnes) | 12.7 | ~12.5 | +1.8% | StatCan model, Sep 16 |
| US planted area (1,000 acres) | 2,965 | 2,338.5 | +26.8% | NASS |
| North Dakota planted (1,000 acres) | 2,350 | 1,810 | +29.8% | NASS |
| AAFC 2026/27 ending stocks (mil tonnes) | 1.504 | 1.725 | −12.8% | AAFC, Aug 20 (2025/26 carry-out) |
| AAFC crop-year average price (C$/tonne) | 720 | 711 | +1.3% | AAFC, Aug 20 |
Source: Statistics Canada, The Daily, "Model-based principal field crop estimates, August 2026," Sep 16, 2026; USDA NASS Acreage, Jun 30, 2026 and Crop Production, Sep 11, 2026; AAFC Outlook for Principal Field Crops, Aug 20, 2026. 2025 Canadian values marked ~ are back-calculated by Crop Root Zone from StatCan's reported percentage changes and rounded; they are approximate. AAFC's area, production and stocks are its own series and differ from StatCan's latest model estimate.
The harvest in Canada's largest canola province is badly behind. In the week ending September 14, Saskatchewan's harvest was 32% complete against a five-year average of 71% and a ten-year average of 63%. Canola was 15% combined. Topsoil moisture on cropland was rated 34% surplus, with up to 97 mm of rain in one week in some municipalities. Only 30% of field peas graded No. 1 Canada, against a ten-year average of 42%, and sclerotinia damage to canola was reported where the season had been wettest (Saskatchewan Crop Report, Sep 17, 2026). The province's own crop report put the average canola yield estimate at 38 bu/acre at the end of August, below StatCan's 41.9 for the province (Saskatchewan Crop Report, Sep 3, 2026; Statistics Canada, Sep 16, 2026). Manitoba was 40% harvested (620 CKRM, Sep 16, 2026).
A slow harvest in Canada can support prices at first, because crushers cannot get the seed. It weighs on prices later, when the delayed bushels all arrive at once. Weather-driven quality loss would push the market the other way, and the record for this crop so far is mixed. It is too early to say which effect will win.
4. What the ratio says about 2027, and what it does not
What's new: Nothing in this section is a new data release. It sets the ratio against the three things a 2027 canola decision also depends on.
Evidence:
The futures price is well above the official forecast. AAFC's August outlook projects a 2026/27 crop-year average price of C$720 a tonne on stocks-to-use of about 6.9% (1.504 million tonnes of carry-out against 21.7 million of exports plus domestic use). November futures at C$835.20 are 16% above that (AAFC, Aug 20, 2026; GX94 Radio, Sep 21, 2026; Crop Root Zone calculation). AAFC's price is an annual average and its outlook predates StatCan's September estimate. Even so, a 16% gap means the market is pricing a stronger demand story than the government's balance sheet shows.
The crush margin is already coming down. The board margin that funds the crusher's bid fell from C$284.20 to C$249.18 a tonne in the week to September 8 (The Western Producer, Sep 8, 2026). It is still a third above a year ago. But it is a spread between oil, meal and seed, and a large share of the oil value depends on biofuel demand and vegetable oil prices, not on canola's own balance sheet. A margin that fell 12% in one week can fall further.
Rotation limits more acres. The Canola Council of Canada recommends at least two years between canola crops (a one-in-three rotation) to control blackleg and clubroot (Canola Council of Canada, Canola Encyclopedia, crop rotation). North Dakota added 540,000 canola acres in a single year. A grower who moved into canola in 2026 and plans more in 2027 is pushing those breaks shorter at the same time as the price ratio encourages it.
| 2027 canola decision | What the September 2026 ratio says | What it does not settle |
|---|---|---|
| Fall N for 2027 canola | Buy: 26.1 cwt per ton of urea vs 32.7 a year ago | Whether an early freeze or wet soils close the application window |
| Sulfur | Price now: AS is 30.5 cwt/ton vs 36.7 | Apply in spring; NDSU flags leaching risk on fall-applied sulfate |
| Canola acres | Revenue per acre is up ~$119 at today's bid | Rotation breaks, and futures 16% above AAFC's forecast |
| Unpriced 2026 bushels | Price is 31% above a year ago at ND processors | Harvest pressure on the Prairies once combines catch up |
Source: Crop Root Zone read, built on the figures in Sections 1–3 and NDSU SF1122.
Ground Truth: The ratio says canola's fertilizer bill, measured in its own crop, is about a fifth cheaper than it was a year ago. It does not say canola is short. Both countries planted record areas, AAFC's price forecast sits 16% below the futures, and the premium rests on a crush margin that fell by C$35 in one week in September. The sensible response is to take the ratio on both sides at once. Book 2027 nitrogen and sulfur at 4.8 cwt an acre, and sell enough 2026 canola, or hedge enough 2027 production, to lock in the revenue side as well. Adding canola acres on the strength of the ratio leaves the price side unhedged, shortens the rotation, and bets on the one input to the ratio, the vegetable oil price, that the grower has no control over. If the 2027 canola area stays near this year's record, the most likely outcome is that the ratio moves back toward 6 cwt an acre because canola falls, not because fertilizer rises.
References
- USDA AMS Livestock, Poultry and Grain Market News (MN Dept. of Ag Market News), National Daily Sunflower, Canola, Millet, and Flaxseed Report, Sep 21, 2026 (includes CBOT settlements and year-ago canola bids) — https://mymarketnews.ams.usda.gov/viewReport/2887
- GX94 Radio, "September 21 Closing Commodity Prices," Sep 21, 2026 — https://www.gx94radio.com/2026/09/21/september-21-closing-commodity-prices-2/
- GX94 Radio, "September 22 Closing Commodity Prices," Sep 22, 2025 — https://www.gx94radio.com/2025/09/22/september-22-closing-commodity-prices-2/
- Canola Council of Canada, "Canola trade with China" (timeline of tariffs and duties), accessed Sep 22, 2026 — https://www.canolacouncil.org/china-update/
- The Western Producer, "ICE Closing Review" (November canola, record July crush of 1.322 million tonnes, 2025/26 crush of 12.83 million tonnes), Aug 28, 2026 — https://www.producer.com/market-update/ice-closing-review-canola-enters-weekend-in-flight/
- The Western Producer, "ICE Closing Review: Canola down hard," Sep 2, 2026 — https://www.producer.com/market-update/ice-closing-review-canola-down-hard/
- The Western Producer, "ICE Canadian Canola Board Margin Index Close – Sept. 8," Sep 8, 2026 — https://www.producer.com/market-update/ice-canadian-canola-board-margin-index-close-sept-8/
- The Western Producer, "Margins reach 'staggering' levels for canola crushers," Apr 2026 — https://www.producer.com/markets/margins-reach-staggering-levels-for-canola-crushers/
- Agriculture and Agri-Food Canada, Canada: Outlook for Principal Field Crops, Aug 20, 2026 — https://agriculture.canada.ca/en/sector/crops/reports-statistics/canada-outlook-principal-field-crops-2026-08-20
- DTN/Progressive Farmer, "Fertilizer Prices Continue Lower for 6 of 8 Major Nutrients," Sep 16, 2026 (survey week Sep 7–11, 2026) — https://www.dtnpf.com/agriculture/web/ag/crops/article/2026/09/16/fertilizer-prices-continue-lower-6-8
- DTN/Progressive Farmer, "DAP Leads Fertilizer Prices Up Again," Sep 17, 2025 — https://www.dtnpf.com/agriculture/web/ag/crops/article/2025/09/17/dap-leads-fertilizer-prices
- USDA AMS, Pacific Northwest Production Cost Report (Bi-Weekly), Sep 18, 2026 — https://www.ams.usda.gov/mnreports/ams_3657.pdf ; and Aug 22, 2025 (ESMIS archive) — https://esmis.nal.usda.gov/sites/default/release-files/h989sc11z/5q47tm71t/qz20vs12q/AMS_3657.PDF
- NDSU Extension, D.W. Franzen, Fertilizing Canola and Mustard (SF1122), reviewed Feb 2023 — https://www.ndsu.edu/sites/default/files/fileadmin/snrs/Files/Goettl_Extension_circulars/sf1122.pdf
- Statistics Canada, The Daily, "Model-based principal field crop estimates, August 2026," Sep 16, 2026 — https://www150.statcan.gc.ca/n1/daily-quotidien/260916/dq260916b-eng.htm
- USDA NASS, Acreage, Jun 30, 2026 — https://esmis.nal.usda.gov/sites/default/release-files/795961/acrg0626.pdf
- USDA NASS, Crop Production, Sep 11, 2026 — https://esmis.nal.usda.gov/sites/default/release-files/796056/crop0926.pdf
- Government of Saskatchewan, "Crop Report for the Period September 8 to September 14, 2026," Sep 17, 2026 — https://www.saskatchewan.ca/government/news-and-media/2026/september/17/crop-report-for-the-period-september-8-to-september-14-2026
- Government of Saskatchewan, "Crop Report for the Period August 25 to August 31, 2026," Sep 3, 2026 — https://www.saskatchewan.ca/government/news-and-media/2026/september/03/crop-report-for-the-period-august-25-to-august-31-2026
- 620 CKRM, "Manitoba harvest now 40 percent complete: crop report," Sep 16, 2026 — https://www.620ckrm.com/2026/09/16/manitoba-harvest-now-40-percent-complete-crop-report/
- Canola Council of Canada, Canola Encyclopedia, "Crop rotation," accessed Sep 22, 2026 — https://www.canolacouncil.org/canola-encyclopedia/field-characteristics/crop-rotation/
Disclosures
Crop Root Zone is an independent publication. Nothing here is investment advice. Market calls, where included, reflect the editors' own read and are not a recommendation to buy or sell any security.
The National Storage Squeeze Eased by 733 Million Bushels. A Ground Pile Still Pays Only if It Is Empty by February.
The 2026 corn, soybean and sorghum crop plus carry-in is 733 million bushels smaller than last year's against 25.5 billion bushels of storage, but the squeeze moved to Iowa and the Ohio Valley, where basis sits at record lows for September. Built from extension, USDA and EIA figures, a covered, aerated pile costs about 16 to 37 cents a bushel to hold Iowa corn to early January and 28 to 50 cents to early March, before the cover and fans. Against a 13¾-cent December–March carry, a pile emptied in January pays if basis recovers. One held to March loses money in most cases. The gap between a 1% and a 4% storage loss, 14½ cents, is worth more than the whole carry.
Corn harvest was 13% complete on September 20, with soybeans at 12% (DTN, Sep 21, 2026). The storage problem this fall is not the one the country had a year ago. USDA's September 11 balance sheets put the new corn crop at 15.8 billion bushels, down from 17.0 billion. Soybeans are a record 4.535 billion, and corn carry-in is 1.922 billion, up 371 million on the year (USDA WAOB, WASDE-675, Sep 11, 2026). Add sorghum and the fall crops plus their carry-in come to about 22.9 billion bushels. That is 733 million less than last fall, against 25.5 billion bushels of permanent storage (USDA NASS, Jan 2026). The national squeeze has eased. Ground piles will still go up this fall, though, in the places where the crop grew and basis broke. This piece prices what a covered pile costs per bushel and what the market pays to fill it. It finds that the exit date matters more than the carry.
1. The national squeeze eased. The regional one moved.
What's new: US on-farm storage capacity was 13.618 billion bushels on December 1, 2025, and off-farm commercial capacity was 11.871 billion. Together they come to 25.49 billion, up 56 million bushels on the year (USDA NASS, Grain Stocks, Jan 2026). The build rate is still close to stalled, as we noted in August (TRZ-0138). This year, though, the crop moved more than the capacity did.
Evidence: The fall-crop supply that needs a home, corn, soybeans and sorghum plus their September 1 carry-in, fell by 733 million bushels:
| Million bushels | 2025/26 | 2026/27 (Sep proj.) | Change |
|---|---|---|---|
| Corn carry-in, Sep 1 | 1,551 | 1,922 | +371 |
| Corn production | 17,021 | 15,800 | −1,221 |
| Soybean carry-in + production | 4,587 | 4,860 | +273 |
| Sorghum carry-in + production | 477 | 321 | −156 |
| Fall-crop supply | 23,636 | 22,903 | −733 |
| Storage capacity, prior Dec 1 | 25,433 | 25,489 | +56 |
| Supply as % of capacity | 92.9% | 89.9% | −3.0 pts |
| Dec 1 corn + soybean stocks | 16,572 | ~16,070* | ~−500* |
Source: USDA WAOB, WASDE-675, Sep 11, 2026; USDA NASS, Grain Stocks, Jan 2026 (capacity and Dec 1, 2025 stocks). Wheat, barley and oats excluded. *Crop Root Zone estimate: 2026/27 total use from WASDE, times the share of 2025/26 use that disappeared September–November (31.8% for corn, 30.4% for soybeans).
At the state level, the picture changes. We divided each state's corn plus soybean crop by its combined on-farm and off-farm capacity. Nebraska and South Dakota each shed 15 to 21 points on fewer harvested acres and lower yields. Iowa's crop grew, with corn at 2.80 billion bushels and a 219-bushel yield, against 2.77 billion and 210 in 2025. The Ohio Valley grew most, relative to its space: Kentucky rose 16 points, Tennessee 19 and Ohio 7 (USDA NASS, Crop Production, Sep 11, 2026).
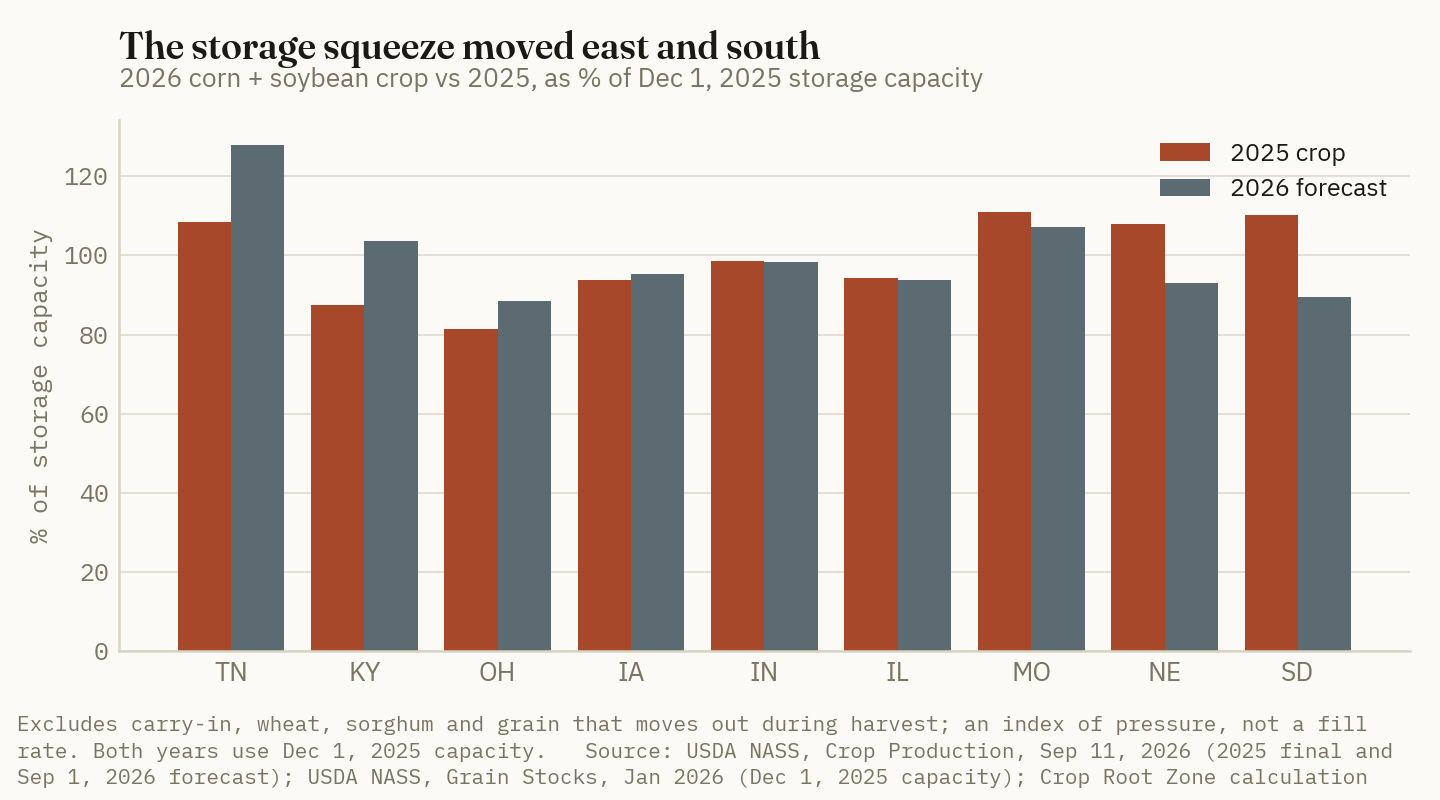
Basis is showing the same shift. Purdue's September 25 update found corn basis on the Ohio River at 67 under December and southeast Iowa at 53 under. Both are the weakest on record for the fourth week of September (Purdue Center for Commercial Agriculture, Sep 25, 2026). USDA's Iowa report the same day had southeast Iowa country elevators bidding 40 to 69 under. The state average was $4.84, 44 under December (USDA AMS, Sep 25, 2026). Not all of that is space. Midwest diesel hit $6.68 a gallon in the week of September 21. Rail tariffs from the western Corn Belt to Pacific Northwest export terminals rise $200 to $225 a car in October (USDA AMS Grain Transportation Report, Sep 24, 2026).
Ground Truth: A national storage table this fall says the crunch is over. In Iowa and along the Ohio, it is not. Where a state's crop exceeds its permanent space, or grain has to wait for freight, the pile is the marginal bin. Its cost sets harvest basis in that area, whatever the national totals say. Growers in Nebraska and South Dakota should expect less pile-driven basis weakness than last fall. Growers in southeast Iowa, Kentucky and Tennessee should expect more.
2. What a covered pile costs per bushel
What's new: We found no current extension budget for a covered, aerated ground pile. Our September 15 piece on grain bags (TRZ-0195) reported the same gap. So we built one from published parts. The rules come first. Purdue says corn piled only through cool weather can go in at 15% or less, needs 14% to be held into spring, and should be out of temporary storage in January or February, no later than March (Purdue Extension, GQTF-38). Iowa licenses elevator temporary storage from August 1 to May 1. Corn in it must be no wetter than 14%, and it needs a walkable cover, a hard or compacted base and at least 0.13 cfm per bushel of aeration (Iowa Admin. Code r. 21-90.26). NDSU's guide treats all temporary storage as holding for less than six months (NDSU Extension, AE-84).
Evidence: The budget below holds Iowa corn piled October 20 and valued at the $4.84 state average. It prices three exit dates.
| Line, cents per bushel | Out Jan 7 (79 days) | Out Feb 5 (108 days) | Out Mar 5 (136 days) | Basis |
|---|---|---|---|---|
| Interest at 7% | 7.3 | 10.0 | 12.6 | $4.84 corn |
| Drying shrink to 14% | 0.0 | 0.0 | 6.1 | 15% is acceptable through winter; 1.25% per point |
| Handling in and out | 2.0–2.5 | 2.0–2.5 | 2.0–2.5 | ISU farm-storage range, a floor for a pile |
| Aeration power | 0.3–1.8* | 0.3–2.5* | 0.3–3.1* | Cooling cycles only, up to fans running full time |
| Storage loss, 1–4% | 4.8–19.4 | 4.8–19.4 | 4.8–19.4 | Covered temporary storage |
| Variable cost | 14.4–31.0 | 17.1–34.4 | 25.8–43.7 | |
| Pad and walls, annualized | 1.9–6.3* | 1.9–6.3* | 1.9–6.3* | Crushed rock to asphalt, 2019 costs |
| Total before cover and fans | 16.3–37.3 | 19.0–40.7 | 27.7–50.0 |
Sources: Iowa State University Ag Decision Maker A2-33, May 2023 (handling, 1.25% shrink factor, and 0.5–1% loss for farm bins); Kansas City Fed, Jul 10, 2026 (farm loans over $100,000 slightly below 7%); NDSU Extension AE-84 (Manitoba trials on wheat, barley and oats: losses of 1–4% in covered temporary bins on plastic, about 50% in an uncovered outdoor pile; applied here to corn as a proxy); EIA Electric Power Monthly Table 5.3, Sep 24, 2026 (July commercial electricity 14.53¢/kWh); USDA AMS Iowa Daily Cash Grain Bids, Sep 25, 2026. *Crop Root Zone estimates. Aeration uses a 600,000-bushel bunker with seven 7.5-hp fans at 1/7 cfm per bushel, as built by one Kansas cooperative (Grain Journal), and runs from three cooling cycles to 24 hours a day. Pad and walls are costed in the next table and spread over 15 years at 7%.
The cover, fans and ducts are not in the table. We found no public list price for a pile-sized cover or a fan package. Every cent they add per bushel comes straight off the margins in Section 3. For scale, Alberta's provincial storage study put a ring-and-tarp system at C$0.18 to C$0.80 per bushel of capacity, including the tarp, and about C$0.10 per bushel a year once spread over its life (Alberta Agriculture and Forestry, May 2018).
Averaging the ranges for a February exit shows where the money goes:
| Line, Feb 5 exit | Midpoint ¢/bu | |
|---|---|---|
| Storage loss | 12.1 | ██████████ |
| Interest | 10.0 | ████████░░ |
| Pad and walls | 4.1* | ███░░░░░░░ |
| Handling | 2.3 | ██░░░░░░░░ |
| Aeration power | 1.4* | █░░░░░░░░░ |
Source: Crop Root Zone calculation from the table above. *Estimates. Bars scale to storage loss = 10 blocks.
14½¢
The gap between a 1% and a 4% storage loss on $4.84 corn. That is more than the entire 13¾¢ December–March futures carry. A pile's result is set mostly by the cover, the pad and the moisture meter, not by the market. (Crop Root Zone calculation from NDSU Extension AE-84 and USDA AMS, Sep 25, 2026)
The tail risk is worse than 4%. NDSU calculates that one inch of rain raises the moisture of the top foot of a corn pile by nine points. On a 25-foot cone, losing that foot is about 13% of the grain (NDSU Extension, Sep 10, 2025). A torn cover in a November storm moves a pile from the low column of this budget past the high one.
Ground Truth: Interest and loss make up about three-quarters of what a pile costs. Both grow with every week the grain sits, and loss grows faster as spring weather arrives. So a pile is not a cheaper bin. It is a short-term position with a cost that rises over time. Plan the exit before the first truck unloads. If a pile has to reach March, it should go in at 14%, which costs 6 cents of shrink. Corn at 15% should be out in January.
3. What the market pays for holding
What's new: CBOT corn settled September 25 at $5.28¼ December, $5.42 March, $5.48¾ May and $5.51½ July (USDA AMS, Sep 25, 2026). That is a 13¾-cent December–March carry, 20½ cents to May and 23¼ to July. A pile that has to be empty by March can capture only the March spread. The May and July carry, about 40% of the carry to July, goes to storage that can hold into spring.
Evidence: Over the past five years, Iowa's state-average basis in the third week of October has averaged 26 under December. The first week of January has averaged 15 under March, the first week of February 19 under and the first week of March 24 under (Iowa State University, Ag Decision Maker A2-41, Dec 2025). Basis against March widens as March delivery approaches, so a pile loses basis gain as well as paying more cost the longer it sits. The hedged return is the March spread plus the change in basis. We run it from today's 44 under, in two cases: spring basis returns to its five-year average, or it stays 18 cents weaker. The second case also stands for a harvest in which basis recovers before the pile goes up.
| Exit | Hedged return, basis recovers | Hedged return, basis stays weak | Pile cost before cover | Net, recovers | Net, stays weak |
|---|---|---|---|---|---|
| Jan 7 | 42.75 | 24.75 | 16.3–37.3* | +5.5 to +26.5 | −12.6 to +8.5 |
| Feb 5 | 38.75 | 20.75 | 19.0–40.7* | −2.0 to +19.8 | −20.0 to +1.8 |
| Mar 5 | 33.75 | 15.75 | 27.7–50.0* | −16.3 to +6.1 | −34.3 to −12.0 |
Source: USDA AMS Iowa Daily Cash Grain Bids, Sep 25, 2026 (settlements; state average −44Z); ISU Ag Decision Maker A2-41, Dec 2025. *Crop Root Zone estimates from Section 2. All figures in cents per bushel versus a harvest sale at today's bid. These are scenarios, not forecasts. Today's September bid stands in for the harvest bid.
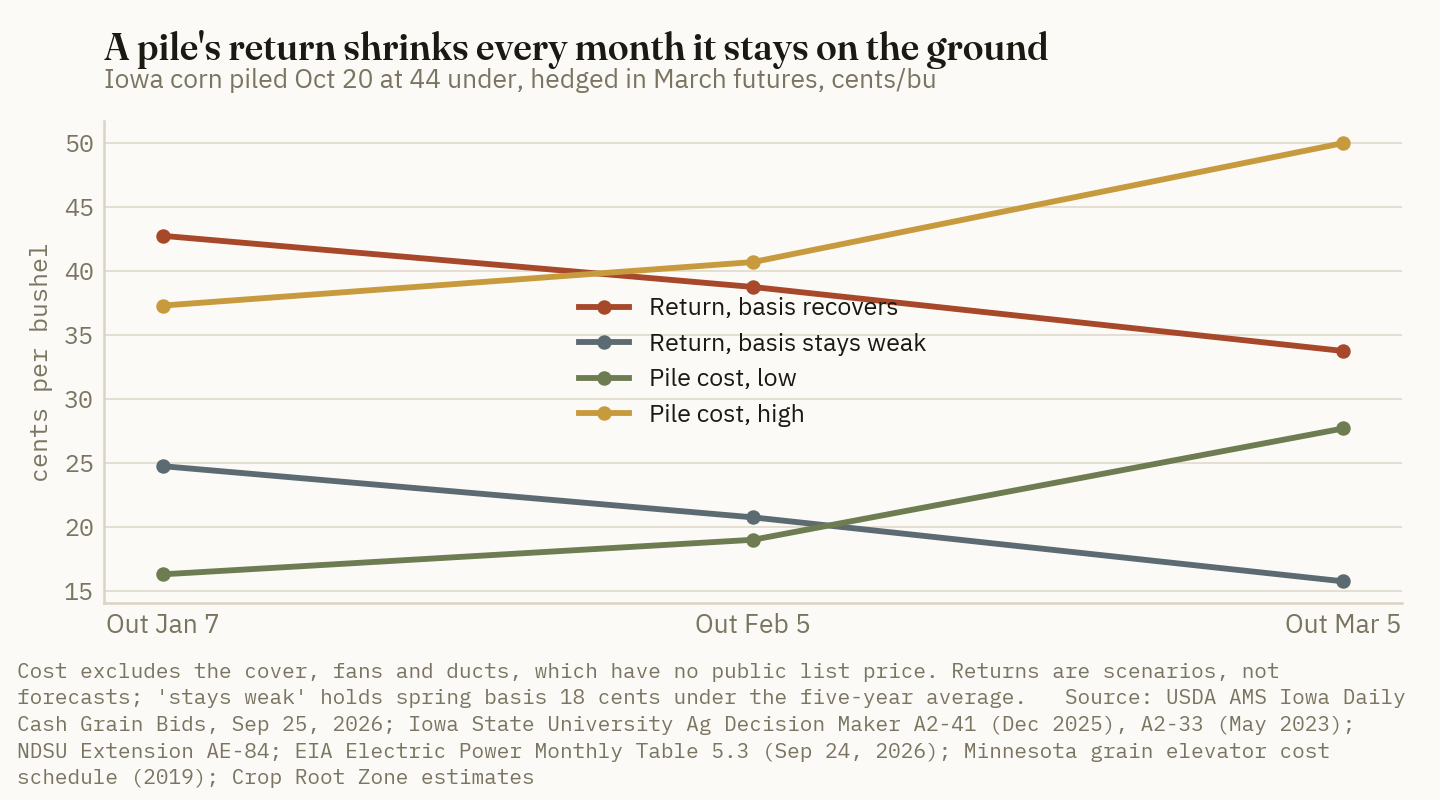
The same corn could instead go to open storage at the elevator. One cooperative's 2026 sheet charges 20 cents for the first 90 days, then 4.5 cents a month, and shrinks wet corn at 1.5% a point (Nexus Cooperative, accessed Sep 28, 2026). Assuming the corn is shrunk to 14% at that rate, and adding interest, that comes to about 35, 40 and 47 cents for the January, February and March exits (Crop Root Zone estimate). That is above the pile's range in most cases. In return, the elevator carries the quality risk.
Soybeans are a weaker candidate for a pile. Purdue caps soybeans in temporary storage at 13% moisture into spring, and Iowa's rule is the same (Purdue Extension, GQTF-38; Iowa Admin. Code r. 21-90.26). The November–May soybean carry is 27¼ cents (USDA AMS, Sep 25, 2026). Iowa and Ohio processors are bidding record premiums over November futures (Purdue, Sep 25, 2026). Soybeans have a buyer at harvest and are expensive to keep dry on the ground. Corn is the grain that ends up in piles.
Ground Truth: For Iowa corn this fall, a pile pays in one case: at today's weak basis, emptied by early January, with a cover that holds. Two more months on the ground move the expected result from clearly positive to break-even or a loss in most combinations. That rules out using a farm pile to wait for a better spring price. A grower who wants the May and July carry needs a bin or elevator space. Where both are full, the choice is to sell into the weak basis now or pile and sell into the recovery in January.
4. Why elevators keep choosing bunkers over bins
What's new: On September 8, a USDA AMS rule set requirements for warehouse operators licensing emergency and temporary space. They include an asphalt, concrete or other AMS-approved base, rigid self-supporting walls, adequate aeration and an acceptable cover. Corn and other feed grains may stay until July 1 of the following year, and soybeans until March 31 (Grain Journal, Sep 8, 2026). A walled, aerated and licensed bunker can therefore do what a farm pile cannot: hold corn to May or July delivery, where the carry is.
Evidence: The bunker's structure is cheap. One Kansas cooperative's first bunker held 600,000 bushels on a 150-by-365-foot footprint, with 4-foot steel walls, seven 7.5-hp axial fans and a vendor tarp (Grain Journal, Cloud County Coop). We priced its pad and walls from Minnesota's assessor cost schedule:
| 600,000-bu bunker component | 2019 replacement cost | ¢ per bushel of capacity | Annualized, 15 yr at 7% (¢/bu) |
|---|---|---|---|
| Crushed-rock base, 54,750 sq ft at $1.40–2.20 | $76,650–120,450 | 12.8–20.1 | |
| Asphalt base, at $3.60–5.40 | $197,100–295,650 | 32.9–49.3 | |
| Metal bunker walls, 4,120 sq ft at $6.75–12.25 | $27,810–50,470 | 4.6–8.4 | |
| Rock base + walls | $104,460–170,920 | 17.4–28.5 | 1.9–3.1 |
| Asphalt base + walls | $224,910–346,120 | 37.5–57.7 | 4.1–6.3 |
Source: Grain Elevator Cost Schedule (updated 2019), Minnesota assessor guide as posted by the Minnesota Grain and Feed Association; bunker geometry from Grain Journal. Crop Root Zone calculation. 2019 prices understate 2026 construction costs, and cover, fans, ducting and reclaim equipment are excluded.
Set that against a bin. Ohio State's September example prices a 70,000-bushel dry storage system at about $200,000, or $2.85 a bushel, with a payback of about 7.8 years (Richer, OSU Extension, Ohio's Country Journal, Sep 23, 2026). Now take one season of farmer storage at the posted cooperative rate above, from October 20 to Iowa's May 1 deadline. It brings in about 35 cents a bushel (Crop Root Zone calculation). That is more than the full 2019 cost of a rock pad and walls, and 60 to 95% of the asphalt version. The elevator also collects shrink and keeps the option on the carry for its own grain.
Ground Truth: The bunker's economics help explain why permanent storage has stopped growing. A licensed bunker can recover its pad and walls in about one season of storage fees. A bin takes most of a decade. An elevator facing one big year out of three will keep building bunkers. That keeps the space shortfall a seasonal, weather-exposed problem that gets priced into harvest basis. For a grower, the practical point is to ask the elevator how much licensed bunker space it has and until what date. A bunker licensed to May or July can hold grain long enough to earn the May and July carry. A farm pile cannot.
5. What would change the answer
The September 30 Grain Stocks report. The corn carry-in of 1.922 billion bushels is a WASDE estimate. NASS publishes the measured September 1 figure on September 30. A number more than 100 million higher would add that much to the space problem, concentrated in states that already had full bins.
The October 9 crop report. USDA cut corn yield 2.2 bushels in September on hot, dry finishing weather (Brownfield, Sep 2026). Another cut widens the national cushion. It may do little in Iowa, where the September forecast raised yield to 219.
Freight and diesel. If this fall's weak basis mainly reflects $6.53 national-average diesel and higher rail tariffs, it will not recover by January. The "stays weak" column in Section 3 is then the one to plan on (USDA AMS GTR, Sep 24, 2026).
The pile itself. The biggest input to this budget is controlled on the farm, not in the market: dry corn going in, a crowned and drained base, a cover that stays on, and fans that run. Iowa State's handling floor and our pad estimates are small next to the 1% to 4% loss range. A grower who cannot get the cover, the fans and the reclaim equipment lined up in October should budget for the high column, and at the high column a pile loses money in most cases.
References
- USDA World Agricultural Outlook Board, World Agricultural Supply and Demand Estimates, WASDE-675, Sep 11, 2026 — https://esmis.nal.usda.gov/sites/default/release-files/796054/wasde0926.pdf
- USDA National Agricultural Statistics Service, Crop Production, Sep 11, 2026 — https://esmis.nal.usda.gov/sites/default/release-files/796056/crop0926.pdf
- USDA National Agricultural Statistics Service, Grain Stocks (January 2026), incl. on-farm and off-farm storage capacity as of Dec 1, 2025 — https://esmis.nal.usda.gov/sites/default/release-files/795726/grst0126.pdf
- USDA AMS Livestock, Poultry and Grain Market News / Iowa Dept. of Agriculture, Iowa Daily Cash Grain Bids, Sep 25, 2026 — https://www.ams.usda.gov/mnreports/ams_2850.pdf
- J. Strine, Purdue University Center for Commercial Agriculture, "September 2026 Crop Basis Update: The Harvest Dip," Sep 25, 2026 — https://ag.purdue.edu/commercialag/home/resource/2026/09/september-2026-crop-basis-update-harvest-dip/
- USDA Agricultural Marketing Service, Grain Transportation Report, Sep 24, 2026 — https://www.ams.usda.gov/sites/default/files/media/GTR09242026.pdf
- DTN/Progressive Farmer, "USDA Crop Progress: Corn 13% Harvested, Rated 57% Good to Excellent as of Sept. 20," Sep 21, 2026 — https://www.dtnpf.com/agriculture/web/ag/news/article/2026/09/21/usda-crop-progress-corn-13-harvested
- Iowa State University Extension and Outreach, Ag Decision Maker A2-41, "Iowa Corn Price Basis, 2020/21 through 2024/25," revised Dec 2025 — https://www.extension.iastate.edu/agdm/crops/pdf/a2-41.pdf
- Iowa State University Extension and Outreach, Ag Decision Maker A2-33, "Cost of Storing Grain" (W. Edwards), updated May 2023 — https://www.extension.iastate.edu/agdm/crops/html/a2-33.html
- D. E. Maier and W. F. Wilcke, Purdue University Extension, GQTF-38, "Temporary Grain Storage Considerations," undated — https://www.extension.purdue.edu/extmedia/GQ/GQTF38/GQTF-38.html
- K. J. Hellevang, NDSU Extension Service, AE-84 "Temporary Grain Storage," revised Aug 1998 — https://www.ndsu.edu/agriculture/sites/default/files/2021-05/AE-84-temporary-grain-storage.pdf
- NDSU Extension, "Consider key factors when using alternative grain storage," Sep 10, 2025 — https://www.ag.ndsu.edu/news/newsreleases/2025/september/consider-key-factors-in-alternative-grain-storage-methods
- Iowa Administrative Code r. 21-90.26, "Temporary grain storage facilities," via Legal Information Institute, accessed Sep 28, 2026 — https://www.law.cornell.edu/regulations/iowa/Iowa-Admin-Code-r-21-90-26
- Grain Journal, "USDA Rules Establish Requirements for Emergency and Temporary Grain Storage," Sep 8, 2026 — https://www.grainjournal.com/article/1154664/usda-rules-establish-requirements-for-emergency-and-temporary-grain-storage
- Grain Journal, facility feature, "Cloud County Coop Elevator Association Builds Four Temporary, One…" (Concordia, KS), accessed Sep 28, 2026 — https://www.grainjournal.com/facility-features/cloud-county-coop-purchases-acreage-and-begins-constructing-in-concordia-ks
- Grain Elevator Cost Schedule (updated 2019), Minnesota assessor guide, as posted by the Minnesota Grain and Feed Association — https://www.mgfa.org/wp-content/uploads/2021/02/MN-Grain-Elevator-2019-Cost-Schedules.pdf
- U.S. Energy Information Administration, Electric Power Monthly, Table 5.3, release of Sep 24, 2026 (data through July 2026) — https://www.eia.gov/electricity/monthly/epm_table_grapher.php?t=epm_table_5_03
- Federal Reserve Bank of Kansas City, "New Farm Loan Originations Ease Slightly," Jul 10, 2026 — https://www.kansascityfed.org/center-for-agriculture-and-the-economy/agricultural-finance/new-farm-loan-originations-ease-slightly/
- Nexus Cooperative, Grain Policy (storage, drying and shrink rates), accessed Sep 28, 2026 — https://www.nexus.coop/grain-policy/
- E. Richer, Ohio State University Extension, "Is now the time to be thinking more about on-farm storage?", Ohio's Country Journal, Sep 23, 2026 — https://ocj.com/2026/09/is-now-the-time-to-be-thinking-more-about-on-farm-storage/
- Alberta Agriculture and Forestry, "Grain Storage Considerations," revised May 2018 — https://www1.agric.gov.ab.ca/$Department/deptdocs.nsf/all/sis15194/$FILE/Grain%20Storage%20Considerations%20Report%20Revised_May%202018.pdf
- Brownfield Ag News, "USDA 2026 corn, soybean estimates shift on yield changes," Sep 2026 — https://www.brownfieldagnews.com/news/usda-2026-corn-soybean-estimates-shift-on-yield-changes/
- Crop Root Zone, TRZ-0138, "US Grain Storage Added 337 Million Bushels in Six Years. It Used to Add 349 Million in One," Aug 28, 2026; and TRZ-0195, "A Grain Bag Costs 44 to 61 Cents to Store Corn to March," Sep 15, 2026.
Disclosures
Crop Root Zone is an independent publication. Nothing here is investment advice. Market calls, where included, reflect the editors' own read and are not a recommendation to buy or sell any security.
Hiring an Iowa Anhydrous Pass Costs About $17 an Acre at Today's Diesel. A New Toolbar Beats It Only Past About 1,500 Acres, and Only if the Tractor Is Treated as Free.
Against Iowa's 2026 custom rate adjusted to $5.61 farm diesel, a new $140,544, 47.5-foot anhydrous bar pays for itself only above about 1,500 acres a year, and only if the tractor's ownership cost is treated as already paid. Charge the tractor to the pass and owning never beats hiring in Iowa. At Kansas's $21.51 and Nebraska's $19.69 averages, the line falls to 900 to 1,030 acres. Renting a bar at Iowa's $9.50 average beats owning one below about 2,200 acres. Diesel moved the break-even by 37 acres. How the tractor is counted moves it by thousands.
Iowa's 2026 custom rate survey puts the average charge to inject anhydrous ammonia with the operator's own toolbar at $15.55 an acre, materials excluded. The median is $15.00 and the range $7 to $28 across 79 responses (Iowa State University, AgDM A3-10, Mar 2026). That rate assumed $2.89 diesel. Illinois farm diesel averaged $5.61 in the week ending September 18 (USDA AMS, Sep 18, 2026). Custom operators going into fall anhydrous will want the difference back. A farm that owns an aging bar, or has been quoted a new one, is choosing among three options: hire the whole pass, rent a bar and pull it with its own tractor, or own the bar. This piece works through all three at current prices. The result turns less on diesel than on one accounting choice most farms never write down: whether the tractor pulling the bar costs anything.
1. What the 2026 surveys charge, and what they assumed diesel cost
What's new: All three large Corn Belt custom surveys published this year were priced in late winter. Iowa's 2026 survey drew 205 respondents and assumed $2.89 diesel as of February 2026 (Iowa State University, AgDM A3-10, Mar 2026; Agweek, Apr 2, 2026). Nebraska's 108 respondents expected farm-delivered diesel to average $2.93 in 2026. UNL says the rates reflect "late winter 2025 and early 2026" conditions (University of Nebraska–Lincoln, 2026). Kansas surveyed custom work for 2025–2026 (Kansas Department of Agriculture and K-State LUSO, 2026).
Evidence: Each survey defines the service slightly differently. Iowa separates injection with and without the operator's toolbar. It also reports a rental rate for the bar alone. Nebraska separates a conventional knife from a knife with coulters. Kansas publishes one statewide number and a district breakdown.
| Survey (2026) | Service | Average $/acre | Median or most common | Range | Responses |
|---|---|---|---|---|---|
| Iowa | Injecting, operator supplies toolbar | 15.55 | 15.00 | 7.00–28.00 | 79 |
| Iowa | Injecting, operator does not supply toolbar | 13.45 | 13.00 | 8.00–20.00 | 42 |
| Iowa | Side-dressing anhydrous | 13.55 | 12.00 | 8.00–18.00 | 15 |
| Iowa | Anhydrous applicator rental, no tractor, fuel or labor | 9.50 | 11.00 | 3.00–15.00 | 8 |
| Nebraska | Knife with coulters, incl. power, labor, applicator | 19.69 | 20 | 10–25 | 16 |
| Nebraska | Conventional knife, incl. power, labor, applicator | 24.33 | — | 18–35 | 3 |
| Kansas | Custom anhydrous application, statewide | 21.51 | — | 6.50–32.00 | 82 |
| Kansas | Northeast district | 25.14 | — | 18.00–32.00 | 22 |
Source: Iowa State University Extension, AgDM A3-10, 2026 Iowa Farm Custom Rate Survey, Mar 2026; University of Nebraska–Lincoln, Nebraska Agricultural Custom Rates 2026; Kansas Department of Agriculture and Kansas State University LUSO, Kansas Custom Rates 2026. Materials excluded in all rows. Nebraska's conventional-knife row and Iowa's rental row rest on few responses and should be read as indicative.
Kansas publishes the longest history. Its statewide anhydrous average went from $6.75 in 2006 to $21.33 in 2024. It then rose only 18 cents to $21.51 in 2026. Most of that 2026 survey was taken before diesel's spring run.
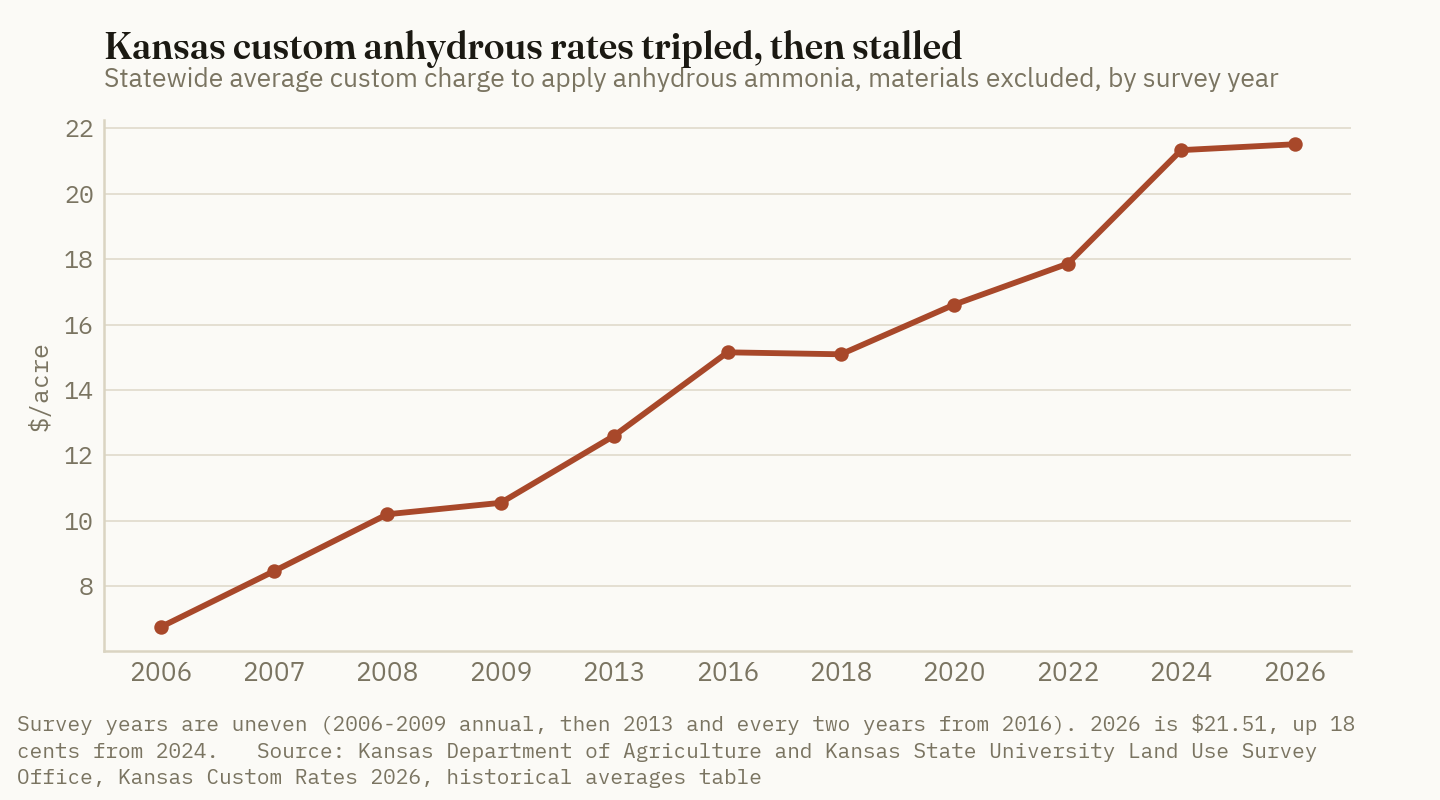
What diesel has done since is not in any of these numbers. Midwest on-highway diesel averaged about $3.68 in February. It ran up through May, eased in early summer, and hit a record $6.68 in the week of September 21 (EIA, Sep 22, 2026). Farm diesel carries no road tax and sits lower in level, but it has made the same move. The Illinois farm quote is $5.61 against the surveys' $2.89 to $2.93.
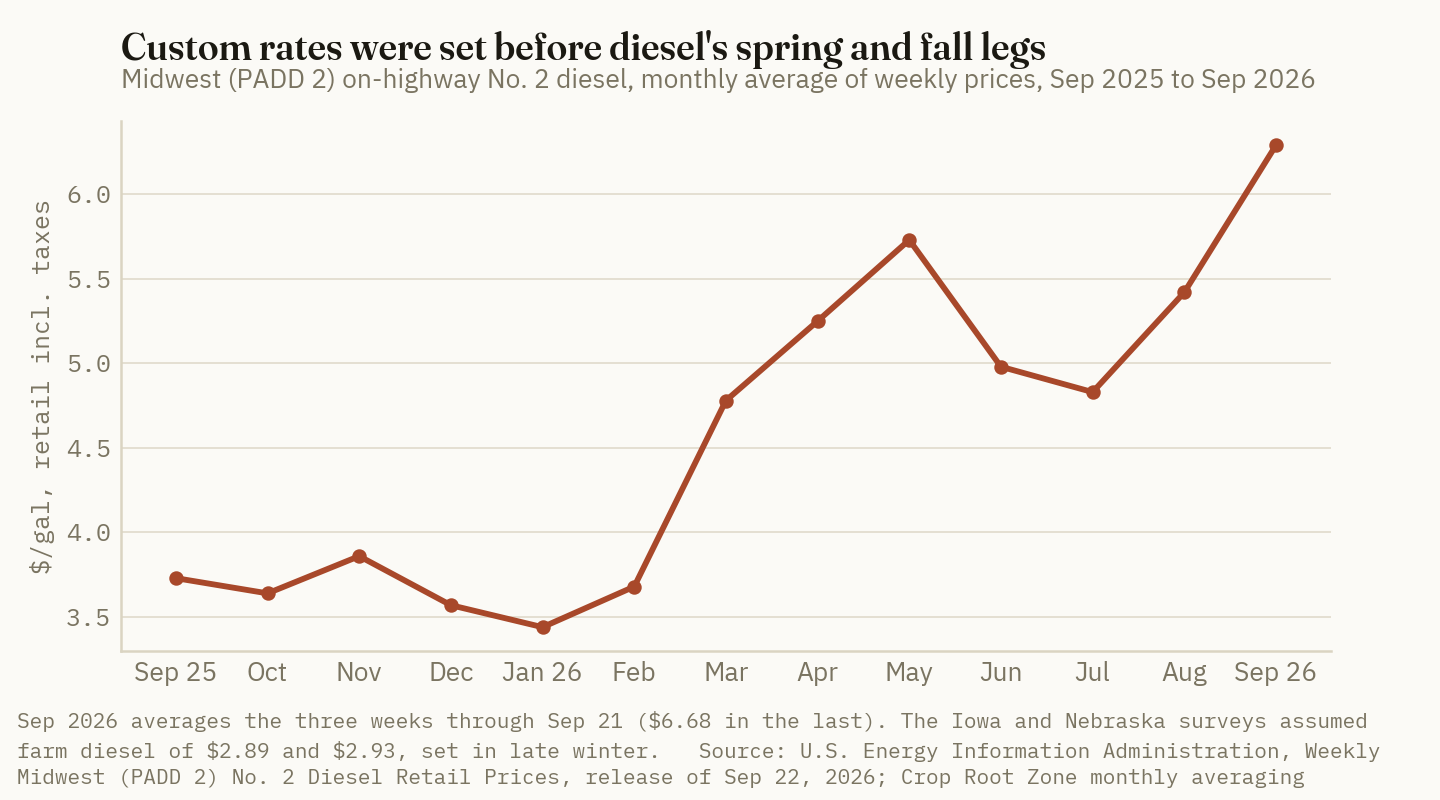
Iowa State's fuel table puts anhydrous application at 30-inch spacing at 0.55 gallons an acre (Iowa State University, AgDM A3-27, Feb 2026). At Iowa's basis, $2.72 more per gallon is $1.50 more per acre. An operator who passes fuel through at cost moves Iowa's $15.55 to about $17.05, Nebraska's $19.69 to about $21.16, and Kansas's $21.51 to about $23.01. Kansas does not publish its diesel assumption, so its adjustment uses Iowa's $2.89 basis and is an estimate. At the $907.50 a ton Illinois distributors were asking for anhydrous on September 18 (FOB, range $820–$1,050), the adjusted Iowa pass equals about 31 pounds of N before any nitrogen goes in the ground (USDA AMS, Sep 18, 2026).
Ground Truth: A custom applicator's fall invoice may include a separate fuel surcharge on top of the survey rate. At 0.55 gallons an acre, a surcharge near $1.50 is pure pass-through. A surcharge of $3 or $4 is a rate increase and should be negotiated as one.
2. What a new bar costs to own
What's new: University of Illinois's 2025 machinery cost estimates list four anhydrous applicator sizes. The prices run from $112,581 for a 27.5-foot bar to $169,267 for a 62.5-foot bar. farmdoc prices each one on the tractor it needs and the acres it would cover on a typical farm (Lattz and Schnitkey, farmdoc, Aug 2025).
Evidence: farmdoc's full cost per acre includes tractor and implement overhead, fuel at $3.00 and labor at $22 an hour. On that basis, every size costs more to run than Iowa's average custom charge. The cheapest is $19.30 an acre for the 62.5-foot bar. farmdoc adds that a custom operator would normally charge 5 to 15% above cost.
| Bar width | Tractor HP | List price | Acres/hr | Acres/yr (farmdoc) | Full cost $/acre | Of which: bar overhead |
|---|---|---|---|---|---|---|
| 27 ft 6 in | 175 | $112,581 | 13.3 | 933 | 27.20 | 16.00 |
| 37 ft 6 in | 240 | $141,263 | 18.2 | 1,273 | 25.30 | 14.70 |
| 47 ft 6 in | 285 | $140,544 | 23.0 | 1,612 | 22.10 | 11.50 |
| 62 ft 6 in | 490 | $169,267 | 30.3 | 2,121 | 19.30 | 10.60 |
Source: D. Lattz and G. Schnitkey, University of Illinois farmdoc, "Machinery Cost Estimates: Field Operations," Aug 2025, Appendix Table 1. Assumes purchase at 85% of list, 10-year ownership, 5.5% interest, $3.00 diesel, $22/hr labor. Full cost includes tractor overhead, bar overhead, fuel and lube, and labor.
The farmdoc figures show that Iowa's custom market is not priced at the full cost of new iron. To find where ownership does pay, the fixed and variable parts have to be separated. We rebuilt the 47.5-foot bar with Iowa State's ASABE-based method (Iowa State University, AgDM A3-29, Mar 2026), using farmdoc's price and ownership assumptions:
- Purchase price: $119,462, which is 85% of the $140,544 list (farmdoc).
- Salvage after 10 years: 30% of list, or $42,163. This is ISU Table 1b's "other tillage" category. ASABE has no category for anhydrous bars, so this is our choice of proxy.
- Capital recovery: at 5.5% over 10 years, $12,574 a year.
- Insurance and housing: 1% of average value, $808 a year.
- Fixed cost: about $13,400 a year, regardless of acres covered.
- Repairs: 1,612 acres a year at 23 acres an hour is about 700 hours over ten years. The closest ASABE row, "fertilizer spreader," puts accumulated repairs at about 40% of list by then. That is about $3.49 an acre. The repair figure is a proxy estimate, and it is the least certain input in this model.
As a check, the rebuild gives bar overhead of $11.79 an acre at 1,612 acres. farmdoc's is $11.50.
The other variable costs are fuel and lube at $5.61 diesel ($3.55 an acre, using ISU's 15% lube factor) and labor at farmdoc's $1.10 an acre. The tractor is the line that decides the answer. farmdoc charges a 285-horsepower tractor at $7.70 an acre of overhead for this bar.
3. Own versus hire: the tractor decides it, not the diesel
What's new: Treat the tractor two ways and the break-evens are thousands of acres apart. In the full-cost view, the tractor's depreciation and interest are charged to the pass. That fits a farm that would otherwise sell a tractor or skip buying one. In the sunk-tractor view, a tractor already on the farm would sit idle in November anyway, so only fuel, labor and bar repairs are marginal. On current diesel that is $15.84 an acre in the full-cost view and $8.14 in the sunk view, before the bar's $13,400 of fixed cost.
Evidence: Break-even acres equal the bar's fixed cost divided by the gap between the custom rate and the owner's variable cost. Custom rates here are adjusted to $5.61 diesel as in Section 1.
| Custom benchmark (diesel-adjusted) | $/acre | Break-even, sunk tractor | Break-even, full-cost tractor |
|---|---|---|---|
| Iowa, with toolbar | 17.05 | 1,502 acres | 11,058 acres |
| Nebraska, knife with coulters | 21.16 | 1,027 acres | 2,512 acres |
| Kansas, statewide | 23.01* | 900 acres | 1,866 acres |
Source: Crop Root Zone calculation from Iowa State University (AgDM A3-10, A3-27, A3-29, 2026), University of Nebraska–Lincoln (2026), Kansas Department of Agriculture and K-State LUSO (2026), farmdoc (Aug 2025), and USDA AMS Illinois farm diesel of $5.61 (Sep 18, 2026). New 47.5-ft bar at $140,544 list. *Kansas diesel basis not published; Iowa's $2.89 assumed.
The same comparison as cost per acre. Compare each row with Iowa's diesel-adjusted custom rate of $17.05:
| Acres a year on the bar | Own, sunk tractor $/acre | Own, full-cost tractor $/acre | Sunk-tractor cost, scaled |
|---|---|---|---|
| 400 | 41.59 | 49.29 | ██████████ |
| 800 | 24.86 | 32.56 | ██████░░░░ |
| 1,200 | 19.29 | 26.99 | █████░░░░░ |
| 1,612 | 16.44 | 24.14 | ████░░░░░░ |
| 2,000 | 14.83 | 22.53 | ████░░░░░░ |
| 2,500 | 13.49 | 21.19 | ███░░░░░░░ |
Source: Crop Root Zone calculation, inputs as above. Bars scale the sunk-tractor column, with 400 acres = 10 blocks. Repair cost is held at $3.49/acre across acreages, which slightly overstates it at low use and understates it at high use.
In the full-cost view, a new bar does not beat Iowa custom hire at any acreage one bar can cover. 11,058 acres is about seven seasons of farmdoc's 1,612-acre design load. In Nebraska and Kansas it needs 1,870 to 2,510 acres. In the sunk-tractor view, the Iowa line is about 1,500 acres, which is close to what farmdoc sizes this bar for. At Kansas's higher custom rates, the line is about 900 acres.
Diesel barely matters here. At the survey's $2.89 diesel the sunk-tractor break-even against Iowa hire was 1,465 acres. At $5.61 it is 1,502. The owner burns the same fuel the custom operator passes through, so a fuel spike moves both sides together. Only the 15% lube factor is left over, and that is worth 37 acres.
37 acres
How far this year's diesel spike moved the own-versus-hire break-even for a new anhydrous bar in Iowa. Counting or not counting the tractor moves it by about 9,500. (Crop Root Zone calculation, Sep 25, 2026)
4. The middle option: renting the bar
What's new: Iowa is the only one of the three surveys that reports enough responses to publish a rental rate for an anhydrous applicator alone. It averages $9.50 an acre, with a median of $11.00 and a range of $3 to $15. That rests on only eight responses (Iowa State University, AgDM A3-10, Mar 2026). Kansas received reports on anhydrous applicator rental but had too few to summarize (Kansas Department of Agriculture and K-State LUSO, 2026).
Evidence: A farm that rents pays the rental and supplies its own tractor, fuel and labor. That is the same tractor question as owning. So the own-versus-rent comparison does not depend on how the tractor is counted. Owning beats renting once the bar's fixed cost is spread thinly enough that fixed cost plus repairs falls below the rental rate:
| Rental rate paid | $/acre | Owning a new 47.5-ft bar beats renting above |
|---|---|---|
| Iowa survey low | 3.00 | Never (rental is below the repair estimate alone) |
| Iowa survey average | 9.50 | 2,226 acres |
| Iowa survey median | 11.00 | 1,781 acres |
| Iowa survey high | 15.00 | 1,162 acres |
Source: Crop Root Zone calculation from Iowa State University AgDM A3-10 (Mar 2026) rental rates and the ownership inputs in Section 2.
At the average rental rate, a renting farm with a tractor already on hand spends about $14.15 an acre on rental, fuel and labor. That is below the $17.05 custom rate. It is also below the cost of owning a new bar until use passes about 2,200 acres. The $3 low end of the rental range is below our repair estimate for a new bar. That fits a bar that is paid off, or one priced low alongside product sales, but the survey does not say which, and we have not verified retailer terms.
Iowa's custom market shows the same pattern from another angle. The survey's two injection rows differ by $2.10 an acre: $15.55 when the operator brings the toolbar, $13.45 when it does not. That $2.10 is what the market charges for the bar's share of the pass. It is below our $3.49 repair estimate for a new bar, and far below the $8.30 of fixed cost a new bar carries per acre at its design load.
Ground Truth: Iowa custom operators charge only $2.10 an acre for supplying the toolbar, less than our estimate of a new bar's repairs alone. The custom and rental markets are pricing paid-off equipment, and a farm buying a new bar is competing with it. The practical ceiling on what to pay for a bar is set by acres. To match Iowa custom hire at 1,000 acres a year with a tractor already on the farm, a bar has to cost about 57% of new list, near $79,500 for the 47.5-foot class. At 800 acres, the figure is about 45%. Above those prices, rent or hire. Below them, owning can pay at 800 to 1,000 acres, but a new bar bought at farmdoc's assumed 85% of list never gets that low.
5. What would change the answer
Timeliness. None of these tables values applying when the soil is ready rather than when the custom operator's rig arrives. Our earlier coverage (TRZ-0183, TRZ-0188) found the fall anhydrous window is set by soil temperature and nurse-tank turns, not by bar width. That argues for timing control. It does not argue for more width. A farm that has lost fall N to a late custom queue can reasonably pay something above the break-evens here. How much is a question of agronomy and risk, not machinery cost, and we have no survey that prices it.
Rates catching up. If custom operators move toward farmdoc's full cost, the break-even falls. farmdoc's $22.10 at $3 diesel, plus its 5 to 15% custom margin, is $23 to $25 an acre. Kansas's northeast district is already at $25.14. At $23.01 in Iowa, the sunk-tractor break-even for a new bar would drop from about 1,500 acres to about 900. We see little sign of that in the 2026 data. Kansas's statewide average rose 18 cents in two years.
Interest and salvage. At Iowa State's 4% real rate (its worked example) in place of farmdoc's 5.5% nominal, capital recovery falls about 10%, and each break-even falls roughly in proportion. A strong used market lifts salvage and cuts fixed cost further. Tariffs on new equipment push the other way through list price. Every $10,000 of list price adds about 110 acres to the Iowa sunk-tractor break-even.
What to check before signing. Ask for the custom quote with the fuel surcharge shown separately, and compare it with $1.50 an acre. Ask the retailer for a per-acre bar rental rate in writing, and ask whether it depends on buying product. Before pricing a new bar, write down whether the tractor would otherwise be sold. That one line decides whether a bar needs 1,500 acres a year or can never pay against Iowa custom hire.
References
- Iowa State University Extension and Outreach, Ag Decision Maker File A3-10, "2026 Iowa Farm Custom Rate Survey" (FM 1698), revised March 2026 — https://www.extension.iastate.edu/agdm/crops/pdf/a3-10.pdf
- Kent Thiesse, "Farm custom rates expected to increase for 2026," Agweek, Apr 2, 2026 — https://www.agweek.com/opinion/farm-custom-rates-expected-to-increase-for-2026
- University of Nebraska–Lincoln, Center for Agricultural Profitability, "Nebraska Agricultural Custom Rates 2026" (report), 2026 — https://cap.unl.edu/sites/unl.edu.ianr.agecon.center-for-ag-profitability/files/media/file/2026-nebraska-custom-rates-report_ada.pdf
- Kansas Department of Agriculture and Kansas State University Land Use Survey Office, "Kansas Custom Rates 2026," accessed Sep 25, 2026 — https://www.agmanager.info/sites/default/files/pdf/CustomRates_2026.pdf
- Dale Lattz and Gary Schnitkey, University of Illinois farmdoc, "Machinery Cost Estimates: Field Operations," August 2025 — https://farmdoc.illinois.edu/assets/management/machinery-costs/field_operations_2025.pdf
- Iowa State University Extension and Outreach, Ag Decision Maker File A3-29, "Estimating Farm Machinery Costs" (PM 710), revised March 2026 — https://www.extension.iastate.edu/agdm/crops/pdf/a3-29.pdf
- Iowa State University Extension and Outreach, Ag Decision Maker File A3-27, "Fuel Required for Field Operations," revised February 2026 — https://www.extension.iastate.edu/agdm/crops/pdf/a3-27.pdf
- U.S. Energy Information Administration, Weekly Midwest (PADD 2) No. 2 Diesel Retail Prices, release of Sep 22, 2026 (latest week Sep 21, 2026) — https://www.eia.gov/dnav/pet/hist/LeafHandler.ashx?n=PET&s=EMD_EPD2D_PTE_R20_DPG&f=W
- USDA Agricultural Marketing Service, Illinois Production Cost Report (Bi-weekly), report 3195, week ending Sep 18, 2026 — https://www.ams.usda.gov/mnreports/ams_3195.pdf
Disclosures
Crop Root Zone is an independent publication. Nothing here is investment advice. Market calls, where included, reflect the editors' own read and are not a recommendation to buy or sell any security.
Midwest Diesel Is at a Record $6.68. The Futures Curve Prices April 83 Cents Lower. Contract the Spring Gallons; Don't Fill the Tank for Them.
Midwest on-highway diesel hit $6.68 a gallon in the week of September 21, 52% above its trailing-year average, and Illinois farm diesel was $5.61 on September 18. The diesel futures curve is steeply backwardated, with April 83 cents under October, so filling a tank now to hold for spring costs about a dollar a gallon more than contracting April delivery. EIA history puts the normal January-to-November swing at about 8%, which does not pay for a 2,000-gallon tank package on its own. A 2,500-gallon aggregate keeps a farm out of federal SPCC planning. Contracted spring gallons lose money only if prices fall further than the curve already assumes, which happened in two of six past diesel spikes.
Midwest on-highway diesel averaged $6.68 a gallon in the week of September 21, 2026. That is up 43 cents in a week and $2.95 from a year earlier (EIA, Sep 22, 2026). It beats the previous weekly high for the region, $5.78 in June 2022, by 90 cents. Farm diesel, which carries no road tax, followed it up. USDA's Illinois production cost report quoted No. 2 farm diesel at a $5.61 average distributor ask for the week ending September 18, up 17 cents in two weeks (USDA AMS, Sep 18, 2026). That quote predates the latest 43-cent weekly jump. Growers with bulk tanks are making two decisions this month: whether to fill now and whether to lock in winter and spring fuel before prices climb further. This piece is about those two decisions: how much storage is worth, and when to buy. It does not cover how much fuel a field pass burns (TRZ-0190) or what a haul costs (TRZ-0224). The short answer is that the futures market is doing something that makes the usual advice to fill up before prices rise expensive this year.
1. The record is in the spot price, and the futures curve is pricing a decline
What's new: On the morning of September 24, NYMEX NY Harbor ultra-low sulfur diesel futures for October delivery traded at $4.8541 a gallon. April 2027 traded at $4.0230, and June 2027 at $3.7619 (CME NYMEX ULSD quotes via Farmbucks, Sep 24, 2026, 08:14 CT, delayed). That is a backwardated market, with each later month cheaper than the one before. The curve prices April 83 cents under October and June $1.09 under it.
Evidence: EIA's September Short-Term Energy Outlook forecast the same shape. It has U.S. retail on-highway diesel averaging $5.55 in the fourth quarter of 2026, then $4.93 in the first quarter of 2027, $4.50 in the second and $4.02 by the fourth (EIA STEO, Sep 9, 2026). EIA explains the near-term peak as low distillate inventories, which it expects to fall below 100 million barrels in September and to stay below the 2021–2025 range through most of 2027. It also cites diesel crack spreads above $2 a gallon through November as fall refinery maintenance meets harvest demand. EIA expects the decline once tanker traffic through the Strait of Hormuz returns to normal. It notes that if Middle East flows stay constrained beyond the end of 2026, distillate margins would stay higher than forecast. EIA finalized that forecast on September 3, before the last three weeks of Midwest increases.
| Price point | $/gal | Basis | Date |
|---|---|---|---|
| Midwest on-highway diesel, weekly | 6.68 | Retail, incl. taxes, PADD 2 | Week of Sep 21, 2026 |
| Midwest on-highway, trailing 12-month average | 4.41 | Retail, incl. taxes, PADD 2, Sep 2025–Aug 2026 | Crop Root Zone calc. |
| Illinois No. 2 farm diesel | 5.61 | Distributor ask, F.O.B., range 5.34–5.83 | Week ending Sep 18, 2026 |
| Farm diesel, national (AFBF citing USDA) | 5.45 | Farm price, up from 3.02 a year earlier | Sep 4, 2026 |
| ULSD futures, Oct 2026 | 4.85 | Wholesale, NY Harbor | Sep 24, 2026 |
| ULSD futures, Apr 2027 | 4.02 | Wholesale, NY Harbor | Sep 24, 2026 |
| EIA forecast, Q2 2027 | 4.50 | U.S. retail on-highway, incl. taxes | STEO, Sep 9, 2026 |
| SD grower's lock-in figures, rest of 2026 | 5.00–5.40 | As reported by the grower | Sep 23, 2026 |
Sources: EIA weekly and monthly PADD 2 diesel series, Sep 22, 2026; USDA AMS Illinois Production Cost Report, Sep 18, 2026; American Farm Bureau Federation Market Intel, Sep 17, 2026; CME NYMEX ULSD via Farmbucks, Sep 24, 2026; EIA STEO, Sep 9, 2026; Brownfield Ag News, Sep 23, 2026. Retail on-highway prices include road taxes that dyed farm diesel does not carry, so compare changes across rows, not levels.
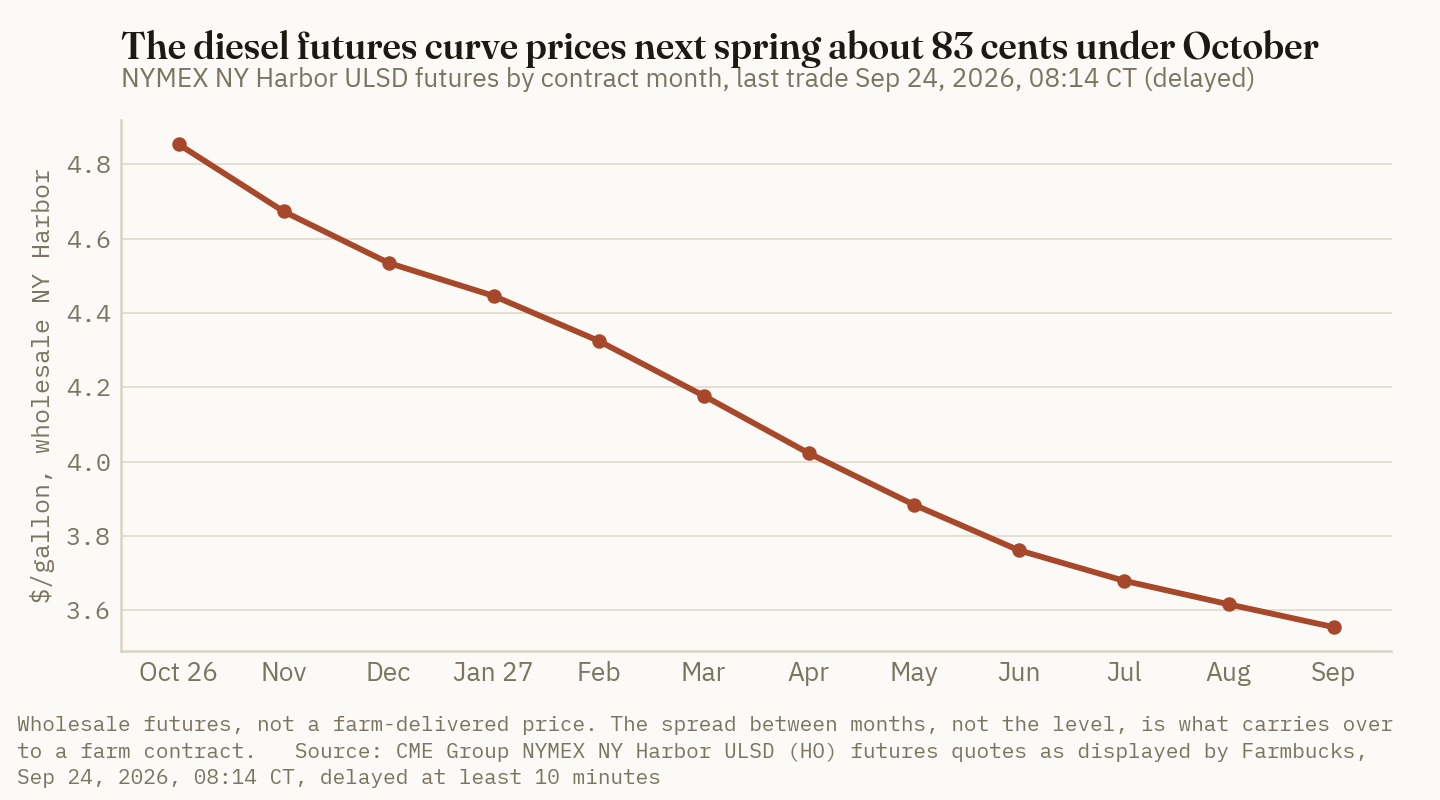
Growers are hearing the same shape from their suppliers. A Tripp County, South Dakota producer who uses about 90,000 gallons a year told Brownfield he was weighing a co-op lock on the rest of 2026 at about $5.00 to $5.40. He described March through October 2027 as "roughly $4 plus" (Brownfield Ag News, Sep 23, 2026). Those quotes fall about a dollar apart, which matches the futures spread.
Ground Truth: In a normal market, a full tank bought before a rise is cheap inventory. In a market backwardated by 83 cents over six months, a tank filled today for April use is the most expensive way to own April diesel. The market is offering spring fuel at a large discount to today's price, and a grower can take that discount with a contract instead of a tank. The record applies to fuel delivered this fall. It does not apply to fuel delivered next spring.
2. What 32 years of EIA prices say about seasonal buying
What's new: EIA's Midwest diesel series runs back to 1994. It shows a consistent seasonal pattern that is modest in size. Across 2005–2025, the median January price was 4.6% below that year's average, and the median November price was 3.8% above it (Crop Root Zone calculation from EIA monthly PADD 2 series, Sep 22, 2026). January came in below the annual average in 16 of those 21 years. September through November is the seasonal high, which EIA attributes to heating-oil demand competing for the same distillate barrels, with farm demand adding to it in some regions (EIA, "Factors affecting diesel prices").
Evidence: A tank filled at the late-winter low rather than at the fall high saves about 7.5% of a year's average price in a typical year. At EIA's forecast 2027 on-highway average of $4.40, that is about 33 cents a gallon (Crop Root Zone estimate). On a 2,000-gallon tank filled once a year at the seasonal low, that comes to about $660.
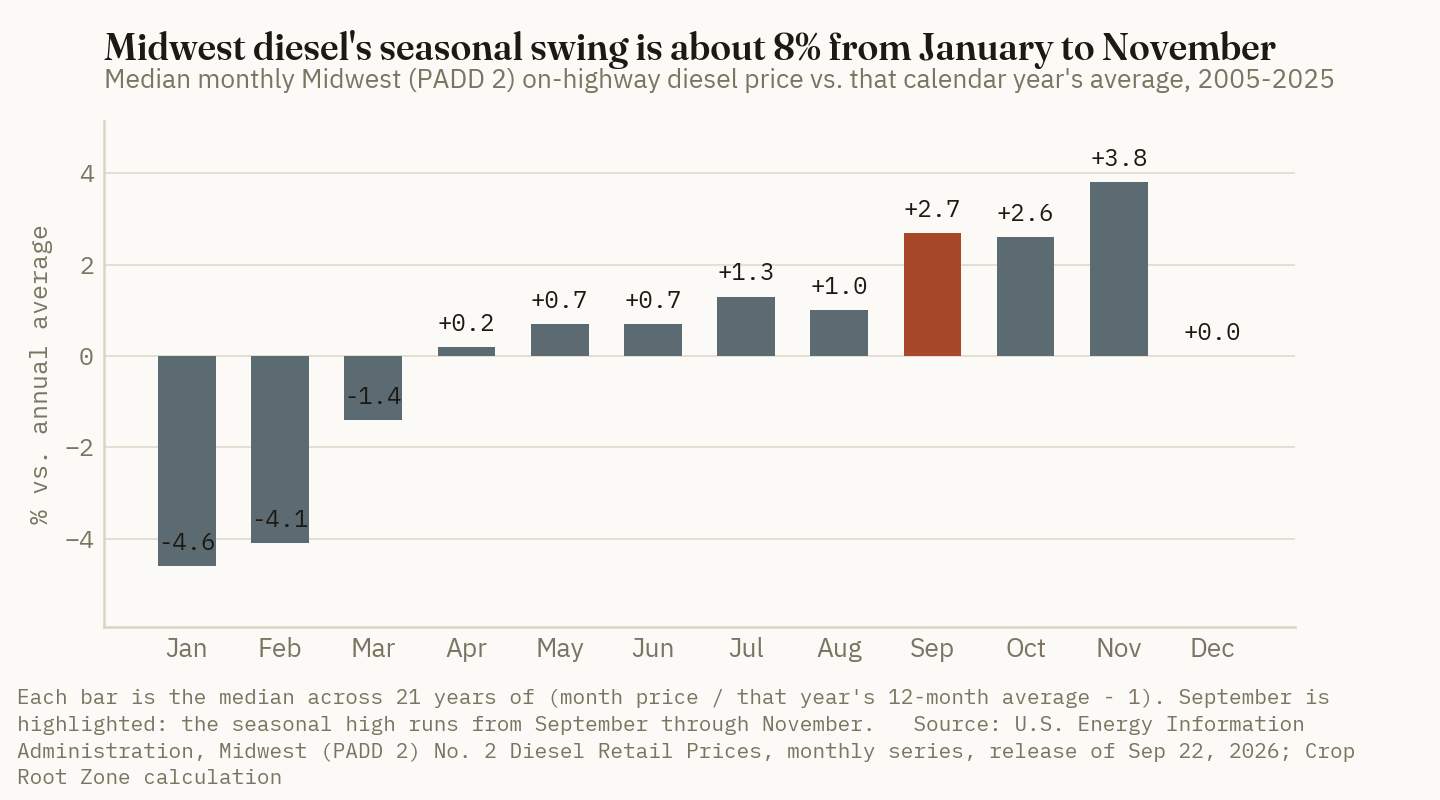
The seasonal pattern is also small compared with the moves that set real outcomes. Midwest diesel rose $1.10 from February to March 2026 in monthly averages, and it rose $1.11 in the three weeks to September 21. Either move is larger than 20 years of median seasonal swing. The fall-versus-spring comparison is close to a coin toss. From 1995 to 2025, the March-to-May average came in above the preceding September in 17 of 31 years. The median difference was a 1-cent increase, and outcomes ranged from $1.86 lower (2008–09) to $1.76 higher (2021–22) (Crop Root Zone calculation, EIA monthly series).
The more useful comparison is with past spikes. The table lists each episode in which Midwest diesel ran at least 28% above its trailing 12-month average, taking the peak month of each. The week of September 21 is 52% above the $4.41 trailing average. No monthly average in the series has reached that. The highest was 48%, in May 2026, and before this year it was 47%, in June 2022.
| Spike month | Midwest diesel, $/gal | vs. trailing 12-mo avg | 3 months later | 6 months later | |
|---|---|---|---|---|---|
| Oct 2004 | 2.105 | +30% | −8.3% | +6.2% | █░░░░░░░░░ |
| Oct 2005 | 3.098 | +41% | −21.7% | −13.0% | ███░░░░░░░ |
| Jun 2008 | 4.604 | +38% | −13.5% | −47.2% | ██████████ |
| Apr 2011 | 4.025 | +28% | −3.6% | −6.7% | █░░░░░░░░░ |
| Mar 2021 | 3.118 | +30% | +3.6% | +5.7% | █░░░░░░░░░ |
| Jun 2022 | 5.662 | +47% | −11.3% | −18.6% | ████░░░░░░ |
| Week of Sep 21, 2026 | 6.680 | +52% | — | — |
Source: EIA, Midwest (PADD 2) No. 2 diesel retail prices, monthly and weekly series, release of Sep 22, 2026. Trailing average is the 12 monthly averages before the spike month; for Sep 2026 it is Sep 2025–Aug 2026. Crop Root Zone calculation. Bars scale the size of the 6-month move, up or down; 2008 = 10. The 2026 row compares one week with monthly history and is not strictly like for like.
Ground Truth: The seasonal pattern is real, but it is worth tens of cents in a year when a single month can move a dollar. A tank justified mainly as a way to buy at the winter low will usually disappoint. The spike record is the more important history. Six months after the six prior peaks, prices had fallen four times and risen twice, and both rises were about 6%. The futures curve is already pricing roughly a 17% fall from October to April. A contract at that level loses money only if the decline is deeper than 17%. Of the six prior spikes, that happened twice: in 2008 and, narrowly, in 2022.
3. What a tank costs and when federal spill planning starts
What's new: Double-walled UL 142 steel tanks, which retailers sell as providing secondary containment without a separate dike, currently list online at $4.20 to $10 per gallon of capacity at 1,000 to 2,000 gallons. A dispensing package with pump, meter and filter adds about $1,900 to $2,500 (retailer listings, accessed Sep 24, 2026).
Evidence:
| Tank (double-wall steel) | Capacity, gal | List price, $ | $/gal of capacity | |
|---|---|---|---|---|
| Midwest Industrial Tanks | 500 | 3,133 | 6.27 | ██████░░░░ |
| Midwest Industrial Tanks | 1,000 | 4,667 | 4.67 | █████░░░░░ |
| Midwest Industrial Tanks | 2,000 | 8,400 | 4.20 | ████░░░░░░ |
| Newberry UL 142 skid (Tank Retailer) | 1,000 | 5,969 | 5.97 | ██████░░░░ |
| PeeDee round horizontal | 1,018 | 6,423 | 6.31 | ██████░░░░ |
| Newberry (Proformance Supply) | 1,000 | 9,967 | 9.97 | ██████████ |
Sources: Tank Retailer product listings (Midwest Industrial Tanks double-wall fuel tank; Newberry UL 142 double-wall skid tank) and Proformance Supply double-wall steel tank listings, accessed Sep 24, 2026. List prices before freight, installation and tax. Dispensing hardware on the same retailer: 115V 20 GPM diesel pump package $1,949; 12V 20 GPM package $1,349; GPI M30 meter $419; filter kit $99.
Spreading that hardware over its life shows what a tank has to earn each year. The estimate below uses a 20-year life and the 5.25% FSA direct operating loan rate for September (USDA FSA, Sep 1, 2026). A commercial operating line would cost more.
| Package | Hardware, $ | Annual capital cost, $ | ¢/gal at 10,000 gal/yr | ¢/gal at 20,000 | ¢/gal at 40,000 |
|---|---|---|---|---|---|
| 1,000 gal + 12V pump, meter, filter | 6,534 | 535 | 5.4 | 2.7 | 1.3 |
| 2,000 gal + 115V pump, meter, filter | 10,867 | 891 | 8.9 | 4.5 | 2.2 |
Crop Root Zone estimates from the listings above; capital recovery at 5.25% over 20 years. Excludes pad, electrical, freight, installation, fire-code setbacks, fuel treatment and the time to write or amend a spill plan, all of which raise the figures.
At 20,000 gallons a year, a 2,000-gallon package has to earn about 4½ cents on every gallon that passes through it. The seasonal fill from Section 2 is worth about $660 a year on that tank, against $891 of capital cost, so it does not cover the tank by itself. The rest has to come from three places. The first is a lower delivered price for a full transport load instead of a tankwagon drop, which varies by supplier and should be requested in writing. The second is not running dry during harvest, when delivery can be slow. Cenex, a fuel supplier, sells bulk storage on that point, noting that delivery can take longer than normal (Cenex, Oct 13, 2022). The third is the option to skip a spike week. The tank's value is resilience and delivery size. It is not a way to speculate on price.
The regulations set a practical limit on tank size. Under the Water Resources Reform and Development Act of 2014, a farm with less than 2,500 gallons of aggregate aboveground oil storage does not need a federal Spill Prevention, Control, and Countermeasure (SPCC) plan (EPA, WRRDA fact sheet, Apr 24, 2015). The count includes every container of 55 gallons or more holding diesel, gasoline, hydraulic oil, lube oil or crop oil. Several containers are left out of the count: containers of 1,000 gallons or less on separate parcels, heating oil used at a single-family residence, pesticide application equipment and its mix containers, and completely buried tanks regulated under the underground storage tank rules.
| Aggregate aboveground oil storage | What federal SPCC requires of a farm |
|---|---|
| Under 2,500 gal | No plan |
| 2,500 to 6,000 gal, no reportable discharge history | No plan under the interim WRRDA exemption (see note) |
| 6,000 to under 20,000 gal, no tank over 10,000 gal, no reportable discharges | Self-certified plan |
| 20,000 gal or more, any tank over 10,000 gal, or a reportable discharge history | Plan certified by a licensed Professional Engineer |
Source: U.S. EPA, "SPCC Program: Farms and the Water Resources Reform and Development Act," Apr 24, 2015. Note: EPA's June 2015 farm study concluded the exemption should be set at 2,500 gallons rather than the interim 6,000 (EPA, WRRDA Farm Study, Jun 30, 2015). We found no final rule adopting that change, and EPA's older farm fact sheet, which still shows the pre-WRRDA 1,320-gallon threshold, is marked as out of date on EPA's site. A farm relying on the 2,500–6,000 gallon exemption should confirm its status with its EPA region.
Where a plan is required, bulk containers need secondary containment able to hold "the full capacity of the container plus possible rainfall" (EPA, SPCC Fact Sheet for Farms, page updated Mar 20, 2026). Double-walled tanks are the common way to meet this without building a dike. Many large farms are already in the plan regime. EPA's study cites USDA survey data showing that farms of more than 1,000 acres averaged almost 8,000 gallons of oil storage (EPA, WRRDA Farm Study, Jun 30, 2015). For those farms, a new tank means amending an existing plan, not starting one.
Ground Truth: For a farm below the line, 2,500 gallons is the real limit on storage size, and the math above shows why buying more tank to catch a record is poor value. A farm that already has a 1,000-gallon gasoline tank and a few drums of hydraulic oil has roughly 1,200 gallons of headroom, not 2,500. The most useful storage change this fall adds no planning burden: stage 1,000-gallon-or-smaller tanks at a separate farmstead or field site, which do not count toward the total, and use them to avoid running dry during harvest. Save larger storage for a year when the curve is in contango, meaning later months are priced above earlier ones. In that market, holding fuel earns a return rather than costing one.
4. The carrying cost of buying at a record, and which contract to use
What's new: Co-op fuel programs generally offer three types of contract. A fixed-price contract locks a price per gallon for a delivery period of up to 12 months. A maximum-price contract caps the price for a fee and keeps the benefit if prices fall. Some suppliers also take standing offers that trigger a contract when the market reaches a target (MFA Oil, fuel contracting page; United Cooperative, Feb 2023). Suppliers commonly note that volume changes after signing can carry penalties (Key Cooperative, Feb 2, 2026).
Evidence: The table compares four ways to supply 20,000 gallons of April 2027 diesel, all measured against a pay-on-delivery fixed contract signed today. We assume the farm contract carries the futures spread one-for-one. That is an assumption, not a quote, because a supplier's forward price includes its own margin and risk premium.
| Route to April diesel | Extra cost vs. booked April contract, ¢/gal | On 20,000 gal, $ | What it protects against |
|---|---|---|---|
| Fill the tank now at spot, hold to April | ~99* | ~19,800* | Supply only; locks in the record |
| Prepaid April contract (pay now) | ~16* | ~3,200* | Price rise; interest on cash |
| Booked April contract, pay on delivery | 0 | 0 | Price rise, no cash tied up |
| Maximum-price contract | Fee (not published) | — | Price rise; keeps a price fall |
| Buy April at spot | Unknown | — | Nothing; wins only if April falls more than the curve expects |
Crop Root Zone estimates. *Fill-now: the 83-cent Oct–Apr ULSD futures spread (CME via Farmbucks, Sep 24, 2026) plus interest on $5.61 farm diesel (USDA AMS, Sep 18, 2026) at 5.25% (USDA FSA, Sep 2026) for about 6½ months. Prepaid: the interest term alone. A commercial line at a higher rate raises both. Tank capacity limits the fill-now route to what the tank holds. Twenty thousand gallons is illustrative and would need several fills.
~$1.00 a gallon
Estimated extra cost of filling a tank at September's record to hold for April, compared with contracting April delivery at today's futures curve: 83 cents of backwardation plus about 16 cents of interest. (Crop Root Zone calculation from CME NYMEX ULSD via Farmbucks, Sep 24, 2026; USDA AMS, Sep 18, 2026; USDA FSA, Sep 2026)
The risk of a booked spring contract is that prices fall further than the curve already expects. The spike table gives a rough base rate. After four of the six prior peaks, prices six months later were within the range the current curve implies, or above it. After the 2008 peak they fell 47%, and after the 2022 peak 19%. A 2008-type collapse would leave April contract gallons about a dollar or more above spot. That is costly, but it is roughly the same size as the loss a grower takes today by filling a tank at spot instead of contracting. The upside risk is also real. The South Dakota grower expects a further $1 to $2 if U.S.–Iran tensions continue (Brownfield, Sep 23, 2026). EIA says distillate margins would run above its forecast if Middle East flows stay constrained into 2027 (EIA STEO, Sep 9, 2026).
There is also a fuel-quality cost to buying fall diesel now. No. 2 diesel starts to cloud at about 14°F. Suppliers advise blending No. 1 once overnight temperatures approach 30°F, and each 10% of No. 1 lowers the cloud point by about 3°F (Cenex, Nov 11, 2016). Summer-grade fuel stored into winter has to be blended or treated. Diesel also keeps for only six to 12 months in storage (Cenex, Oct 13, 2022), so a fill bought today for next June is at the limit of that range before it is used.
Ground Truth: The decision splits by season. Fall and early-winter gallons are priced at the top of the curve, and neither a tank nor a contract can get below it. Buy those as needed, keep tanks at working levels rather than full, and wait for the Monday EIA print before topping off. Spring and summer 2027 gallons are where locking a price makes sense. Contract a first tranche of about a third to half of planting-season needs now on a booked, pay-on-delivery basis, and add the rest in steps if the curve holds or if prices fall back toward the winter seasonal low. If the supplier offers a maximum-price contract at a reasonable fee, it is the only product that protects against both a 2008-type collapse and a further spike, and it is worth pricing. Do not prepay unless the supplier's prepay discount exceeds about 16 cents a gallon, which is the interest cost on cash tied up until April.
5. What to watch into winter
| Indicator | Latest | Why it matters |
|---|---|---|
| EIA Midwest on-highway diesel (weekly, Mondays) | $6.68, week of Sep 21 | Spot level; 52% above its trailing-year average |
| Oct 2026 – Apr 2027 ULSD futures spread | 83¢ backwardation (Sep 24) | If it narrows, holding physical fuel gets cheaper; if it widens, contracting spring gets more attractive |
| EIA STEO (next release early October) | Q2 2027 retail $4.50 | Forecast was finalized Sep 3, before the latest increase |
| U.S. distillate inventories | Forecast below 100 million barrels in September | EIA links low stocks to fall and winter price strength |
| USDA AMS Illinois farm diesel (bi-weekly) | $5.61 F.O.B. average, week ending Sep 18 | Farm-level price; the next print will show the Sep 21 jump |
| Your co-op's spring 2027 booked price | "Roughly $4 plus" reported in SD, Sep 23 | Compare with the futures spread to see the supplier's margin |
Sources: EIA, Sep 22, 2026; CME NYMEX ULSD via Farmbucks, Sep 24, 2026; EIA STEO, Sep 9, 2026; USDA AMS, Sep 18, 2026; Brownfield Ag News, Sep 23, 2026.
Limits. Futures are wholesale New York Harbor prices. A Midwest farm contract has its own basis and supplier margin and may not follow the curve's spread exactly. The seasonal index is a median, and individual years vary widely. Spike outcomes come from six episodes, too few to support probabilities. Tank prices are online list prices before freight and installation, and local dealers and used equipment may differ. The SPCC summary is federal only. State fire codes, setback rules and state spill programs can add requirements, and the status of the 2,500–6,000 gallon exemption should be confirmed with EPA.
References
- U.S. Energy Information Administration, Midwest (PADD 2) No. 2 Diesel Retail Prices, weekly series, released Sep 22, 2026 — https://www.eia.gov/dnav/pet/hist/LeafHandler.ashx?n=PET&s=EMD_EPD2D_PTE_R20_DPG&f=W
- U.S. Energy Information Administration, Midwest (PADD 2) No. 2 Diesel Retail Prices, monthly series 1994–2026, released Sep 22, 2026 — https://www.eia.gov/dnav/pet/hist/LeafHandler.ashx?n=PET&s=EMD_EPD2D_PTE_R20_DPG&f=M
- U.S. Energy Information Administration, Short-Term Energy Outlook, September 2026, released Sep 9, 2026 (inputs finalized Sep 3) — https://www.eia.gov/outlooks/steo/pdf/steo_full.pdf ; forecast comparison table — https://www.eia.gov/outlooks/steo/pdf/compare.pdf
- U.S. Energy Information Administration, "Diesel fuel explained: Factors affecting diesel prices" — https://www.eia.gov/energyexplained/diesel-fuel/factors-affecting-diesel-prices.php
- USDA Agricultural Marketing Service, Illinois Production Cost Report (Bi-weekly), report 3195, week ending Sep 18, 2026 — https://mymarketnews.ams.usda.gov/viewReport/3195
- Faith Parum, American Farm Bureau Federation Market Intel, "Diesel Prices Surge as Global Supplies Tighten," Sep 17, 2026 — https://www.fb.org/intel/markets/diesel-prices-surge-as-global-supplies-tighten
- Carah Hart, Brownfield Ag News, "South Dakota farmer considers locking in fuel as diesel costs rise," Sep 23, 2026 — https://www.brownfieldagnews.com/news/south-dakota-farmer-considers-locking-in-fuel-as-diesel-costs-rise/
- CME Group NYMEX NY Harbor ULSD (HO) futures quotes, Oct 2026 – Dec 2027 contracts, as displayed by Farmbucks, last trade Sep 24, 2026, 08:14 CT, delayed — https://farmbucks.com/futures/energy/ulsd
- U.S. EPA, "SPCC Program: Farms and the Water Resources Reform and Development Act (WRRDA)," fact sheet, Apr 24, 2015 — https://www.epa.gov/sites/default/files/2015-06/documents/final_wrrda_fact_sheet_4-24-15.pdf
- U.S. EPA, "Oil Storage on U.S. Farms: Risks and Opportunities for Oil Spill Prevention" (WRRDA Farm Study), Jun 30, 2015 — https://www.epa.gov/sites/default/files/2016-02/documents/wrrda_farm_study_2015-06-30.pdf
- U.S. EPA, "Spill Prevention, Control, and Countermeasure Fact Sheet for Farms," 2011 document, page updated Mar 20, 2026 — https://www.epa.gov/oil-spills-prevention-and-preparedness-regulations/spill-prevention-control-and-countermeasure-fact
- Tank Retailer, Midwest Industrial Tanks Double Wall Fuel Storage Tank and Newberry UL 142 Double Wall Skid Tank product listings, and fuel pump, meter and filter listings, accessed Sep 24, 2026 — https://tankretailer.com/collections/fuel-storage-tanks
- Proformance Supply, Double Wall Steel Tanks listings, accessed Sep 24, 2026 — https://proformancesupply.com/collections/double-wall-steel-tanks
- USDA Farm Service Agency, "USDA Announces September 2026 Lending Rates for Agricultural Producers," Sep 1, 2026 — https://www.fsa.usda.gov/news-events/news/09-01-2026/usda-announces-september-2026-lending-rates-agricultural-producers
- MFA Oil, "Fuel Contracting," accessed Sep 24, 2026 — https://www.mfaoil.com/fuels/fuel-contracting/
- United Cooperative, "Offer to Purchase Contract: Manage Your Fuel Price Risk," Feb 2023 — https://www.unitedcooperative.com/united-cooperative-blogs/february-2023/offer-to-purchase-contract-manage-your-fuel-price
- Key Cooperative, "Contracting Diesel Fuel vs. Buying Cash: Pros and Cons," Feb 2, 2026 — https://www.keycoop.com/news/key-cooperative-news/contracting-diesel-fuel-vs-buying-cash-pros-cons
- Cenex, "How to shrink your bills with bulk fuel storage," Oct 13, 2022 — https://www.cenex.com/expert-advice-and-insights/bulk-fuel-storage
- Cenex, "Avoid cold-weather diesel problems," Nov 11, 2016 — https://www.cenex.com/en/expert-advice-and-insights/cold-weather-diesel-problems
Disclosures
Crop Root Zone is an independent publication. Nothing here is investment advice. Market calls, where included, reflect the editors' own read and are not a recommendation to buy or sell any security.
Diesel Added 48 to 73 Cents to Every Loaded Mile of a Grain Haul in a Year. USDA's 100-Mile Truck Rate Added 4, and Midwest Diesel Is Another $1.34 Higher Since.
USDA's latest grain-truck survey priced a 100-mile haul at $4.84 a loaded mile, about 49 cents a bushel of corn, when Midwest diesel averaged $5.34. It is $6.68 this week. Repriced for fuel, that haul costs 53 to 55 cents, and Iowa's custom-rate survey, built on $2.89 diesel, is 10 to 15 cents light at 100 miles. Iowa's 90,000-pound harvest proclamation claws back about 8 cents but lapses October 10 with 4% of the state's corn harvested. At repriced rates, each extra loaded mile toward a better bid costs about half a cent a bushel, so a 20-cent basis gain pays for a little under 40 more miles.
Midwest on-highway diesel averaged $6.68 a gallon in the week of September 21, up 43 cents in one week and $2.95 from a year earlier (EIA, Sep 22, 2026). The most recent federal survey of what elevators pay to hire a grain truck predates almost all of that increase. USDA's Grain Truck and Ocean Rate Advisory for April through June put the national 100-mile rate at $4.84 per loaded mile, during a quarter when Midwest diesel averaged $5.34 (USDA AMS, GTOR Q2 2026, Jul 2026). The third-quarter survey will not be published until about December, after most of the harvest has moved. Iowa had 4% of its corn and 2% of its soybeans harvested on September 20 (USDA NASS, Sep 21, 2026), so the fall's truck bills will be set at this fuel price, not the one in the survey. This piece reprices the survey for current diesel. It then applies the result to two practical harvest questions: what Iowa's 90,000-pound weight allowance is worth before it lapses, and how far it pays to drive for a better bid.
1. The rate survey absorbed less than a tenth of the fuel increase
What's new: In the second quarter, national grain truck rates rose 0.8% from a year earlier at 100 miles and 3.4% at 25 miles. Midwest diesel rose 52% over the same period, from $3.51 to $5.34 a gallon (USDA AMS, GTOR Q2 2026, Jul 2026; GTOR Q2 2025, Jul 2025).
Evidence: The advisory surveys grain elevators through North Dakota State University's Upper Great Plains Transportation Institute. It reports rates per loaded mile for an 80,000-pound truck carrying 55,000 pounds of grain, which is about 982 bushels of corn or 917 of soybeans. Over five quarters the rates have moved around without following fuel. The 100-mile rate fell from $4.80 to $3.98 through the back half of 2025, while diesel was flat to slightly higher, and then recovered to $4.84 (USDA AMS, GTOR Q3 2025, Dec 2025; GTOR Q4 2025, Feb 2026; GTOR Q1 2026, May 2026).
| Trip length | Q2 2026, $/loaded mile | Change vs Q1 | Change vs Q2 2025 | $/load | ¢/bu corn | ¢/bu soybeans |
|---|---|---|---|---|---|---|
| 25 miles | 7.53 | +10.2% | +3.4% | 188 | 19.2 | 20.5 |
| 100 miles | 4.84 | +13.6% | +0.8% | 484 | 49.3 | 52.8 |
| 200 miles | 4.09 | +39.1% | +21.7% | 818 | 83.3 | 89.2 |
| North Central, 100 miles | 4.67 | +6.1% | +3.5% | 467 | 47.5 | 50.9 |
Source: USDA AMS, Grain Truck and Ocean Rate Advisory, Second Quarter 2026, published Jul 2026. National average; not every state reports. Per-load and per-bushel columns are Crop Root Zone calculations at the advisory's 55,000-lb payload (56 lb/bu corn, 60 lb/bu soybeans).
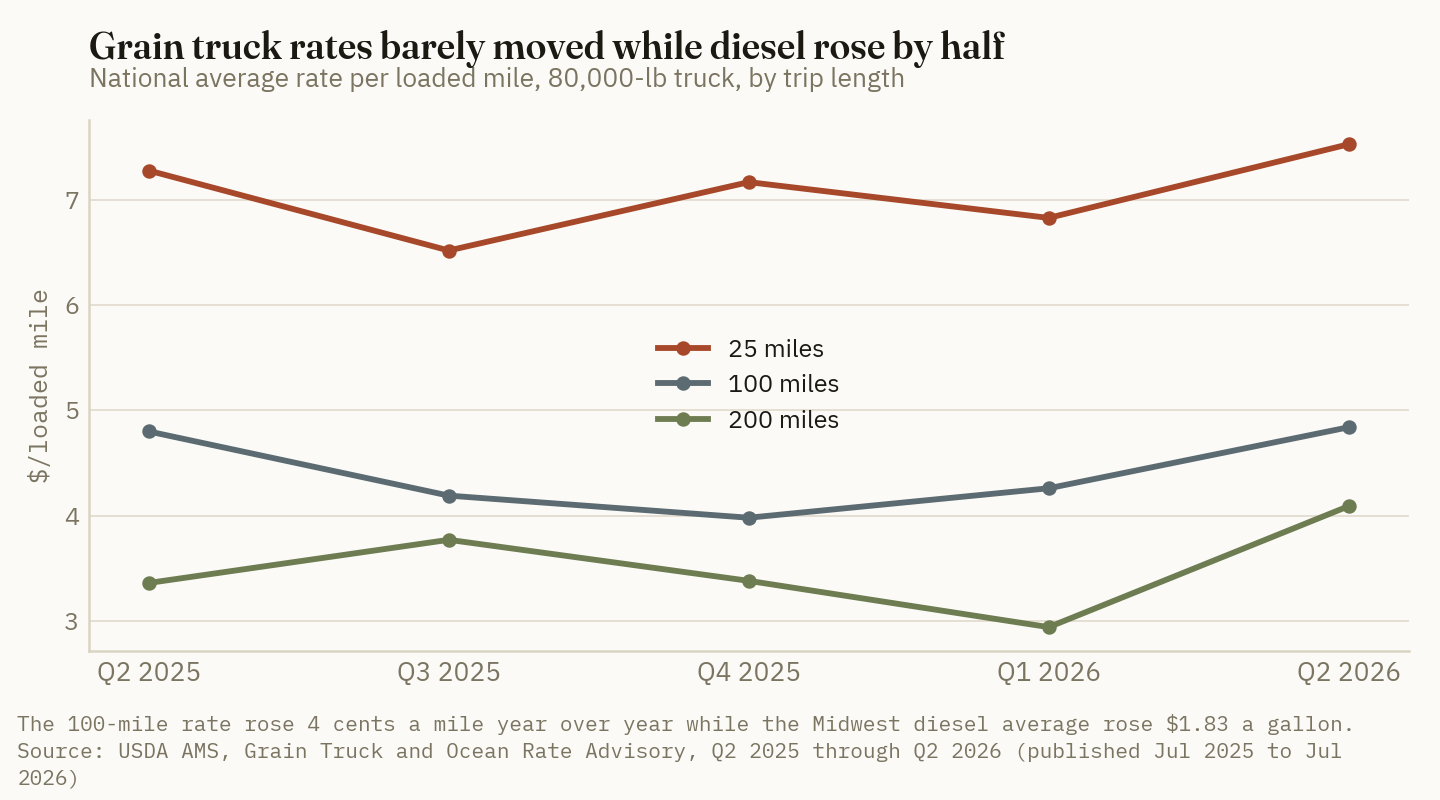
Converting diesel into a cost per loaded mile takes two assumptions. The first is fuel economy. Iowa State's grain-transportation worksheet assumes 5.0 miles per gallon for a farm semi (Iowa State University, Ag Decision Maker A3-41, Aug 2017). The American Transportation Research Institute put the industry's 2025 fuel cost at about 48 cents a mile, the difference between its $2.336 total and $1.854 non-fuel cost per mile (Transport Topics, Jul 17, 2026). Set against the 2025 U.S. average diesel price of $3.66 (EIA, annual on-highway diesel series), that implies about 7.6 miles per gallon for commercial fleets. The second assumption is that the truck returns empty, so each loaded mile burns fuel for two miles. That is typical of grain hauled from farm or elevator to a processor or terminal.
On those assumptions, the $1.83 year-over-year rise in Midwest diesel added between 48 cents (at 7.6 mpg) and 73 cents (at 5.0 mpg) to the fuel cost of every loaded mile. The 100-mile rate rose 4 cents. The 25-mile rate rose 25 cents. Only the 200-mile rate, up 73 cents, kept pace, and that series is the most volatile of the three: it fell 25% year over year in the first quarter before jumping 39% in the second.
Elevators also reported that trucks were getting harder to hire. The national availability index rose to 2.90 on the survey's 1-to-5 difficulty scale, from 2.50 in the first quarter and 2.80 a year earlier (USDA AMS, GTOR Q2 2026, Jul 2026). Hiring was getting harder while rates stayed close to year-earlier levels and fuel costs rose, which left haulers carrying the difference. That arrangement is unlikely to survive a harvest.
Ground Truth: A survey rate that absorbed less than a tenth of a year's fuel increase does not show that grain trucking is cheap. It shows that haulers absorbed a margin squeeze outside harvest, when they had little pricing power. The ATRI data point the same way: truckload carriers ran a 0.4% operating margin in 2025, before this year's diesel increase (Transport Topics, Jul 17, 2026). Expect fuel surcharges or rate resets at the scale house this fall, not a continuation of second-quarter rates. A farm budgeting harvest hauling from a spring rate sheet should add roughly 7% to 11% at 100 miles before the first load leaves, and far more if the budget used the custom-rate survey.
2. What $6.68 diesel does to the per-bushel haul
What's new: Midwest diesel averaged $5.44 across the first twelve weeks of the third quarter and closed the latest week at $6.68, which is $1.34 above the second-quarter average the survey reflects (EIA, Midwest on-highway diesel, weekly series, Sep 22, 2026).
Evidence: At an empty backhaul, $1.34 more per gallon adds 35 cents (7.6 mpg) to 54 cents (5.0 mpg) per loaded mile. Added to the second-quarter survey, that turns a 49-cent 100-mile corn haul into a 53-to-55-cent haul. Iowa's custom-rate survey needs a much larger adjustment. Its 2026 hauling rates are 13.5 cents a bushel for 5 miles, 20 cents for 25 miles and 40.5 cents for 100 miles, one way by truck, built on an assumed diesel price of $2.89 (Iowa State University, Ag Decision Maker A3-10, Mar 2026). Midwest diesel is now $3.79 above that assumption.
| Haul, one way | Survey basis | ¢/bu at survey diesel | Diesel in survey | Repriced at $6.68, 7.6 mpg | Repriced at $6.68, 5.0 mpg | Gap |
|---|---|---|---|---|---|---|
| 25 miles | USDA GTOR national, Q2 | 19.2 | $5.34 | 20.1* | 20.5* | +0.9 to +1.3 |
| 100 miles | USDA GTOR national, Q2 | 49.3 | $5.34 | 52.9* | 54.7* | +3.6 to +5.4 |
| 200 miles | USDA GTOR national, Q2 | 83.3 | $5.34 | 90.4* | 94.2* | +7.1 to +10.9 |
| 25 miles | Iowa custom survey, average | 20.0 | $2.89 | 22.5* | 23.9* | +2.5 to +3.9 |
| 100 miles | Iowa custom survey, average | 40.5 | $2.89 | 50.6* | 55.9* | +10.1 to +15.4 |
Sources: USDA AMS GTOR Q2 2026, Jul 2026; Iowa State University Ag Decision Maker A3-10, Mar 2026; EIA Midwest on-highway diesel, week of Sep 21, 2026. *Crop Root Zone estimates: survey rate plus the change in diesel times two miles per loaded mile (empty return), divided by 982 bushels of corn per load. The 7.6 mpg case is implied by ATRI's 2025 fuel cost per mile and EIA's 2025 average price; the 5.0 mpg case is Iowa State's A3-41 assumption.
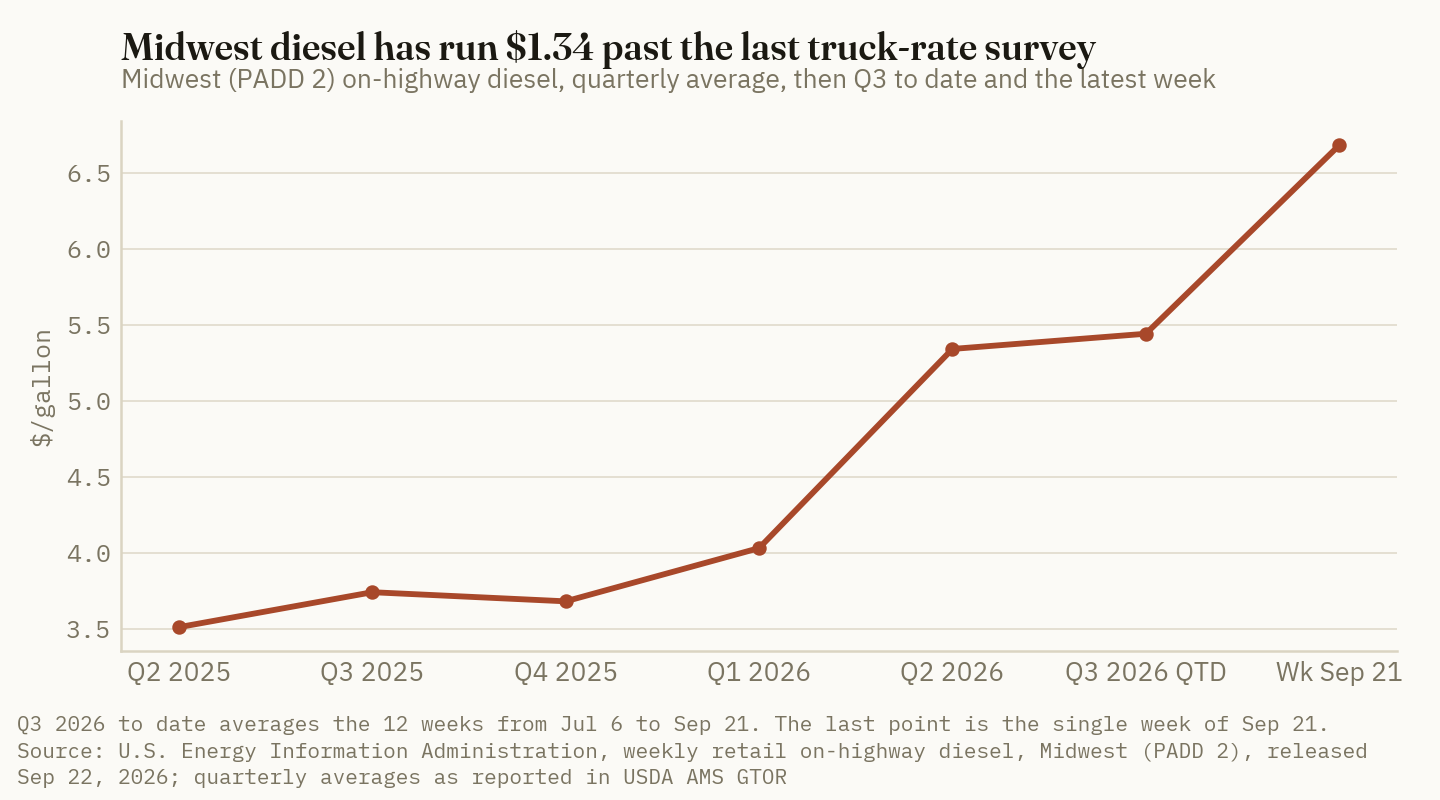
Two points stand out. First, the two surveys agreed closely at 25 miles and ended up far apart at 100 miles, because fuel is a smaller share of a short haul, where loading, unloading and waiting take up more of the truck's time. On a 100-mile haul, fuel is most of the variable cost. The Iowa survey's 40.5 cents was a reasonable rate when diesel cost $2.89 and is 10 to 15 cents short now. Second, the adjustment to the USDA rate is small in cents but large for a basis decision. Four or five cents a bushel is often the whole difference between two nearby bids.
53–55¢ a bushel
Estimated cost to truck corn 100 miles at this week's $6.68 Midwest diesel, against the 49.3¢ implied by USDA's second-quarter survey and the 40.5¢ in Iowa's 2026 custom-rate survey. (Crop Root Zone calculation from USDA AMS GTOR Q2 2026; EIA, Sep 22, 2026; ISU A3-10, Mar 2026)
3. The 90,000-pound window is worth about 8 cents, and it closes October 10
What's new: Iowa's governor signed a harvest proclamation on September 10 that lets trucks carrying corn, soybeans, hay, straw, silage, stover, fertilizer, manure and distillers grains run up to 90,000 pounds gross without a permit. It applies through October 10 on every Iowa highway except the interstates. Axles may be up to 12.5% over their normal limits but not above 20,000 pounds, and posted road and bridge limits still apply (Office of the Governor of Iowa, Sep 10, 2026).
Evidence: At the advisory's 25,000-pound tare, 10,000 more pounds of gross weight is 10,000 more pounds of grain. That is 1,161 bushels of corn per load instead of 982, or 18% more bushels for roughly the same miles and fuel. A hauler that bills per load or per loaded mile spreads the same trip over more bushels, and the per-bushel cost falls by about 15%.
| Haul, one way | 80,000 lb, ¢/bu corn | 90,000 lb, ¢/bu corn | Saving, ¢/bu | Saving on 200 bu/acre, $/acre | |
|---|---|---|---|---|---|
| 25 miles | 20.1–20.5* | 17.0–17.4* | 3.1 | 6.20 | ████░░░░░░ |
| 100 miles | 52.9–54.7* | 44.7–46.3* | 8.2–8.4 | 16.40–16.80 | █████████░ |
| 200 miles | 90.4–94.2* | 76.5–79.7* | 13.9–14.5 | 27.80–29.00 | ██████████ |
Sources: Office of the Governor of Iowa, Sep 10, 2026; USDA AMS GTOR Q2 2026, Jul 2026; EIA, Sep 22, 2026. *Crop Root Zone estimates at $6.68 diesel, 5.0–7.6 mpg, and a 25,000-lb tare, so a 55,000-lb payload at 80,000 lb and 65,000 lb at 90,000 lb. Bars scale the midpoint saving per bushel. On a standard five-axle semi, a 12.5% allowance over the 34,000-lb tandem limit may hold gross weight nearer 88,500 lb, which trims the savings shown by roughly an eighth. The 200 bu/acre yield is illustrative.
The limits matter as much as the savings. The exemption stops at the interstate, so a haul that has to use I-80 or I-35 gets nothing from it. It applies in Iowa only, and a load crossing into Illinois, Nebraska or Minnesota falls under that state's rules. It also runs out before most of the harvest has happened. Iowa had 4% of its corn out on September 20, against a five-year average of 5% (USDA NASS, Sep 21, 2026). Last year's proclamation, issued September 18, was followed by an October 18 to November 17 extension and then a November to December order (Office of the Governor of Iowa, Oct 17, 2025; Nov 19, 2025). That history makes an extension likely, but it is not yet in effect, and a hauler pricing October loads cannot count on it.
Ground Truth: The 90,000-pound allowance is worth most on the longest non-interstate hauls, and before October 10 those hauls are mostly soybeans and early corn, not stored grain. For the next three weeks, the loads to move at 90,000 pounds are the ones heading to a distant processor or terminal on state highways. Short hauls to the home elevator gain about 3 cents and can wait. If the extension arrives on time, as it did last year, nothing is lost. If it arrives late, the 8 cents a bushel on 100-mile hauls is lost for any grain that waited.
4. How far a better bid is worth driving
What's new: Bids at nearby delivery points still differ enough to pay for a longer haul, but at current diesel the extra distance each cent of basis will cover is shorter than a farm's spring budget assumed.
Evidence: On September 22 the average Iowa country-elevator corn basis ranged from 42 cents under December futures in the northwest to 55 under in the southeast. The Council Bluffs terminal bid was 30 under, and Iowa ethanol plants averaged about 32 under (USDA AMS, Iowa Daily Cash Grain Bids, Sep 22, 2026; USDA AMS, National Daily Ethanol Report, Sep 22, 2026). In Illinois, central country elevators averaged 35 under, central processors 20 under, Mississippi River barge loaders 30 under, and Chicago processors about 1 over (USDA AMS, Illinois Grain Bids, Sep 22, 2026).
The useful measure is the cost of one extra loaded mile. At the repriced 100-mile rate, a hired truck costs $5.19 to $5.38 a loaded mile, which is 0.53 to 0.55 cents a bushel of corn at 80,000 pounds and 0.45 to 0.46 cents at 90,000. A farm's own semi costs about $2.67 a loaded mile in fuel at 5.0 mpg and an empty return, plus about 86 cents in repairs, tires and other operating costs on Iowa State's 2017 worksheet basis, plus 98 cents of driver time at Iowa's $24.45 an hour for harvest labor and 50 miles an hour (ISU A3-41, Aug 2017; ISU A3-10, Mar 2026). That comes to about $4.51 a loaded mile, or 0.46 cents a bushel. Once the driver's time is counted, an owned truck is only modestly cheaper than a hired one at these fuel prices.
| Choice on Sep 22 (corn) | Basis gain, ¢/bu | Extra miles it pays for, hired, 80k lb | Hired, 90k lb (Iowa) | Own semi, 80k lb | |
|---|---|---|---|---|---|
| Central IL country → Chicago processor | 36 | ██████████ |
66–68 | — | 78 |
| SE Iowa country → Iowa east ethanol plant | 23 | ██████░░░░ |
41–43 | 49–51 | 49 |
| N. central Iowa country → Council Bluffs terminal | 16 | ████░░░░░░ |
29–30 | 35–36 | 35 |
| Central IL country → central IL processor | 15 | ████░░░░░░ |
27–28 | — | 33 |
| Central IL country → Mississippi River barge loader | 5 | █░░░░░░░░░ |
9 | — | 11 |
Sources: USDA AMS Iowa Daily Cash Grain Bids, Sep 22, 2026; USDA AMS Illinois Grain Bids, Sep 22, 2026; USDA AMS National Daily Ethanol Report, Sep 22, 2026. Basis gains are differences between regional averages, not bids at specific facilities. Break-even miles are Crop Root Zone estimates: basis gain divided by the cost of one extra loaded mile per bushel as derived above. "Extra miles" is the added one-way loaded distance beyond the haul to the nearer buyer. The 90,000-lb column applies only to Iowa non-interstate routes through Oct 10.
Most farms can use the table as a simple rule. At current diesel, each 10 cents of basis pays for about 18 to 19 more loaded miles on a hired truck, and about 22 miles at 90,000 pounds in Iowa. The Chicago spread is the widest in the table, but it pays for only about 67 extra miles, and most central Illinois farms are well over 100 road miles from a Chicago processor (Crop Root Zone estimate). The southeast Iowa to ethanol plant spread is the one most farms in that region can actually use, if the plant is within about 40 miles further than the elevator.
The table leaves out the constraint that matters most in harvest: truck time. Adding 40 loaded miles to a haul adds about an hour and a half to every round trip at 50 miles an hour (Crop Root Zone estimate). If trucking is already the bottleneck, a combine that waits for the truck loses harvest hours, and a longer haul costs harvest days, not just fuel.
Ground Truth: The basis gain that pays for a longer haul off the combine is smaller than it looks on a bid sheet, and it gets smaller when trucks are scarce. The better use of a distant bid this fall is for grain put in the bin now and hauled in November or December. By then the truck is not holding up the combine, and the 90,000-pound window may still be open if the proclamation is extended. Price that later haul at $6 to $7 diesel, not the $2.89 in the custom-rate survey.
5. What to watch through October
| Indicator | Latest | Why it matters |
|---|---|---|
| Midwest on-highway diesel (EIA, weekly, Mondays) | $6.68, week of Sep 21 | Each $0.50/gal moves a 100-mile corn haul about 1.3–2.0¢/bu at 80,000 lb* |
| Iowa harvest proclamation | Sep 10 – Oct 10, 90,000 lb gross, non-interstate | 2025 was extended Oct 18 – Nov 17; a gap between orders costs about 8¢/bu at 100 miles* |
| GTOR truck availability index | 2.90 (Q2 2026), from 2.50 in Q1 | Rising difficulty is the usual precursor to rate increases |
| Iowa corn harvested | 4% (Sep 20), 5-yr avg 5% | Most bushels move after the current proclamation lapses |
| Southeast Iowa elevator vs Iowa east ethanol basis | About 55 under vs 32 under Dec (Sep 22) | A 23¢ spread pays for about 41–43 extra hired miles |
| GTOR third-quarter release | Due about December | First federal rate survey taken at $5.40-plus diesel |
Sources: EIA, Sep 22, 2026; Office of the Governor of Iowa, Sep 10, 2026 and Oct 17, 2025; USDA AMS GTOR Q2 2026, Jul 2026; USDA NASS Crop Progress, Sep 21, 2026; USDA AMS Iowa Daily Cash Grain Bids and National Daily Ethanol Report, Sep 22, 2026. *Crop Root Zone estimates.
Limits. The truck-rate survey is a national average built from the elevators that respond, with East, West and Rocky Mountain regions not reported in the second quarter, so any quarter can move on a few answers. The fuel adjustments assume an empty backhaul and a range of fuel economy. A truck with a return load, or one that runs better than 7.6 mpg, would need a smaller adjustment. The own-truck non-fuel cost uses Iowa State's 2017 worksheet and has not been adjusted for inflation, so it is probably low. Basis gains compare regional averages. The bid a specific farm can get at a specific plant, and the plant's hours and lines during harvest, will decide the actual choice.
References
- USDA Agricultural Marketing Service, Grain Truck and Ocean Rate Advisory, Second Quarter 2026, published Jul 2026 — https://www.ams.usda.gov/sites/default/files/media/GTOR2ndQtr2026.pdf
- USDA Agricultural Marketing Service, Grain Truck and Ocean Rate Advisory, First Quarter 2026, published May 2026 — https://www.ams.usda.gov/sites/default/files/media/GTOR1stQtr2026.pdf
- USDA Agricultural Marketing Service, Grain Truck and Ocean Rate Advisory, Fourth Quarter 2025, published Feb 2026 — https://www.ams.usda.gov/sites/default/files/media/GTOR4thQtr2025.pdf
- USDA Agricultural Marketing Service, Grain Truck and Ocean Rate Advisory, Third Quarter 2025, published Dec 2025 — https://www.ams.usda.gov/sites/default/files/media/GTOR3rdQtr2025.pdf
- USDA Agricultural Marketing Service, Grain Truck and Ocean Rate Advisory, Second Quarter 2025, published Jul 2025 — https://www.ams.usda.gov/sites/default/files/media/GTOR2ndQtr2025.pdf
- U.S. Energy Information Administration, Gasoline and Diesel Fuel Update, released Sep 22, 2026 — https://www.eia.gov/petroleum/gasdiesel/
- U.S. Energy Information Administration, Midwest (PADD 2) On-Highway Diesel Retail Prices, weekly series, released Sep 22, 2026 — https://www.eia.gov/dnav/pet/hist/LeafHandler.ashx?n=PET&s=EMD_EPD2D_PTE_R20_DPG&f=W
- U.S. Energy Information Administration, U.S. No. 2 Diesel Retail Prices, annual series, released Sep 22, 2026 — https://www.eia.gov/dnav/pet/hist/LeafHandler.ashx?n=PET&s=EMD_EPD2D_PTE_NUS_DPG&f=A
- Iowa State University Extension and Outreach, Ag Decision Maker File A3-10, "2026 Iowa Farm Custom Rate Survey," Mar 2026 — https://www.extension.iastate.edu/agdm/crops/pdf/a3-10.pdf
- William Edwards, Iowa State University Ag Decision Maker File A3-41, "Estimating Grain Transportation Costs," Aug 2017 — https://www.extension.iastate.edu/agdm/crops/html/a3-41.html
- Transport Topics, "Truck operating costs rose 3.4% in 2025, ATRI finds," Jul 17, 2026 — https://www.ttnews.com/articles/atri-truck-costs-2025
- Office of the Governor of Iowa, "September-October 2026 Harvest Proclamation," Sep 10, 2026 — https://governor.iowa.gov/news/2026-09-10/september-october-2026-harvest-proclamation
- Office of the Governor of Iowa, "Gov. Reynolds to extend harvest proclamation," Oct 17, 2025 — https://governor.iowa.gov/press-release/2025-10-17/gov-reynolds-extend-harvest-proclamation
- Office of the Governor of Iowa, "Gov. Reynolds issues November-December harvest proclamation," Nov 19, 2025 — https://governor.iowa.gov/press-release/2025-11-19/gov-reynolds-issues-november-december-harvest-proclamation
- USDA Agricultural Marketing Service, Iowa Daily Cash Grain Bids, Sep 22, 2026 — https://www.ams.usda.gov/mnreports/ams_2850.pdf
- USDA Agricultural Marketing Service, Illinois Grain Bids, Sep 22, 2026 — https://www.ams.usda.gov/mnreports/ams_3192.pdf
- USDA Agricultural Marketing Service, National Daily Ethanol Report, Sep 22, 2026 — https://www.ams.usda.gov/mnreports/ams_3617.pdf
- USDA National Agricultural Statistics Service, Crop Progress, week ending Sep 20, 2026 (released Sep 21, 2026) — https://esmis.nal.usda.gov/sites/default/release-files/796068/prog3826_0.txt
Disclosures
Crop Root Zone is an independent publication. Nothing here is investment advice. Market calls, where included, reflect the editors' own read and are not a recommendation to buy or sell any security.
Humic Acid Earns Its Keep on Corn In-Furrow and in Drought Years. On Soybeans, the Public Trials Mostly Come Up Empty.
Liquid humic and fulvic products cost about $4 to $16 an acre at common label rates. At the Central Illinois bids of $4.93 corn and $12.85 soybeans, that is 0.8 to 3.1 bushels of corn or 0.3 to 1.2 bushels of soybeans. A publicly funded three-year Illinois trial found in-furrow humic acid added about 5 bushels of corn and paid for itself. On soybeans the same trial lost money, and five on-farm comparisons in three states found no yield gain. A quart of product puts about a quarter-pound of humic acid on an acre that already holds some 70,000 pounds of organic matter, so any benefit comes from a signal to the roots, not from building soil. That is also why California lets a label claim only that humic acid may help micronutrient uptake.
Humic and fulvic acid products are sold as fertilizer additives and soil amendments at about $4 to $16 an acre at common label rates, and at much more under the heaviest labels. Central Illinois elevators bid $4.93 for corn and $12.85 for soybeans on September 25 (USDA AMS Illinois Grain Bids, Sep 25, 2026). The product therefore has to return between 0.8 and 3.1 bushels of corn, or 0.3 to 1.2 bushels of soybeans, before it pays. This piece reviews what independent trials have measured against that bar. On corn, the record clears it under two conditions: in-furrow placement and dry years. On soybeans, it mostly does not. The regulation of these products turns out to explain part of the gap between the marketing and the trial data.
1. What a humic program costs, and what it has to return
What's new: Few independent sources publish prices for humic products. The best public figures come from university trials that had to cost the product to calculate net return, and from retail list prices. University of Illinois crop physiologists put the average biostimulant at $8 to $12 an acre (Below and Sible, University of Illinois ACES, Jul 15, 2021). The Nebraska On-Farm Research Network costed an in-furrow fulvic product on soybeans at $4.00 an acre (UNL On-Farm Research, 2015, Clay County). Retail single-gallon prices for 12% liquid humic acid run from $21.20 (Humax, Seven Springs Farm Supply) to $31.00 (Quantum-12, Green Earth Ag & Turf), both accessed Sep 28, 2026.
Evidence: Label rates are the most variable factor in the cost. The Humax directions call for 1 to 2 quarts in 30 gallons of water for a soil application, and half a quart to a quart an acre as a foliar spray. The Quantum-12 page lists 4 to 10 gallons an acre for agronomic crops. The table uses the lowest cost in each row.
| Program | Basis | $/acre | Bu corn to pay at $4.93 | Bu soybeans to pay at $12.85 |
|---|---|---|---|---|
| Fulvic, in-furrow | UNL on-farm costing, 2015 | 4.00 | 0.8 | 0.3 |
| 12% liquid humic, 1 qt/ac | Retail, $21.20–$31.00/gal* | 5.30–7.75 | 1.1–1.6 | 0.4–0.6 |
| Typical biostimulant | Univ. of Illinois average | 8.00–12.00 | 1.6–2.4 | 0.6–0.9 |
| 12% liquid humic, 2 qt/ac | Retail, $21.20–$31.00/gal* | 10.60–15.50 | 2.2–3.1 | 0.8–1.2 |
| 12% liquid humic, 4 gal/ac | Quantum-12 low label rate, $31/gal* | 124.00 | 25.2 | 9.6 |
Sources: Below and Sible, University of Illinois ACES (Jul 15, 2021); UNL Nebraska On-Farm Research Network study 032035201501 (2015); retail list prices, Seven Springs Farm Supply and Green Earth Ag & Turf (accessed Sep 28, 2026); crop prices from USDA AMS Illinois Grain Bids, Central Illinois country elevator average (Sep 25, 2026). *Single-gallon retail list prices, used as a ceiling. Bulk and dealer-program prices are typically lower but are not published, so treat these rows as estimates. Break-evens assume the product rides along in an existing pass (tank mix, starter or planter) and add no application cost.
Soybeans are the cheaper crop to pay back. At $12.85 cash, a $5 program needs less than half a bushel. At the same program price, corn needs about a bushel. The bar is low for both crops. The issue is whether the independent trials can reliably detect a gain that small.
Ground Truth: A humic product's break-even is set by its label rate more than by its price per gallon. Read the rate before comparing jug prices. A cheap product with a 4-gallon label costs more per acre than an expensive one at a quart. A quart-rate program on soybeans at $12.85 needs so little yield that no field trial could confirm it paid. Ask whether the trial record shows any yield effect at all.
2. What the headline percentages actually measure
What's new: Two meta-analyses are behind most of the percentages quoted in this category. The first, by Rose and colleagues, pooled published humic-substance experiments and estimated average increases of 22% (±4%) in shoot dry weight and 21% (±6%) in root dry weight (Rose et al., Advances in Agronomy 124, 2014). The second, by Ma, Cheng and Zhang, reported that humic acid raised crop yield by 12%, nitrogen use efficiency by 27% and nitrogen uptake by 17% on average (Ma et al., Agronomy 14(12):2763, Nov 21, 2024).
Evidence: Neither figure can be applied directly to a Corn Belt field. Rose's endpoint is plant biomass, not harvested grain, and a larger seedling does not always mean more grain at harvest. The same review found that the response depended most on the source of the humic material and the rate. Compost-derived humic substances outperformed lignite- and peat-derived ones. Rate affected the response in a nonlinear way. Plants under high stress gained 28% in shoot growth, against 18% without stress. Most liquid products sold for row crops in North America are extracted from leonardite, a lignite-type ore, and their labels say so. The Grow More 12% label reads "12% humic acids derived from leonardite" (Grow More label, Jul 31, 2018). That is the source class the meta-analysis ranked below compost.
Ma's 12% yield figure also comes with conditions. The authors found the effect was weaker in alkaline soils and in soils with low organic carbon, below 10 g/kg. It was strongest at moderate pH and at nitrogen rates of 100 to 200 kg/ha. The abstract does not give the humic acid rates used in the underlying studies. The next section shows why that omission is important.
| Meta-analysis | Endpoint | Average effect | What moved it |
|---|---|---|---|
| Rose et al. 2014 | Shoot dry weight | +22% (±4) | Humic source (compost > lignite, peat), rate |
| Rose et al. 2014 | Root dry weight | +21% (±6) | Same |
| Rose et al. 2014 | Shoot, high stress vs. none | +28% vs. +18% | Growing conditions |
| Ma et al. 2024 | Crop yield | +12% | Weaker in alkaline and low-carbon soils |
| Ma et al. 2024 | Nitrogen use efficiency | +27% | Best at 100–200 kg N/ha |
Sources: Rose, M.T. et al., Advances in Agronomy 124:37–89 (2014); Ma, Cheng and Zhang, Agronomy 14(12):2763 (Nov 21, 2024), abstract.
Ground Truth: When a seller quotes "20% more growth," ask what was measured and in what. The 22% is shoot biomass pooled mostly from controlled experiments, and it is highest for compost-derived material under stress. A leonardite product going onto well-watered, high-organic-matter Corn Belt ground is the case where the meta-analysis predicts the smallest effect. The field trials below agree.
3. Corn: real gains, but only in-furrow or in dry years
What's new: The strongest publicly funded result on corn comes from the University of Illinois. Sible, Fender and Below tested a commercial humic acid product and a molasses/yeast extract product, each applied either broadcast before planting or in the seed furrow at planting, on corn and soybeans in 2020, 2021 and 2022. Corn yield was higher with in-furrow application than with broadcast. The three-year average gain from humic acid was 310 kg/ha, about 4.9 bu/ac, with a return on investment of $29 a hectare, about $12 an acre (Sible, Fender and Below, Agrosystems, Geosciences & Environment, Dec 2025). The study was funded through USDA's National Institute of Food and Agriculture multistate project NC1200.
Evidence: Most of the remaining corn record comes from USDA-ARS scientist Daniel Olk's program in Iowa. Its results depend on the weather and on how yield was measured. A central Iowa study of a micronized leonardite product, Enersol, labeled at no less than 18% humic acid, found combine yield gains of 11% to 19% on upland ground in the 2012 drought (P<0.10) and 7% in 2013. In the favorable seasons of 2014 and 2016 the gains were 1% to 3% and not statistically significant (Olk et al., Frontiers in Plant Science, May 2021). A second paper covered a liquid product, Yield Igniter, containing about 3% humic acid, applied at 3.5 L/ha. In five replicated site-years, combine yields rose 0.15 to 0.42 Mg/ha (1% to 4%), with P values from 0.01 to 0.28. In 98 hand-sampled farmer strips it rose 6.5% (Olk, Dinnes and Callaway, Frontiers in Plant Science, Jan 10, 2022).
| Corn result | Bu/ac | 0–25 scale |
|---|---|---|
| Iowa upland, 2012 severe drought (Olk 2021), midpoint of 14.8–25.5 | 20.2 | ████████░░ |
| Iowa hand-sampled strips, 98 pairs, 2009–11 (Olk 2022) | 16.7 | ███████░░░ |
| Iowa upland, 2013 late drought (Olk 2021) | 11.2 | ████░░░░░░ |
| Illinois in-furrow, 3-yr average, NIFA-funded (Sible 2025) | 4.9 | ██░░░░░░░░ |
| Iowa replicated combine trials, 5 site-years (Olk 2022), midpoint of 2.4–6.7 | 4.5 | ██░░░░░░░░ |
| Break-even, 2 qt/ac at $31/gal and $4.93 corn | 3.1 | █░░░░░░░░░ |
| Break-even, 1 qt/ac at $21.20/gal and $4.93 corn | 1.1 | ░░░░░░░░░░ |
| Iowa favorable years 2014, 2016 (Olk 2021) | +1–3%, n.s. | ░░░░░░░░░░ |
Sources: Olk, D.C. et al., Frontiers in Plant Science 12:672078 (May 2021); Olk, Dinnes and Callaway, Frontiers in Plant Science 12:778603 (Jan 10, 2022); Sible, Fender and Below, Agrosystems, Geosciences & Environment (Dec 2025); break-evens from Section 1. Conversions at 62.77 kg/ha per bu/ac (56-lb bushel). Bars scaled to 25 bu = 10 blocks. The favorable-year result was reported only as a percentage and is not converted.
Two points in the corn record are easy to miss. The first is the gap between measurement methods within the same program. Hand-sampled ear mass from demonstration strips showed 6.5%, or 16.7 bushels. Combine yield from replicated plots showed 1% to 4%. The combine figure is what goes in the bin. The second is funding. Both Iowa papers were financed through USDA-ARS trust-fund agreements with the product side. The 2021 paper was funded with the American Colloid Company, and two of its authors worked for Minerals Technologies. The 2022 paper was funded through an agreement with Ag Logic Distributors. Both papers disclose this, and the 2021 paper says the company had no role in design or analysis. The Illinois study is the only one in this set with purely public funding, and it produced the smallest combine gain of the positive results, about 5 bushels.
Ground Truth: On corn, budget for 3 to 5 bushels, not 15 to 20. The larger numbers came from a drought year or from hand-harvested ears. Three to five bushels still covers a quart-to-two-quart in-furrow program at $4.93 corn, so the practice pencils where the product rides along with starter. Broadcasting humic acid preplant has no independent support in this record. The Illinois study found in-furrow placement outperformed it.
4. Soybeans: the public trials find nothing to pay for
What's new: The Illinois study that found a gain on corn found none on soybeans. It reported "no consistent effects" of humic acid or molasses/yeast extract on soybean yield or quality, and an average net loss of $51 a hectare, about $21 an acre (Sible, Fender and Below, Dec 2025). The authors attribute the difference to how the two crops set yield. Corn commits to yield at a few early stages. Soybeans adjust yield continuously from flowering through seed fill, so a single early application has less to act on.
Evidence: Replicated on-farm comparisons in three states show the same result.
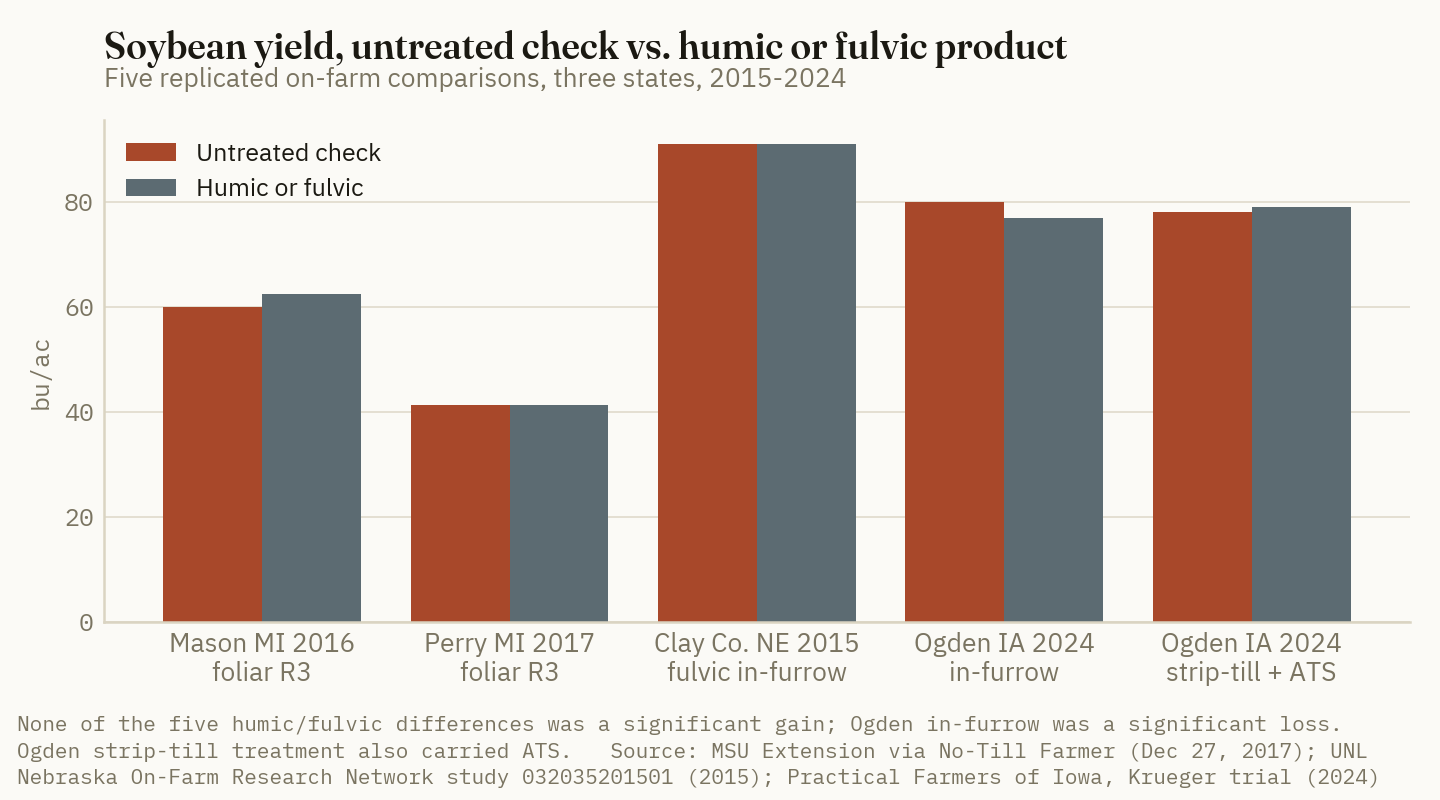
Michigan State University Extension tested a humic product, Blackmax 22, at 1 gallon an acre foliar at R3 in two cooperator fields. At Mason in 2016 the check made 60.0 bushels and the humic treatment 62.5, within the 2.8-bushel LSD. At Perry in 2017 the numbers were 41.3 and 41.4. MSU concluded that "a consistent response to Blackmax 22 was not evident." The consistent response in those trials came from the fungicide (MSU Extension via No-Till Farmer, Dec 27, 2017). In Nebraska, an in-furrow fulvic product on irrigated Clay County silt loam yielded 91 bushels, the same as the check, for a net loss of $4.00 an acre (UNL On-Farm Research, 2015). At Ogden, Iowa, in 2024, in-furrow humic acid yielded 77 bushels against 80 for the check, a small but statistically significant loss. A strip-till humic acid and ATS treatment yielded 79 against 78, not a significant difference (Practical Farmers of Iowa, 2024 trial report).
The one positive soybean paper comes from the same USDA-ARS group. A formulated humic product with added N, P and K raised yield in two of four Iowa environments from 2012 to 2014. Both responding environments had larger rainfall deficits and higher temperatures than normal (Lenssen, Olk and Dinnes, Crop, Forage & Turfgrass Management 5(1), 2019). Because that product also carried fertilizer nutrients, the gain cannot be credited to the humic fraction alone.
Ground Truth: Soybeans have the lowest bar, less than half a bushel at $12.85 for a quart program, and the weakest record. That combination makes it look cheap to try on soybeans every year, and the public data offer no support for doing so. The only soybean gains in this record came in hot, dry seasons from a product that also contained fertilizer. On soybeans, a humic product should be treated as a dry-year experiment on a few strips, not as part of the standard program.
5. The dose and the label: why this is a signal, not a soil amendment
What's new: Many humic products are marketed as soil builders. The arithmetic of a label rate does not support that. A 12% liquid at 9.0 lb/gal (Grow More label, Jul 31, 2018) applied at 1 quart an acre delivers 2.25 lb of product and 0.27 lb of humic acid. The top 6 inches of an acre of soil weighs about 2 million pounds, and each 1% of organic matter in it is about 20,000 lb (SARE, Building Soils for Better Crops, 2021). A field at 3.5% organic matter therefore already carries about 70,000 lb.
1 part in 260,000
A quart of 12% humic acid (0.27 lb) against the ~70,000 lb of organic matter in the top 6 inches of a 3.5%-OM acre. (Crop Root Zone calculation from Grow More label density, Jul 31, 2018, and SARE, 2021)
Evidence: At that dose, the product cannot change soil organic matter, cation exchange capacity or water-holding capacity in any measurable way. If it works, it works as a signal, triggering root growth or nutrient uptake in the seedling. That is consistent with the evidence. Rose's meta-analysis measured root and shoot growth. The gains that survive in the field come from in-furrow placement next to the seed and from stressed years, when root growth matters most. The Yield Igniter product in the 2022 Iowa study delivered roughly a tenth of a pound of humic acid per acre (3.5 L/ha at about 3% humic acid, assuming a density near that of water), which is an estimate.
The regulations take the same view. AAPFCO voted its Uniform Beneficial Substances Bill official in February 2024. The bill defines a beneficial substance as one "that can be demonstrated by scientific research to be beneficial" to plants, soil or media. In the same month, AAPFCO's committee voted to give "tentative" recognition to humic acids, hydrophobic fulvic acid and fulvic fraction as beneficial substances and plant biostimulants (Maryland Department of Agriculture presentation to BPIA, Mar 26, 2024). The standard laboratory method, ISO 19822:2018, measures "humic and hydrophobic fulvic acids." A label that says only "fulvic acid" names something the standard method does not measure. The Humic Products Trade Association developed the method that AAPFCO adopted, and states its purpose is to address "varied claims regarding content" on labels (HPTA, accessed Sep 28, 2026).
| Jurisdiction | How humic/fulvic products are treated | What the label may claim |
|---|---|---|
| AAPFCO (model for states) | Beneficial substance; humic acids, hydrophobic fulvic acid, fulvic fraction voted "tentative" Feb 2024 | Guaranteed % with source ("humic acid from leonardite") |
| California (SB 1522, 2024) | "Beneficial substance" replaces auxiliary soil and plant substance category | "Plant biostimulant"; "Humic acid may aid in the uptake of micronutrients." No yield claim listed |
| 26 states | Accept, or may begin rulemaking on, the uniform bill (as of Apr 2025) | Varies by state until adopted |
| Canada (CFIA) | Humic acid on the list of supplement materials exempt from registration | Must guarantee % humic acid; "Active ingredients derived from humic acid" |
Sources: CDFA Notice to Fertilizing Material Licensees (Dec 11, 2024); Maryland Department of Agriculture, "Plant Biostimulant State Regulatory Update," BPIA (Mar 26, 2024); BPIA/CDFA, "Adoption of Uniform Beneficial Substance Bill" (Apr 1, 2025); CFIA Trade Memorandum T-4-130 (modified Apr 16, 2026); ISO 19822:2018.
California's list shows what regulators have actually accepted. Humic acid is one of only three ingredients, with seaweed and kelp extract, whose labels may say "plant biostimulant" at all. The specific humic claim allowed is that it "may aid in the uptake of micronutrients" (CDFA, Dec 11, 2024). The label may not claim yield. Canada requires a guarantee of the humic acid percentage, but because humic acid is on the exempt list, the product skips the registration review. In both countries, a buyer can confirm the concentration on the label but not whether the product raises yield.
Ground Truth: Buy humic acid as a starter additive and pay for it per pound of humic acid measured by ISO 19822, not per gallon. Ask the dealer for the ISO 19822 or AAPFCO-method certificate. Divide the price by the guaranteed humic acid content, then price the rate the field trials actually used. Do not pay extra for a "soil building" claim that a quarter-pound per acre cannot deliver. The data support a narrow program: in-furrow on corn, on drought-prone or low-organic-matter ground, at a quart or two. They do not support a program across all acres or a routine application on soybeans.
References
- USDA AMS Livestock, Poultry and Grain Market News / Illinois Dept. of Agriculture, Illinois Grain Bids (report 3192), Sep 25, 2026 (Central Illinois average: corn $4.93, soybeans $12.85; CBOT Dec 2026 corn 528.25¢, Nov 2026 soybeans 1319.00¢) — https://www.ams.usda.gov/mnreports/ams_3192.pdf
- Brownfield Ag News, "Closing Grain and Livestock Futures: September 25, 2026," Sep 25, 2026 — https://www.brownfieldagnews.com/market-news/closing-grain-and-livestock-futures-september-25-2026/
- University of Illinois College of ACES, "Kelp for corn? Illinois scientists demystify natural products for crops" (Below, F. and Sible, C.), Jul 15, 2021 — https://aces.illinois.edu/news/kelp-corn-illinois-scientists-demystify-natural-products-crops
- University of Nebraska-Lincoln, Nebraska On-Farm Research Network, "Fulvic Acid In-Furrow on Soybeans," Study 032035201501 (Clay Co.), 2015 — https://resultsfinder.unl.edu/sites/unl.edu.ianr.extension.on-farm-research.results-finder/files/pdf/0032035201501.pdf
- Seven Springs Farm Supply, Humax (12% humic acid) 1-gallon product page and label rates, accessed Sep 28, 2026 — https://www.7springsfarm.com/products/humax-12-from-jh-biotech-gallon
- Green Earth Ag & Turf, Quantum-12 Liquid Humic Acids product page, accessed Sep 28, 2026 — https://greenearthagandturf.com/products/quantum-12
- Rose, M.; Patti, A.F.; Little, K.; Brown, A.; Jackson, W.R.; Cavagnaro, T., "A Meta-Analysis and Review of Plant-Growth Response to Humic Substances: Practical Implications for Agriculture," Advances in Agronomy 124:37–89, 2014 — https://doi.org/10.1016/B978-0-12-800138-7.00002-4
- Ma, Cheng and Zhang, "The Impact of Humic Acid Fertilizers on Crop Yield and Nitrogen Use Efficiency: A Meta-Analysis," Agronomy 14(12):2763, Nov 21, 2024 (open access) — https://doi.org/10.3390/agronomy14122763
- Grow More, Inc., "12% Humic Acid Derived from Leonardite" product label (density 9.00 lb/gal), Jul 31, 2018 — https://s3-us-west-1.amazonaws.com/agrian-cg-fs1-production/pdfs/HUMIC_ACID1_12_Label.pdf
- Sible, C.N.; Fender, J.S.; Below, F.E., "Soil-applied carbon-based biostimulants differentially affect maize and soybean grain yield and quality," Agrosystems, Geosciences & Environment, Dec 2025 (open access, CC BY 4.0; NIFA multistate project NC1200) — https://doi.org/10.1002/agg2.70281
- Olk, D.C.; Dinnes, D.L.; Scoresby, J.R.; Darlington, J.W.; Hurburgh, C.R.; Rippke, G.R., "Maize Growth and Grain Yield Responses to a Micronized Humic Product Across Soil Types and Annual Weather Patterns in Central Iowa, United States," Frontiers in Plant Science 12:672078, May 2021 (open access) — https://pmc.ncbi.nlm.nih.gov/articles/PMC8153041/
- Olk, D.C.; Dinnes, D.L.; Callaway, C.R., "Maize Growth Responses to a Humic Product in Iowa Production Fields: An Extensive Approach," Frontiers in Plant Science 12:778603, Jan 10, 2022 (open access) — https://www.frontiersin.org/journals/plant-science/articles/10.3389/fpls.2021.778603/full
- Michigan State University Extension, "Soybean Yield Response to Foliar Applied Humic Acid and Fungicide," republished by No-Till Farmer, Dec 27, 2017 — https://www.no-tillfarmer.com/articles/7387-soybean-yield-response-to-foliar-applied-humic-acid-and-fungicide
- Practical Farmers of Iowa, "Sulfur Fertilizer and Humic Acid Amendment for Soybeans" (K. Krueger, Ogden, Iowa), 2024 trial report — https://practicalfarmers.org/research/sulfur-fertilizer-and-humic-acid-amendment-for-soybeans/
- Lenssen, A.W.; Olk, D.C.; Dinnes, D.L., "Application of a Formulated Humic Product Can Increase Soybean Yield," Crop, Forage & Turfgrass Management 5(1):1–6, 2019 — https://doi.org/10.2134/cftm2018.07.0053
- Magdoff, F. and van Es, H., Building Soils for Better Crops, Ch. 3 "Amount of Organic Matter in Soils," SARE, 4th ed., 2021 — https://www.sare.org/publications/building-soils-for-better-crops/amount-of-organic-matter-in-soils/
- Davidson, P. (Maryland Department of Agriculture), "Plant Biostimulant State Regulatory Update," presentation to the Biological Products Industry Alliance, Mar 26, 2024 — https://www.bpia.org/wp-content/uploads/2024/03/AAPFCO-Biostimulant-Update-.pdf
- International Organization for Standardization, ISO 19822:2018, Fertilizers and soil conditioners — Determination of humic and hydrophobic fulvic acids concentrations in fertilizer materials, 2018 — https://www.iso.org/standard/66271.html
- Humic Products Trade Association, "HPTA Test Method Certified Seal," accessed Sep 28, 2026 — https://humictrade.org/certification-seal/
- California Department of Food and Agriculture, "Notice to Fertilizing Material Licensees: Beneficial Substance Labeling Format & Plant Biostimulant Label Claims," Dec 11, 2024 — https://www.cdfa.ca.gov/is/ffldrs/docs/fertilizer/notice_to_industry-beneficial_substances_plant_biostimulants-final-12-11-24.pdf
- Biological Products Industry Alliance / CDFA, "Adoption of Uniform Beneficial Substance Bill," Sacramento, Apr 1, 2025 — http://www.bpia.org/wp-content/uploads/2025/04/CDFA-Beneficial-Substance-Bill.pdf
- Canadian Food Inspection Agency, Trade Memorandum T-4-130, "Labelling requirements for fertilizers and supplements," modified Apr 16, 2026 — https://inspection.canada.ca/en/plant-health/fertilizers/trade-memoranda/t-4-130
Disclosures
Crop Root Zone is an independent publication. Nothing here is investment advice. Market calls, where included, reflect the editors' own read and are not a recommendation to buy or sell any security.
The Other Fall Nitrogen Inhibitor Needs Two Bushels to Pay. Missouri's Headline 7% Was a Win Over Nitrapyrin. Over Plain Anhydrous, the Gap Was 0.6 Bushels.
Pronitridine (Centuro) costs about $10 an acre on 150 pounds of fall anhydrous at the label's 5-gallon rate, and nitrapyrin about $15. At Central Illinois' $4.92 corn bid, that is 2.0 and 3.0 bushels. Across 13 university site-years in three states, the two products yielded the same. The gains that exist were measured on poorly drained soils given 30% less nitrogen than recommended. Nebraska's farmer-run strips on silt loams found no yield effect in five fall comparisons. This fall a strong El Niño is expected to push the 50°F soil date 10 to 15 days late, so the timing decision is worth more than the choice of product.
Two nitrification inhibitors are now on offer for fall anhydrous. Nitrapyrin, sold as N-Serve, has been the default for decades. Pronitridine is sold by Koch Agronomic Services as Centuro, and Koch has launched a concentrated A-PRO version with three times the active ingredient per unit of product (Farms.com, Aug 4, 2025). Anhydrous averaged $945 a ton at retail in mid-September, or 58 cents a pound of nitrogen (DTN, Sep 23, 2026). Central Illinois elevators bid $4.92 for corn on September 24 (USDA AMS Illinois Grain Bids, Sep 24, 2026). Iowa State expects a strong El Niño to keep soils warm into November (Iowa State ICM, Sep 10, 2026). Warm soil is the condition that wears an inhibitor out fastest. So the fall 2026 question has three parts. Which inhibitor, if either? On which ground? And does it change when the rig should roll? The replicated record answers all three more clearly than the marketing does.
1. What the inhibitor costs, and what it has to return
What's new: Prices for inhibitors are negotiated at the dealer and rarely published. The best public prices come from university trial reports, which have to state their costs to calculate net return. The University of Nebraska's on-farm network priced Centuro at $21.12 a gallon in its 2019 and 2020 reports. At the label rate of 5 gallons per ton of anhydrous, that came to $9.66 an acre on 150 pounds of N and $11.59 on 180 (UNL On-Farm Research, 2020, Richardson County). A 2022 report used $10.10 an acre at 175 pounds (UNL On-Farm Research, 2022, Richardson County). Koch's own worked example uses $10.07 an acre at the 5-gallon rate (Koch Agronomic Services, Dec 21, 2023). Nebraska's York County study used 10 gallons per ton and costed it at $20.58 to $23 an acre (UNL On-Farm Research, 2020 and 2022, York County). For nitrapyrin, University of Minnesota Extension used about 10 cents a pound of N in its fall 2025 nitrogen-rate budget (UMN Extension, Oct 21, 2025). That is $15 an acre at 150 pounds.
Evidence: Divide each cost by the corn price and the result is the yield gain the product must deliver to break even.
| Program (fall anhydrous) | Basis | $/acre | Bu to pay at $4.92 cash | Bu to pay at $5.27 Dec-27 | Same money as extra N (lb) |
|---|---|---|---|---|---|
| Pronitridine, 5 gal/ton | 150 lb N, $21.12/gal | 9.66 | 2.0 | 1.8 | 17 |
| Pronitridine, 5 gal/ton | 175 lb N, UNL 2022 | 10.10 | 2.1 | 1.9 | 17 |
| Nitrapyrin | 150 lb N, $0.10/lb N* | 15.00 | 3.0 | 2.8 | 26 |
| Nitrapyrin | 180 lb N, $0.10/lb N* | 18.00 | 3.7 | 3.4 | 31 |
| Pronitridine, 10 gal/ton | 150 lb N, UNL York 2022 | 23.00 | 4.7 | 4.4 | 40 |
Sources: product costs from UNL On-Farm Research Network reports (2020, 2022); UMN Extension (Oct 21, 2025). Corn: USDA AMS Illinois Grain Bids, Central Illinois country elevator average $4.92, and CBOT December 2027 settlement $5.2725 (Sep 24, 2026). Extra N at DTN's $0.58/lb N anhydrous (DTN, Sep 23, 2026). *The $0.10/lb N nitrapyrin cost is an extension budgeting figure from fall 2025, not a 2026 retail quote. Pronitridine prices are from 2019–2022 trial reports. Treat every cost line as an estimate until a dealer quote replaces it.
The last column is the alternative the inhibitor competes against. The same $15 buys 26 more pounds of nitrogen at today's anhydrous price. A grower buying an inhibitor is paying to keep nitrogen already applied rather than applying more. That only makes sense where the nitrogen is actually at risk.
Ground Truth: At these prices, the brand choice is worth about one bushel. The difference between the two products' per-acre costs, around $5, is about 1 bushel of $4.92 corn. The trials below cannot measure a yield difference that small. Price the two as substitutes and let the dealer's quote decide. The larger decision is whether a field needs an inhibitor at all.
2. Head to head, the university record cannot separate them
What's new: The largest independent comparison was published in Field Crops Research in February 2024. Kaur, Nelson, Wikle, Ferguson and Singh ran 13 site-years in Illinois, Missouri and Nebraska from 2016 to 2019, with fall and spring nitrogen. Their conclusion: "no differences between the two NIs were observed in terms of corn yield production" (Kaur et al., Field Crops Research 306, 2024).
Evidence: The same paper found that pronitridine raised yield 4% over the untreated control on average. Gross margins rose $32 to $67 a hectare on poorly drained Missouri and Illinois sites and $10 to $30 on well-drained Nebraska sites. Per acre, that is about $13 to $27 on poorly drained ground and $4 to $12 on well-drained ground. There is a catch that matters for applying the result on a farm. Pronitridine was tested alongside only 70% of the recommended nitrogen rate. A nitrogen-short crop will respond to anything that keeps more nitrogen in the root zone. A grower applying a full rate should expect less.
The study behind the "7% over nitrapyrin" line has the same issue. Singh and Nelson ran fall and spring anhydrous at 112 kg N per hectare, about 100 pounds an acre, on a Putnam silt loam claypan at Novelty, Missouri, in 2014 and 2015 (Singh and Nelson, Journal of Agricultural Science 11(4), 2019). The table converts their fall-applied yields to bushels.
| Fall anhydrous at ~100 lb N/ac, Novelty, Mo. | 2014 (bu/ac) | 2015, wet year (bu/ac) |
|---|---|---|
| Pronitridine, 9.4 L/ha | 251.2 | 183.5 |
| Nitrapyrin as N-Serve | 242.9 | 171.7 |
| Nitrapyrin as Instinct | 242.3 | 188.6 |
| Anhydrous + UAN, no inhibitor | 247.7 | 182.9 |
| No nitrogen | 199.4 | 80.9 |
Source: Singh, G. and Nelson, K.A., "Pronitridine and Nitrapyrin With Anhydrous Ammonia for Corn," Journal of Agricultural Science 11(4), Mar 6, 2019, Table 6. Mg/ha converted at 15.93 bu per Mg/ha. The no-inhibitor check received UAN to match the nitrogen carried in the pronitridine product. In 2014 the treatments that received nitrogen did not differ statistically. In 2015, pronitridine was not statistically different from Instinct or from the no-inhibitor check (α = 0.1).
In 2015, June and July rainfall was 322 and 257 mm, against 10-year averages of 94 and 59. Pronitridine beat N-Serve by 11.8 bushels, which is the 7%. It beat the anhydrous with no inhibitor by 0.6 bushels, a gap too small to be statistically real, and the encapsulated nitrapyrin product beat both. The headline number compares one inhibitor with another in a wet year on claypan with too little nitrogen. It does not show that either inhibitor paid for itself.
Ground Truth: When a percentage is quoted for an inhibitor, ask two questions: compared with what, and at what nitrogen rate. Most of the claims that circulate at winter meetings compare an inhibitor to a competitor, or were measured at 70% or less of the economic nitrogen rate. Neither kind of test measures the decision a grower actually faces, which is full-rate fall anhydrous with or without an inhibitor.
3. On Nebraska silt loams, farmers' own yield monitors found nothing
What's new: The Nebraska On-Farm Research Network runs replicated strip trials with farmers' own equipment and cleaned yield-monitor data. Its 2021 review covered 10 inhibitor studies in 2019–2020: N-Serve, Centuro and a DCD product with anhydrous, and Instinct II with UAN. Every site was a silt loam or silty clay loam. None of the 10 sites showed a yield effect from the inhibitor, and partial profit was statistically lower with the inhibitor at four (Thompson, Brhel and Iqbal, UNL CropWatch, Apr 7, 2021).
Evidence: The Centuro-specific reports with fall anhydrous show the pattern trial by trial.
| Study (county, crop year) | Fall application | N rate (lb/ac) | Check (bu/ac) | Centuro (bu/ac) | Δ | Significant? |
|---|---|---|---|---|---|---|
| Richardson, 2020 | Dec 4, 2019 | 150 | 229 | 230 | +1 | No |
| Richardson, 2020 | Dec 4, 2019 | 180 | 235 | 236 | +1 | No |
| York (irrigated), 2020 | Nov 15, 2019 | 150 | 269 | 267 | −2 | No |
| York (irrigated, hail), 2022 | Nov 6, 2021 | 150 | 111 | 122 | +11 | No (P = 0.27) |
| Richardson, 2022 | Nov 23, 2021 | 175 | 243 | 242 | −1 | No |
Source: UNL Nebraska On-Farm Research Network study reports 0416147202001, 0118185202001, 0118185202202 and 0416147202203 (2020–2022). Centuro applied at 5 gal/ton at Richardson and at 10 gal/ton at York. Significance tested at 90% confidence. The 2022 York site had three replications and severe hail at V12. It was the third year the cooperator repeated the study, and years one and two also showed no yield differences.
The same York cooperator also ran spring anhydrous. Fall without an inhibitor and spring without an inhibitor both yielded 269 in 2020, and there was no timing difference in 2022. Net return with Centuro was statistically lower in the 2020 York fall comparison, by $26 an acre, and in the 2022 Richardson study, by $18. These are Nebraska soils that hold ammonium well, applied in November and December. Iowa State describes exactly this condition, cold soil, as the one in which ammonium stays put without help (Iowa State ICM, "Remember 50 Degrees," Sep 19, 2005).
0 of 10
Nebraska on-farm inhibitor studies on silt loam and silty clay loam in 2019–2020 that showed any yield effect. Four showed lower partial profit. (UNL CropWatch, Apr 7, 2021)
4. Where it pays: drainage, timing and the size of the gap
What's new: The strongest independent case for any fall inhibitor still comes from tile-drained southern Minnesota. Over seven years at Waseca, fall anhydrous with N-Serve outyielded fall anhydrous alone by 15 bushels. Spring anhydrous outyielded fall anhydrous alone by 27 (Randall et al., 2008, as summarized in NDSU Extension SF1581, Apr 2022). NDSU's summary adds that nitrapyrin's yield gains have been "inconsistent." They depend on whether rainfall arrives to leach nitrate from sandier soils or to denitrify it in high-clay soils.
Evidence: Set the reported gains next to the break-evens from Section 1, and it is clear where the money sits.
| Reported fall-inhibitor gain | Bu/ac | 0–15 scale |
|---|---|---|
| Waseca, Minn., tile-drained, 7 yrs: fall AA + N-Serve vs fall AA | 15.0 | ██████████ |
| Novelty, Mo., claypan, 2015: pronitridine vs N-Serve (not vs untreated) | 11.8 | ████████░░ |
| Koch-reported average, fall Centuro vs untreated (manufacturer) | 6.0 | ████░░░░░░ |
| Break-even, nitrapyrin at $15/ac and $4.92 corn | 3.0 | ██░░░░░░░░ |
| Break-even, pronitridine 5 gal/ton at $9.66/ac and $4.92 corn | 2.0 | █░░░░░░░░░ |
| Novelty, Mo., 2015: pronitridine vs untreated anhydrous | 0.6 | ░░░░░░░░░░ |
| Nebraska on-farm, 5 fall Centuro strips, median Δ | 1.0 | █░░░░░░░░░ |
Sources: NDSU Extension SF1581 (Franzen, Apr 2022) citing Randall et al. (2008); Singh and Nelson (2019); Koch Agronomic Services, "Doing the Math on Nitrogen Protection" (Dec 21, 2023), which cites UNL, University of Missouri and Illinois Fertilizer and Chemical Association research, manufacturer-reported; UNL On-Farm Research reports (2020–2022); break-evens from Section 1. Bars scaled to 15 bu = 10 blocks.
Koch's 6-bushel figure is a manufacturer average and comes with its own caveat that "improvements in yield may not be observed in all cases." Koch's newer claim for A-PRO is that in 2025 trials it raised plant-available soil nitrogen at VT by 97% over untreated fall anhydrous at 180 pounds of N (Koch Agronomic Services, Centuro product page, accessed Sep 25, 2026, citing Cropsmith, Inc. and the Illinois Fertilizer and Chemical Association). That is a soil-nitrogen measurement, not a yield measurement, and no independent replication has been published yet.
Taken together, the evidence ranks fields in a consistent order. The inhibitor pays most often on poorly drained, fine-textured or claypan soils where spring waterlogging drives denitrification. Kaur's poorly drained Missouri and Illinois sites returned roughly two to three times the gross margin of the well-drained Nebraska sites. The payoff also rises the earlier in the fall the anhydrous goes on, and on coarse soils where fall nitrogen is risky at any date. It pays least on well-drained silt loams with late-November application, which is what Nebraska tested. And even in Minnesota, where the inhibitor clearly helped, it recovered only about half of the gap between fall and spring nitrogen.
Ground Truth: An inhibitor does not turn fall nitrogen into spring nitrogen. The best independent result recovered 15 of a 27-bushel gap. It works as insurance on fields where spring application is not practical. On poorly drained ground applied on time, the premium is about 2 to 3 bushels, and the Minnesota and Missouri records say that is cheap. On well-drained silt loam applied after the soil is cold, Nebraska's yield monitors say it is an expense.
5. Fall 2026: the calendar matters more than the product
What's new: Iowa State's agronomists put the odds of a very strong El Niño this fall and winter above 90%. They note that central Iowa soils normally reach 50°F and falling around November 10, and they expect that date to arrive 10 to 15 days later this year (Castellano, Andersen, Archontoulis and Baum, Iowa State ICM, Sep 10, 2026). The last El Niño fall, 2023, ran 2.7°F above normal, and that December was 9.7°F above normal. Iowa State's advice this year is to use nitrification inhibitors with ammonia and manure, and it reports that more than two-thirds of Iowa farmers already do.
Evidence: The mechanism argues for a later start date more than for a particular product. Nitrification slows sharply below 50°F but continues down to 32°F. Nitrapyrin breaks down by chemical hydrolysis, and "degradation is temperature dependent." Warm soil that speeds nitrification also speeds nitrapyrin's breakdown, so the product's protection is shortest in exactly the conditions where it is most needed (Sawyer, Iowa State ICM, Sep 19, 2005). Koch's A-PRO launch material says the product allows application once soil temperatures drop to 15°C, about 59°F (Farms.com, Aug 4, 2025). That is a manufacturer claim. None of the independent trials above tested it against a later untreated application. In Missouri, the fall treatments went on only after the soil at 15 cm fell below 10°C (Singh and Nelson, 2019). In Nebraska, fall applications ran from November 6 to December 4. Every favorable result in this article was measured on anhydrous applied after the soil was cold, not before.
| Fall 2026 decision | Well-drained silt loam | Poorly drained / claypan / tiled | Coarse-textured |
|---|---|---|---|
| Apply after sustained <50°F at 4 in. | Inhibitor optional; Nebraska found no gain | Inhibitor ~2–3 bu premium; Minnesota and Missouri support it | Fall N itself questionable |
| Apply before 50°F (early start) | Inhibitor protection shortened by warm soil | Largest loss risk; spring application beats fall + inhibitor | Avoid |
| Choice of product | Price decides | Price decides; no yield difference in 13 site-years | — |
Sources: Crop Root Zone synthesis of Iowa State ICM (Sep 10, 2026; Sep 19, 2005), UNL CropWatch (Apr 7, 2021), NDSU SF1581 (Apr 2022), Kaur et al. (2024) and Singh and Nelson (2019). The cells are the publication's reading of the trials, not trial outputs.
Ground Truth: In a fall likely to be 10 to 15 days late, it pays more to give up some of the fall application window than to buy an inhibitor. A grower who plans to start before the 50°F trend sets in, relying on the inhibitor to protect early-applied nitrogen, is using the product in the conditions where it breaks down fastest and where the trials offer no support. Wait for the soil. Use the inhibitor on tiled, claypan and heavy ground, where 2 or 3 bushels is a realistic return. On well-drained silt loam applied late in the season, keep the $10 to $15, or put it into 17 to 26 more pounds of nitrogen if the rate is already tight.
References
- Farms.com, "Nitrogen protection is getting a leg up with new CENTURO A-PRO nitrogen stabilizer" (Koch Agronomic Services release), Aug 4, 2025 — https://www.farms.com/ag-industry-news/nitrogen-protection-is-getting-a-leg-up-with-new-centuro-a-pro-nitrogen-stabilizer-792.aspx
- Quinn, R., DTN/Progressive Farmer, "Fertilizer Prices Rise for Six of Eight Major Fertilizers," Sep 23, 2026 (survey week Sep 14–18, 2026) — https://www.dtnpf.com/agriculture/web/ag/crops/article/2026/09/23/fertilizer-prices-rise-six-eight
- USDA AMS Livestock, Poultry and Grain Market News / Illinois Dept. of Agriculture, Illinois Grain Bids (report 3192), Sep 24, 2026 — https://www.ams.usda.gov/mnreports/ams_3192.pdf
- Castellano, M.; Andersen, D.; Archontoulis, S.; Baum, M., "Fifty and Falling: What the Super El Niño Means for Anhydrous Ammonia and Manure Timing this Fall," Iowa State University Integrated Crop Management, Sep 10, 2026 — https://crops.extension.iastate.edu/post/fifty-and-falling-what-super-el-nino-means-anhydrous-ammonia-and-manure-timing-fall
- University of Nebraska-Lincoln, Nebraska On-Farm Research Network, "Impact of CENTURO Inhibitor with Anhydrous Ammonia Application," Study 0416147202001 (Richardson Co.), 2020 — https://resultsfinder.unl.edu/sites/unl.edu.ianr.extension.on-farm-research.results-finder/files/pdf/0416147202001.pdf
- University of Nebraska-Lincoln, Nebraska On-Farm Research Network, "Impact of CENTURO Inhibitor with Fall Anhydrous Ammonia Application," Study 0416147202203 (Richardson Co.), 2022 — https://resultsfinder.unl.edu/sites/unl.edu.ianr.extension.on-farm-research.results-finder/files/pdf/Rpt0416147202203_Stevens_Centuro.pdf
- Koch Agronomic Services, "Doing the Math on Nitrogen Protection," Dec 21, 2023 (manufacturer-reported) — https://kochagronomicservices.com/knowledge-center/doing-the-math-on-nitrogen-protection
- University of Nebraska-Lincoln, Nebraska On-Farm Research Network, "Impact of CENTURO Inhibitor with Fall and Spring Anhydrous Ammonia Application," Study 0118185202001 (York Co.), 2020 — https://resultsfinder.unl.edu/sites/unl.edu.ianr.extension.on-farm-research.results-finder/files/pdf/0118185202001.pdf
- University of Nebraska-Lincoln, Nebraska On-Farm Research Network, "Impact of CENTURO Inhibitor with Fall and Spring Anhydrous Ammonia Application," Study 0118185202202 (York Co.), 2022 — https://resultsfinder.unl.edu/sites/unl.edu.ianr.extension.on-farm-research.results-finder/files/pdf/Rpt0118185202202_Stahr_Inhibitor.pdf
- Carlson, B., "With high nitrogen fertilizer prices and low corn prices, can you decrease your nitrogen rate for 2026?," University of Minnesota Extension Crop News, Oct 21, 2025 — https://blog-crop-news.extension.umn.edu/2025/10/with-high-nitrogen-fertilizer-prices.html
- Kaur, H.; Nelson, K.A.; Wikle, C.; Ferguson, R.B.; Singh, G., "Nitrogen fertilizer and pronitridine rates for corn production in the Midwest U.S.," Field Crops Research 306:109200, Feb 2024 (open access, CC BY-NC-ND) — https://doi.org/10.1016/j.fcr.2023.109200
- Singh, G.; Nelson, K.A., "Pronitridine and Nitrapyrin With Anhydrous Ammonia for Corn," Journal of Agricultural Science 11(4):13, Mar 6, 2019 (open access, CC BY) — https://doi.org/10.5539/jas.v11n4p13
- Thompson, L.; Brhel, J.; Iqbal, J., "Evaluation of Nitrification Inhibitors through the Nebraska On-Farm Research Network," UNL CropWatch, Apr 7, 2021 — https://cropwatch.unl.edu/2021/evaluation-nitrification-inhibitors-through-nebraska-farm-research-network/
- Sawyer, J., "Remember 50 Degrees," Iowa State University Integrated Crop Management, IC-494(23), Sep 19, 2005 — https://crops.extension.iastate.edu/encyclopedia/remember-50-degrees
- Franzen, D.W. et al., Nitrogen Extenders and Additives for Field Crops, NDSU Extension SF1581, Apr 2022 (summarizing Randall et al., 2008) — https://www.ndsu.edu/agriculture/extension/publications/nitrogen-extenders-and-additives-field-crops
- Koch Agronomic Services, CENTURO product page (A-PRO 2025 trial claim, citing Cropsmith, Inc. and Illinois Fertilizer and Chemical Association; manufacturer-reported), accessed Sep 25, 2026 — https://kochagronomicservices.com/centuro
Disclosures
Crop Root Zone is an independent publication. Nothing here is investment advice. Market calls, where included, reflect the editors' own read and are not a recommendation to buy or sell any security.
A Wheat Seed Treatment Needs Two-Thirds of a Bushel to Pay at Today's Bids. On Scabby Seed, Kansas Measured 4.5. On Clean Seed Sown on Time, Three of Four Commercial Treatments in a Ten-Site Midwest Study Showed No Yield Effect.
Kansas custom operators charged $4.61 a bushel more in 2026 to clean wheat seed with a treatment than without one. That comes to $4.61 to $7.68 an acre for a fungicide at normal seeding rates, and an estimated $10 to $15 with a full-rate insecticide. At September's $6.89 to $6.97 wheat bids, that is 0.7 to 2.2 bushels. The replicated trials split along two lines. The seed lot decides whether the fungicide pays: it paid on seed from a scab year, on smut- or bunt-carrying seed, and on thin stands of light seed. It did not show up on clean, certified seed. The calendar decides whether the insecticide pays: it paid where wheat went in early into aphids, and it fades after the fly-safe date. So the two halves of the treatment should be bought as separate decisions.
By September 20, U.S. winter wheat was 17% planted (USDA NASS, Sep 21, 2026). Certified wheat seed is commonly sold already treated. Nebraska's 2026 crop budgets price seed wheat only as "certified treated" (UNL, 2026). The treatment cost is folded into the seed invoice, so it is rarely priced as its own decision. It should be. Kansas custom seed cleaners charged $5.61 a bushel in 2026 to clean and treat wheat seed, and $1.00 to clean it without treatment (Kansas Custom Rates 2026). That $4.61 gap is the most recent public price for the treatment itself. It is up from 35 cents in 2004. Wheat has also moved. December Kansas City futures settled at $7.71¾ on September 23 (GX94 Radio, Sep 23, 2026). So the question this piece answers is narrow and practical: how many bushels does a wheat seed treatment have to return in fall 2026, and in which fields do the university trials say it actually does?
1. What a wheat seed treatment costs in 2026
What's new: The Kansas custom-rate survey is one of the few public places where the cost of treating wheat seed shows up separately from the seed. In 2026, cleaning with treatment averaged $5.61 a bushel statewide, with a range of $3.50 to $8.00 across 10 reports. Cleaning without treatment averaged $1.00, with a range of $0.65 to $1.50 across 14 reports. In the Western district, the averages were $6.09 and $0.94 (Kansas Custom Rates 2026). The survey itself warns that the number of responses was small in both 2024 and 2026, and that responses came from different regions in each year.
Evidence: The treated-minus-untreated spread is the treatment's price. It includes product and the service of applying it, but not the seed. That spread has grown from $0.35 a bushel of seed in 2004 to $4.61 in 2026. The charge for cleaning alone roughly doubled over the same period.
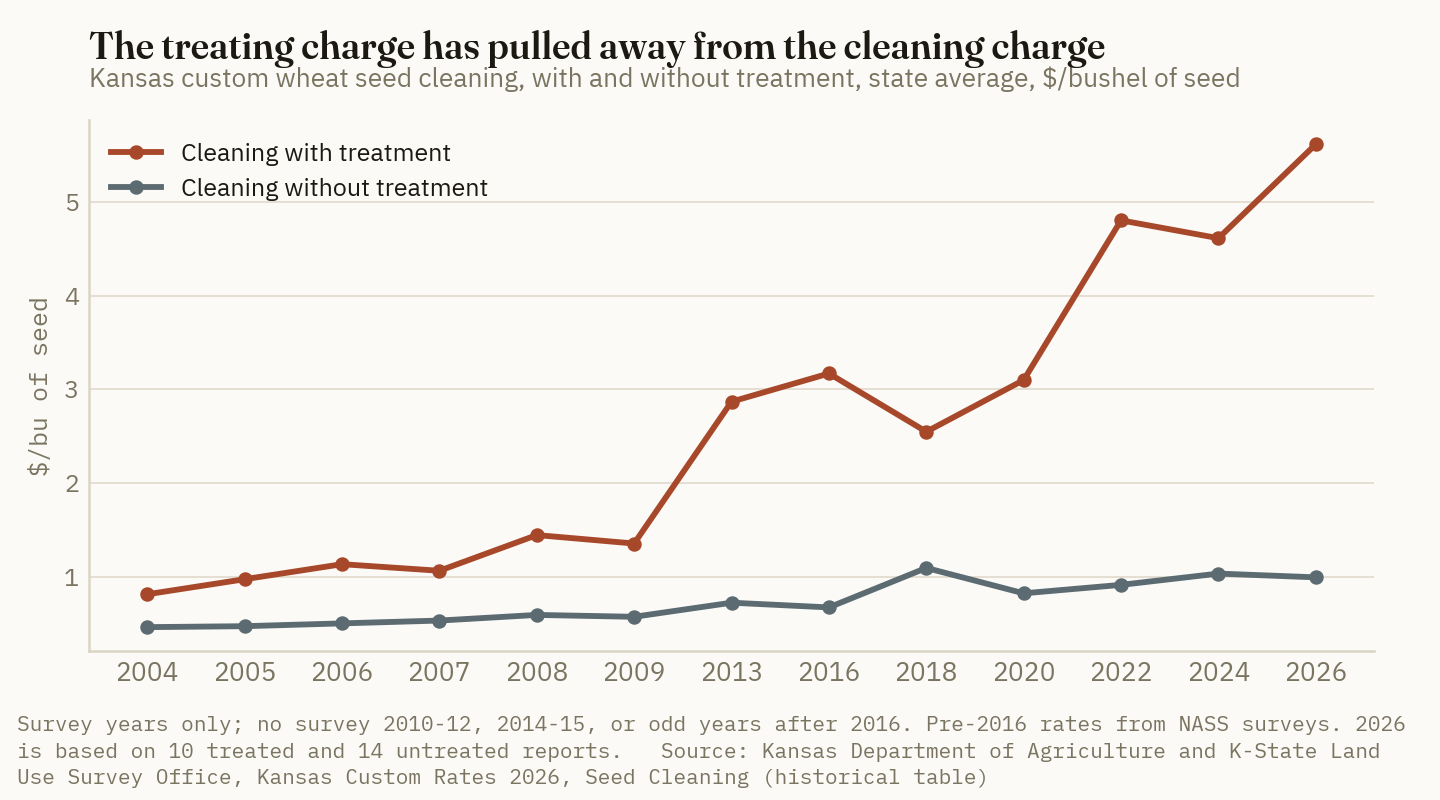
Because the charge is per bushel of seed, the cost per acre rises with the seeding rate. Two other public numbers bracket it. The University of Nebraska's 2026 budgets price certified, treated wheat seed at $0.41 a pound and wheat seed sold for cover crops at $0.33, a gap of 8 cents a pound. That gap covers both certification and treatment (UNL Center for Agricultural Profitability, 2026 Nebraska Crop Budgets). For the insecticide, Tennessee's 11-year study put insecticide seed treatment costs at $24.70 to $37.10 a hectare, or about $10.00 to $15.00 an acre (Perkins, Steckel and Stewart, Journal of Economic Entomology, 2018). Those prices are from before 2018, and no public 2026 retail price list exists for the branded packages. Crop Root Zone therefore treats the $10 to $15 range as an estimate.
| Treatment program | Seeding rate | Treatment cost ($/acre) | Basis |
|---|---|---|---|
| Fungicide, commercially applied, Plains dryland | 60 lb (1.0 bu) | 4.61 | KS state custom spread, $4.61/bu seed |
| Same, Western Kansas custom rate | 60 lb (1.0 bu) | 5.15 | KS Western district spread, $5.15/bu seed |
| Fungicide, early or dual-purpose Plains seeding | 90 lb (1.5 bu) | 6.92 | KS state spread × 1.5 bu |
| Fungicide, soft red winter at 1.4 million seeds | ~100 lb (~1.7 bu)* | 7.68 | KS state spread × 1.67 bu |
| Certification plus treatment premium, Nebraska | 60 lb | 4.80 | UNL, $0.41 vs $0.33/lb |
| Fungicide + full-rate insecticide | Varies | 10.00–15.00* | Perkins et al. 2018 cost range, pre-2018 prices |
Sources: Kansas Department of Agriculture and K-State Land Use Survey Office, Kansas Custom Rates 2026; UNL Center for Agricultural Profitability, 2026 Nebraska Crop Budgets; Perkins et al., J. Econ. Entomol. 111(6), 2018. Seeding rates for soft red winter follow Ohio State's 1.2 to 1.6 million seeds per acre (Lindsey et al., Sep 21, 2026). *Crop Root Zone estimates: the pound conversion assumes about 14,000 seeds per pound, and the insecticide-package range uses pre-2018 prices because no 2026 public list price was found. A grower's dealer quote replaces every line in this table.
Ground Truth: The treatment is priced per bushel of seed, but it pays per acre. That makes it cheapest where it is least needed. A 60-pound dryland seeding on the fly-safe date carries about $4.61 of treatment. A late seeding pushed to 120 pounds to make up for lost tillers carries about $9.22 for the same product. That late seeding is also the one where the insecticide has the least to do. A grower who raises the seeding rate for a late planting should drop the insecticide at the same time. Otherwise the treatment bill doubles for the wheat that gains least from it.
2. What it has to return at September 2026 wheat prices
What's new: Wheat prices have risen enough to lower every break-even in this piece. On September 23, December KC hard red winter futures settled at $7.71¾, and December Chicago soft red winter at $7.08½. July 2027 settled at $7.85¼ for KC and $7.33 for Chicago (IndexBox, Sep 23, 2026). Western Kansas elevators were bidding ordinary-protein wheat 60 to 90 cents under December KC (USDA AMS Kansas Daily Grain Bids, via IndexBox, Sep 18, 2026). Applied to the September 23 settlement, that is $6.83 to $7.12, a midpoint of $6.97. For the 2027 soft red winter crop, CGB's Illinois locations were bidding July 2027 delivery at $6.74 to $7.14 on September 24, with Naples at $6.89 (Farmbucks, Sep 24, 2026). USDA's season-average price for 2026/27 is $6.40 (USDA WASDE, Sep 11, 2026, via High Plains Journal).
Evidence: Break-even in bushels is the treatment cost divided by the price.
| Treatment program | Cost ($/acre) | Break-even at $6.40 (bu/a) | Break-even at $6.89 (bu/a) | Break-even at $6.97 (bu/a) |
|---|---|---|---|---|
| Fungicide, 60 lb, state rate | 4.61 | 0.72 | 0.67 | 0.66 |
| Fungicide, 60 lb, Western KS rate | 5.15 | 0.80 | 0.75 | 0.74 |
| Fungicide, 90 lb | 6.92 | 1.08 | 1.00 | 0.99 |
| Fungicide, SRW ~100 lb | 7.68* | 1.20 | 1.11 | 1.10 |
| Fungicide + insecticide, low end | 10.00* | 1.56 | 1.45 | 1.43 |
| Fungicide + insecticide, high end | 15.00* | 2.34 | 2.18 | 2.15 |
Source: Crop Root Zone arithmetic. Costs from Section 1. Prices: USDA 2026/27 season-average $6.40 (WASDE, Sep 11, 2026); CGB Naples, Ill., July 2027 SRW bid $6.89 (Farmbucks, Sep 24, 2026); Western Kansas midpoint $6.97 = Dec KC $7.7175 (Sep 23, 2026) less the 60-90 cent basis quoted Sep 18, 2026 (USDA AMS via IndexBox). *Estimated costs.
0.66 bushel
What a $4.61 fungicide seed treatment on a 60-pound seeding needs to return at a $6.97 Western Kansas bid. On a 50-bushel crop, that is a 1.3% yield response. (Crop Root Zone arithmetic from Kansas Custom Rates 2026 and USDA AMS/IndexBox, Sep 18-23, 2026)
On a 50-bushel crop, a response of about 1% to 4% is the break-even range for almost every program in the table. The trouble is that a response that small is very hard to measure. A typical small-plot wheat trial cannot separate a 1-bushel difference from zero. Most of the evidence below therefore comes in one of two forms. Either a trial found a response large enough to measure, which only happens when something is going wrong in the untreated plots, or it found nothing it could call real.
3. Where the trials cannot find it: clean seed, sown on time
What's new: The most recent multi-state test is also the most directly relevant to a soft red winter grower this fall. Researchers from Wisconsin, Purdue and Michigan State ran 10 locations across Wisconsin, Indiana and Michigan in 2021 and 2022. They tested two varieties, Harpoon and Kaskaskia, against an untreated check and four commercial treatments: Athena-R, CruiserMaxx Vibrance Cereals, Stamina F4 and Raxil Pro MD/Shield. Only Athena-R on Harpoon changed yield. No other treatment had a significant effect on yield, and none affected test weight. The variety mattered more than any seed treatment (Ortmeier-Clarke et al., Crop, Forage & Turfgrass Management, Apr 3, 2025).
Evidence: The Plains data point the same way when the seed is clean. In K-State's 2018-19 study at seven Kansas locations, seed treatment (insecticide plus fungicide) raised stand counts at one location. Seed cleaning raised them at five, and seeding rate at all seven (Kansas Agricultural Experiment Station Research Reports, Vol. 6, Iss. 5, 2020). In western Canada, a 26 site-year study found that a dual fungicide-insecticide treatment gave the highest gross returns at both seeding rates. At the normal rate of 400 seeds per square meter, though, the treatment cost more than the extra yield it produced, and net returns were CAN$11 a hectare below the untreated check (Beres et al., Agronomy Journal, May 2016).
| Study (region, years) | Seed and timing | Treatment | Measured response | |
|---|---|---|---|---|
| Kansas, 2016-17 | Seed from a severe scab year | Insecticide + fungicide | +4.5 bu/a | ██████████ |
| West Tennessee, 2006-17 (33 expts.) | Planting late Sept to late Nov, median ~Oct 17 | Insecticide | +4.2 bu/a | █████████░ |
| Manhattan, KS, 2004-05 | Early, Sept 14 planting | Imidacloprid (Gaucho) | +2.6 bu/a (n.s.) | ██████░░░░ |
| Manhattan, KS, 2004-05 | Early, Sept 14 planting | Fungicide only (Charter) | −1.1 bu/a (n.s.) | ░░░░░░░░░░ |
| WI / IN / MI, 2021-22 (10 locations) | Clean seed, normal timing | 4 commercial products | No significant effect in 3 of 4 | — |
| Kansas, 2018-19 (7 locations) | Clean seed, normal timing | Insecticide + fungicide | Stand gain at 1 of 7 sites | — |
Sources: Pinto et al., Agrosystems, Geosciences & Environment, 2019 (0.3 Mg/ha converted to 4.5 bu/a); Perkins et al., J. Econ. Entomol., 2018; Wilde, K-State Entomology efficacy report, 2005 (29.23 bu/a check; n.s. = not significantly different from the check at P > 0.05); Ortmeier-Clarke et al., Crop, Forage & Turfgrass Management, 2025; KAES Research Reports Vol. 6 Iss. 5, 2020. Bars scale to the largest response, rounded to the nearest block; negative values show empty. The studies differ in design and are not directly comparable.
K-State's own extension guidance agrees with these results more than the marketing does. The September 2025 revision of its seed-treatment guide lists five priorities. Four are about the seed lot: seed from fields with loose smut, flag smut or common bunt; seed meant for next year's seed; seed with low germination from seed-borne fungi; and seed from scab fields. The fifth is planting into cool, wet soils when weather forces a delay (Andersen Onofre and De Wolf, K-State MF2955, Sep 2025). "Clean certified seed planted on time" is not on the list. Ohio State's fall 2026 guidance asks for cleaned seed with a fungicide treatment to control seed-borne disease. It does not mention an insecticide seed treatment, and it tells growers to plant within the 14 days after the county fly-safe date (Lindsey et al., Ohio State, via Ohio's Country Journal, Sep 21, 2026).
Ground Truth: On clean, certified seed sown in the right window, the fungicide coat is insurance, and the trials cannot price it. The failure it insures against is a bad seedbed, and a clean seed lot in a normal fall rarely produces one. The 10-site Midwest study is the fairest recent test, and three of the four commercial treatments showed nothing. That does not mean certified seed should be ordered bare. At $5 to $8 an acre the insurance is cheap, and certified seed commonly comes treated. It does mean that paying extra for a premium stack, or a second treatment, on clean seed sown in the right window cannot be backed by the replicated data. The grower is paying for a response the trials could not find.
4. Where it pays: the seed brings the disease, or the calendar brings the insects
What's new: The trials that do find a response share a feature. Something was wrong in the untreated check. Either the seed carried a pathogen, the planting date exposed the seedling to insects, or the stand was thin enough that every plant mattered. Oklahoma is a live case this year. In June, OSU's small grains pathologist reported smut-contaminated grain arriving at elevators in central Oklahoma. She advised that grain from fields with loose smut or common bunt not be kept for seed. If it must be used, it should get a high-rate fungicide treatment (De Oliveira Silva, OSU World of Wheat, Jun 12, 2026).
Evidence — the seed lot. Common bunt and loose smut are the clearest cases for treatment. Seed treatments control both, and OSU's guidance is to plant certified, treated seed on any field where bunt was seen (Hunger, Royer, Edwards and Giles, OSU CR-7088). Loose smut can take up to 40% of yield. Heavy Fusarium on seed can cut emergence by up to 80% (Wegulo, UNL CropWatch, Sep 1, 2020). Bunt costs growers at the elevator as well as in the field. Grain with the fishy odor is docked by the smut-ball count and can be rejected outright, as some Kansas wheat was after the 2006 outbreak. K-State's bunt guidance says the most common source of infection is saved seed, and that the risk grows with each year the seed lot is kept away from certification (K-State Plant Pathology, Common Bunt of Wheat). The scab case has a measured number. In K-State's Manhattan trials on seed saved from a severe Fusarium head blight season, an insecticide-plus-fungicide treatment raised yield by 0.3 megagrams a hectare, about 4.5 bushels an acre, and raised kernel weight (Pinto et al., 2019). At $6.97, that is $31 of wheat for a $4.61 to $6.92 treatment.
Evidence — the calendar. The insecticide half is the part whose value depends on the planting date. K-State's August 27 planting advisory says to "strongly consider fungicide and insecticide seed treatments when planting early in Kansas." It adds that the treatments are most effective for about the first 30 days after planting, and do nothing against mites or caterpillars (Lollato et al., K-State Agronomy eUpdate, Aug 27, 2026). K-State's 2026 insect guide gives the neonicotinoids at least two weeks of activity against aphids and Hessian fly after emergence, depending on rate. It also says they are not an effective tool against wheat streak mosaic (Zukoff, McCornack and Whitworth, K-State MF745, Mar 2026). In Oklahoma, imidacloprid on seed reduced aphids and barley yellow dwarf. Its returns were most consistent in the early, dual-purpose planting window when aphids were spreading the virus. The aphid response shrank in late plantings, and higher rates raised yield without consistently paying for themselves (Royer et al., Journal of Economic Entomology, 2005). A review of Hessian fly management found that seed treatments give about 20 to 30 days of control. That protects against the first fall brood but not later broods or spring infestations, and "the cost of investing in a preventative seed treatment for Hessian fly alone often cannot be justified" (Schmid et al., Journal of Integrated Pest Management, 2018). The same review cites an Oklahoma regression: each Hessian fly larva per tiller cost about 5.74 bushels an acre over the season. Kentucky trapped flies in July and August 2025, before planting began (Adewinle and Villanueva, UK Grain Crops, Oct 14, 2025). A heavy infestation can take several bushels, which is why the insecticide is worth buying for early-sown wheat on continuous-wheat or volunteer-heavy ground.
The best long-run insecticide data come from the mid-South. Across 33 West Tennessee experiments from 2006 to 2017, insecticide seed treatments cut aphids 86% and barley yellow dwarf incidence 60%, and raised yield 4.2 bushels an acre. A foliar insecticide raised yield 5.7 bushels at roughly half the cost and returned nearly three times as much (Perkins et al., 2018). Tennessee has also flagged a label problem. At the 7.5-ounce mid-rate of some combination packages, the insecticide supplied only about 40% of the rate Tennessee recommends for aphids (Stewart, UT Crops News, Oct 29, 2014).
Ground Truth: A wheat seed treatment is two purchases in one bag. They should be judged separately. Whether the fungicide pays depends on the seed lot. It pays whenever the seed carries a pathogen: bin-run seed from a field that showed smut or bunt, seed saved from a scab year, or light seed with low germination. The Kansas scab trial returned roughly five to seven times the cost. Whether the insecticide pays depends on the calendar. It pays on wheat sown ahead of the fly-safe or best pest management date, especially dual-purpose wheat, where aphids and the first Hessian fly brood arrive in the 30 days the chemistry lasts. After the fly-safe date, most of its value is gone, and a grower who scouts can buy the same protection more cheaply with a foliar spray. The mistake to avoid is ordering one standard treatment for the whole farm: the full stack on clean, late-sown seed, or bare bin-run seed from a smutty field on an early seeding.
5. The break-even by scenario, and what is not known
Evidence: The table below puts each scenario's cost against the best measured response for it. Where no replicated U.S. number exists, the table says so.
| Scenario | Treatment | Cost ($/a) | Break-even at $6.97 (bu/a) | Best measured response | Read |
|---|---|---|---|---|---|
| Clean certified seed, on time, SRW | Fungicide | 7.68* | 1.10 | Not detected in 3 of 4 products, 10 sites | Insurance only |
| Clean certified seed, on time, Plains | Fungicide | 4.61 | 0.66 | Stand gain at 1 of 7 KS sites | Insurance only |
| Seed saved from a scab year | Fungicide + insecticide | 4.61–6.92 | 0.66–0.99 | +4.5 bu (KS, 2016-17) | Pays, several times over |
| Bin-run seed from smut/bunt field | High-rate fungicide | 4.61–6.92* | 0.66–0.99 | Loose smut losses up to 40%; bunt rejection risk | Pays; clean seed first |
| Early / dual-purpose Plains seeding | Fungicide + insecticide | 10.00–15.00* | 1.43–2.15 | Positive returns in the early window (OK); +2.6 n.s. (KS) | Pays under aphid or fly pressure |
| Mid-South SRW, BYDV region | Insecticide | 10.00–15.00* | 1.43–2.15 | +4.2 bu (TN, 33 expts.) | Pays, but a foliar spray paid more |
| Thin stand / light seed, low seeding rate | Fungicide + insecticide | 4.61–6.92 | 0.66–0.99 | +CAN$22/ha net (W. Canada) | Pays |
| Late seeding into cold, wet soil | Fungicide (Pythium-active) | 6.92–9.22 | 0.99–1.32 | No replicated U.S. yield figure found | Judgment call |
Sources: costs and break-evens from Sections 1-2 (Crop Root Zone arithmetic); responses from Ortmeier-Clarke et al. 2025; KAES Research Reports Vol. 6 Iss. 5; Pinto et al. 2019; Wegulo, UNL CropWatch, Sep 1, 2020; K-State Plant Pathology, Common Bunt of Wheat; Royer et al. 2005; Wilde, K-State 2005; Perkins et al. 2018; Beres et al. 2016. Break-evens are shown at the $6.97 Western Kansas midpoint for comparability; at the $6.89 Illinois July 2027 bid they are about 1% higher. *Estimated costs.
Four things remain unclear. The first is the insecticide price. No public 2026 list price separates the insecticide from the fungicide in the branded wheat packages. The $10 to $15 range rests on pre-2018 costs from Tennessee, and a grower's own quote could land well outside it. The second is Oklahoma's multi-year dual-purpose work. The 2014 Crop Management study by DeVuyst, Edwards, Hunger and Weaver covered three to five western Oklahoma locations in 2008, 2011 and 2012, including grazed plots, and is titled for a yield improvement. Its numbers were behind a paywall that Crop Root Zone could not legally reach, so they are not used here. The third is the cold-soil case. K-State lists delayed planting into cool, wet soil as a reason to treat. Mefenoxam and metalaxyl target Pythium. But the only recent multi-state trial aimed at Pythium and its relatives, the Midwest study, found little yield effect in 2021-22, and no replicated U.S. figure prices the benefit in a truly wet fall. The fourth is the fly-safe date itself. Ohio State's updated planting-date work from 2022 to 2025 found smaller losses from late planting than its older data. Warm autumns can also keep Hessian fly active past the historic date (Lindsey et al., Sep 21, 2026; Schmid et al., 2018). If fly-safe dates drift later, the planting window in which the insecticide pays drifts with them.
Ground Truth: The fall 2026 decision comes down to four checks, all made before the seed is ordered. (1) Where did this seed lot come from? If it is bin-run from a field with smut, bunt or scab, clean it and treat it at the high fungicide rate. At $4.61 to $6.92 an acre, this is the best-supported purchase on the list. (2) Is it certified and clean? Then the fungicide coat is cheap insurance. Take it if it comes standard, but do not pay up for a premium stack the trials cannot separate from zero. (3) Is this field going in before the fly-safe or best pest management date, for pasture or because of harvest timing? Then add the insecticide at a full, labeled rate, and check the label. A combination package at mid-rate may carry less than half the active ingredient an aphid program needs. (4) Is it going in after the fly-safe date? Then leave the insecticide off and scout in spring. At $7 wheat, these checks separate a $4.61 decision from a $15 one on every acre.
References
- USDA National Agricultural Statistics Service, Crop Progress (Winter Wheat Planted, week ending Sep 20, 2026), released Sep 21, 2026 — https://esmis.nal.usda.gov/sites/default/release-files/796068/prog3826_0.pdf
- Kansas Department of Agriculture and Kansas State University Land Use Survey Office, Kansas Custom Rates 2026 (Seed Cleaning, district and historical tables), 2026 — https://www.agmanager.info/sites/default/files/pdf/CustomRates_2026.pdf
- University of Nebraska-Lincoln Center for Agricultural Profitability, 2026 Nebraska Crop Budgets (Table 4, seed prices; budgets #075-#079), 2026 — https://cap.unl.edu/sites/unl.edu.ianr.agecon.center-for-ag-profitability/files/media/file/2026-nebraska-crop-budgets.pdf
- Perkins, C.M.; Steckel, S.J.; Stewart, S.D., "Impact of Insecticide Seed Treatments and Foliar Insecticides on Aphid Infestations in Wheat, Incidence of Barley Yellow Dwarf, and Yield in West Tennessee," Journal of Economic Entomology 111(6), 2018 — https://academic.oup.com/jee/article/111/6/2734/5113443
- GX94 Radio (Harvard Media), "September 23 Closing Commodity Prices," Sep 23, 2026 — https://www.gx94radio.com/2026/09/23/september-23-closing-commodity-prices-4/
- IndexBox, "USDA Grain Futures & Canola Bids Report – September 23, 2026," Sep 23, 2026 — https://www.indexbox.io/blog/usda-daily-grain-futures-and-canola-bids-report-for-september-23-2026/
- IndexBox, summary of USDA AMS Kansas Daily Grain Bids (Western Kansas ordinary-protein wheat, 60-90 cents under December), Sep 18, 2026 — https://www.indexbox.io/blog/usda-grain-bid-reports-show-mixed-cash-prices-across-midwest-and-gulf-2/
- Farmbucks, "CGB Illinois Cash Bids" (SRW wheat, July 2027 delivery), updated Sep 24, 2026 — https://farmbucks.com/grain-prices/cgb/illinois
- USDA World Agricultural Outlook Board, World Agricultural Supply and Demand Estimates, Sep 11, 2026, as reported by High Plains Journal, Sep 14, 2026 — https://hpj.com/2026/09/14/wasde-report-sept-11/
- Ortmeier-Clarke, H.J.; Mourtzinis, S.; Smith, D.L.; Chilvers, M.I.; Telenko, D.E.P.; Conley, S.P., "Variety choice influences soft red winter wheat yield more than seed treatment," Crop, Forage & Turfgrass Management 11(1), e70037, Apr 3, 2025 — https://doi.org/10.1002/cft2.70037
- "Wheat Grain Yield Response to Seed Cleaning and Seed Treatment as Affected by Seeding Rate During the 2018–2019 Growing Season in Kansas," Kansas Agricultural Experiment Station Research Reports 6(5), 2020 — https://newprairiepress.org/kaesrr/vol6/iss5/24/
- Beres, B.L., et al., "Winter Wheat Cropping System Response to Seed Treatments, Seed Size, and Sowing Density," Agronomy Journal 108(3), May 2016 — https://doi.org/10.2134/agronj2015.0497; summarized by Manitoba Crop Alliance, "Fall Fungicide and Seed Treatment Application on Winter Wheat" — https://mbcropalliance.ca/directory/production-resources/fall-fungicide-and-seed-treatment-application-on-winter-wheat/
- Pinto, J.G.C.P.; Munaro, L.B.; Jaenisch, B.R.; Nagaoka, A.K.; Lollato, R.P., "Wheat Variety Response to Seed Cleaning and Treatment after Fusarium Head Blight Infection," Agrosystems, Geosciences & Environment 2(1), 2019 — https://doi.org/10.2134/age2019.05.0034
- Wilde, G.E., "Insect control with planting treatments on wheat in Manhattan, Kansas 2005 — Seed Treatment in Wheat, Yield Data," K-State Department of Entomology efficacy trials — https://entomology.k-state.edu/doc/efficacy-trials/wheat-seed-treatments-yield-data.pdf
- Andersen Onofre, K.; De Wolf, E., Seed Treatment Fungicides for Wheat Disease Management, K-State Research and Extension MF2955 (Rev.), Sep 2025 — https://bookstore.ksre.ksu.edu/pubs/seed-treatment-fungicides-for-wheat-disease-management_MF2955.pdf
- Lindsey, L.; Rakkar, M.; Essman, A.; Matcham, E. (Ohio State University), "Small grain planting and management considerations for fall," Ohio's Country Journal, Sep 21, 2026 — https://ocj.com/2026/09/small-grain-planting-and-management-considerations-for-fall/
- De Oliveira Silva, A., "Wheat Disease Update – June 12, 2026," OSU World of Wheat, Jun 12, 2026 — https://osuwheat.com/2026/06/12/wheat-disease-update-june-12-2026/
- Hunger, B.; Royer, T.; Edwards, J.; Giles, K., Effect of Planting Date and Seed Treatment on Diseases and Insect Pests of Wheat, Oklahoma Cooperative Extension CR-7088 (Rev. 0812) — https://pods.okstate.edu/fact-sheets/CR-7088pod-2012.pdf
- Wegulo, S., "Reducing Yield Loss in Wheat Through Fungicide Seed Treatments," UNL CropWatch, Sep 1, 2020 — https://cropwatch.unl.edu/2020/reducing-yield-loss-wheat-through-fungicide-seed-treatments/
- K-State Department of Plant Pathology, Common Bunt of Wheat — https://www.plantpath.k-state.edu/extension/wheat-and-forages/documents/common-bunt-of-wheat-2010.pdf
- Lollato, R.; Holman, J.; Andersen Onofre, K.; Whitworth, J.; Ganske, S., "Wheat Planting: Be Cautious of Planting Too Early," K-State Agronomy eUpdate Issue 1118, Aug 27, 2026 — https://www.agronomy.k-state.edu/eupdates/2026/issue-1118-august-27/planting-wheat-too-early.html
- Zukoff, A.; McCornack, B.P.; Whitworth, R.J., Wheat Insect Pest Management 2026, K-State Research and Extension MF745, Mar 2026 — https://bookstore.ksre.ksu.edu/pubs/wheat-insect-pest-management-2026_MF745.pdf
- Royer, T.A., et al., "Economic Evaluation of the Effects of Planting Date and Application Rate of Imidacloprid for Management of Cereal Aphids and Barley Yellow Dwarf in Winter Wheat," Journal of Economic Entomology 98(1), Feb 2005 — https://academic.oup.com/jee/article-abstract/98/1/95/2218085
- Schmid, R.B., et al., "Hessian Fly (Diptera: Cecidomyiidae) Biology and Management in Wheat," Journal of Integrated Pest Management 9(1):14, 2018 — https://academic.oup.com/jipm/article/9/1/14/4975456
- Adewinle, A.; Villanueva, R., "Hessian fly threat persists in Kentucky wheat fields ahead of 2025 fall planting," University of Kentucky Grain Crops, Oct 14, 2025 — https://graincrops.mgcafe.uky.edu/articles/hessian-fly-threat-persists-kentucky-wheat-fields-ahead-2025-fall-planting
- Stewart, S., "Insecticide Seed Treatments in Wheat … Know What You're Buying!," UT Crops News, Oct 29, 2014 — https://news.utcrops.com/2014/10/insecticide-seed-treatments-in-wheat-know-what-youre-buying/
- DeVuyst, E.A.; Edwards, J.T.; Hunger, R.M.; Weaver, L., "Insecticide and Fungicide Wheat Seed Treatment Improves Wheat Grain Yields in the U.S. Southern Plains," Crop Management 13(1), 2014 (abstract only consulted) — https://doi.org/10.2134/CM-2013-0039-RS
Disclosures
Crop Root Zone is an independent publication. Nothing here is investment advice. Market calls, where included, reflect the editors' own read and are not a recommendation to buy or sell any security.
A $2.50 Soybean Inoculant Needs a Fifth of a Bushel to Pay. On Ground That Has Grown Soybeans, Two Decades of University Trials Mostly Can't Find It. On New Ground, Manitoba Found 15.
Nebraska's 2026 budget carries a base rhizobia inoculant at $2.50 an acre, and at $13.25 November soybeans that needs 0.19 bushels. On fields with soybean history, 73 trials in five states, 17 Nebraska on-farm strips and 11 more in four states found almost nothing; the one pooled dataset that shows a gain, 0.9 bushels, was written by inoculant companies. New ground is the opposite case: 15 bushels in Manitoba. So the base product is a small, defensible hedge only where a field meets a named trigger. The premium seed-applied stack, at an estimated two to three times the price, has 103 site-years against it. Sort the fields before the 2027 seed order goes in.
The seed order for 2027 soybeans is being written this fall, and the inoculant decision usually gets made inside it without anyone pricing it. Seed companies sell rhizobia inoculant as part of a seed treatment package, applied at the plant, often in an "extended-life" formulation or stacked with other biological products. The base product is cheap. The University of Nebraska–Lincoln's 2026 dryland soybean budget carries "soybean seed inoculant" at $2.50 an acre against $82 of seed (UNL Center for Agricultural Profitability, 2026). November soybean futures closed at $13.25½ on September 22 (Brownfield Ag News, Sep 22, 2026). At that price the base product needs 0.19 bushels to break even, a response no field trial can measure. The question is not whether inoculant is cheap. It is whether, on a field that has grown soybeans before, it returns anything. Two decades of university trials in the upper Midwest give a mostly consistent answer, and it depends almost entirely on the field's history.
1. What the seed order is actually buying, and what it has to return
What's new: The soybean crop grew this year. USDA put 2026 plantings at 85.4 million acres, up 5% from 2025, while corn fell 3% to 95.3 million (USDA NASS, Jun 30, 2026). A rotation shift of that size moves some acres onto fields that have been in corn for several years. On those fields the case for inoculant is different, as Section 4 shows. On most of the U.S. soybean base, though, the field grew soybeans two years ago and the soil still carries a population of Bradyrhizobium japonicum from that crop.
Evidence: Inoculant is sold at several price tiers. Nebraska's budget puts the base product at $2.50 an acre. Nebraska on-farm trials run between 1992 and 2016 used products costing $0.44 to $4.00 an acre (Mueller et al., UNL CropWatch, Apr 6, 2017). Premium on-seed packages combine an extended-life inoculant with biostimulant or "enhancer" organisms, and double inoculation adds a granular in-furrow product. No public list prices were found for either. The table brackets them with Crop Root Zone estimates, marked with an asterisk.
| Inoculant program | Cost, $/acre | Break-even at $12.50/bu | at $13.25/bu |
|---|---|---|---|
| Low end, Nebraska on-farm trials | 0.44 | 0.04 | 0.03 |
| Base inoculant, UNL 2026 budget | 2.50 | 0.20 | 0.19 |
| High end, Nebraska on-farm trials | 4.00 | 0.32 | 0.30 |
| Premium on-seed stack* | 6.00 | 0.48 | 0.45 |
| Premium on-seed stack, upper* | 8.00 | 0.64 | 0.60 |
| Double inoculation, seed + granular in-furrow* | 10.00 | 0.80 | 0.75 |
Sources: UNL Center for Agricultural Profitability, 2026 Budget #059, Soybeans, Dryland, Conv. Till after Corn ($2.50/acre); Mueller et al., UNL CropWatch, Apr 6, 2017 ($0.44–$4.00/acre range); Brownfield Ag News, Sep 22, 2026 (November futures $13.25½). *Crop Root Zone estimates; no 2026 public list price was available for premium stacks or granular in-furrow product. $12.50 is an estimated harvest cash price below futures. Break-even in bu/acre = cost ÷ price.
The base product's break-even is about 0.2 bushels, or 0.3% of a 60-bushel crop. A premium stack needs about half a bushel. That difference matters less for what it costs than for what it assumes: a premium product only pays if the extra organisms add yield beyond what the rhizobia already do. Sections 2 and 3 show that the independent evidence for that is thin.
Ground Truth: The inoculant line on a seed invoice is usually priced per unit of seed, not per field. That hides the decision this piece is about. A grower who takes the premium seed treatment on every bag pays the same on a field that has grown soybeans every other year since the 1990s as on a field breaking out of a decade of corn or pasture. The evidence says those two fields are close to opposite cases. Ask the seed rep to price the treatment as separate lines per field before the order is final. Most can, and some will quote the base inoculant and the premium stack separately.
2. Fields with soybean history: the independent record
What's new: Six independent U.S. programs have tested inoculant on fields with soybean history or on typical rotation ground, in replicated plots or on-farm strips. The newest is the largest: a 2022–2023 trial at 103 site-years in 22 states, run to a standard protocol by 28 land-grant agronomists, which tested the commercial biostimulant seed treatments farmers actually buy, some of them containing Bradyrhizobium (Colet et al., Field Crops Research, Dec 2, 2025).
Evidence:
| Program | Seasons | Where | Trials | What it found on history fields |
|---|---|---|---|---|
| de Bruin et al., Crop Science | 2000–2008 | IN, IA, MN, NE, WI | 73 (51 products) | Response not different from zero at 63 of 73 |
| Furseth et al., Crop Science | 2009–2010 | WI | 18 environments | No response overall; positive at 3 |
| Ohio State | 2013–2014 | OH | 27 | +1.5 bu/acre average, at 70% confidence |
| UNL on-farm research | 1992–2016 | NE | 17 | Positive in 1 of 17 |
| Carciochi et al., Scientific Reports | — | 4 states | 11 environments | No effect of seed or added soil inoculation |
| Colet et al., Field Crops Research | 2022–2023 | 22 states | 103 site-years | No significant yield difference from biostimulant seed treatments; Bradyrhizobium products significant at "a few locations" |
Sources: de Bruin et al., Crop Science 50:265–272, Jan 2010; Furseth, Conley and Ané, Crop Science 52:339–344, 2012; Ohio State University Agronomic Crops Network, "Rhizobium Inoculation," and Lindsey and Karhoff, C.O.R.N. Newsletter 2020-05, May 2020; Mueller et al., UNL CropWatch, Apr 6, 2017; Carciochi et al., Scientific Reports, Dec 27, 2019; Colet et al., Field Crops Research 334:110170, Dec 2, 2025, and University of Minnesota Extension, Jan 7, 2026. The Colet summaries read do not report field history site by site.
The best-documented result is Ohio's. Across 27 trials on fields with soybean history, inoculant added 1.5 bushels on average, and Ohio State reports that at only 70% confidence, well below the 95% normally used to call a trial result significant (Lindsey and Karhoff, May 2020). The gain may be real, but the data cannot rule out that it is noise. At $13.25, 1.5 bushels is worth about $20 an acre. If that number is right, the base product pays eight times over. The Ohio authors call inoculant "relatively cheap insurance." That is a fair description on their data.
The five-state study is the one that frames the decision best, because it asks the buyer's question directly: what is the probability that inoculant pays for itself? At a soybean price of $0.33 per kilogram (about $9 a bushel), the chance of a break-even return varied widely by state (de Bruin et al., Jan 2010).
| Probability inoculant breaks even, history fields | % | |
|---|---|---|
| Nebraska | 59 | ██████████ |
| Wisconsin | 36 | ██████░░░░ |
| Minnesota | 25 | ████░░░░░░ |
| Indiana | 25 | ████░░░░░░ |
| Iowa | 4 | █░░░░░░░░░ |
Source: de Bruin, Pedersen, Conley, Gaska, Naeve, Kurle, Elmore, Giesler and Abendroth, Crop Science 50:265–272, Jan 2010 (73 experiments, 2000–2008, at $0.33/kg soybeans). Bars scaled so the largest value is ten blocks. The probability of a 2:1 return on the same data fell to 11% in Nebraska, 7% in Indiana, 2% in Wisconsin, 1% in Minnesota and 0.2% in Iowa.
Two things have changed since those trials. Soybeans are about 47% more valuable, $13.25 against about $9, which lowers the break-even. And products have changed. A higher price raises those probabilities somewhat, but without a larger underlying response it is unlikely to turn Iowa's 4% into anything close to an even bet (Crop Root Zone read). Nebraska's 59% is the only state where the base product was close to a coin flip in its favor, and Nebraska's own on-farm strips found one positive result in 17 (Mueller et al., Apr 6, 2017). The authors of the five-state study concluded that inoculants "may not be necessary" in fields where soybeans have already been grown (de Bruin et al., 2010).
Wisconsin's work suggests why. The yield of the uninoculated check rose with the size of the native rhizobia population in the soil, and the inoculated plots did not (Furseth et al., 2012). The likely reading is that where the native population is large, it already does the job, and seed-applied bacteria have to compete with it for nodule sites.
0.19 bushels
What a $2.50 base inoculant has to return at $13.25 November soybeans. On fields with soybean history, one of the six independent programs reported an average gain above it, and only at 70% confidence. (Crop Root Zone arithmetic from UNL, 2026; Brownfield Ag News, Sep 22, 2026; Ohio State, May 2020)
3. The industry dataset, and where a response lives when it does
What's new: The largest pooled dataset on U.S. soybean inoculation was published by authors from inoculant companies: Novozymes BioAg, Novozymes Biologicals, Monsanto BioAg and AMVAC (Leggett et al., Agronomy Journal, May 2017, per Crossref author affiliations). It covered 187 U.S. trials, mostly on soils with soybean history. It is open access under a CC-BY license. It is company data, not an independent trial, and it should be read that way.
Evidence: Across the 187 U.S. trials, inoculation added 60 kg/ha, or 1.67% (Leggett et al., 2017). That is about 0.9 bushels an acre, worth about $12 at $13.25 (Crop Root Zone conversion). The average hides a wide split. As summarized in a later peer-reviewed study, the response in the Leggett data was 14% in U.S. areas with low yield potential and 0.6% in areas with high yield potential (Sartori et al., European Journal of Agronomy, 2023, citing Leggett et al., 2017). The U.S. response was also largest in late-planted soybeans and in soils with pH above 6.8 (Leggett et al., 2017).
That pattern is consistent with the independent work. Carciochi and colleagues, from Kansas State, Minnesota, Purdue, South Dakota State and other universities, found no benefit from seed or added soil inoculation "in soils with previous soybean history and under non-severe stress conditions" (Carciochi et al., Dec 27, 2019). The industry and university data agree that a response, where there is one, comes from stress: a late planting, a poor environment, or conditions that have reduced the native population. They disagree on how often that happens, which is what separates a 0.9-bushel average from a zero one.
The 103-site-year study shows how much the premium stack adds. The products were added on top of a standard fungicide and insecticide seed treatment, with 8 to 10 commercial biostimulants tested per state. There were no significant yield differences in either year, either across all environments or within any of the four environmental clusters (Colet et al., Dec 2, 2025). The authors found that row spacing, seeding rate, foliar insecticide and tillage moved yield more than any seed-applied biostimulant they tested. Minnesota Extension's summary quotes the lead researcher: "nothing worked anywhere." It adds that the only hint of a response came from Bradyrhizobium products at a few locations, which it says fits decades of existing agronomic knowledge rather than any new biostimulant claim (University of Minnesota Extension, Jan 7, 2026).
| Claim | Who measured it | Result on history fields | Weight to give it |
|---|---|---|---|
| Base inoculant adds ~0.9 bu | Inoculant companies, 187 trials | +1.67%, concentrated in low-yield and late-planted sites | Company data; upper end |
| Base inoculant adds ~1.5 bu | Ohio State, 27 trials | +1.5 bu at 70% confidence | Independent; best case |
| Base inoculant adds ~0 | Five-state, WI, NE on-farm, four-state | Mostly not different from zero | Independent; the central case |
| Premium stack adds yield beyond base | 28 land-grant agronomists, 103 site-years | No significant difference | Independent; the largest test |
Sources: Leggett et al., Agronomy Journal 109(3):1031–1038, May 2017; Lindsey and Karhoff, May 2020; de Bruin et al., 2010; Furseth et al., 2012; Mueller et al., 2017; Carciochi et al., 2019; Colet et al., Dec 2, 2025. "Weight" is Crop Root Zone's editorial assessment.
Ground Truth: The premium stack is sold as an upgrade to the inoculant, but the independent data show two separate products. One is rhizobia, which has a small, stress-dependent and occasionally measurable response. The other is everything added on top of it, which has now been tested at 103 site-years without a significant response. Pay for the first where a field meets a trigger. Do not pay for the second on the strength of the first. The spread between an estimated $6 to $8 stack and a $2.50 base product is $3.50 to $5.50 an acre, which on 1,000 acres of rotation soybeans is $3,500 to $5,500 a year buying an effect the largest public trial could not find.
4. New ground, long-absent ground, and the triggers that change the answer
What's new: The answer reverses on fields with no soybean history. In Manitoba Pulse & Soybean Growers trials run from 2014 to 2016, inoculation raised yield by 15 bushels an acre on five site-years without soybean history and did nothing significant on four site-years with it (Manitoba Pulse & Soybean Growers, final report, Apr 18, 2018). The recommendation was double inoculation, a seed-applied liquid plus a granular in-furrow product, on fields with little soybean history, and single inoculation only after two soybean crops had nodulated well. The trials found that about 10 nodules per plant at R4 gave 90% of maximum yield. North Dakota State encourages the same double inoculation on fields planted to soybeans for the first time (NDSU Extension, Soybean Production Field Guide).
Evidence: At $13.25, 15 bushels is worth about $199 an acre. Against a double-inoculation program at an estimated $10 an acre, that is roughly a 20:1 return (Crop Root Zone arithmetic; the Manitoba trials were priced in Canada, and only the bushel response is carried over here). Nebraska Extension is more cautious and says gains of 1 to 10 bushels are the more realistic expectation on new ground (Mueller, Elmore and Shapiro, UNL CropWatch, Apr 3, 2015). Even the low end of that range clears a double-inoculation program. On a first-year field, inoculant is not a hedge. It is part of planting the crop.
The harder cases are in between. University guidance names the conditions under which a field with some soybean history should be treated more like new ground:
| Field condition | Guidance | Source |
|---|---|---|
| Never in soybeans | Inoculate; double inoculation encouraged | NDSU; Manitoba Pulse & Soybean Growers |
| No soybeans in 3–5 years | Most university guidelines say inoculate | UNL CropWatch, Apr 3, 2015 |
| Soybeans within the past 3 years | Native population should be sufficient | Lindsey and Karhoff, Ohio State, May 2020 |
| Soil pH below 6.0 | Nodule formation starts to suffer | UNL CropWatch, Apr 3, 2015 |
| Sandy soil, drought, high pH or salinity | Lower rhizobia populations | UNL CropWatch, Apr 3, 2015 |
| Flooded more than a week | Survival can fall, but do not assume a response | UNL CropWatch, Apr 3, 2015 |
| Flooded three weeks or more (Wisconsin) | No yield response to inoculant | Lindsey and Karhoff, May 2020, citing Wisconsin research |
| Eastern Ohio acid soils | Lime to pH above 6.5 first | Ohio State Agronomic Crops Network |
Sources as listed in the table. Guidance is extension agronomy, not trial-by-trial yield data.
The flooding evidence cuts against intuition. Every wet spring prompts the argument that the rhizobia "drowned." Wisconsin's fields flooded three weeks or more showed no yield response to inoculant, and populations stayed adequate unless the flood left a layer of soil from somewhere else (Lindsey and Karhoff, May 2020). Nebraska's advice is the same: do not assume a response after a flood (UNL CropWatch, Apr 3, 2015).
One more item belongs in the seed order. When inoculant is applied at the seed plant rather than at the planter, live bacteria ride on the seed from treatment to planting. A four-year Brazilian program found in the laboratory and greenhouse that inoculating seed 30 days before sowing, and some fungicide seed treatments, cut the number of bacteria that survived on the seed. In six field trials, nitrogen fixation was not measurably affected. But thousand-grain weight was lower with 30-day pre-inoculation than with inoculation 3 hours before sowing, and one fungicide combination reduced yield (Sartori et al., European Journal of Agronomy, 2023). That work was done on Brazilian soils and strains. The direction is the relevant point: on-seed survival is a shelf-life question, and the label's planting window is part of what the grower buys.
Ground Truth: Build the 2027 inoculant plan from the rotation record, not from the seed catalog. Sort every soybean field into three classes. New or long-absent (never in soybeans, or no soybeans in four or more years): double-inoculate, and treat it as part of the seed cost; the return is measured in tens of bushels. Triggered history (soybeans two to three years ago, but pH below 6.0, sandy, late planting likely, or a poor stand environment): the $2.50 base product is a defensible hedge, because its 0.19-bushel break-even is about where the stress-condition data start to show a response. Established rotation (soybeans every other year on productive, near-neutral ground): the independent record says the expected return is close to zero, so skip the premium stack, and treat the base product as optional. On a typical Corn Belt operation most acres fall in the third class, which means most of the inoculant budget is currently being spent where it is least likely to return. The 5% acreage swing into soybeans this year is also the reason to check the first class carefully: some fields entering 2027 soybeans have not seen the crop in years.
References
- University of Nebraska–Lincoln, Center for Agricultural Profitability, "2026 UNL #059 Soybeans, Dryland, Conv. Till after Corn (Roundup Ready 2)," Economic Enterprise Budget, 2026 — https://cap.unl.edu/sites/unl.edu.ianr.agecon.center-for-ag-profitability/files/media/file/%23059%20Soybeans%2C%20Dryland%2C%20Conv.%20Till%20after%20Corn_2026.pdf
- Brownfield Ag News, "Closing Grain and Livestock Futures: September 22, 2026," Sep 22, 2026 — https://www.brownfieldagnews.com/market-news/closing-grain-and-livestock-futures-september-22-2026/
- USDA National Agricultural Statistics Service, Acreage report news release, Jun 30, 2026 — https://www.nass.usda.gov/Newsroom/2026/06-30-2026.php
- Mueller, N.; Elmore, R.; Shapiro, C.; Brhel, J.; Thompson, L., "Making Data-Driven Decisions on Soybean Inoculation," UNL CropWatch, Apr 6, 2017 — https://cropwatch.unl.edu/2017/making-data-driven-decisions-soybean-inoculation
- Colet, F.; Mourtzinis, S.; Vann, R.; Naeve, S.; Conley, S.P.; et al. (28 authors), "Commercial biostimulant seed treatments showed minimal impact on soybean seed yield across the United States," Field Crops Research 334:110170, Dec 2, 2025, doi:10.1016/j.fcr.2025.110170 — https://www.sciencedirect.com/science/article/pii/S0378429025004356
- University of Minnesota Extension, "Do biostimulant seed treatments boost soybean yields? New study across 103 locations in 22 states says no," Minnesota Crop News, Jan 7, 2026 — https://blog-crop-news.extension.umn.edu/2026/01/do-biostimulant-seed-treatments-boost.html
- de Bruin, J.L.; Pedersen, P.; Conley, S.P.; Gaska, J.M.; Naeve, S.L.; Kurle, J.E.; Elmore, R.W.; Giesler, L.J.; Abendroth, L.J., "Probability of Yield Response to Inoculants in Fields with a History of Soybean," Crop Science 50(1):265–272, Jan 2010, doi:10.2135/cropsci2009.04.0185 — https://experts.umn.edu/en/publications/probability-of-yield-response-to-inoculants-in-fields-with-a-hist/
- Furseth, B.J.; Conley, S.P.; Ané, J.-M., "Soybean Response to Soil Rhizobia and Seed-applied Rhizobia Inoculants in Wisconsin," Crop Science 52:339–344, 2012, doi:10.2135/cropsci2011.01.0041 — https://acsess.onlinelibrary.wiley.com/doi/10.2135/cropsci2011.01.0041
- Ohio State University, Agronomic Crops Network, "Rhizobium Inoculation" (undated) — https://agcrops.osu.edu/node/4334
- Lindsey, L.; Karhoff, S., "Rhizobia Inoculant Following the 2019 Season," C.O.R.N. Newsletter 2020-05, Ohio State University, May 2020 — https://agcrops.osu.edu/newsletter/corn-newsletter/2020-05/rhizobia-inoculant-following-2019-season
- Carciochi, W.D.; Moro Rosso, L.H.; Secchi, M.A.; Torres, A.R.; Naeve, S.; Casteel, S.N.; Kovacs, P.; Davidson, D.; Purcell, L.C.; Archontoulis, S.; Ciampitti, I.A., "Soybean yield, biological N2 fixation and seed composition responses to additional inoculation in the United States," Scientific Reports, Dec 27, 2019, doi:10.1038/s41598-019-56465-0 — https://openprairie.sdstate.edu/plant_faculty_pubs/378/
- Leggett, M.; Diaz-Zorita, M.; Koivunen, M.; Bowman, R.; Pesek, R.; Stevenson, C.; Leister, T., "Soybean Response to Inoculation with Bradyrhizobium japonicum in the United States and Argentina," Agronomy Journal 109(3):1031–1038, May 2017, doi:10.2134/agronj2016.04.0214 (CC-BY; author affiliations per Crossref record) — https://acsess.onlinelibrary.wiley.com/doi/10.2134/agronj2016.04.0214
- Sartori, F.F.; Engroff, T.D.; et al., "Potentially harmful effects of seed treatment and pre-inoculation on soybean biological nitrogen fixation and yield," European Journal of Agronomy 142:126660, 2023, doi:10.1016/j.eja.2022.126660 — https://www.alice.cnptia.embrapa.br/alice/bitstream/doc/1150746/1/a-Potentially-harmfull-2023-EURAGR-Pre-Inoculatin-seed-treatment-Sartori-etal.pdf
- Manitoba Pulse & Soybean Growers, "Soybean Inoculant Trial" (2014–2016), final report Apr 18, 2018 — https://www.manitobapulse.ca/research-project/soybean-inoculant-trial/
- North Dakota State University Extension, "Soybean Production Field Guide for North Dakota," A1172 — https://www.ndsu.edu/agriculture/extension/publications/soybean-production-field-guide-north-dakota
- Mueller, N.; Elmore, R.; Shapiro, C., "Inoculating Your Soybeans: When, Where, Why?" UNL CropWatch, Apr 3, 2015 — https://cropwatch.unl.edu/soybean-inoculation-when-where-and-why/
Disclosures
Crop Root Zone is an independent publication. Nothing here is investment advice. Market calls, where included, reflect the editors' own read and are not a recommendation to buy or sell any security.
Discussion
This issue prices five inputs as bushel hurdles, from a fifth of a bushel for a soybean inoculant to about six for polymer-coated urea, and finds that the replicated trials mostly clear the hurdle only on particular soils and in particular seasons. So: which input on your 2027 booking sheet are you buying without your own check strip, what is it costing per acre, and on what kind of ground? If you have run a strip trial of any of them (a stabilizer, a coated nitrogen, a humic product, an inoculant, a seed treatment), tell us the yield difference, how many replications you had and whether you would run the product again.
Corrections are as welcome as answers. If you check our arithmetic against a primary source and find we have it wrong, tell us. The sharpest replies get answered in next week's Letters & Responses.