Issue 10 · 2026-09-21
Most of the prices in this issue have barely moved, and that is the story. Retail UAN32 has held a $10 band for nine DTN surveys, and retail potash a $11 band for fourteen. Retail DAP is $13 higher than in the week the Moroccan duty meant to lower it was suspended. Behind each flat line the wholesale market moved: world urea rose 12% in a month, the New Orleans potash barge climbed from about $305 to $340, and India is paying about $920 a tonne for DAP on a subsidy that covers $660.
The crop side follows the same pattern. The soybean export book is 45% full ten days into the year, yet interior basis is only a few cents better than last year. A $5.30 harvest price would add $121 an acre to a corn revenue guarantee without moving the yield at which it pays.
Why now: most of this is settled in the next six weeks. India's rabi subsidy is due by October 1, harvest-price discovery runs through October, and fall fertilizer will move north on the same short tows as the crop. We tried to show what each flat number rests on before those dates arrive.
— Crop Root Zone, Editorial Desk.
Letters & Responses
No reader correspondence reached us this week. Email is the only way to write to this publication, and nothing on RZ-009 arrived in the eight days since it went up: no questions, no corrections, no pushback. We would rather say so than invent a letter.
Three items stay on the record.
RZ-009's closing question is still open. We asked whether you are running your fall tillage pass, cutting it back or dropping it, and what you are paying per gallon for delivered dyed diesel compared with last September. The question has become more pressing since then. Midwest on-highway diesel rose again, from $5.946 a gallon in the week of September 7 to $6.250 in the week of September 14 (U.S. Energy Information Administration, accessed Sep 21, 2026).
RZ-008's question on stabiliser pricing is also unanswered. We asked what you are quoted for a fall anhydrous stabiliser per acre, and whether it is priced per acre, per ton of product or bundled into application.
The standing question on nitrogen hedging remains open. A reader wrote to RZ-004 that a grower has no practical way to hedge a nitrogen bill the way grain can be hedged. Nothing has changed. This issue's nitrogen feature adds another example: retail UAN32 has barely moved in two months while world urea rose 12% in a single month. The correspondent asked to remain anonymous and remains so.
Corrections, disagreements and quotes from your own operation are all welcome by email. We answer the sharpest ones here the following week.
In This Issue
This week's features, by department.
- UAN32 and Urea Cost $0.714 and $0.715 a Pound of Nitrogen. UAN32 Has Not Left a $10 Band in Nine Surveys, While World Urea Rose 12% in a Month.DTN's Sep 7–11 survey puts retail UAN32 at $457 a ton and urea at $658, the same nitrogen to within 0.11 cents a pound, or 20 cents an acre at 180 pounds. UAN32 has printed between $455 and $465 in every survey since mid-July, which fits a producer UAN fill book that CF Industries says averaged close to $300 a ton and runs into November. Over the same stretch world urea rose 12% in the month to Sep 18 and the Tampa ammonia contract fell $80. Anhydrous is still the cheapest nitrogen at $0.57 a pound and the only one agronomists back for fall application. The spring choice between UAN32 and urea is a tie today, and the two wholesale markets behind them are now moving in opposite directions.
- China Reopened Phosphate Exports on September 1 Under License. India Is Paying $920 a Tonne for DAP, and Its Subsidy Covers $660.Beijing's March 14–August 31 export freeze has given way to a license-plus-quota regime with no published volume, and Chinese 64% DAP sits about $190/t below Indian delivered values, so every licensed tonne will go out. Last year's precedent, a 3 million tonne quota, did not stop world DAP rising 14% in a quarter. The number that moves the fall floor is India's. At ₹95.89 to the dollar, today's Kharif support package pays an importer back only up to a $660/t CFR cargo, while the market is at $900–935. India drew its DAP stocks down from 25.17 to 16.52 lakh tonnes rather than import at that price. To make a $920 cargo break even before port costs, the rabi phosphorus rate due for Oct 1 would have to go from ₹52.76/kg to about ₹107/kg. Whether New Delhi pays that gap or buys less is what decides whether NOLA's $802.50/st holds this autumn.
- Retail Potash Averages $494 a Ton and the Barge at New Orleans Is $340. That $154 Gap Is $30 Narrower Than in March, Because Wholesale Rose 11% While Retail Rose 1%.DTN's Sep 7–11 survey put national retail potash at $494 a ton, inside the $484–$495 band it has held for fourteen consecutive survey weeks. The last public NOLA barge print was $340/st FOB on Aug 20, against $300–$310 in late March, and Corn Belt warehouse references were $375–$390/st FOB in mid-July. That puts the retail-over-barge spread near $154 a ton, about 45%, against $184 and 60% in March — compression that came entirely from the wholesale end rising, not from the retail number falling. Mosaic realized $275 a tonne for MOP FOB mine in the second quarter and Nutrien $267, so roughly $90 a short ton separates the mine from the barge and another $154 separates the barge from the farm gate. At 150 lb K2O an acre the whole fourteen-month retail range is worth $1.38 an acre, while the gap between the cheapest and dearest Illinois distributor ask on Sep 4 was worth $11.25.
- Washington Suspended the 16.60% Moroccan Phosphate Duty on July 8. Ten Weeks Later Retail DAP Is $923/st — $13 Higher Than the Week It Was Signed.A June 29 emergency proclamation under Section 318 of the Tariff Act let OCP ship into New Orleans duty-free for the first time since 2021, and 54,000 t landed within weeks. USDA put the relief at up to 22% off phosphate costs and $1.82 billion a year across 97 million acres — $18.76/acre. DTN's retail DAP average has instead gone from $910/st in the survey week of June 29–July 2 to $923/st on September 7–11, with MAP at $962/st. The reason is that the duty stopped being the binding constraint some time ago: NOLA barge DAP has been clearing below Indian and Latin American CFR values all year, US tonnes are moving out as exports rather than in as relief, and the Russian orders that cover the other half of the case are still fully in force at 12.71% to 23.77%. At the 64 lb P2O5/acre USDA's survey data show corn actually receives, fall DAP costs $64.21/acre — 13.4 bu of $4.80 corn.
- Europe Imported 1.32 Million Fewer Tonnes of Urea Since October. Russian Cargoes Account for 1.31 Million of It.Ten months of Eurostat trade data spanning the start of the EU's carbon border charge show urea from every origin except Russia and Belarus holding at 3.88 million tonnes, against 3.89 million a year earlier. CBAM pulled about 1.2 million tonnes of that buying forward into a December rush and put a premium of roughly $45–58 a tonne on French urea, but it has not shrunk Europe's non-Russian supply. The tonnage Europe lost is Russian, it began leaving with the tariffs of July 2025, and it is landing in the U.S., which took a record 480,287 tonnes of Russian urea in April and 72% of its May urea imports from Russia.
- The Soybean Export Book Is 45% Full Ten Days Into the Year. In 2022 It Was 44.5% Full, and That Year Finished 105 Million Bushels Short.2026/27 soybean export commitments reached 758 million bushels on September 10, double a year ago and against a five-year norm of about 35% of USDA's September forecast, with China holding 48% of the book. Early pace has not predicted the full-year export number in any of the last five years. What it does predict is fall shipping, and so far the pull has shown up as a wider Iowa-to-Gulf spread rather than a stronger country basis. Central Illinois beans are bid 8 cents better against November than a year ago, and a 30-cent November-to-May carry covers just over half the interest on a $13 bushel.
- A Kansas Winter Wheat Acre Repriced to September Retail Costs $311 and Breaks Even at 41.7 Bushels. Three of the Last Ten Kansas Crops Came In Under That.We rebuild K-State's November 2025 South Central Kansas continuous-wheat budget line by line at this month's retail. Nitrogen at DTN's $0.72/lb N adds $14.30 an acre; phosphate priced off $923/st DAP with the nitrogen credited back gives $3.32 of it straight back, so the fertilizer bill rises only $10.98 and total cost goes from $295.26 to $311.01 — up 5.3%, and less than three-quarters of that increase is fertilizer. Against a July 2027 KC contract at $8.11 on September 4 and Oklahoma basis of 55 to 70 cents under, the acre breaks even at 41.7 bu on full cost and 27.1 bu over direct costs alone, versus a Kansas ten-year average of 45.8 and a K-State budgeted yield of 37. In K-State's own November numbers the same South Central acre returns $202.44 above total cost in grain sorghum and $101.26 in corn, against −$93.61 in wheat. And the Small Grains Summary that fixes the 2026 baseline does not print until September 30 — after most of this drill work is done.
- A $5.30 Harvest Price Adds $121 an Acre to an 85% Corn Guarantee. It Adds Zero Bushels — the Indemnity Still Doesn't Trigger Until 178.5.RMA set the 2026 projected prices at $4.62 for corn and $11.09 for soybeans off February settlements; on September 17 December corn closed at $5.30½ and November beans at $13.19¾, with the October 1–31 harvest-price discovery window still to open. On a representative 210 bu/acre central Illinois corn farm at 85% Enterprise Unit coverage, an October average of $5.30 lifts the revenue guarantee from $824.67/acre to $946.05/acre — but because actual revenue is valued at the same harvest price, the yield that triggers an indemnity stays at 178.5 bu/acre in both cases. USDA's September 11 Crop Production put Illinois corn at 209.0 bu/acre, so that farm needs a 14.6% yield collapse from where it is tracking before a dollar is paid. We run the trigger yield across five October scenarios from $4.20 to $5.60, price the Harvest Price Exclusion at 22.9 bu/acre of forgone trigger, and show what the 85% upgrade actually buys in bushels. The October average is not yet known and nothing here asserts one.
- The H-2A Wage Rewrite Cut an Iowa Grain Farm's Seasonal Labor Bill by About $5 an Acre and a Washington Apple Orchard's by $345 to $1,150. A Federal Court Has Now Put Both Savings on Notice for Backpay.The October 2025 rule dropped entry-level H-2A wages by $4.93 to $6.45 an hour in the largest H-2A states and the Corn Belt. For a 2,000-acre Iowa corn-soybean farm using two seasonal workers, that is $5.13 an acre, or 0.64% of total cost, and almost nothing if the job requires experience. For Washington Honeycrisp, where labor is 18% of cost, the state minimum wage caps the cut at $2.69 an hour. On Aug 26 a court found the method unlawful, and the rates in force since Sep 2 could be trued up.
- A Quarter-Point Rate Move Is Worth About $1 an Acre on a 2027 Illinois Corn Crop. The Budget Projects a $36 Profit.Midwest farm operating loans averaged 7.12% at the end of June, 135 basis points below mid-2024 but no longer falling. Financing the $579 of direct costs in farmdoc's 2027 central Illinois corn budget from a fall fertilizer draw to a November 2027 payoff costs about $28.60 an acre at that rate, and each 25 bp adds or removes about $1.00 — roughly 3% of the projected $36 farmer return. The Fed's Sept. 16 decision was pending at writing, but rates, loan demand and bank liquidity were already moving against borrowers.
- At $1.48 Propane, a Late-September Day of Field Drydown Saves About $4.40 an Acre. By Late October It Saves $1.90, and Above 21% Moisture the Dryer Sets the Harvest Pace.Iowa farm propane averaged $1.48 a gallon on September 18, which puts owned-dryer energy near 2.8 cents per bushel-point. At extension drydown rates, waiting a day in late September pays unless a field is losing more than about 0.5% of its yield a day, a bar healthy October corn clears easily and stalk-rotted corn may not. A dryer's wet-corn capacity roughly halves between 20% and 25% moisture, so the useful decision is which fields get the dryer, not whether to run it.
- 818 Percent of Tariff Times a $3.99 Benchmark Is $32.64 a Ton, or 91.4 Cents on a Bushel of Corn Out of St. Louis. The Memphis Gauge Is at −1.3 Feet, Not −11.91.USDA AMS priced downbound freight out of St. Louis at 818.1 percent of tariff for the week ending September 15 — $32.64/ton, 91.4 cents per bushel of corn, the highest mid-September print in five years and 110 percent above July 7. But this is not 2022: the Memphis gauge read −1.3 feet on September 17 against a record −11.91 feet in October 2023, and a major carrier on the system has cut tow size 13 percent while leaving loading drafts unrestricted from the Gulf to Cairo. We convert percent-of-tariff into cents per bushel, chain it through the CIF NOLA export bid — where the October corn basis is 22 cents stronger than nearby while freight is only 4.6 cents higher — and then run the same arithmetic backwards on the northbound leg, where fall fertilizer is bidding for the same shortened tows. August upbound fertilizer through Mississippi Lock 27 ran 548,800 short tons, in line with 2025; the October restock is the number actually at risk, and in the 2022 low-water autumn it came in at 465,400 tons against 928,700 two years later.
- Hired Drones Now Cost About What a Plane Costs. Owning One Beats Hiring Only Past About 1,000 Acres a Year, and Tariffs and Insurance Can Push That Past 2,300.In the first university custom-rate surveys to list drones, Iowa operators charged an average $12.50 an acre, against $12.00 for a plane and $9.35 for a self-propelled ground rig. Ohio and Nebraska drone averages ran $15 to $15.17. On Missouri's cost inputs, an owned drone matches Iowa's hired rate at about 970 acres a year. Double the drone price for the new 100% tariff and add full insurance, and the crossover moves to about 2,400 acres. The base-case break-even is about what one drone can spray in a single fungicide window. The case holds best for fungicide and insecticide passes on tall corn, wet ground and late soybeans, not for herbicides.
- A 40-Foot Tile Job Now Costs About $1,470 an Acre and Needs 24 Bushels of Corn a Year to Carry at 6.8%. Iowa's Most Conservative Trial Measured 13.Built from Iowa State's 2026 custom tiling rate, NC State's per-foot costs and a plastic pipe index up 4.6% in a year, pattern tile runs roughly $780 to $2,370 an acre depending on spacing. At farmdoc's $5.00 corn and $12.00 soybeans and a 6.79% land-loan rate, a 40-foot job pays back in about 18 years on somewhat poorly drained ground and never on the 13-bushel corn response Iowa State measured over nine years. Wider spacing, full expensing and controlled drainage change the math more than this fall's pipe price does.
- In-Furrow Iron Chelate Needs 1.5 Bushels to Pay on Chlorosis Ground. Minnesota's Trials Gave a Tolerant Soybean 2.2 and a Susceptible One 9.9.In University of Minnesota strip trials, in-furrow Fe-EDDHA added about 10 bushels to an IDC-susceptible soybean under severe chlorosis and about 2 to a tolerant one. At $12 soybeans and an estimated $6 a pound for the chelate, 3 pounds needs 1.5 bushels, so it clearly pays only on the susceptible variety. That variety is also the one a grower should not plant on severe ground: untreated, the tolerant soybean still out-yielded the treated susceptible one. On a tolerant variety, 50,000 extra seeds and the chelate each rescued a hotspot, and paying for both did not add yield. The decision that sets the IDC bill is the variety-by-zone map, and it is made with this fall's seed order.
- A Biosolids Application Now Replaces About $190 an Acre of Fertilizer. On Average Cropland, That Pays Only If the Chance of a PFAS Write-Off Stays Below About 3%.At September 2026 DTN retail prices, a dry ton of digested biosolids replaces about $63 of first-year N, P, K and S, up from $39 at 2021 prices. At 3 dry tons an acre that is $190 where the soil needs phosphorus and $91 where it does not. EPA has pulled back to voluntary guidance, while Michigan, Maryland, Virginia, Wisconsin and Pennsylvania converge on 20, 25, 50 and 100 ppb PFOS/PFOA tiers. Farm-level risk is concentrated in the small share of sources above those tiers, and a 12-month test average is the cheapest protection a grower has.
- Low-Carbon Ammonia Earns About $20 a Ton in 2026. A Corn Grower Who Uses It Can Claim None of the 45Z Value It Would Create.In North America, one plant makes certified low-carbon ammonia at scale today: CF's Donaldsonville complex. Blue Point One and Wabash won't start before 2028 or 2029, and Air Products, ExxonMobil, LSB and Nutrien have cancelled or paused their projects. CF says its low-carbon tons earned more than $20 over conventional in the first half. On an Iowa corn acre that works out to about $1.93. If USDA credited the lower footprint under 45Z, it could be worth about $34 an acre before the ethanol plant takes its share. In its June final rule, USDA declined to model blue or green ammonia, so the value a grower can claim in 2026 is zero.
- Short Corn at Bayer's Recommended Seeding Rate Needs 4.7 Bushels Just to Pay for the Extra Seed. Bayer's Own Matched-Year Data Show 2.9.Short-stature corn stands up to wind: in 444 Bayer site-years, 3.8% of short plots took wind damage against 10.6% of tall ones. But in Bayer-funded yield data, short hybrids trailed tall ones by about 7 bushels at normal density and led by about 3 only when planted 10,000 plants thicker. At $3.79 per 1,000 kernels and $4.80 corn, the 6,000 to 8,000 extra seeds Bayer recommends cost 4.7 to 6.3 bushels before any trait premium, which is not yet public. On Bayer's own damage rates, avoided wind loss is worth roughly a bushel a year.
State of the Industry
This week the farm-gate price of fertilizer held still. What it costs to harvest, dry, haul and finance a crop did not.
Retail fertilizer was flat. In DTN's survey for September 7–11, none of the eight major fertilizers moved 5% or more from a month earlier. Six were down about 1%, and DAP and MAP were up about 1% [1]. Anhydrous, at $938 a ton, is 22% dearer than a year ago and still the cheapest nitrogen at $0.57 per pound of N. UAN32, at $457, is the only product below last September [1]. Wholesale markets were not flat. Urea was at $459.50 a tonne on September 18, up 12.1% in a month [2]. DAP was at $802.50, up only 1.3% [3]. The phosphate pressure is coming from sulfur, not from product prices. One major phosphate producer says sulfur now costs well over $1,000 a tonne, against a ten-year average of about $170, and that it accounts for 40% of its input costs [4].
The harvest is running early. On September 20 corn was 13% harvested against an 11% five-year average, and soybeans were 12% harvested against 8%. Corn condition was 57% good to excellent, down from 66% a year earlier. Winter wheat was 17% planted against a 21% average [5]. Futures slipped over the week: December corn closed Friday at $5.27½ and December Chicago wheat at $7.14¼, while November soybeans held at $13.03½ [6][7]. Buying ahead of Thursday's U.S.–China summit lifted Monday's early trade, with corn and soybeans up about 3% and 2% intraday [8][9]. That is a Monday morning, not a trend.
Moving the crop cost more. The U.S. average price of diesel reached a record $6.285 a gallon in the week of September 14, up 31.8 cents in a week and $2.55 on a year earlier [10]. Midwest diesel was $6.250 [11]. Barge freight out of St. Louis was 818% of tariff, or $32.64 a ton, for the week ending September 15. That is 33% above a year ago, and the October market was trading at 860% [10]. The river is carrying a lot: 435,800 tons of grain moved by barge in the week ending September 12, 73% more than a year earlier [10]. Fall fertilizer going north needs the same tows.
Money got dearer too. On September 16 the Federal Reserve raised its target range by a quarter point, to 3.75%–4.00%. It was the first increase since 2023 [12]. Every input bought on an operating line this fall carries that cost.
| Benchmark | Level | Basis | Move |
|---|---|---|---|
| Anhydrous | $938/ton | Delivered retail, Sep 7–11 | −1% MoM; +22% YoY |
| Urea | $658/ton | Delivered retail, Sep 7–11 | −1% MoM; +4% YoY |
| UAN32 | $457/ton | Delivered retail, Sep 7–11 | −1% MoM; −5% YoY |
| Urea | $459.50/t | Futures, Sep 18 | +12.1% m/m |
| DAP | $923/ton | Delivered retail, Sep 7–11 | +1% MoM; +7% YoY |
| DAP | $802.50/t | Futures, Sep 18 | +1.3% m/m |
| Potash | $494/ton | Delivered retail, Sep 7–11 | −1% MoM; +1% YoY |
| Dec corn | $5.27½/bu | CBOT settlement, Sep 18 | −2¾¢ w/w |
| Nov soybeans | $13.03½/bu | CBOT settlement, Sep 18 | +7¢ w/w |
| Corn harvested | 13% | 18 states, wk ending Sep 20 | 5-yr avg 11% |
| St. Louis barge | $32.64/ton | Downbound grain, wk ending Sep 15 | +33% YoY |
| U.S. diesel | $6.285/gal | On-highway retail, wk Sep 14 | +$2.55 YoY |
Sources: DTN/Progressive Farmer, Sep 16, 2026 (retail, Sep 7–11); Trading Economics, accessed Sep 21, 2026 (urea and DAP, Sep 18); Brownfield Ag News, Sep 11 and Sep 18, 2026 (week-on-week moves computed from the two settlements); USDA NASS Crop Progress, Sep 21, 2026; USDA AMS Grain Transportation Report, Sep 17, 2026.
The week's verdict: the retail board stood still while diesel, barge freight and the Fed all raised the cost of getting this crop out and next year's fertilizer in.
References
- DTN/Progressive Farmer, "Fertilizer Prices Continue Lower for 6 of 8 Major Nutrients," Sep 16, 2026. https://www.dtnpf.com/agriculture/web/ag/crops/article/2026/09/16/fertilizer-prices-continue-lower-6-8
- Trading Economics, Urea, accessed Sep 21, 2026. https://tradingeconomics.com/commodity/urea
- Trading Economics, Di-ammonium Phosphate, accessed Sep 21, 2026. https://tradingeconomics.com/commodity/di-ammonium
- Brownfield Ag News, "Tight global sulfur supplies continue to drive fertilizer prices," Sep 14, 2026. https://www.brownfieldagnews.com/news/tight-global-sulfur-supplies-continue-to-drive-fertilizer-prices/
- USDA National Agricultural Statistics Service, Crop Progress, Sep 21, 2026. https://release.nass.usda.gov/reports/prog3826.pdf
- Brownfield Ag News, "Closing Grain and Livestock Futures: September 18, 2026." https://www.brownfieldagnews.com/market-news/closing-grain-and-livestock-futures-september-18-2026/
- Brownfield Ag News, "Closing Grain and Livestock Futures: September 11, 2026." https://www.brownfieldagnews.com/market-news/closing-grain-and-livestock-futures-september-11-2026/
- UPI, "Soybeans test prospects for stable U.S.-China trade," Sep 17, 2026. https://www.upi.com/Top_News/World-News/2026/09/17/china-soybean-purchases/4421789590419
- Trading Economics, Corn and Soybeans, intraday, accessed Sep 21, 2026. https://tradingeconomics.com/commodity/corn ; https://tradingeconomics.com/commodity/soybeans
- USDA Agricultural Marketing Service, Grain Transportation Report, Sep 17, 2026. https://www.ams.usda.gov/sites/default/files/media/GTR09172026.pdf
- U.S. Energy Information Administration, Midwest (PADD 2) Gasoline and Diesel Retail Prices, accessed Sep 21, 2026. https://www.eia.gov/dnav/pet/pet_pri_gnd_dcus_r20_w.htm
- Board of Governors of the Federal Reserve System, FOMC statement, Sep 16, 2026. https://www.federalreserve.gov/newsevents/pressreleases/monetary20260916a.htm
Weekly Briefing
Fertilizer
No retail fertilizer moved 5% in a month — DTN's survey for September 7–11 found six products down about 1% and DAP and MAP up about 1%. None of the eight made what DTN counts as a significant move. Against a year ago, anhydrous is up 22% at $938 a ton, and UAN32, at $457, is the only product cheaper than last September. (DTN/Progressive Farmer, Sep 16, 2026)
Saudi Arabia orders technology for two giant urea trains — Maire's Nextchem, through its licensor Stamicarbon, won a package worth about €125 million ($144 million) for SABIC Agri-Nutrients' SAN-7 project at Al Jubail. The project has two urea units of 3,850 tonnes a day each. That is export-scale capacity, and it would come on in the region whose shipping lanes set this year's nitrogen price. (TradeArabia; World Fertilizer, Sep 15, 2026)
Europe's largest industrial carbon capture plant opens at an ammonia site — Yara's Sluiskil complex in the Netherlands will capture up to 800,000 tonnes of CO₂ a year from ammonia production. The CO₂ will be shipped to Norway and stored under the seabed, about 12 million tonnes over 15 years. It is the first complete cross-border capture-and-storage chain. (Yara International, Sep 7–8, 2026)
Cargill opens a blending plant in Uruguay — Cargill inaugurated a new fertilizer facility at Nueva Palmira, a US$5 million investment built around faster dispatch and more uniform blends, including micronutrient formulations. (World Fertilizer, Sep 14, 2026)
Crops
Harvest runs ahead, crop condition trails last year — On September 20 corn was 13% harvested (five-year average 11%) and soybeans 12% (average 8%). Corn was rated 57% good to excellent, against 66% a year earlier. Winter wheat was 17% planted, behind the 21% average. (USDA NASS, Crop Progress, Sep 21, 2026)
China buys ahead of Thursday's summit — Chinese buyers took about 1 million tonnes of U.S. soybeans in one week ahead of the September 24 Trump–Xi meeting in Washington, which leaves them close to halfway to the 25-million-tonne annual commitment. A 10% Chinese tariff on U.S. farm goods remains in place. (UPI, Sep 17, 2026)
Futures slip into the weekend — On September 18 December corn settled at $5.27½ (−3¢), November soybeans at $13.03½ (−16¼¢) and December Chicago wheat at $7.14¼ (−12¾¢). October soybean meal fell $14.10. (Brownfield Ag News, Sep 18, 2026)
Iowa lifts harvest weight limits to 90,000 pounds — Until October 10, Iowa is waiving weight limits and permits for vehicles up to 90,000 pounds gross carrying grain, fertilizer (dry, liquid and gas), manure and distillers grains on state highways. Interstates are excluded. The Iowa Corn Growers Association puts the saving at 13 truckloads for a 500-acre corn farm. (USDA AMS, Grain Transportation Report, Sep 17, 2026)
Home & Garden
September is the month for the lawn — University of Missouri Extension recommends one pound of nitrogen per 1,000 square feet this month and potassium only if a soil test shows a shortage. Phosphorus should go on only when a test calls for it. Mid-September is the seeding window. Sweep any granules off the driveway and back onto the grass, where they do some good instead of washing into a storm drain. (Fulton Sun, Sep 19, 2026)
Keep the dog out of the green water — Cyanobacteria blooms, which are more common in warm water carrying excess nutrients, can kill a dog within hours. Dogs gulp water while swimming and then lick their coats. Researchers advise checking local bloom alerts and avoiding water with scum or a bad smell. (Florida International University, via Phys.org, Sep 17, 2026)
Where did Britain's wasps go? — Wasps were unusually scarce in Britain this summer. A UCL behavioural ecologist points to spring temperature swings that may have killed queens, and to heatwaves that pushed ground temperatures past 50°C, above the insects' roughly 45°C limit. Gardeners may not miss them, but wasps are pest controllers and pollinators. (The Conversation, via ScienceDaily, Sep 11, 2026)
Micronutrients
Sulfur is the input that is costing phosphate producers — A major U.S. phosphate producer says sulfur has gone from a ten-year average of about $170 a tonne to well over $1,000. It now accounts for 40% of the company's input costs, production has been idled in Brazil and Louisiana, and analysts expect high prices to last 12 to 18 months. Sulfur-bearing products carry that cost to the farm. (Brownfield Ag News, Sep 14, 2026)
North Dakota publishes IDC scores for 90 soybean varieties — After a cool, wet season in which iron deficiency chlorosis was widespread in central North Dakota, NDSU rated 90 Enlist, GT27, Roundup Ready, Xtend and conventional varieties on a 1–5 scale at three growth stages. The extension agronomist calls choosing a tolerant variety the first step in managing IDC. The scores arrive in time for 2027 seed orders. (NDSU Extension, via Morning Ag Clips, Sep 8, 2026)
Organics
Whole Foods says organic has a supply problem, not a demand problem — CEO Jason Buechel put U.S. organic sales at $76.6 billion in 2025 and said the market could add $24 billion by 2030. He also said certified acreage has fallen about 2 million acres since 2021, to 7.2 million, which pushes retailers toward imports. (FoodNavigator-USA, Sep 18, 2026)
Health secretary offers organic "anything and everything" — Speaking at the Organic Trade Association's Organic Week in Washington, HHS Secretary Robert F. Kennedy Jr. pledged support for the organic sector, even as other administration policies favour regenerative agriculture. (FoodNavigator-USA, Sep 17, 2026)
Certification cost-share deadline is December 31 — USDA's Organic Certification Cost Share Program, funded in July after delays, reimburses 75% of certification costs up to $750 per scope. Applications for both program years are due by December 31 through local FSA offices. (Organic Farmers Association, Sep 6, 2026)
Up and Coming
A soil pH sensor that stays in the ground for months — University of Colorado Boulder engineers report a low-cost printed electrochemical sensor, using alizarin dye, that tracked soil pH continuously for months without frequent recalibration. It worked in sandy, organic-rich, muddy and compacted soils. Research-stage: the paper describes a field-deployable prototype, not a commercial product. (Scientific Reports, via Phys.org, Sep 21, 2026)
Breeding for the next crop in the rotation — University of Queensland researchers found that the mung bean variety grown first could raise the following wheat crop's yield by 45% or cut it in half, and that the effect is heritable. They say they do not yet know what drives it. Early-stage: one rotation pair, mechanism unknown. (Plant Communications and Nature Genetics, via Phys.org, Sep 16, 2026)
Deeper-rooted soybeans are in Corn Belt field trials — Salk Institute scientists have engineered soybeans with deeper, larger roots and are testing them in Illinois, Missouri, Kansas and Iowa, measuring yield, drought resilience and how long the carbon stays in the soil. Their estimate of an extra tonne of CO₂ stored per hectare a year is a projection. Field results are expected this fall. (Phys.org, Sep 18, 2026)
Engineered nitrogen-fixing microbes: two to three years out — Switch Bioworks is running USDA- and EPA-authorized field trials of an engineered microbial fertilizer in six states, aimed first at corn. The company itself says a commercial product is two to three years away. Pre-commercial: no yield-parity data are public. (MIT Technology Review, Sep 1, 2026; World Fertilizer, Sep 16, 2026)
Interesting
A fully automated lettuce farm in Norway — Himmelgrønt's vertical farm near Oslo grows and packs lettuce without anyone touching it from sowing to packaging. The fastest varieties are ready in just over two weeks, and shelf life has gone from 2–4 weeks to about 12. (SINTEF, via Phys.org, Sep 17, 2026)
Forty years of fertilizer use, mapped crop by crop — A University of Minnesota team compiled 800,000 data points into a dataset covering 156 crops from 1980 to 2022. It shows nitrogen rates varying more than tenfold between regions, with high-use parts of Europe and China cutting back while sub-Saharan Africa and Vietnam increase. (Environmental Research Letters, via Phys.org, Sep 15, 2026)
A hidden height gene makes semi-dwarf peanuts — An international team led from Murdoch University sequenced 2,320 peanut lines and found a height gene hidden in a chromosomal rearrangement. A semi-dwarf line bred from the discovery yielded 20% more under dense planting in field trials. (Nature Genetics, via Phys.org, Sep 15, 2026)
Heat before flowering does the most damage to wheat — University of Lleida trials found that heat waves before flowering cut wheat yield more than later ones, by reducing grain number. An early heat wave also primed plants to cope better with a second. (Journal of Experimental Botany, via Phys.org, Sep 18, 2026)
Off the Wall Discovery
A sedge that has sex but produces clones — Plant-breeding researchers in Cologne found that the Brazilian beak-sedge Rhynchospora tenuis makes pollen and seed, yet its offspring are genetically identical to the mother because its meiosis has no DNA crossovers at all. Breeders have long wanted to fix a hybrid so it breeds true from seed, and this plant does it naturally. Basic research: no crop application exists yet. (Nature, via Phys.org, Sep 16, 2026)
A nitrogen-fixing enzyme that works near boiling — A nitrogenase from the deep-sea archaeon Methanocaldococcus infernus stayed functional above 90°C and partly intact at 98°C, and it combines features of all three known nitrogenase families. The authors raise the long-term hope of crops fixing their own nitrogen. Structural biochemistry only: nothing here is close to a field. (Nature Communications, via ScienceDaily, Sep 19–21, 2026)
Mushrooms turn soy pulp into a savoury protein — NTU Singapore researchers fermented okara, the pulp left from soy milk and tofu, with oyster mushroom mycelium for 11 days. Protein rose to 27.7–30.2% of dry weight and savoury amino acids rose up to fourfold. Lab-scale proof of concept. (Food Chemistry: X, via Phys.org, Sep 21, 2026)
UAN32 and Urea Cost $0.714 and $0.715 a Pound of Nitrogen. UAN32 Has Not Left a $10 Band in Nine Surveys, While World Urea Rose 12% in a Month.
DTN's Sep 7–11 survey puts retail UAN32 at $457 a ton and urea at $658, the same nitrogen to within 0.11 cents a pound, or 20 cents an acre at 180 pounds. UAN32 has printed between $455 and $465 in every survey since mid-July, which fits a producer UAN fill book that CF Industries says averaged close to $300 a ton and runs into November. Over the same stretch world urea rose 12% in the month to Sep 18 and the Tampa ammonia contract fell $80. Anhydrous is still the cheapest nitrogen at $0.57 a pound and the only one agronomists back for fall application. The spring choice between UAN32 and urea is a tie today, and the two wholesale markets behind them are now moving in opposite directions.
A pound of nitrogen cost a US grower $0.714 as UAN32 and $0.715 as urea in the second week of September. DTN's retail survey for Sep 7–11 put UAN32 at $457 a ton and urea at $658 (DTN/Progressive Farmer, Sep 16, 2026). Divided by nitrogen content, that is 32% of $457 against 46% of $658. The gap is 0.11 cents a pound, or about 20 cents an acre at 180 pounds of N. DTN rounds to the cent and prints the pair as $0.71 and $0.72. At three decimals they are tied. The tie itself is not the main finding. The main finding is how it formed. UAN32 has printed between $455 and $465 a ton in each of the nine surveys since mid-July, and every other nitrogen product fell toward it. The wholesale legs under urea and UAN32 are now moving in different directions, so the tie is unlikely to last into the spring booking season.
1. Four nitrogen forms, one price ladder, and a tie in the middle
What's new: On a per-pound basis the national retail board now has three levels, not four. Anhydrous sits alone at the bottom. UAN32 and urea share the middle. UAN28 sits alone at the top.
Evidence: The table below computes cost per pound of N from DTN's national $/ton averages at nominal analysis (82% anhydrous, 46% urea, 32% and 28% UAN). Three decimals are shown because the story is in the third one.
| Product | $/ton, retail | YoY | $/lb N | $/acre at 180 lb N | |
|---|---|---|---|---|---|
| Anhydrous (82-0-0) | 938 | +22% | 0.572 | 102.95 | ███████░░░ |
| UAN32 (32-0-0) | 457 | −5% | 0.714 | 128.53 | █████████░ |
| Urea (46-0-0) | 658 | +4% | 0.715 | 128.74 | █████████░ |
| UAN28 (28-0-0) | 430 | +4% | 0.768 | 138.21 | ██████████ |
Source: DTN/Progressive Farmer, "Fertilizer Prices Continue Lower for 6 of 8 Major Nutrients," Sep 16, 2026 (national average retail, survey week Sep 7–11, 2026; $/ton and year-on-year changes). $/lb N and $/acre are Crop Root Zone calculations at nominal N content. They cover product only, with no application, inhibitor or custom-hire charge. Bars scale $/lb N, with UAN28 at ten blocks. The 180 lb rate is an arithmetic illustration, not a rate recommendation.
$0.20/acre
The difference between UAN32 and urea at 180 lb of N on DTN's Sep 7–11 national averages: $128.53 against $128.74. (Crop Root Zone calculation from DTN/Progressive Farmer, Sep 16, 2026)
The two ends of the ladder are unchanged in character. Anhydrous is $0.142 a pound below UAN32, about $25.58 an acre at 180 pounds. It is also up 22% on the year, which is why its lead is narrower than it was last fall. UAN28 costs 5.4 cents a pound more than UAN32 even though the two are the same urea–ammonium nitrate solution at different water content. That premium is about $9.68 an acre at 180 pounds. What a grower gets for it is UAN28's lower salt-out temperature, which matters for tanks that sit outside over winter. The middle of the ladder is where things changed.
The ten-week record shows how.
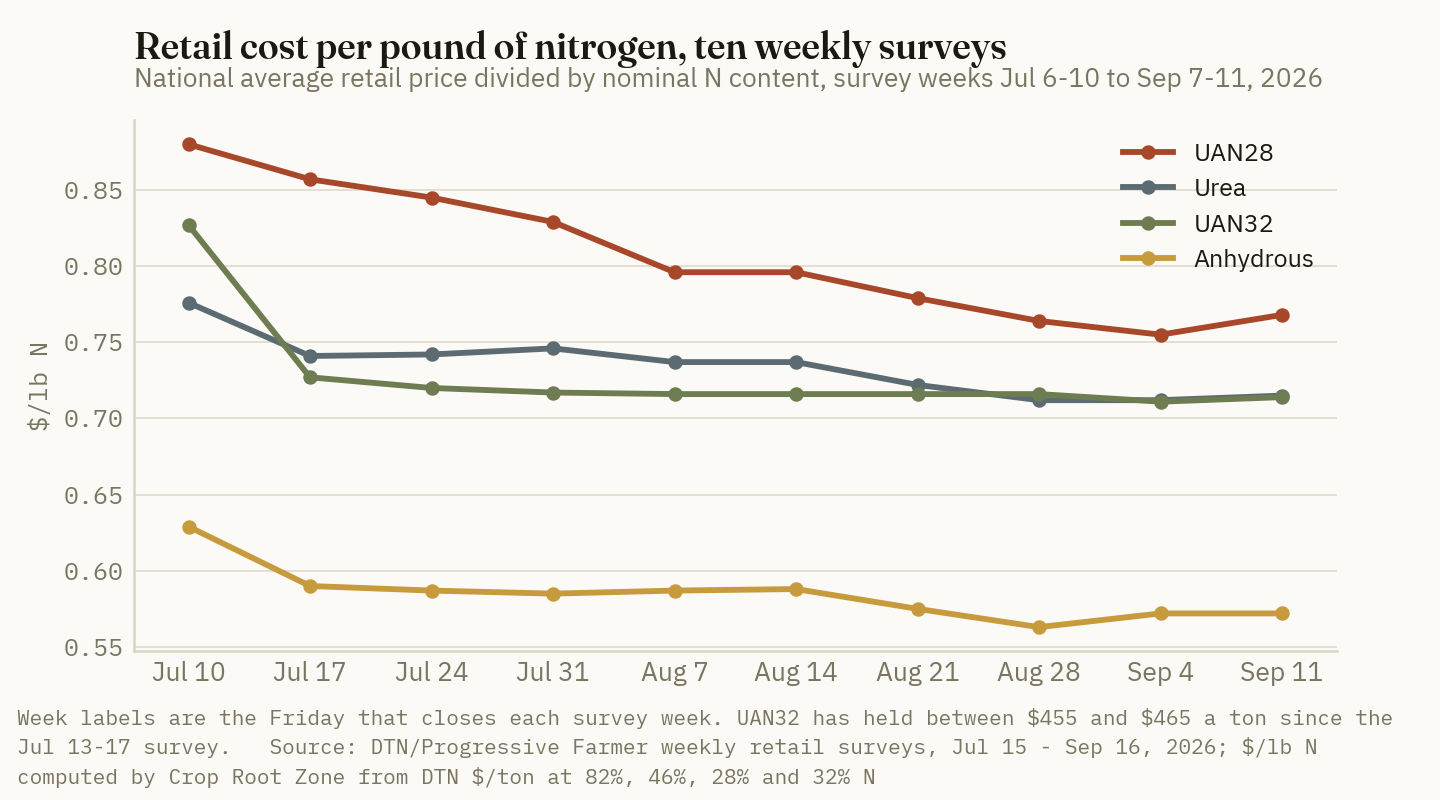
In the Jul 13–17 survey UAN32 was $0.727 a pound and urea $0.741, a 1.5-cent advantage for the solution. By Sep 7–11 that advantage was down to 0.11 cents. Over the nine surveys, UAN32 moved from $465 to $457 a ton (−1.7%), urea from $682 to $658 (−3.5%), anhydrous from $967 to $938 (−3.0%) and UAN28 from $480 to $430 (−10.4%) (DTN/Progressive Farmer, Jul 22 and Sep 16, 2026). Urea did not become cheap. It fell to meet a solution price that had already stopped moving.
Ground Truth: On the national board, the choice between spring UAN32 and spring urea currently comes down to equipment, timing and loss risk, not price. Twenty cents an acre is smaller than the rounding in most retail quotes. That makes this the one point in the season when a grower can pick a nitrogen form entirely on agronomics and logistics and give up nothing on price. It also means the first wholesale move in either product decides the ranking by itself, because no cushion is left to absorb it.
2. Why UAN32 stopped moving: the price was set in July
What's new: The flat line in UAN32 lines up with the summer fill season. North America's largest nitrogen producer told investors it had built a UAN order book in July at an average price close to $300 a ton, with shipments running into November.
Evidence: On its second-quarter call, CF Industries described strong uptake of its July ammonia and UAN fill programs. Its sales chief said the UAN book "extends into November." Asked about the price, he said the average was probably close to $300 (CF Industries Q2 2026 earnings call, Aug 6, 2026). The company's release also cited "strong uptake" of both fill programs and said it expects North American nitrogen demand for the 2027 growing season to be firm (CF Industries, Aug 5, 2026). The call did not give the grade mix or freight basis behind the $300 figure, so it is treated here as an approximate wholesale reference, not a delivered price.
The quarter's reported numbers explain why a producer would be comfortable fixing a large book at that level.
| CF Industries, Q2 | 2025 | 2026 | Change |
|---|---|---|---|
| UAN average selling price, $/ton | 321 | 441 | +37% |
| Granular urea average selling price, $/ton | 460 | 593 | +29% |
| Ammonia average selling price, $/ton | 452 | 677 | +50% |
| UAN sales volume, thousand tons | 1,902 | 1,391 | −27% |
Source: CF Industries Holdings, Inc., second-quarter 2026 results (Form 8-K, Exhibit 99.1), Aug 5, 2026. Average selling prices are per product ton across all grades and destinations, and include the spring application season.
UAN volume fell 27% in the quarter. On the call, management said it had shifted production away from UAN and toward urea and diesel exhaust fluid in the second quarter, and that it expected to run UAN at normal rates in the second half (CF Industries Q2 2026 earnings call, Aug 6, 2026). A producer that trimmed spring UAN output, then sold a July fill book that runs through November, has little reason to discount the next ton. A retailer that bought fill tons near $300 has no cost-driven reason to reprice UAN32 while those tons last. The nine-survey flat line fits both of those facts.
The flat line has a clear starting point. UAN32 fell from $529 in the Jul 6–10 survey to $465 in the Jul 13–17 survey, a $64 drop from one weekly survey to the next (DTN/Progressive Farmer, Jul 15 and Jul 22, 2026). It has not moved more than $4 in any week since. That pattern looks like retail prices resetting to a new replacement cost at fill time and then holding. It does not look like a market still finding its level.
Ground Truth: UAN32 is the one nitrogen product whose retail price is currently tied to a known, dated wholesale event instead of a moving spot market. That makes it predictable, but only until a set date. The July book runs into November. Tons sold for spring delivery after that will be priced off whatever the UAN market is doing in the new year, and over time UAN wholesale values generally track urea's. If a retailer's spring UAN32 offer is still priced off fill-season tons, a grower is buying a July price in September. That is worth checking directly, by asking whether the spring quote is backed by tons the retailer already owns or by tons it has yet to buy.
3. Wholesale to retail, per pound of nitrogen
What's new: Put every form on the same basis and the distribution margin per pound of nitrogen comes out similar across all three: roughly 23 to 28 cents between a wholesale reference and the national retail average. The retail ranking is therefore close to the wholesale ranking plus a roughly constant add-on, and wholesale moves feed through to the per-pound ranking roughly cent for cent.
Evidence: The wholesale references below are the most recent dated public prints for each form. Their bases differ (CFR Tampa, FOB NOLA barge, and an unspecified fill basis), and each row states its basis.
| Form | Wholesale reference | Wholesale $/lb N | Retail $/lb N, Sep 7–11 | Retail over wholesale, $/lb N | Wholesale direction |
|---|---|---|---|---|---|
| Anhydrous | Tampa contract, Sep, $555/MT CFR (≈$503/st) | 0.307 | 0.572 | 0.265 | Down $80/MT from August |
| Urea | NOLA Sep barges, up to $405/st FOB, Aug 20 | 0.440 | 0.715 | 0.275 | Global urea +12% in month to Sep 18 |
| UAN32 | CF July fill, ≈$300/ton, if 32% basis | 0.469* | 0.714 | 0.245* | Book fixed into November |
| UAN28 | CF July fill, ≈$300/ton, if 28% basis | 0.536* | 0.768 | 0.232* | Book fixed into November |
Sources: Fertilizer Daily, Sep 10, 2026 (Tampa September settlement $555/MT CFR, down from $635 in August); Fertilizer International 534, "Market Insight," Sep 15, 2026 (NOLA September urea barges traded up to $405/st f.o.b., assessment dated Aug 20, 2026); Trading Economics, Urea, accessed Sep 21, 2026 ($459.50/MT on Sep 18, 2026, +12.07% on the month); CF Industries Q2 2026 earnings call, Aug 6, 2026; DTN/Progressive Farmer, Sep 16, 2026. *The fill price was given as approximate, with no grade or basis, so both UAN rows are Crop Root Zone estimates that bracket it. Metric-to-short-ton conversion at 1.10231. Spreads are Crop Root Zone calculations across different bases and dates and are indicative, not a margin measurement.
Three things follow from the table. First, the similar spreads are partly a coincidence of dates and bases. The Tampa contract is a delivered-to-Florida ammonia price, not a Corn Belt terminal price, and the fill figure is approximate. The similarity is still a useful rule of thumb. A 1-cent-per-pound move at wholesale shows up as about a 1-cent move in the retail per-pound ranking once old inventory has been sold through.
Second, the two wholesale markets behind the tied retail pair are moving in opposite directions. The global urea benchmark carried by Trading Economics was $459.50 a tonne on Sep 18, up 12.07% on the month and 16.62% on the year (Trading Economics, accessed Sep 21, 2026). That monthly rise is roughly $49 a tonne, or about 4.9 cents a pound of N at US short-ton conversion (Crop Root Zone estimate; this is a global benchmark, not a NOLA print, and the pass-through to the US barge is not one-for-one). UAN32's wholesale reference, meanwhile, is fixed in a book that runs into November.
Third, anhydrous is moving the other way from urea. The Tampa contract has fallen four months in a row, from $825 a tonne in May to $555 in September (Fertilizer Daily, Sep 10, 2026). The September cut alone is about $73 a short ton, or roughly 4.4 cents a pound of N at wholesale (Crop Root Zone calculation). Retail anhydrous fell $26 a ton on the month in the Sep 7–11 survey (DTN/Progressive Farmer, Sep 16, 2026). That is less than half the wholesale move so far.
Ground Truth: If retail follows wholesale with its usual lag, the national board will spread out over the coming weeks instead of tightening. Urea's per-pound price is likely to rise toward the new barge level, anhydrous's is likely to fall toward the new Tampa level, and UAN32's is likely to hold until its book runs out. Applied to the tie in section 1, even partial pass-through of the urea rally puts UAN32 several cents a pound below urea before the fill tons are gone. Any spring program that picked urea over UAN32 on July price relationships should be re-priced against September wholesale before the booking decision is final.
4. The state boards do not agree with the national one
What's new: USDA's distributor surveys for Illinois and Iowa, both dated Sep 18 and a week fresher than the DTN national print, show a different per-pound picture from the national average, and a spread of quotes within each state that is wider than any gap between products.
Evidence: The Illinois report lists distributor asks for all four nitrogen forms. The Iowa report on the same date lists anhydrous and UAN32 only.
| State, Sep 18 | Product | Avg ask, $/ton FOB | Range, $/ton | $/lb N, avg | $/lb N, range |
|---|---|---|---|---|---|
| Illinois | Anhydrous | 907.50 | 820–1,050 | 0.553 | 0.500–0.640 |
| Illinois | Urea | 722.00 | 595–890 | 0.785 | 0.647–0.967 |
| Illinois | UAN32 | 525.00 | 525 (one quote) | 0.820 | — |
| Illinois | UAN28 | 506.88 | 400–585 | 0.905 | 0.714–1.045 |
| Iowa | Anhydrous | 823.40 | 768–950 | 0.502 | 0.468–0.579 |
| Iowa | UAN32 | 456.20 | 375–685 | 0.713 | 0.586–1.070 |
Sources: USDA AMS, Illinois Production Cost Report (Bi-weekly), Sep 18, 2026; USDA AMS, Iowa Production Cost Report (Bi-weekly), Sep 18, 2026. Distributor asks, FOB, current delivery. $/lb N is a Crop Root Zone calculation at nominal N content. Iowa carried no urea or UAN28 quote on this date.
In Illinois the national ranking reverses in the middle. Urea is 3.5 cents a pound cheaper than UAN32, and UAN28 is the most expensive nitrogen on the report at just over 90 cents. The UAN32 figure is a single quote, which limits how much weight it can bear. The UAN28 figure is an average of several quotes, and its $400–$585 range means one Illinois distributor asks 33 cents a pound of N more than another. At 180 pounds that is about $59 an acre, more than twice the gap between the national anhydrous and UAN32 averages. Illinois UAN28 rose $11.88 from the previous report and anhydrous rose $15.00, while urea and UAN32 were unchanged (USDA AMS, Sep 18, 2026).
Iowa's UAN32 average of $456.20 is within a dollar of the DTN national figure, and its anhydrous average works out to about 50 cents a pound of N, the lowest figure anywhere in this piece. USDA reports that Iowa average as $201.60 below the previous report, and Iowa UAN32 as $160.05 lower. Moves that large between two bi-weekly reports are more likely to reflect a change in which distributors reported than a market move of that size. They are shown here as published but should not be read as a two-week price trend.
Ground Truth: The national tie between UAN32 and urea is an average of local markets that are not tied. In Illinois this week urea is the cheaper spring nitrogen. In Iowa, on the one UAN32 average available, the solution matches the national figure. Within each state the range of quotes is several times larger than the national gap between the two products. For a grower, the product choice and the choice of supplier are one decision, and the supplier is the part with more money in it. Three spring UAN32 bids and three urea bids, compared per pound of N, will say more than any national table.
5. What the spread implies for fall and spring nitrogen
What's new: The per-pound numbers settle one question and leave another open. The settled one is fall: only anhydrous belongs in a fall program, and its lead is large. The open one is spring, where the choice between UAN32 and urea is a tie today and will be settled by wholesale moves over the next two months.
Evidence: Iowa State University's guidance on fall application is specific. It recommends anhydrous only, applied after 4-inch soil temperatures fall to 50°F and are trending colder, ideally with a nitrification inhibitor and not on poorly or excessively drained soils. Urea and UAN lack anhydrous's initial suppression of nitrifying bacteria and should not be fall-applied (Iowa State University Integrated Crop Management, Nov 19, 2019). In most years Iowa soils reach that temperature in late October or early November, which falls within the period CF's UAN book still covers. For fall, the per-pound comparison that matters is anhydrous now against the spring alternatives. At the national averages that is $102.95 an acre against $128.53 to $138.21 at 180 pounds before application, inhibitor and custom-hire costs.
For spring, the table below shows how much the tie can move under a few illustrative retail prices. None of these is a forecast. Each is a price the national board has actually printed this summer, applied to one product while the other is held constant.
| Spring scenario, national retail | Urea $/ton | UAN32 $/ton | Urea $/acre | UAN32 $/acre | UAN32 advantage, $/acre |
|---|---|---|---|---|---|
| Today (Sep 7–11) | 658 | 457 | 128.74 | 128.53 | 0.21 |
| Urea back to late-July level | 683 | 457 | 133.63 | 128.53 | 5.10 |
| Urea back to early-July level | 714 | 457 | 139.70 | 128.53 | 11.17 |
| UAN32 reprices after book, urea flat | 658 | 490 | 128.74 | 137.81 | −9.07 |
Crop Root Zone calculation at 180 lb N/acre, product only. Urea $683 and $714 are DTN national averages for the Jul 20–24 and Jul 6–10 surveys (DTN/Progressive Farmer, Jul 29 and Jul 15, 2026). The $490 UAN32 figure is an illustrative Crop Root Zone assumption, about 7% above today's price and well below the $529 printed in early July. It is not a forecast.
The scenarios are not evenly balanced in likelihood. The first two rows need only urea's retail price to follow a global benchmark that has already risen. The last row needs UAN wholesale to rise after the fill book ends, which is plausible if urea stays firm but has not yet happened. Anhydrous, meanwhile, has a September Tampa cut still to pass through to retail.
Ground Truth: The per-pound numbers point to a two-step plan, and the timing matters more than the product. Step one is fall: price and book fall anhydrous against the September Tampa contract, not the August one. Retail has passed through less than half of the $80 cut so far, so the current quote is probably not the floor. Step two is spring: for acres that will get spring nitrogen, UAN32 is the only product whose current retail price rests on a wholesale price that is fixed until November. Urea's current retail price sits below where its wholesale market now is. A grower who is indifferent between the two forms on agronomics gains a small advantage by pricing spring UAN32 while it is still tied to July costs, and loses little if urea later comes back down. The trade flips only if the global urea rally reverses before retail urea has caught up to it. That is the one development to watch between now and the end of the UAN book.
References
- DTN/Progressive Farmer, Russ Quinn, "Fertilizer Prices Continue Lower for 6 of 8 Major Nutrients," Sep 16, 2026 (retail survey Sep 7–11, 2026) — https://www.dtnpf.com/agriculture/web/ag/crops/article/2026/09/16/fertilizer-prices-continue-lower-6-8
- DTN/Progressive Farmer, "6 of 8 Fertilizer Prices Lower, Led by UAN28," Sep 9, 2026 (retail survey Aug 31–Sep 4, 2026) — https://www.dtnpf.com/agriculture/web/ag/crops/article/2026/09/09/6-8-fertilizer-prices-lower-led
- DTN/Progressive Farmer, "Fertilizer Prices Fall as UAN28, Urea Lead the Way Lower," Sep 2, 2026 (retail survey Aug 24–28, 2026) — https://www.dtnpf.com/agriculture/web/ag/crops/article/2026/09/02/fertilizer-prices-fall-uan28-urea
- DTN/Progressive Farmer, "UAN28 Leads Fertilizer Price Declines for Fifth Consecutive Week," Aug 26, 2026 (retail survey Aug 17–21, 2026) — https://www.dtnpf.com/agriculture/web/ag/crops/article/2026/08/26/uan28-leads-fertilizer-price-fifth
- DTN/Progressive Farmer, "5 Fertilizer Prices Slightly Lower Than Last Month; 3 Higher," Aug 19, 2026 (retail survey Aug 10–14, 2026) — https://www.dtnpf.com/agriculture/web/ag/crops/article/2026/08/19/5-fertilizer-prices-slightly-lower-3
- DTN/Progressive Farmer, "Fertilizers Start August With Mixed Prices as 5 Nutrients Decline, Led by UAN32," Aug 12, 2026 (retail survey Aug 3–7, 2026) — https://www.dtnpf.com/agriculture/web/ag/crops/article/2026/08/12/fertilizers-start-august-mixed-5-led
- DTN/Progressive Farmer, "Fertilizer Prices Fall as UAN32 Leads Significant Drops Heading Into August," Aug 5, 2026 (retail survey Jul 27–31, 2026) — https://www.dtnpf.com/agriculture/web/ag/crops/article/2026/08/05/fertilizer-prices-fall-uan32-leads
- DTN/Progressive Farmer, "Fertilizer Prices Keep Sliding as UAN32 Leads 4 Nutrients in Significant Drops," Jul 29, 2026 (retail survey Jul 20–24, 2026) — https://www.dtnpf.com/agriculture/web/ag/crops/article/2026/07/29/fertilizer-prices-keep-sliding-uan32
- DTN/Progressive Farmer, "Fertilizer Prices Continue Downward Trend," Jul 22, 2026 (retail survey Jul 13–17, 2026) — https://www.dtnpf.com/agriculture/web/ag/crops/article/2026/07/22/fertilizer-prices-continue-downward
- DTN/Progressive Farmer, "UAN Fertilizers Lead Nutrient Prices Downward," Jul 15, 2026 (retail survey Jul 6–10, 2026) — https://www.dtnpf.com/agriculture/web/ag/crops/article/2026/07/15/uan-fertilizers-lead-nutrient-prices
- CF Industries Holdings, Inc., "CF Industries Holdings, Inc. Reports First Half 2026 Net Earnings of $1.34 Billion" (Form 8-K, Exhibit 99.1), Aug 5, 2026 — https://www.sec.gov/Archives/edgar/data/1324404/000132440426000017/cf-08052026_ex991xearnings.htm
- CF Industries, Q2 2026 earnings conference call, Aug 6, 2026 (transcript via The Motley Fool) — https://www.fool.com/earnings/call-transcripts/2026/08/12/cf-industries-cf-q2-2026-earnings-call-transcript/
- Fertilizer Daily, "Tampa ammonia price drops to $555/t in September — 4th straight monthly decline from $825 peak," Sep 10, 2026 — https://www.fertilizerdaily.com/20260910-tampa-ammonia-price-555-september-2026-fourth-monthly-decline/
- Fertilizer International 534 (Sep–Oct 2026), "Market Insight," BCInsight / CRU Group, Sep 15, 2026 (NOLA urea assessment dated Aug 20, 2026) — https://www.bcinsight.crugroup.com/2026/09/15/market-insight-41/
- Trading Economics, Urea, accessed Sep 21, 2026 ($459.50/MT on Sep 18, 2026; +12.07% month, +16.62% year) — https://tradingeconomics.com/commodity/urea
- USDA AMS, Illinois Production Cost Report (Bi-weekly), Sep 18, 2026 — https://www.ams.usda.gov/mnreports/ams_3195.pdf
- USDA AMS, Iowa Production Cost Report (Bi-weekly), Sep 18, 2026 — https://www.ams.usda.gov/mnreports/ams_2863.pdf
- Iowa State University Extension and Outreach, Integrated Crop Management, John Sawyer, "Fall Fertilizer Nitrogen Application," Nov 19, 2019 — https://crops.extension.iastate.edu/cropnews/2019/10/fall-fertilizer-nitrogen-application
Disclosures
Crop Root Zone is an independent publication. Nothing here is investment advice. Market calls, where included, reflect the editors' own read and are not a recommendation to buy or sell any security.
China Reopened Phosphate Exports on September 1 Under License. India Is Paying $920 a Tonne for DAP, and Its Subsidy Covers $660.
Beijing's March 14–August 31 export freeze has given way to a license-plus-quota regime with no published volume, and Chinese 64% DAP sits about $190/t below Indian delivered values, so every licensed tonne will go out. Last year's precedent, a 3 million tonne quota, did not stop world DAP rising 14% in a quarter. The number that moves the fall floor is India's. At ₹95.89 to the dollar, today's Kharif support package pays an importer back only up to a $660/t CFR cargo, while the market is at $900–935. India drew its DAP stocks down from 25.17 to 16.52 lakh tonnes rather than import at that price. To make a $920 cargo break even before port costs, the rabi phosphorus rate due for Oct 1 would have to go from ₹52.76/kg to about ₹107/kg. Whether New Delhi pays that gap or buys less is what decides whether NOLA's $802.50/st holds this autumn.
On September 1, 2026, Chinese producers were able to file export declarations for monoammonium phosphate, diammonium phosphate and agricultural phosphate compounds for the first time since March 14. The freeze had been total. Chinese trade press called it "zero quota, zero inspection, zero release" (ChemNet, Apr 20, 2026). It has not been replaced by an open market. Fertilizers remain on China's 2026 export-license catalogue, and the reopening runs under what Chinese financial press calls a "license plus annual quota" model, with quota steered toward producers that met their domestic-supply obligations (21st Century Business Herald, Sep 9, 2026). No quota volume has been published. The same week, India's latest DAP purchases were done at about $930/t CFR (Rural Voice, Sep 14, 2026). India's Kharif subsidy rates expire on September 30, and the rabi rates that replace them have not been announced. US retail DAP is $923/st and MAP $962/st (DTN/Progressive Farmer, Sep 16, 2026). China's reopening is not what decides whether those prices hold. India's subsidy decision is.
1. What China actually reopened
What's new: Chinese exports are back, but the volume is unknown. Chinese financial press describes the September 1 regime as a license requirement plus an annual quota, allocated first to companies with strong domestic-supply records (21st Century Business Herald, Sep 9, 2026). A Chinese fertilizer price service said on September 11 that MAP exports were still constrained under the new licensing, with weak downstream demand at home (Tencent News market report, Sep 11, 2026). In its September 11 weekly, a public Australian market relay expected Chinese phosphate exports to "remain scarce." It also reported that Chinese phosphate shipments to Brazil fell about 90% year on year in August (Australian Fertilizer Corporation, w/e Sep 11, 2026).
Evidence: The pre-freeze trend was already falling, and the 2026 freeze took out a year the trade had expected to recover.
| Chinese DAP + MAP exports | Million t | Basis / note | |
|---|---|---|---|
| 2015 | 11.0 | ██████████ |
Calendar year (CRU) |
| 2024 | 4.86 | ████░░░░░░ |
DAP 3.29 + MAP 1.571 |
| 2025, expected | 4.5 | ████░░░░░░ |
Full-year estimate, Dec 2025 |
| 2026, CRU forecast | 5.6 | █████░░░░░ |
Made Dec 2025, before the March freeze |
| 2026, Mar 14 – Aug 31 | 0 | ░░░░░░░░░░ |
No agricultural phosphate export clearance |
Basis: million metric tons of DAP and MAP combined; bars scaled to the 2015 volume. Sources: DTN/Progressive Farmer, Dec 19, 2025 (CRU figures for 2015, 2025 and the 2026 forecast); SunSirs (2024 by product); ChemNet, Apr 20, 2026 (control period).
The price gap explains why the reopening will not stay small by choice. On September 11, Chinese domestic 64% DAP was quoted at ¥4,900–4,950/t in Jiangsu and ¥4,800–4,850/t in Hubei, with deals done ¥40–60 below those quotes (Tencent News market report, Sep 11, 2026). At the PBOC's September 18 fix of ¥6.7521, that is about $711–733/t. Chinese financial press puts the domestic-to-international DAP spread above ¥1,500/t, about $222/t, with Southeast Asian DAP at $900–945/t CFR (21st Century Business Herald, Sep 9, 2026). Any producer holding a license has about $190–220/t of margin to capture by shipping.
China has run this experiment before. From May to September 2025 it allowed a phosphate export window of 2 million t of DAP and 1 million t of MAP (CZapp, May 19, 2025). The World Bank's DAP series averaged $673.2/t in April–June 2025 and $770.6/t in July–September 2025. That is a 14% rise during the quarter the quota was being shipped (World Bank Pink Sheet, Sep 2, 2026).
Ground Truth: A Chinese quota with a $200/t arbitrage attached does not work as a price cap. It works as a transfer. Licensed exporters will sell at the world price, not below it, and nothing in the September design obliges them to undercut India or Brazil to move tonnes. Chinese tonnes add supply at the margin. They do not set the price. Growers waiting for "China reopening" to lower their fall phosphate bill are waiting for something the 2025 window has already shown does not happen.
2. The market China is re-entering
What's new: Processed phosphate prices have come slightly off their summer highs but remain near three-year highs everywhere that matters. DAP into India was $915–935/t CFR in the week ended August 28, after touching roughly $935. That compares with $668–669/t at the start of 2026 (Australian Fertilizer Corporation, w/e Aug 28, 2026). By the week ended September 11 it was $900–915/t, with recent cargoes at $913.50–920 (Australian Fertilizer Corporation, w/e Sep 11, 2026). CRU expects prices to stay "well-supported in the short-term," with gradual declines from late in the third quarter or early in the fourth (Fertilizer International / BC Insight, Sep 15, 2026).
Evidence: Every benchmark with a public print sits in the same band. US Gulf values are the cheapest of the group.
| Benchmark | Basis | Level | As of | Source |
|---|---|---|---|---|
| DAP, China domestic, 64% | Delivered/ex-works, $/t* | 711–733 | Sep 11, 2026 | Tencent News price report |
| DAP, World Bank series | Spot, f.o.b. US Gulf, $/mt, monthly avg | 793.5 | Aug 2026 | World Bank Pink Sheet |
| DAP, NOLA barge | CME front-month futures, $/st | 802.50 | Sep 18, 2026 | CME via Investing.com |
| DAP, NOLA barge | Same, converted to $/mt* | 885 | Sep 18, 2026 | Unit conversion |
| MAP, Brazil | CFR, $/mt | 850–860 | Aug 20, 2026 | CRU / BC Insight |
| DAP, India | CFR, $/mt | 900–915 | w/e Sep 11, 2026 | AusFertCorp weekly |
| DAP, Ma'aden sale | f.o.b., $/mt | ~920 | Aug 2026 | CRU / BC Insight |
| DAP, Southeast Asia | CFR, $/mt | 900–945 | Sep 9, 2026 | 21st Century Business Herald |
| DAP, Bangladesh tender low | CFR, $/mt | 979 | Aug 18, 2026 | CRU / BC Insight |
| DAP, US retail | Delivered farm, $/st | 923 | wk Sep 7–11, 2026 | DTN/Progressive Farmer |
| MAP, US retail | Delivered farm, $/st | 962 | wk Sep 7–11, 2026 | DTN/Progressive Farmer |
Sources as listed: Tencent News fertilizer market report, Sep 11, 2026; World Bank Pink Sheet, Sep 2, 2026; Investing.com CME DAP FOB NOLA historical data, Sep 18, 2026; Fertilizer International / BC Insight, Sep 15, 2026 (market snapshot as of Aug 20); Australian Fertilizer Corporation, w/e Sep 11, 2026; 21st Century Business Herald, Sep 9, 2026; DTN/Progressive Farmer, Sep 16, 2026.
*Conversions only, not separate assessments: yuan at the PBOC fix of ¥6.7521/$ on Sep 18, 2026 (Chinese domestic prices include VAT); short tons at 1.10231 st/mt. The World Bank and CME series are different assessments of the US Gulf and should not be compared level for level.
The cost side is why the correction is slow. Sulfur is above $1,000/t in the market India buys from (Rural Voice, Sep 14, 2026). Chinese port sulfur is ¥7,620–7,887/t, about $1,130–1,170/t (Tencent News market report, Sep 11, 2026). The Tampa third-quarter liquid sulfur contract settled at a record $705/lt (Argus Media, Jul 2026). India's third-quarter phosphoric acid contract settled at $1,700/t P2O5 CFR, up $340 from the second quarter's $1,360, after dry bulk sulfur into India rose 49% (Argus Media, Q3 2026 settlement). The other big import market is rationing demand. Brazil's January–August imports of phosphate products are down 22% year on year, and August alone fell 58% to about 765,000 t (Australian Fertilizer Corporation, w/e Sep 11, 2026).
3. India's DAP gap, in rupees
What's new: The DAP retail price in India is fixed at ₹1,350 per 50 kg bag, or ₹27,000/t, and has not changed in four years (Rural Voice, Sep 14, 2026). The importer's revenue is that price plus the Nutrient Based Subsidy (NBS) plus a special DAP incentive. For Kharif 2026 (April 1 to September 30), the Cabinet set the NBS at ₹47.32/kg N and ₹52.76/kg P (PW, May 21, 2026; Cabinet approval April 2026). On an 18-46-0 tonne that works out to ₹32,787, which matches the ₹32,786 the trade is quoting (Rural Voice, Sep 14, 2026). The ₹3,500/t special incentive is valid only through the end of Kharif 2026.
Evidence: Converted at the September 18 close of ₹95.89/$ (DTN Next / PTI, Sep 18, 2026), the arithmetic shows the gap.
| India, per tonne of imported DAP | ₹/t | $/t | Note |
|---|---|---|---|
| Cargo at $920 CFR | 88,219 | 920 | Recent India deals $913.50–930 |
| Retail price (₹1,350/bag) | 27,000 | 282 | Unchanged four years |
| NBS, Kharif 2026 rates | 32,787 | 342 | 18% N × ₹47.32 + 46% P × ₹52.76 |
| Special DAP incentive | 3,500 | 37 | Expires with Kharif, Sep 30 |
| Total recovery | 63,287 | 660 | Break-even CFR, before any port or inland cost |
| Shortfall at $920 CFR | 24,932 | 260 | ₹1,247 per 50 kg bag |
Basis: per metric ton, CFR India, before port handling, bagging, inland freight and dealer margin, all of which widen the shortfall. Rupee at ₹95.89/$, Sep 18, 2026 close. Arithmetic is ours on published rates. Sources: PW, May 21, 2026 (Kharif 2026 NBS rates); Rural Voice, Sep 14, 2026 (retail price, special incentive, ₹32,786 subsidy); Australian Fertilizer Corporation, w/e Sep 11, 2026 (CFR); DTN Next / PTI, Sep 18, 2026 (exchange rate).
$660/t
The CFR price at which India's current retail price, subsidy and special incentive together fully reimburse an imported DAP cargo, before any port or inland cost. The market is at $900–935. The loss on each 50 kg bag, ₹1,247, is close to the ₹1,350 retail price of the bag itself. (Our arithmetic on Kharif 2026 NBS rates and the Sep 18, 2026 rupee close.)
The trade's all-in estimate is wider still. Rural Voice puts the landed cost of an imported tonne near ₹1 lakh (Rural Voice, Sep 14, 2026). The rupee has made the gap worse. The previous rabi package, approved in October 2025 at ₹29,805/t plus the ₹3,500 incentive, would reimburse only a $629/t cargo at today's exchange rate.
Local production does not close the gap. At $1,700/t P2O5 for acid and roughly $450–460/t CFR for ammonia into India (Australian Fertilizer Corporation, w/e Aug 28, 2026), the two main raw materials in a tonne of DAP cost roughly $900 before conversion.* In June, Indian producers had about a $200/t advantage over imports (World Fertilizer, Jun 25, 2026). The third-quarter acid settlement erased it.
*Estimate. Assumes about 0.47 t P2O5 and 0.22 t NH3 per tonne of DAP, typical stoichiometric norms, at the Q3 acid contract and the late-August India ammonia range. Excludes sulfuric acid, conversion, energy and bagging. Not a producer-reported figure.
4. India has been buying less and drawing stocks
What's new: India has not paid the world price at full volume. It has run down the inventory it built last winter. The country imported 61.94 lakh tonnes of DAP in fiscal 2025-26 but only 7.11 lakh tonnes in April–June 2026, while domestic output was 9.84 lakh tonnes (Free Press Journal, citing the Fertiliser Ministry, Jul 2026). May imports were 132,000 t against a 2021–2025 May average of 393,000 t (World Fertilizer, Jun 25, 2026). In May, India bought a record 1.347 million t of DAP in a single tender through Indian Potash Ltd, from 13 suppliers (Fertilizer International / BC Insight, Sep 15, 2026). By late July the stock position was still falling.
Evidence: DAP stocks, from a decade high to about a third of a rabi season's requirement.
| India DAP stock | Lakh t | Source | |
|---|---|---|---|
| Mar 10, 2026 | 25.17 | ██████████ |
Government statement, decade-high inventory |
| Mid-Apr 2026 | 22.10 | █████████░ |
Trade reporting (13.0 a year earlier) |
| End-May 2026 | 19.60 | ████████░░ |
World Fertilizer |
| Jul 27, 2026 | 16.52 | ███████░░░ |
Lok Sabha written reply |
| Rabi 2025-26 requirement, Oct–Mar | 53.43 | — | For scale |
Basis: lakh metric tonnes (100,000 t) of DAP held in country; bars scaled to the March peak. Sources: Veloxx Media, citing government data, Mar 2026; Swarajya / Organiser, Apr 26, 2026; World Fertilizer, Jun 25, 2026; Lok Sabha written reply of the Minister of Chemicals and Fertilizers as reported by LatestLY / ANI, Jul 31, 2026; PIB, Rabi 2025-26 availability statement.
The same Lok Sabha reply put Kharif DAP availability at 42.36 lakh t against a requirement of 34.67 lakh t for April 1 to July 27. That implies about 25.8 lakh t moved to farmers over four months (LatestLY / ANI, Jul 31, 2026; the sales figure is our subtraction). India also has 21.23 lakh t of domestic single superphosphate to substitute for part of its DAP demand. Rabi is the peak DAP season. The wheat and mustard basal dose goes on from October to December. Last rabi's requirement was 53.43 lakh t. India goes into it with less than a third of that in stock, and World Fertilizer noted in June that demand would peak in the fourth quarter.
Ground Truth: India's imports this year have tracked its subsidy, not its agronomy. Importers bought when the special incentive and a stock cushion made a cargo tolerable. They held off when the gap widened, and the stock drawdown covered the difference. With the cushion down to 16.52 lakh t, that option is mostly used up. India now has to buy for rabi, and the rabi subsidy rate decides how much. The world phosphate market is effectively waiting on a Cabinet meeting in New Delhi.
5. What each Indian decision does to the North American floor
What's new: The Kharif NBS expires on September 30, and the government is expected to announce rabi rates and decide whether to extend the special DAP incentive (Rural Voice, Sep 14, 2026). The timing is uncertain. Last season's rabi package was approved in late October, almost a month after the season began, and the Kharif 2026 package was approved in April, after its season had started.
Evidence: The phosphorus subsidy rate India would need to make an imported cargo break even, with the retail price at ₹27,000, the incentive held at ₹3,500, the N rate at ₹47.32 and the rupee at ₹95.89:
| DAP CFR India, $/t | Subsidy needed, ₹/t | Implied P rate, ₹/kg | vs. Kharif ₹52.76 | |
|---|---|---|---|---|
| 920 | 57,719 | 107.0 | 2.03× | ██████████ |
| 850 | 51,006 | 92.4 | 1.75× | █████████░ |
| 800 | 46,212 | 81.9 | 1.55× | ████████░░ |
| 750 | 41,418 | 71.5 | 1.36× | ███████░░░ |
| 700 | 36,623 | 61.1 | 1.16× | ██████░░░░ |
| 660 | 32,787 | 52.8 | 1.00× | █████░░░░░ |
Basis: break-even on the CFR price alone, before port, bagging, inland freight and margin, so actual requirements are higher. Arithmetic is ours on the Kharif 2026 NBS structure and the Sep 18, 2026 rupee; bars scale the implied P rate. Model output, not a government figure.
Doubling a nutrient rate in one season would be far outside the pattern of recent packages. Kharif 2026 rose about 12% on the prior Kharif, and rabi 2025-26 raised the DAP subsidy by about 7% (Rural Voice, Oct 2025). That leaves three plausible outcomes. None of them is a forecast.
- India pays most of the gap. It raises the P rate sharply, extends and enlarges the special incentive, or both. Indian buying resumes at $900-plus, India stays the high bid in the world market, and US Gulf DAP holds near its current $800/st on the CME front month. US retail at $923/st then has no wholesale reason to fall this fall. The retail-to-NOLA margin is already $120.50/st.
- India raises rates modestly (our base case). The increase is in line with recent packages, perhaps 10–25%, and the incentive is extended. A P rate of ₹58–66/kg supports a CFR of roughly $680–725/t on this arithmetic. Importers keep buying only what the stock position forces. India's CFR drifts lower, consistent with CRU's expected late-Q3/early-Q4 easing, but high sulfur and acid costs limit the fall. NOLA eases with it, with a lag, and retail follows later.
- India holds rates and relies on domestic output and SSP. Indian demand drops sharply, and the largest spot buyer steps back just as licensed Chinese tonnes start to move. That is the one outcome in which the fall floor breaks, and it would break at the world level first.
For a US buyer, the exposure is concrete. A $100/mt move in the world DAP price is about $91/st at the NOLA barge. Retail reprices slowly and incompletely, but it reprices in the direction the barge moves.
Ground Truth: The date that matters for phosphate this fall is not September 1, when China reopened. It is the day India's Cabinet publishes rabi NBS rates, which will probably be around or after October 1. Until then, the $800/st NOLA floor rests on a buyer that currently loses about $260 on every tonne it imports. That floor is policy-contingent, not supply-contingent. Fall-applied P for this season is already priced, and nothing here argues for delaying the application. Spring 2027 phosphate prepay is different. A buyer who commits before the rabi rates are known is taking the side of scenario one without knowing whether New Delhi will fund it. An Indian package near the historical increment would weaken the case for holding today's prices. A package that doubles the phosphorus rate would put $900 DAP behind the spring price as well.
References
- ChemNet (化工头条), Q1 2026 fertilizer imports and exports rise in volume and price; summary of import-export policies, Apr 20, 2026 (China exports 8.162 million t of fertilizer Jan–Mar 2026; phosphate export controls Mar 14–Aug 31, 2026). https://news.chemnet.com/toutiao/detail-61261.html
- 21st Century Business Herald (21经济网), phosphate export resumption report, Sep 9, 2026 (Sep 1 resumption; license-plus-annual-quota model; domestic–international DAP spread; Southeast Asia and India CFR; H1 2026 producer results). https://www.21jingji.com/article/20260909/herald/726616fd733f8d93a51b67bf1ee1b858.html
- Tencent News (腾讯新闻), Sep 11 urea, MAP/DAP, potash, sulfur and compound fertilizer prices, Sep 11, 2026. https://news.qq.com/rain/a/20260911A0ASP600
- Shanghai Metals Market (SMM), August phosphate ore imports and exports surge as peak demand season arrives, Sep 21, 2026 (export-control window Mar 14–Aug 31, 2026). https://news.metal.com/newscontent/104126504-august-phosphate-ore-imports-and-exports-surge-as-peak-demand-season-arrives-smm-analysis
- Australian Fertilizer Corporation, Weekly Update — Global Fertiliser Markets, w/e Aug 28, 2026 and w/e Sep 11, 2026. https://ausfertcorp.com/weekly-update-global-fertiliser-markets-w-e-28-08-2026/ ; https://ausfertcorp.com/weekly-update-global-fertiliser-markets-w-e-11-09-2026/
- Fertilizer International / BC Insight (CRU), Market Insight, Sep 15, 2026 (market snapshot as of Aug 20, 2026). https://www.bcinsight.crugroup.com/2026/09/15/market-insight-41/
- World Bank, Commodities Price Data (The Pink Sheet), Sep 2, 2026 (DAP, spot, f.o.b. US Gulf). https://thedocs.worldbank.org/en/doc/74e8be41ceb20fa0da750cda2f6b9e4e-0050012026/related/CMO-Pink-Sheet-September-2026.pdf
- Investing.com, DAP FOB NOLA Futures Historical Data (CME), retrieved Sep 21, 2026 (Sep 18, 2026 settlement $802.50/st). https://www.investing.com/indices/dap-fob-nola-futures-historical-data
- DTN/Progressive Farmer, Fertilizer Prices Continue Lower for 6 of 8 Major Nutrients, Sep 16, 2026 (survey week Sep 7–11). https://www.dtnpf.com/agriculture/web/ag/crops/article/2026/09/16/fertilizer-prices-continue-lower-6-8
- DTN/Progressive Farmer, Less Chinese Phosphorus Exports, Continuing Countervailing Duties Affect P 2026 Outlook, Dec 19, 2025 (CRU, Rabobank, StoneX, ICIS commentary). https://www.dtnpf.com/agriculture/web/ag/crops/article/2025/12/19/less-chinese-phosphorus-exports-p
- SunSirs, The Logic Behind China's Phosphate Fertilizer Export Suspension (2024 and Jan–Sep 2025 DAP/MAP export volumes, China customs). https://www.sunsirs.com/commodity-news/petail-28842.html
- CZapp, More Clarity on Chinese Exports for Fertiliser Market, May 19, 2025 (May–Sep 2025 quota of 2 million t DAP and 1 million t MAP). https://www.czapp.com/analyst-insights/more-clarity-on-chinese-exports-for-fertiliser-market/
- Rural Voice, Global Sulfur Shortage Keeps DAP Prices High; Government Subsidy Decision Awaited, Sep 14, 2026. https://eng.ruralvoice.in/national/global-sulfur-shortage-keeps-dap-prices-high-government-subsidy-decision-awaited.html
- PW (Physics Wallah), Nutrient Based Subsidy (NBS) 2026: Kharif Subsidy Rates, DAP Price & Budget, May 21, 2026 (N ₹47.32, P ₹52.76, K ₹2.38, S ₹3.16 per kg; ₹41,533.81 crore). https://www.pw.live/upsc/exams/nutrient-based-subsidy-nbs-2026
- Prime Minister's Office / PIB, Cabinet approves Nutrient Based Subsidy (NBS) rates for Kharif Season, 2026 (from 01.04.2026 to 30.09.2026) on Phosphatic and Potassic (P&K) fertilizers, Apr 2026. https://www.pmindia.gov.in/en/news_updates/cabinet-approves-nutrient-based-subsidy-nbs-rates-for-kharif-season-2026-from-01-04-2026-to-30-09-2026-on-phosphatic-and-potassic-pk-fertilizers/
- PIB, Nutrient-Based Subsidy Rates for Rabi 2025-26 (N ₹43.02, P ₹47.96 per kg; DAP ₹29,805/t). https://www.pib.gov.in/PressNoteDetails.aspx?NoteId=156820&ModuleId=3®=1&lang=1
- Argus Media, Indian DAP importers, producers rely on support in rabi, Jan 15, 2026 (₹3,500/t special support; $668/t CFR). https://www.argusmedia.com/en/news-and-insights/latest-market-news/2776164-indian-dap-importers-producers-rely-on-support-in-rabi
- Argus Media, India 3Q phosacid settles at $1,700/t P2O5 cfr, Q3 2026. https://www.argusmedia.com/en/news-and-insights/latest-market-news/2846639-india-3q-phosacid-settles-at-1-700-t-p2o5-cfr
- Argus Media, Tampa 3Q liquid sulphur price hits record $705/lt, Jul 2026. https://www.argusmedia.com/en/news-and-insights/latest-market-news/2851577-tampa-3q-liquid-sulphur-price-hits-record-705-lt
- World Fertilizer, Indian DAP stocks improve but future remains uncertain, Jun 25, 2026. https://www.worldfertilizer.com/phosphates/25062026/indian-dap-stocks-improve-but-future-remains-uncertain/
- Free Press Journal, India Boosts Fertiliser Supply With Urea, DAP Imports Amid Global Disruptions, Jul 2026 (FY2025-26 DAP imports 61.94 lakh t; Q1 FY2026-27 7.11 lakh t; domestic output 9.84 lakh t). https://www.freepressjournal.in/amp/business/india-boosts-fertiliser-supply-with-urea-dap-imports-amid-global-disruptions
- LatestLY / ANI, Fertilizer Availability Adequate During Kharif 2026, Centre Tells Parliament, Jul 31, 2026 (Lok Sabha written reply; data Apr 1–Jul 27, 2026). https://www.latestly.com/agency-news/business-news-fertilizer-availability-adequate-during-kharif-2026-centre-tells-parliament-7540066.html
- Swarajya, Government Rejects Fertiliser Shortage Claims Ahead Of Kharif 2026, Apr 2026; Organiser, Apr 26, 2026 (DAP stocks 2.21 million t vs 1.30 million t a year earlier). https://swarajyamag.com/economy/government-rejects-fertiliser-shortage-claims-ahead-of-kharif-2026-46-per-cent-requirement-already-available-as-opening-stock
- Veloxx Media, Government Declares Fertiliser Stocks at Decade-High Levels, Mar 2026 (DAP inventory 25.17 LMT as of Mar 10, 2026). https://veloxxmedia.com/government-declares-fertiliser-stocks-at-decade-high-levels-securing-rabi-and-kharif-crop-seasons/
- PIB, India Secures 86 Lakh Tonnes of Fertilizers via Global Pacts (Rabi 2025-26 DAP requirement and availability). https://www.pib.gov.in/PressReleasePage.aspx?PRID=2237491®=3&lang=2
- DTN Next / PTI, Rupee closes unchanged at 95.89 against US dollar, Sep 18, 2026. https://www.dtnext.in/news/business/rupee-closes-unchanged-at-9589-against-us-dollar
- Tradingpedia, PBOC Nudges Yuan Fix Stronger as Parity Rate Ticks Up, Sep 18, 2026 (USD/CNY central parity 6.7521). https://www.tradingpedia.com/2026/09/18/pboc-nudges-yuan-fix-stronger-as-parity-rate-ticks-up/
- Rural Voice, Government Approves ₹37,952 Crore Fertiliser Subsidy for Rabi 2025-26, Oct 2025. https://eng.ruralvoice.in/national/government-approves-rs-37952-crore-fertiliser-subsidy-for-rabi-2025-26-to-ensure-affordable-prices-for-farmers.html
Disclosures
Crop Root Zone is an independent publication. Nothing here is investment advice. Market calls, where included, reflect the editors' own read and are not a recommendation to buy or sell any security.
Retail Potash Averages $494 a Ton and the Barge at New Orleans Is $340. That $154 Gap Is $30 Narrower Than in March, Because Wholesale Rose 11% While Retail Rose 1%.
DTN's Sep 7–11 survey put national retail potash at $494 a ton, inside the $484–$495 band it has held for fourteen consecutive survey weeks. The last public NOLA barge print was $340/st FOB on Aug 20, against $300–$310 in late March, and Corn Belt warehouse references were $375–$390/st FOB in mid-July. That puts the retail-over-barge spread near $154 a ton, about 45%, against $184 and 60% in March — compression that came entirely from the wholesale end rising, not from the retail number falling. Mosaic realized $275 a tonne for MOP FOB mine in the second quarter and Nutrien $267, so roughly $90 a short ton separates the mine from the barge and another $154 separates the barge from the farm gate. At 150 lb K2O an acre the whole fourteen-month retail range is worth $1.38 an acre, while the gap between the cheapest and dearest Illinois distributor ask on Sep 4 was worth $11.25.
A ton of potash cost a US grower an average of $494 in the second week of September, and a ton of the same nutrient cost $340 on a barge at New Orleans in the third week of August. The first number comes from DTN's retail survey for Sep 7–11 (DTN/Progressive Farmer, Sep 16, 2026). The second is the US Gulf assessment carried in the September–October issue of Fertilizer International, which prints US potash at $340/st f.o.b. as of Aug 20 and calls it steady (Fertilizer International 534, Sep 15, 2026). The $154 between them is the whole freight, storage, handling and margin chain from the river to the field. That chain was worth about $184 a ton in late March, when the barge market was $300–$310/st FOB and retail was $489 (Advanced Turf Solutions, Mar 30, 2026; DTN/Progressive Farmer, Sep 16, 2026). Nothing happened to the retail price in between — it moved $5, or 1% — so the entire $30 of compression came from the wholesale end going up. That is a different situation from a retail price coming down, and it points the fall risk the other way.
1. The spread narrowed by $30 without the farm-gate price moving
What's new: The retail-over-barge spread on potash has fallen from roughly 60% of the barge price in March to roughly 45% in August and September. Every dollar of the change came from NOLA, not from the retail counter.
Evidence: DTN publishes a national retail average every four weeks. Public NOLA barge and inland warehouse references appear less often and with a lag, so the comparison below pairs each DTN survey week with the nearest dated public wholesale print. The first four pairs are within a week of each other. The last pair is not, and is flagged accordingly.
| Date pair | Retail, $/st | NOLA barge, $/st FOB | Spread, $/st | Spread, % of barge |
|---|---|---|---|---|
| Mar 23–27 retail / Mar 27 barge | 489 | 305* | 184 | 60% |
| May 18–22 retail / May 29 barge | 494 | 343* | 152 | 44% |
| Jul 13–17 retail / Jul 17 barge | 494 | 340* | 154 | 45% |
| Aug 10–14 retail / Aug 20 barge | 495 | 340 | 155 | 46% |
| Sep 7–11 retail / Aug 20 barge | 494 | 340 | 154 | 45% |
Sources: Retail — DTN/Progressive Farmer, Sep 16, 2026, national average $/ton as quoted to growers by surveyed retailers. Barge — Advanced Turf Solutions, "US Fertilizer Market Summary," Mar 30, 2026, Jun 1, 2026 and Jul 20, 2026 (assessments dated Mar 27, May 29 and Jul 17), and Fertilizer International 534, Sep 15, 2026 (assessment dated Aug 20). *Barge cells marked with an asterisk are the midpoint of a quoted range: $300–$310, $340–$345 and $335–$345/st FOB respectively. Spreads and percentages are Crop Root Zone estimates. The last row pairs a September retail print with the most recent public August barge print; no September NOLA assessment was publicly reachable at the time of writing.
$154/st
The gap between the September national retail potash average and the last public NOLA barge print — down from about $184 in late March, with the barge up 11% and retail up 1%. (Crop Root Zone estimate from DTN/Progressive Farmer, Sep 16, 2026; Advanced Turf Solutions, Mar 30, 2026; Fertilizer International 534, Sep 15, 2026)
Two facts sit behind that table and neither is disputed. NOLA potash rose from $300–$310/st in late March to $335–$345 by mid-July and held $340 through Aug 20. National retail potash printed $489 in the Mar 23–27 survey and $494 in the Sep 7–11 survey. On a year-over-year basis both legs are close to flat: the mid-July report shows the barge a year earlier at $335–$340/st, within $3 of today, and DTN's Sep 8–12, 2025 retail print was $488, within $6 of today (Advanced Turf Solutions, Jul 20, 2026; DTN/Progressive Farmer, Sep 16, 2026). The spread compression is a 2026 event inside an otherwise motionless year.
Ground Truth: A narrowing spread is usually read as the retail channel giving ground. This one is the opposite, and the distinction decides where the fall risk sits. Retailers have been selling tons bought earlier and cheaper — summer-fill and carryover inventory — into a flat retail price while replacement cost at the river climbed $35 a ton. Gross margin on the next ton they buy is $30 thinner than on the last one. When a channel's replacement cost rises and its posted price does not, the posted price moves up later or the channel stops buying. For a grower, that means the more likely path for retail potash between now and spring is a step up of $15 to $25 a ton rather than a slide, unless the barge falls first. Which of those two legs moves first is the actual fall potash question, not whether potash is "cheap."
2. The chain from the mine to the farm gate, layer by layer
What's new: Every layer of the North American potash price is publicly observable this month except one — the fill-program price itself — and the layers do not stack the way most fall-buying commentary assumes. The single largest step is not the producer's margin. It is the $154 between the barge and the farm gate.
Evidence: The table below prices the same nutrient at five points in the chain. Metric-tonne figures from company reporting are converted to short tons at 1.10231 st/MT. The dates are not identical and the bases differ, which is stated in each row rather than smoothed over.
| Layer | $/st | Basis | Date | |
|---|---|---|---|---|
| Nutrien potash net realized | 242 | Net selling price, $267/MT | Q2 2026 average | █████░░░░░ |
| Mosaic MOP selling price | 249 | FOB mine, $275/MT | Q2 2026 average | █████░░░░░ |
| US Gulf barge | 340 | FOB NOLA | Aug 20, 2026 | ███████░░░ |
| Corn Belt warehouse | 383* | FOB warehouse, $375–$390 range | Jul 17, 2026 | ████████░░ |
| Illinois distributor ask | 500 | FOB distributor, white MOP 0-0-62 | Sep 4, 2026 | ██████████ |
| National retail average | 494 | As quoted to growers | Sep 7–11, 2026 | ██████████ |
Sources: Nutrien Ltd., Q2 2026 results (Form 6-K, Exhibit 99.1), Aug 5, 2026; The Mosaic Company, Q2 2026 results, Aug 4, 2026; Fertilizer International 534, Sep 15, 2026; Advanced Turf Solutions, Jul 20, 2026; USDA AMS Illinois Production Cost Report, Sep 4, 2026; DTN/Progressive Farmer, Sep 16, 2026. *Corn Belt warehouse is the midpoint of the $375–$390/st quoted range. Short-ton conversions and bar scaling are Crop Root Zone estimates; bars scale $500 to ten blocks. Producer prices are quarterly global averages across all destinations, not Saskatchewan-to-NOLA netbacks, and are not directly comparable to a spot barge price.
Read down the column, the producer captures a price in the $240s a short ton on a blended global basis, the barge market adds about $90, the move upriver and into a Corn Belt warehouse adds about $43, and the last leg to the grower adds about $111. Mosaic reported MOP cash cost of production at $84 a tonne in the quarter, against a $275 selling price, and Nutrien reported potash cost of goods sold at $113 a tonne against $267 (The Mosaic Company, Aug 4, 2026; Nutrien Ltd., Aug 5, 2026). Those are the widely quoted numbers in potash commentary. They are also the part of the chain a North American grower has no access to and no decision about.
The part the grower does touch is the distribution leg, and there is a public read on it. Nutrien's retail segment reported North American crop nutrient gross margin of $167 a tonne in the second quarter, about $151 a short ton, up from $146 a tonne a year earlier, on volumes that fell from 4,419 to 3,795 thousand tonnes (Nutrien Ltd., Aug 5, 2026). That figure covers all crop nutrients, not potash alone, and it is gross margin before selling and administrative cost, so it is not a profit number. It is still striking that a disclosed, all-nutrient retail gross margin of about $151 a short ton lands within $3 of the potash-specific retail-over-barge gap of $154 — a gap that also has to absorb barge freight upriver, truck freight to the plant, storage, shrink and handling.
Ground Truth: The $154 is not a markup waiting to be negotiated away, and treating it as one wastes the negotiation. Most of it is physical cost between New Orleans and a shed in a county seat, and the disclosed retail margin data suggest the discretionary slice is smaller than the headline gap implies. The money a fall buyer can actually reach is not in the spread. It is in the dispersion within one retail market — which the next sections put a dollar figure on.
3. Fourteen survey weeks inside an $11 band, and what waiting is therefore worth
What's new: National retail potash has printed between $484 and $495 in every DTN survey from Sep 8–12, 2025 through Sep 7–11, 2026. That is a $11 range, 2.3% of the price, across a full year that included a nitrogen market moving by hundreds of dollars.
Evidence: The same DTN table that carries potash carries urea. Over the fourteen surveys, urea ran from $566 to $866 and back to $658; potash never left its band.
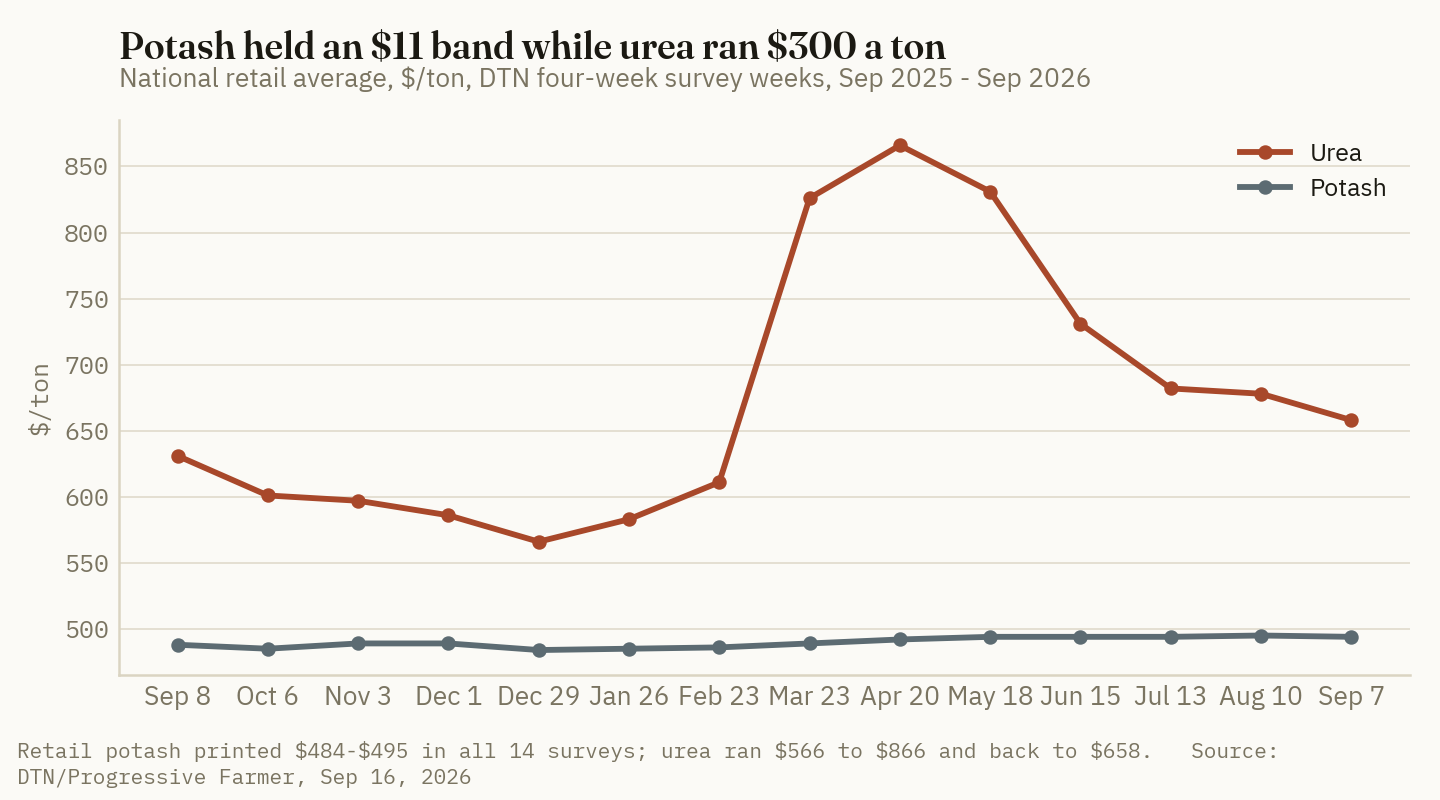
The practical consequence is arithmetic. A 0-0-60 product carries 60% K2O, so 150 lb of K2O an acre is 250 lb of product, or 0.125 short tons. The full fourteen-month retail range, $11 a ton, is therefore worth $1.38 an acre at that rate. Priced across the chain, the same acre looks like this:
| Rate, lb K2O/acre | 0-0-60 product, lb/acre | At NOLA $340 | At warehouse $383 | At retail $494 | At the high Illinois ask $550 |
|---|---|---|---|---|---|
| 100 | 167 | $28.33 | $31.88 | $41.17 | $45.83 |
| 150 | 250 | $42.50 | $47.81 | $61.75 | $68.75 |
| 200 | 333 | $56.67 | $63.75 | $82.33 | $91.67 |
Crop Root Zone calculation from the price layers in section 2. Product weight assumes 60% K2O and no application, blending or spreading charge. Rates shown are arithmetic illustrations across a plausible maintenance range, not agronomic recommendations; the rate is a soil-test question.
The $550 column is not hypothetical. USDA's Sep 4 Illinois Production Cost Report put the average distributor ask for white MOP at $500.42 a ton FOB, with a reported range of $460.00 to $550.00 (USDA AMS Illinois Production Cost Report, Sep 4, 2026). That $90 range inside a single state is 58% of the entire $154 retail-over-barge spread, and at 150 lb K2O an acre it is worth $11.25 an acre — eight times what the whole fourteen-month national price range was worth. Geography widens it further: the same USDA report series for the Pacific Northwest on the same day showed white MOP averaging $744.17 a ton and red 0-0-60 at $690.00, on distributor ask ranges of $637.00–$851.33 and $565.00–$830.00 (USDA AMS Pacific Northwest Production Cost Report, Sep 4, 2026). A grower 1,800 miles from the river pays a different fertilizer market, not a different fertilizer.
Ground Truth: Measured in dollars an acre, "buy fall potash now or wait" is close to a non-question, and the attention it absorbs would be better spent on the quote. The entire national price range of the past fourteen months is $1.38 an acre at a 150-pound rate. The gap between two Illinois distributors on the same Friday is $11.25. A grower who spends an afternoon collecting three bids is working on a number eight times larger than the one the market has offered all year — and unlike the market number, it is available today and does not depend on being right about the barge. Potash is the nutrient where shopping beats timing by the widest margin, precisely because it is the nutrient that does not move.
4. The global setting only matters here through one number: the barge
What's new: The North American retail price is anchored to the NOLA barge, and the barge is priced at rough import parity with Brazil. That is the single channel through which the 2026 contract settlements, Belarusian supply and offshore demand reach a Midwest grower.
Evidence: Converted to metric tonnes, the $340/st US Gulf assessment is about $375/MT FOB. The offshore references on the same assessment date sit just above it.
| Market | Price | Basis | Date |
|---|---|---|---|
| US Gulf | $340/st (≈$375/MT) | FOB barge | Aug 20, 2026 |
| Brazil, granular | $390–$403/MT | CFR | Aug 20, 2026 |
| Brazil, October deliveries expected | $370–$380/MT | CFR | Aug 20, 2026 |
| Southeast Asia, granular | $410–$420/MT | CFR | Aug 20, 2026 |
| Southeast Asia, standard | $380–$423/MT | CFR | Aug 20, 2026 |
| Europe, granular | €350–€370/MT | CIF | Aug 20, 2026 |
| India, 2026 annual contract | $383/MT | CFR, 180-day credit | Settled May 18, 2026 |
| China, 2026 annual contract | $348/MT | CFR | Settled Nov 2025 |
Sources: Fertilizer International 534, Sep 15, 2026 (assessments dated Aug 20, 2026); Fertilizer Daily, May 20, 2026 (India and China contract settlements). The short-ton to metric-tonne conversion of the US Gulf figure is a Crop Root Zone estimate at 1.10231 st/MT. CFR prices include freight and are not directly comparable to an FOB barge price.
The India contract settled at $383/MT CFR on May 18, $34 above the 2025 contract and $35 above China's, which the reporting describes as the widest India–China spread in over a decade (Fertilizer Daily, May 20, 2026). Those settlements gave North American producers the cover to announce summer fill at flat rather than discounted values — the pattern a StoneX note described in the prior season, when programs came out level with spot instead of at the customary early-buyer discount (StoneX, Jul 1, 2025). The supply side has been quiet in the right direction: Nutrien raised full-year potash sales volume guidance to 14.2–14.8 million tonnes on strong offshore demand and forecast global shipments of 74–77 million tonnes, describing markets as constructive on "favorable affordability, healthy demand in all major global markets and stable supply" (Nutrien Ltd., Aug 5, 2026). Mosaic described North American demand as resilient with inventories tightening (The Mosaic Company, Aug 4, 2026).
Two political facts belong here because they act on the barge rather than on the rhetoric. Potash was excluded from the 50% Section 338 tariffs on Canadian goods signed Jul 20 and effective Aug 19, so the roughly 90% of US supply that comes from Canada crosses duty-free where it qualifies under USMCA (World Fertilizer, Jul 23, 2026). And the US lifted financial sanctions on Belaruskali in March 2026, while EU import sanctions and the Lithuanian transit ban remain in force, leaving Belarusian tons routed through Russian Baltic ports (RFE/RL, May 22, 2026). Potash was also added to the USGS critical minerals list in the final 2025 list published Nov 7, 2025 (Federal Register, Nov 7, 2025). Each of these changes the probability distribution of the barge price. None of them changes what a grower pays this week.
Ground Truth: The most actionable line in that table is the one about October. Brazilian granular was $390–$403/MT CFR on Aug 20 with October deliveries already expected at $370–$380, and Brazilian buying normally goes quiet after safrinha requirements are covered (Fertilizer International 534, Sep 15, 2026; Australian Fertilizer Corporation, w/e Aug 28, 2026). With NOLA at roughly $375/MT FOB, the US Gulf is already at parity with where Brazil is heading, not with where it has been. If Brazilian CFR settles into the $370s, the export pull that lifted NOLA $35 since March weakens, and the barge is the leg more likely to move first. That is the specific thing to watch between now and Thanksgiving — not the retail print, which will lag either direction by a month or more.
5. What is not public, and what a fall buyer can act on anyway
What's new: The one number in this chain that is not publicly observable is the fill-program price itself — what a retailer actually paid a producer for the tons now sitting in the shed. Everything a grower is told about "fill" pricing is inference from the layers around it.
Evidence: North American producers announce summer fill programs in roughly mid-June, historically at a discount to spot designed to pull early commitments, with the offer price stepping up as volume tiers fill (StoneX, Jul 1, 2025). No dated 2026 North American potash fill-program price was publicly reachable for this piece. What is reachable is the surrounding evidence: the barge was $340–$345/st through the June–July window; Corn Belt warehouse references settled at $370–$390/st FOB at the end of May, the high end having firmed $10 that week, and stood at $375–$390 in mid-July; and Saskatchewan granular mine offers were reported holding at $393–$395/st in mid-July (Advanced Turf Solutions, Jun 1, 2026 and Jul 20, 2026). Those bracket the fill price without establishing it, and this desk will not publish a number it cannot source.
Three things a fall buyer can act on are established:
| What is established | Figure | Source date |
|---|---|---|
| National retail range, last 14 surveys | $484–$495/st | Sep 8, 2025 – Sep 11, 2026 |
| Distributor ask range, Illinois, one day | $460–$550/st | Sep 4, 2026 |
| Retail-over-barge spread, now vs March | $154 vs $184/st | Aug–Sep 2026 vs Mar 2026 |
Sources: DTN/Progressive Farmer, Sep 16, 2026; USDA AMS Illinois Production Cost Report, Sep 4, 2026; Advanced Turf Solutions, Mar 30, 2026; Fertilizer International 534, Sep 15, 2026. Spreads are Crop Root Zone estimates.
The first says the market has not rewarded waiting. The second says the counterparty choice is worth more than the market call. The third says the channel's cushion is thinner than it was in March, which is the part of this that is genuinely new information going into the fall application window.
Ground Truth: Ask the retailer one question that is not about price: when were these tons bought. A shed filled on a June fill program at a $300-something replacement cost can hold $494 through fall without strain. A shed being restocked now at $340 NOLA plus freight cannot, and the quote will show it — either in the number or in how long it is held open. The tell is the validity window on the bid, not the bid. Quotes that expire in days rather than weeks are the first visible sign that the compression described in section 1 has reached the counter, and they will appear before the DTN national average registers anything at all.
References
- DTN/Progressive Farmer, Russ Quinn, "Fertilizer Prices Continue Lower for 6 of 8 Major Nutrients," Sep 16, 2026 (retail survey Sep 7–11, 2026, and the fourteen-survey monthly table back to Sep 8–12, 2025) — https://www.dtnpf.com/agriculture/web/ag/crops/article/2026/09/16/fertilizer-prices-continue-lower-6-8
- Fertilizer International 534 (Sep–Oct 2026), "Market Insight," BCInsight / CRU Group, published Sep 15, 2026 (potash assessments dated Aug 20, 2026) — https://www.bcinsight.crugroup.com/2026/09/15/market-insight-41/
- Advanced Turf Solutions, "U.S. Fertilizer Market Summary 7/20/2026" (assessments dated Jul 17, 2026) — https://www.advancedturf.com/wp-content/uploads/2026/07/ATS-Fertilizer-Market-Update-7_20_2026.pdf
- Advanced Turf Solutions, "US Fertilizer Market Summary 6/1/2026" (assessments dated May 29, 2026) — https://www.advancedturf.com/wp-content/uploads/2026/04/ATS-Fertilizer-Market-Update-6_1_2026.pdf
- Advanced Turf Solutions, "US Fertilizer Market Summary 3/30/2026" (assessments dated Mar 27, 2026) — https://www.advancedturf.com/wp-content/uploads/2026/03/ATS-Fertilizer-Market-Update-3_30_2026.pdf
- USDA AMS, Illinois Production Cost Report (Bi-weekly), Sep 4, 2026 — https://www.ams.usda.gov/mnreports/ams_3195.pdf
- USDA AMS, Pacific Northwest Production Cost Report (Bi-weekly), Sep 4, 2026 — https://www.ams.usda.gov/mnreports/ams_3657.pdf
- The Mosaic Company, Second Quarter 2026 Results (Exhibit 99.1), Aug 4, 2026 — https://www.sec.gov/Archives/edgar/data/1285785/000128578526000109/pressreleaseq22026-ex991.htm
- Nutrien Ltd., Second Quarter 2026 Results (Form 6-K, Exhibit 99.1), Aug 5, 2026 — https://www.sec.gov/Archives/edgar/data/0001725964/000119312526335517/d129364dex991.htm
- Fertilizer Daily, "Indonesia returns to MOP market with 20,000-ton tender after India settles benchmark contract," May 20, 2026 (India 2026 contract $383/MT CFR; China $348/MT CFR) — https://www.fertilizerdaily.com/20260520-indonesia-returns-to-mop-market-with-20000-ton-tender-after-india-settles-benchmark-contract/
- World Fertilizer, "New US tariffs on Canada exclude fertilizers," Jul 23, 2026 — https://www.worldfertilizer.com/potash/23072026/new-us-tariffs-on-canada-exclude-fertilizers/
- Federal Register, "Final 2025 List of Critical Minerals," Nov 7, 2025 — https://www.federalregister.gov/documents/2025/11/07/2025-19813/final-2025-list-of-critical-minerals
- RFE/RL, "Exclusive: US Asks Lithuania, Poland, Ukraine To Allow Belarusian Fertilizer Exports," May 22, 2026 — https://www.rferl.org/a/belarus-fertilizer-potash-exports-us-sanctions-eu/33762526.html
- StoneX, Josh Linville, "July '25 Farmer Fertilizer Newsletter — Potash," Jul 1, 2025 (summer fill program mechanics) — https://www.stonex.com/en/insights/july-25-farmer-fertilizer-newsletter---potash/
- Australian Fertilizer Corporation, "Weekly Update – Global Fertiliser Markets – w/e 28.08.2026" — https://ausfertcorp.com/weekly-update-global-fertiliser-markets-w-e-28-08-2026/
- DTN/Progressive Farmer, Russ Quinn, "Potash Fertilizer Outlook Positive for 2026," Dec 26, 2025 — https://www.dtnpf.com/agriculture/web/ag/crops/article/2025/12/26/potash-fertilizer-outlook-positive
Disclosures
Crop Root Zone is an independent publication. Nothing here is investment advice. Market calls, where included, reflect the editors' own read and are not a recommendation to buy or sell any security.
Washington Suspended the 16.60% Moroccan Phosphate Duty on July 8. Ten Weeks Later Retail DAP Is $923/st — $13 Higher Than the Week It Was Signed.
A June 29 emergency proclamation under Section 318 of the Tariff Act let OCP ship into New Orleans duty-free for the first time since 2021, and 54,000 t landed within weeks. USDA put the relief at up to 22% off phosphate costs and $1.82 billion a year across 97 million acres — $18.76/acre. DTN's retail DAP average has instead gone from $910/st in the survey week of June 29–July 2 to $923/st on September 7–11, with MAP at $962/st. The reason is that the duty stopped being the binding constraint some time ago: NOLA barge DAP has been clearing below Indian and Latin American CFR values all year, US tonnes are moving out as exports rather than in as relief, and the Russian orders that cover the other half of the case are still fully in force at 12.71% to 23.77%. At the 64 lb P2O5/acre USDA's survey data show corn actually receives, fall DAP costs $64.21/acre — 13.4 bu of $4.80 corn.
On July 8, 2026, Commerce published the notice that made it real: phosphate fertilizers from Morocco could enter the United States free of countervailing duties and free of cash deposits, on written request, shipment by shipment. The authority was a declaration of emergency the President signed on June 29 under Section 318 of the Tariff Act of 1930, good for the earlier of eight months or the end of the emergency — so, late February 2027. OCP had a vessel moving inside two weeks; 54,000 metric tons discharged at New Orleans, the first Moroccan phosphate to clear a US port since 2021. USDA's own framing was that the waiver was worth as much as 22% off phosphate costs and $1.82 billion a year to roughly 100,000 farmers across 97 million planted acres. Ten weeks on, DTN's national retail DAP average is $923/st and MAP is $962/st. Both are higher than they were the week the proclamation was signed.
1. The waiver landed, and retail did not move
What's new: The retail phosphate market has not registered the suspension. DTN's weekly retail survey — the closest thing the trade has to a public farmgate benchmark — had DAP at $910/st and MAP at $953/st in the survey week of June 29–July 2, 2026, the week the emergency was declared (DTN/Progressive Farmer, Jul 8, 2026). In the survey week of September 7–11 it had DAP at $923/st and MAP at $962/st (DTN/Progressive Farmer, Sep 16, 2026). DAP is up $13/st, MAP up $9/st, and both are up on the year: DAP +7%, MAP +5%.
Evidence: The weekly path shows no discontinuity at all around the July 8 applicability date.
| Survey week | DAP, $/st | MAP, $/st | Note |
|---|---|---|---|
| Jun 29 – Jul 2, 2026 | 910 | 953 | Emergency declared Jun 29 |
| Jul 20 – Jul 24, 2026 | 913 | 958 | Waiver applicable Jul 8; first OCP cargo loading |
| Aug 31 – Sep 4, 2026 | 919 | 959 | First cargo discharged New Orleans |
| Sep 7 – Sep 11, 2026 | 923 | 962 | +$13/st DAP vs. the declaration week |
Basis: DTN national average retail price, delivered to farm, $/short ton. Source: DTN/Progressive Farmer Retail Fertilizer Trends, Jul 8, Jul 29, Sep 9 and Sep 16, 2026.
$18.76/acre
USDA's stated $1.82 billion of annual savings, spread across the 97 million planted acres the department attached to it. The observed change in retail DAP cost since the declaration, at corn's survey application rate, is $0.91/acre — in the other direction. (USDA estimate as reported by DTN/Progressive Farmer, Jul 17, 2026; per-acre arithmetic is ours.)
2. What the duty schedule actually is
What's new: "The Moroccan duty" is a moving number, and only half the case is suspended. OCP's operative cash-deposit rate before the waiver was 16.60% ad valorem — not the 19.97% of the original 2021 order, and not the 2.12% that the first administrative review briefly produced. Commerce set 16.81% in the final results of the 2022 review, then amended it to 16.60% for a ministerial error (Commerce, Federal Register, Dec 26, 2024). A Court of International Trade judgment of Dec 16, 2025 later trimmed the 2020–21 review rate from 2.12% to 2.11%, but Commerce declined to reissue deposit instructions because the 16.60% rate supersedes it (Commerce, Federal Register, Jan 12, 2026).
The Russian orders are untouched by the proclamation. JSC Apatit — PhosAgro and thirteen cross-owned affiliates — carries 12.71% from the 2023 review (Commerce, Federal Register, Apr 17, 2026). EuroChem's Industrial Group Phosphorite carries 23.77% from the amended order, and the all-others rate is 16.30% (Commerce, Federal Register, Jan 29, 2024).
Evidence: Both orders are simultaneously in their first five-year sunset, initiated March 2, 2026. Commerce has already told the Commission what it thinks would happen on revocation.
| Origin / exporter | Cash deposit now | Rate Commerce says would recur | Status | |
|---|---|---|---|---|
| Morocco — OCP S.A. | 16.60% | 20.04% | ███████ |
Duty-free on request, Jul 8, 2026 – late Feb 2027 |
| Russia — IG Phosphorite (EuroChem) | 23.77% | 24.11% | ██████████ |
In force |
| Russia — all others | 16.30% | 16.64% | ███████ |
In force |
| Russia — JSC Apatit (PhosAgro) | 12.71% | 14.64% | █████ |
In force |
Basis: net countervailable subsidy, percent ad valorem; bars scale the cash-deposit column. Sources: Commerce, Federal Register, Dec 26, 2024 (Morocco amended final, 2022 review); Apr 17, 2026 (Russia final, 2023 review); Jan 29, 2024 (Russia amended order); Jul 24, 2026 (Morocco sunset preliminary); Jun 30, 2026 (Russia sunset final).
The Commission decided on June 17, 2026 to conduct full five-year reviews rather than expedited ones, which pushes the injury half of the determination deep into the calendar. Commerce's own final sunset results run 240 days from the March 2 initiation. The waiver, meanwhile, expires in late February.
Ground Truth: The dates do not line up in the grower's favor. The duty-free window covers the fall application season and closes just as spring prepay books are being written, while the sunset decision that would extend the orders for another five years lands months earlier. If both go the way the paperwork currently points — orders continued, waiver lapsed — the duty snaps back into the spring 2027 buying window with no transition. The asymmetric risk in this file is not the fall tonne. It is the spring tonne bought on the assumption that duty-free Moroccan supply is now a standing feature of the market.
3. The United States is not the expensive market any more
What's new: The premise of the waiver — that the duty makes American phosphate dear relative to the world — described 2021 through 2024 well and describes 2026 poorly. NOLA has been clearing at or below international CFR values for most of this year. Argus reported in April that NOLA DAP/MAP was worth about $842/t on a CFR-equivalent basis against $865–900/t CFR into Latin America and India (Argus Media, Apr 13, 2026). The gap has persisted: DAP into India was assessed at $900–915/MT CFR in the week ended September 11, and MAP into Brazil at $840–860/MT CFR in the week ended August 28 (Australian Fertilizer Corporation weekly market update, Sep 11 and Aug 28, 2026).
Evidence: US Gulf barge values have round-tripped twice in two years without ever detaching upward from the world market.
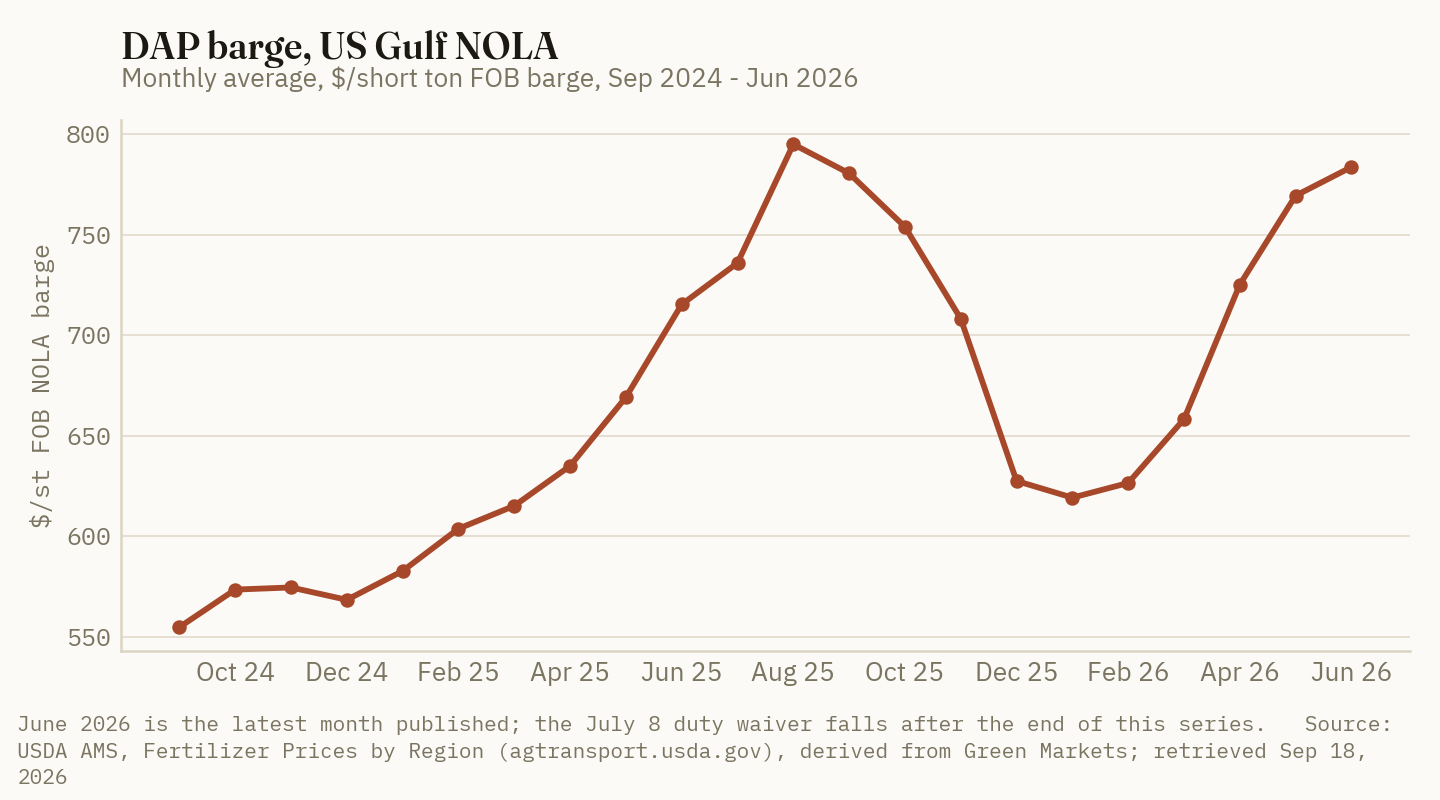
| Benchmark | Basis | Level | As of | Source |
|---|---|---|---|---|
| DAP, US Gulf NOLA | FOB barge, $/st (monthly avg) | 783.75 | Jun 2026 | USDA AMS / Green Markets |
| DAP, US Gulf NOLA | FOB barge, $/MT equivalent* | 864 | Jun 2026 | Conversion, 1.10231 st/MT |
| DAP, India | CFR India, $/MT | 900–915 | w/e Sep 11, 2026 | AusFertCorp weekly |
| MAP, Brazil | CFR Brazil, $/MT | 840–860 | w/e Aug 28, 2026 | AusFertCorp weekly |
| DAP, Mosaic realized | FOB plant, $/tonne | 773 | Q2 2026 | Mosaic Q2 2026 call, Aug 5, 2026 |
| DAP, Mosaic guidance | FOB plant, $/tonne | 820–840 | Q3 2026 | Mosaic Q2 2026 call, Aug 5, 2026 |
| DAP, US retail | Delivered farm, $/st | 923 | wk Sep 7–11, 2026 | DTN/Progressive Farmer |
| MAP, US retail | Delivered farm, $/st | 962 | wk Sep 7–11, 2026 | DTN/Progressive Farmer |
Sources: USDA AMS / Green Markets via agtransport.usda.gov (Jun 2026 monthly average); Australian Fertilizer Corporation weekly updates, Aug 28 and Sep 11, 2026; Mosaic Q2 2026 earnings call, Aug 5, 2026; DTN/Progressive Farmer, Sep 16, 2026.
*Unit conversion only, not a separate assessment. CFR values include freight; the NOLA barge price does not, so the true landed comparison widens the gap further in the US market's favour.
The trade flow confirms the price signal. In February, roughly 170,000 t of DAP arrived at NOLA — including 132,000 t of Saudi material — and by early March barges were being bid up specifically because a global distributor was buying them for re-export to Latin America (Argus Media, Mar 2, 2026). Mosaic shipped about 201,000 t of DAP and MAP out of the country in the first quarter of 2026, at least 85,700 t more than a year earlier (Argus Media, Apr 13, 2026). A market that is short does not export its way out of the shortage.
Ground Truth: Duty-free Moroccan tonnes do not have to come here to be sold. OCP prices against the best netback available, and through 2026 that has been India and Brazil, not New Orleans. Expect the waiver to show up first as OCP margin and optionality and only second — if at all — as US retail relief, and expect the volume that does arrive to be modest and opportunistic rather than the structural re-entry the proclamation assumed. For a fall buyer, that means the waiver is not a reason to defer. The number that will actually move NOLA this autumn is China's export posture, not a Commerce filing.
4. Where the imports went, and why they are hard to get back
What's new: The import channel the waiver is trying to reopen was closed for five years, and the supply chain restructured around its absence. Moroccan phosphate fertilizer imports ran about 3.8 million P2O5-equivalent tons across 2016–2020 and about 0.2 million tons across 2021–2025, with 2025 at zero (National Association of Wheat Growers, citing trade data). In most pre-order years Morocco was more than half of all US phosphate fertilizer imports.
Evidence: The rock side of the business tightened at the same time. USGS puts 2025 US marketable phosphate rock production at an estimated 20.0 million tons from ten mines run by five companies in four states, against apparent consumption of 21.0 million tons and 3.4 million tons of imports — a net import reliance of 16%, up from 11% in 2021 (USGS, Mineral Commodity Summaries, Feb 2026). More than 99% of imported rock in 2021–24 came from a single country, Peru. Morocco holds roughly 50 billion tons of the world's 73 billion tons of reserves — about 69%.
| Structural marker | Figure | Basis / year | Source |
|---|---|---|---|
| US marketable rock production | 20,000 kt | 2025, estimated | USGS MCS Feb 2026 |
| US apparent rock consumption | 21,000 kt | 2025, estimated | USGS MCS Feb 2026 |
| Net import reliance, rock | 16% | 2025, est. (11% in 2021) | USGS MCS Feb 2026 |
| Imported rock from Peru | >99% | 2021–24 average | USGS MCS Feb 2026 |
| Moroccan P fertilizer imports | 3.8 million t P2O5-eq | 2016–2020, cumulative | NAWG, trade data |
| Moroccan P fertilizer imports | 0.2 million t P2O5-eq | 2021–2025, cumulative | NAWG, trade data |
Basis: thousand metric tons of marketable phosphate rock for the first four rows; cumulative P2O5-equivalent tons of finished phosphate fertilizer for the last two. The two series are different measures and are not additive. Sources: USGS, Mineral Commodity Summaries 2026 — Phosphate Rock, Feb 2026; National Association of Wheat Growers, citing US trade data.
Texas A&M's Agricultural and Food Policy Center put a number on the cost of that closure: with the CVD at its original 19.97%, the order raised the US DAP price by 28.6%, and phosphorus costs for producers of the major row crops ran an estimated $6.9 billion higher across the 2021–2025 growing seasons (AFPC Research Report 26-01, Jan 14, 2026). Their fitted coefficient is 1.43% of DAP price per percentage point of duty. Applied to the 16.60% rate in force this spring, that implies a 23.7% price effect — roughly $150/st embedded in a $783.75/st NOLA barge.* That number is a model output on a historical relationship, not an observation, and the last ten weeks are the cleanest test it has ever had. It has not passed.
*Estimate. Our arithmetic on AFPC's published elasticity, applied to the USDA AMS NOLA barge basis AFPC modelled. Not an AFPC figure.
5. What it costs on the acre this fall
What's new: At the rates USDA's survey data show crops actually receive — 64 lb P2O5/acre on the 75% of corn acres that get phosphate, 57 lb/acre on the 44% of soybean acres — this is a $52 to $64 decision per treated acre, and the waiver has so far changed it by about ninety cents.
Evidence: Nutrient-equivalent arithmetic on the September 7–11 retail prints, at 46% P2O5 for DAP and 52% for MAP.
| Crop / product | Rate, lb P2O5/ac | Product, lb/ac | Cost, $/ac | Bushel equivalent |
|---|---|---|---|---|
| Corn — DAP 18-46-0 | 64 | 139.1 | 64.21 | 13.4 bu @ $4.80 |
| Corn — MAP 11-52-0 | 64 | 123.1 | 59.20 | 12.3 bu @ $4.80 |
| Soybeans — DAP 18-46-0 | 57 | 123.9 | 57.19 | 4.8 bu @ $12.00 |
| Soybeans — MAP 11-52-0 | 57 | 109.6 | 52.73 | 4.4 bu @ $12.00 |
Basis: DTN national retail average delivered to farm, DAP $923/st and MAP $962/st, survey week Sep 7–11, 2026; application rates are USDA ARMS/NASS survey means as compiled in AFPC RR 26-01; bushel equivalents use the Sep 11, 2026 WASDE 2026/27 season-average farm prices of $4.80/bu corn and $12.00/bu soybeans. Product cost only — no application, no N or S credit. Sources: DTN/Progressive Farmer, Sep 16, 2026; AFPC RR 26-01, Jan 14, 2026; USDA WASDE, Sep 11, 2026.
MAP is the cheaper carrier of P at these prices despite the higher headline price per ton — $59.20/acre against $64.21 on corn — because 52% beats 46% by more than $962 beats $923. DAP returns about 25 lb of N per corn acre at this rate against MAP's roughly 15 lb, which closes part but not all of the gap at anhydrous-equivalent N values. On the $4.80 corn and $12.00 soybeans USDA published on September 11, fall P is 13.4 bushels of corn or 4.8 bushels of beans per treated acre.
What has actually changed since June 29 is $0.91/acre on corn. USDA's 22% would have been $14.13.
References
- Proclamation, Declaration of Emergency and Authorization for Temporary Duty-Free Importation of Phosphate Fertilizer From Morocco, signed Jun 29, 2026 — 91 FR 40855, Jul 2, 2026. https://www.govinfo.gov/content/pkg/FR-2026-07-02/html/2026-13588.htm
- US Department of Commerce, Countervailing Duty Order of Phosphate Fertilizers From the Kingdom of Morocco: Temporary Duty Free Importation — 91 FR 42180, Jul 8, 2026. https://www.govinfo.gov/content/pkg/FR-2026-07-08/html/2026-13796.htm
- US Department of Commerce, Phosphate Fertilizers From the Kingdom of Morocco: Preliminary Results of First Full Sunset Review of the Countervailing Duty Order — Jul 24, 2026. https://www.govinfo.gov/content/pkg/FR-2026-07-24/html/2026-14971.htm
- US Department of Commerce, Phosphate Fertilizers From the Kingdom of Morocco: Notice of Amended Final Results of Countervailing Duty Administrative Review; 2022 — Dec 26, 2024. https://www.govinfo.gov/content/pkg/FR-2024-12-26/html/2024-30693.htm
- US Department of Commerce, Phosphate Fertilizers From the Kingdom of Morocco: Notice of Court Decision Not in Harmony…; Notice of Amended Final Results — Jan 12, 2026. https://www.govinfo.gov/content/pkg/FR-2026-01-12/html/2026-00385.htm
- US Department of Commerce, Phosphate Fertilizers From the Russian Federation: Final Results of Countervailing Duty Administrative Review; 2023 — Apr 17, 2026. https://www.govinfo.gov/content/pkg/FR-2026-04-17/html/2026-07503.htm
- US Department of Commerce, Phosphate Fertilizers From the Russian Federation: Final Results of the Expedited First Sunset Review — Jun 30, 2026. https://www.govinfo.gov/content/pkg/FR-2026-06-30/html/2026-13106.htm
- US Department of Commerce, Phosphate Fertilizers From the Russian Federation: Notice of Court Decision…; Amended Final Determination and Amended Countervailing Duty Order — Jan 29, 2024. https://www.govinfo.gov/content/pkg/FR-2024-01-29/html/2024-01713.htm
- US International Trade Commission, Phosphate Fertilizers From Morocco and Russia; Institution of Five-Year Reviews — Mar 2, 2026; and Notice of Commission Determination To Conduct Full Five-Year Reviews — Jun 17, 2026.
- DTN/Progressive Farmer, Six Fertilizers Lead Retail Fertilizer Prices Lower for Third Consecutive Week — Jul 8, 2026 (survey week Jun 29–Jul 2).
- DTN/Progressive Farmer, Fertilizer Prices Keep Sliding as UAN32 Leads 4 Nutrients in Significant Drops — Jul 29, 2026 (survey week Jul 20–24).
- DTN/Progressive Farmer, 6 of 8 Fertilizer Prices Lower, Led by UAN28 — Sep 9, 2026 (survey week Aug 31–Sep 4).
- DTN/Progressive Farmer, Fertilizer Prices Continue Lower for 6 of 8 Major Nutrients — Sep 16, 2026 (survey week Sep 7–11).
- DTN/Progressive Farmer, OCP Group Ships Moroccan Phosphate to US Following Duty Suspension — Jul 17, 2026 (USDA savings estimate; Deputy Secretary Vaden remarks).
- Farm Policy News, University of Illinois, Morocco Phosphate Fertilizer Returns to U.S. Market — Aug 19, 2026.
- USDA Agricultural Marketing Service, Fertilizer Prices by Region (agtransport.usda.gov, dataset 8bgf-5mdv), monthly averages derived from Green Markets; DAP US Gulf NOLA series retrieved Sep 18, 2026.
- Argus Media, Nola DAP re-export demand drives prices higher — Mar 2, 2026.
- Argus Media, US fertilizer market faces increasing scrutiny — Apr 13, 2026.
- Australian Fertilizer Corporation, Weekly Update — Global Fertiliser Markets, weeks ended Aug 28, 2026 and Sep 11, 2026.
- The Mosaic Company, Q2 2026 earnings call, Aug 5, 2026 (transcript published Aug 11, 2026).
- Bryant, H.L., Raulston, J.M., Outlaw, J.L. and Fischer, B.L., Increased Costs of Phosphate Fertilizers in the United States due to Countervailing Duty (CVD) on Imports from Morocco, Agricultural and Food Policy Center, Texas A&M University, Research Report 26-01, Jan 14, 2026. https://afpc.tamu.edu/research/publications/files/732/RR-26-01.pdf
- National Association of Wheat Growers, Countervailing Duties on Phosphate Fertilizer Harms Wheat Growers (Moroccan import volumes 2016–2020 vs 2021–2025; AFPC-derived state estimates).
- US Geological Survey, Mineral Commodity Summaries 2026 — Phosphate Rock, Feb 2026. https://pubs.usgs.gov/periodicals/mcs2026/mcs2026-phosphate.pdf
- USDA, World Agricultural Supply and Demand Estimates, Sep 11, 2026 (2026/27 season-average farm prices, corn $4.80/bu and soybeans $12.00/bu).
- DTN/Progressive Farmer, Less Chinese Phosphorus Exports, Continuing Countervailing Duties Affect P 2026 Outlook — Dec 19, 2025 (CRU, Rabobank, StoneX and ICIS commentary on Chinese export volumes).
Disclosures
Crop Root Zone is an independent publication. Nothing here is investment advice. Market calls, where included, reflect the editors' own read and are not a recommendation to buy or sell any security.
Europe Imported 1.32 Million Fewer Tonnes of Urea Since October. Russian Cargoes Account for 1.31 Million of It.
Ten months of Eurostat trade data spanning the start of the EU's carbon border charge show urea from every origin except Russia and Belarus holding at 3.88 million tonnes, against 3.89 million a year earlier. CBAM pulled about 1.2 million tonnes of that buying forward into a December rush and put a premium of roughly $45–58 a tonne on French urea, but it has not shrunk Europe's non-Russian supply. The tonnage Europe lost is Russian, it began leaving with the tariffs of July 2025, and it is landing in the U.S., which took a record 480,287 tonnes of Russian urea in April and 72% of its May urea imports from Russia.
The European Union's carbon border charge on imported fertilizer has been in force for eight and a half months, and the trade data now cover seven of them. From October 2025 through July 2026 the EU imported 4.42 million tonnes of urea from outside the bloc, 1.32 million tonnes less than in the same ten months a year earlier (Eurostat Comext, Sep 16, 2026). That looks like the carbon charge at work. It mostly is not. Imports from Russia and Belarus fell by 1.31 million tonnes over the same period, and they fell because of a separate EU tariff on Russian and Belarusian nitrogen that took effect on Jul 1, 2025, six months before CBAM's definitive phase began (Access2Markets, 2025). Urea from every other origin totalled 3.88 million tonnes, against 3.89 million a year earlier. The carbon charge changed when Europe bought, what it bought and what it paid. Over ten months it did not change how much non-Russian urea Europe bought. For North American growers, the two policies need to be kept apart, because the one that moved the most tonnage is the one that sends cargoes toward New Orleans.
1. Europe's urea shortfall is a Russian shortfall
What's new: Eurostat's monthly trade database, updated on Sep 15, now runs through July 2026. That is enough to compare a full autumn-to-summer buying season under CBAM with the season before it. The comparison is made here on October-to-July windows so that the pre-CBAM stock-up in late 2025 is counted in the same period as the spring it replaced.
Evidence: Egypt remains Europe's anchor supplier. Its shipments slipped 5.8%, but its share of extra-EU urea imports rose from 44.8% to 54.8%. Algeria fell 15%. Smaller origins, led by Turkmenistan, Nigeria, Oman, China and Libya, together added about 250,000 tonnes. Russia and Belarus went from nearly a third of the market to an eighth.
| Origin | Oct 2024–Jul 2025, t | Oct 2025–Jul 2026, t | Change, t | Change | Share, 2025–26 |
|---|---|---|---|---|---|
| Egypt | 2,571,867 | 2,422,324 | −149,543 | −5.8% | 54.8% |
| Algeria | 741,691 | 628,542 | −113,149 | −15.3% | 14.2% |
| Russia and Belarus | 1,854,916 | 544,628 | −1,310,288 | −70.6% | 12.3% |
| Turkmenistan | 110,851 | 185,309 | +74,458 | +67.2% | 4.2% |
| Nigeria | 101,723 | 139,193 | +37,470 | +36.8% | 3.1% |
| Uzbekistan | 201,963 | 128,312 | −73,651 | −36.5% | 2.9% |
| Oman | 0 | 113,449 | +113,449 | — | 2.6% |
| All other origins | 162,654 | 261,350 | +98,696 | +60.7% | 5.9% |
| Total extra-EU | 5,745,665 | 4,423,107 | −1,322,558 | −23.0% | 100% |
| Total excluding Russia and Belarus | 3,890,748 | 3,878,479 | −12,269 | −0.3% | — |
Source: Eurostat Comext, dataset DS-045409, HS 310210 (urea), extra-EU imports by partner, quantity basis, dataset updated Sep 15, 2026, retrieved Sep 16, 2026. Shares, sums and changes are Crop Root Zone calculations. Recent months are subject to revision.
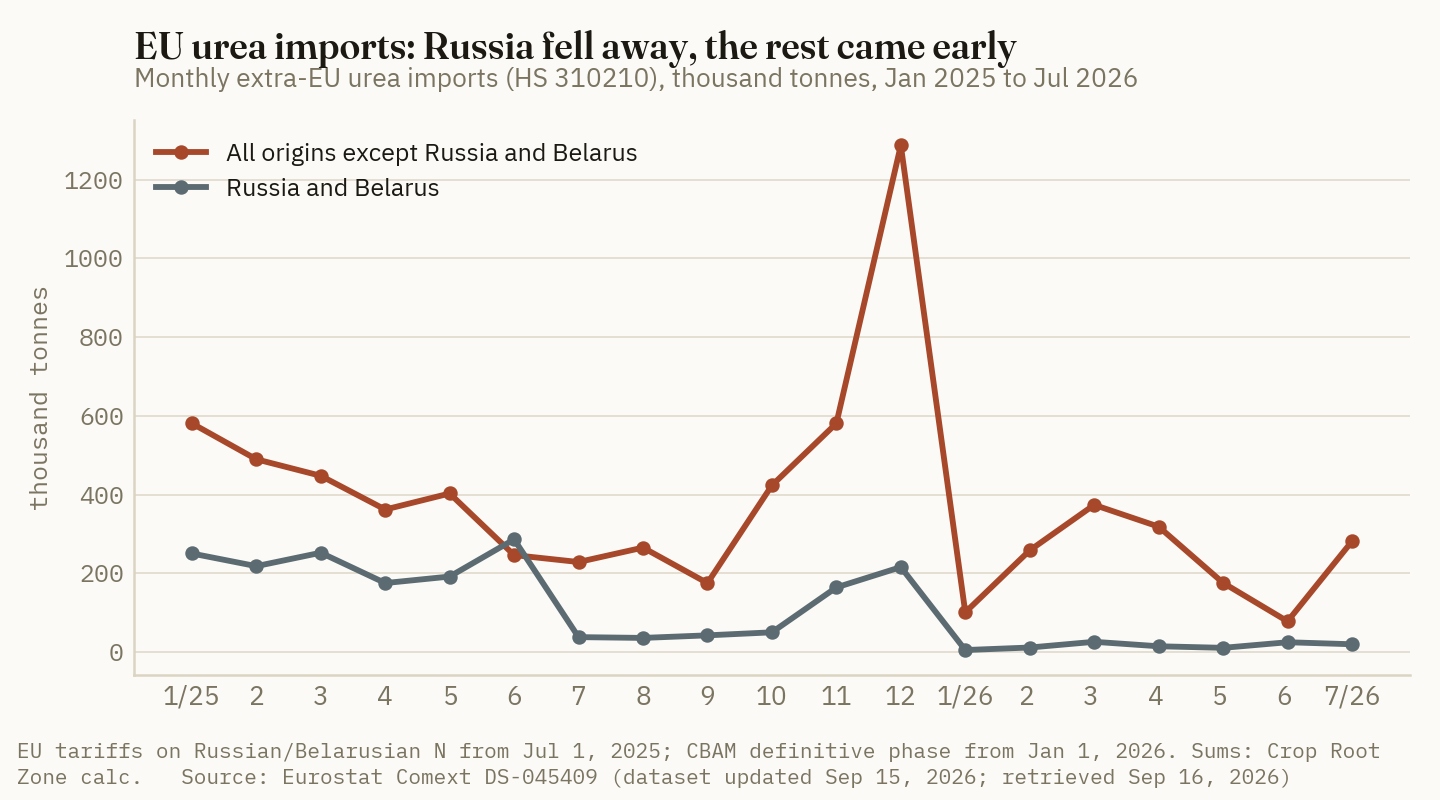
The timing in the chart matters more than the totals. Russian and Belarusian urea imports dropped from 286,000 tonnes in June 2025 to 38,000 tonnes in July 2025, the month the tariff began. The EU tariff added a 6.5% duty and €40–45 a tonne on Russian and Belarusian nitrogen from July 2025, on a schedule rising to €315–430 a tonne by 2028 (Access2Markets, 2025; BC Insight, May 20, 2026). Russian shipments recovered briefly in November and December 2025, the months in which importers were buying ahead of the carbon charge, then fell to between 5,000 and 26,000 tonnes a month in 2026.
Ground Truth: Any claim that CBAM has "cut Europe's fertilizer imports" in 2026 is mostly counting Russian tonnage that was already leaving. Keep the two policies apart because their paths diverge. The Russian tariff on nitrogen rose from €40 to €60 a tonne on Jul 1, 2026 (UkrAgroConsult, accessed Sep 16, 2026) and is scheduled to keep rising, so that displacement will grow by statute. The carbon charge has so far moved buying around the calendar. How much it costs depends on the ETS price and on how many suppliers file real emissions data, and both of those can move either way.
2. CBAM moved Europe's buying calendar, not its annual volume
What's new: The collapse in EU nitrogen imports that farm groups reported in February was real, and it was a timing effect. Copa-Cogeca, citing Commission figures, said the EU imported 179,877 tonnes of nitrogen fertilizer in January 2026 against 1,183,728 tonnes in January 2025. It called for the charge to be suspended and said farmers' stocks covered 45–50% of 2026 needs (Hortidaily, Feb 17, 2026). Fertilizers Europe said the same week that the January drop followed an exceptional inflow in the fourth quarter of 2025, with 2.37 million tonnes of nitrogen fertilizer imported in December alone, about 28% of annual EU consumption (Agence Europe, Feb 2026).
Evidence: The urea data show how closely the two effects offset. Non-Russian urea imports in October–December 2025 were 2.29 million tonnes, up 1.16 million tonnes on the same quarter of 2024. In January–July 2026 they were 1.59 million tonnes, down 1.17 million tonnes on January–July 2025. France alone took 1.15 million tonnes in July–December 2025 against 842,000 tonnes a year earlier, 279,000 of them in December alone (Argus Media, Feb 17, 2026).
Across products, the picture splits. Excluding Russia and Belarus, urea and UAN volumes were essentially unchanged over the ten months. Ammonium nitrate, calcium ammonium nitrate and ammonia fell.
| Product (HS code) | Other origins, Oct 24–Jul 25, t | Other origins, Oct 25–Jul 26, t | Change | Russia and Belarus, change |
|---|---|---|---|---|
| Urea (310210) | 3,890,748 | 3,878,479 | −0.3% | −70.6% |
| UAN (310280) | 761,218 | 743,002 | −2.4% | −98.5% |
| Ammonium nitrate (310230) | 434,458 | 322,640 | −25.7% | −81.4% |
| Calcium ammonium nitrate (310240) | 203,886 | 174,882 | −14.2% | −81.0% |
| Anhydrous ammonia (281410) | 1,653,888 | 1,296,510 | −21.6% | −28.6% |
| Ammonium sulphate (310221) | 694,238 | 1,059,662 | +52.6% | −98.5% |
| All nitrogen fertilizers (3102) | 6,340,055 | 6,447,690 | +1.7% | −75.3% |
Source: Eurostat Comext DS-045409, extra-EU imports, quantity basis, retrieved Sep 16, 2026. Crop Root Zone calculations. The ammonium sulphate increase is almost entirely Chinese product (1.02 million tonnes in Oct 2025–Jul 2026). HS 3102 totals here run above the Commission's January figure cited by Copa-Cogeca, which may use a different product scope or an earlier data vintage.
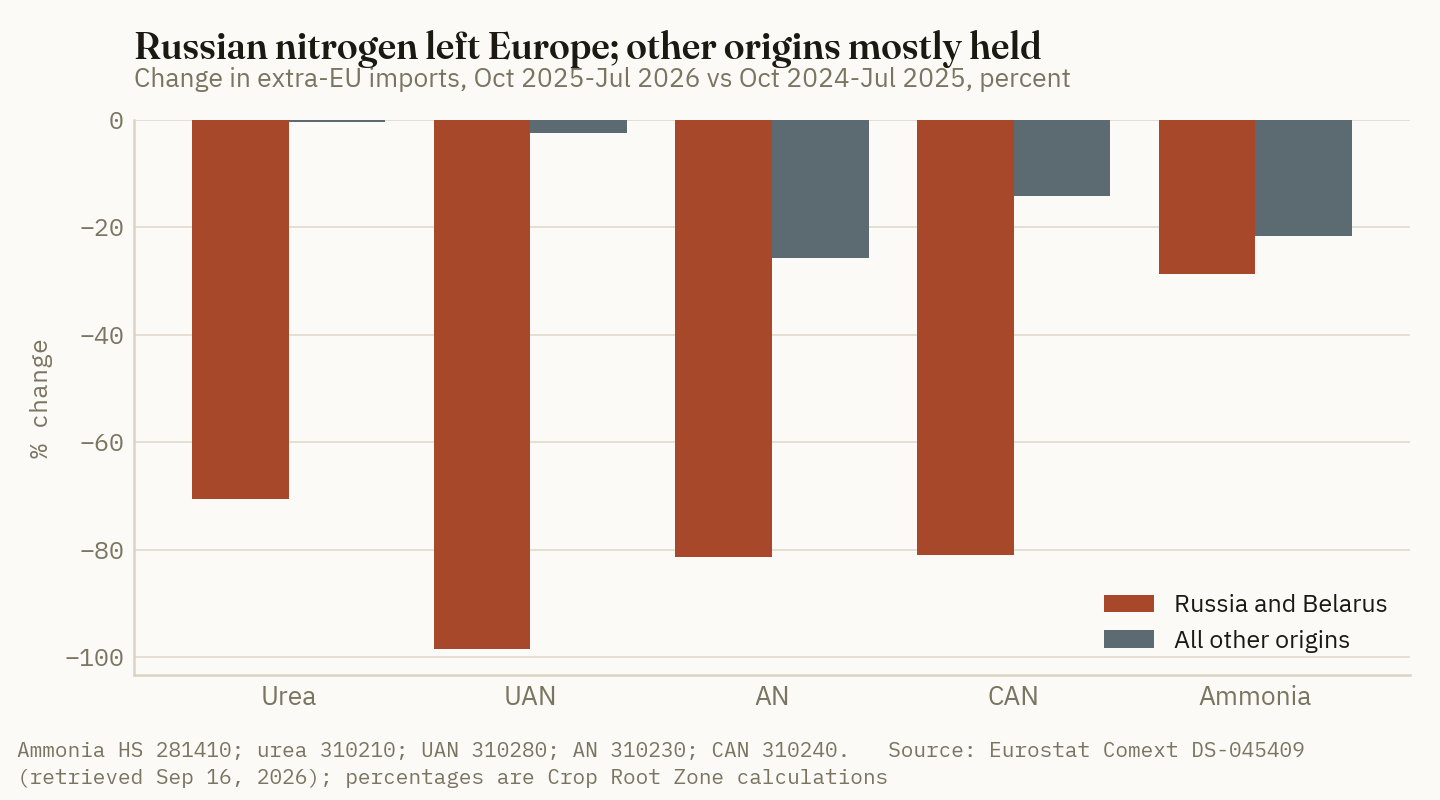
The products that lost the most non-Russian volume carry the heaviest charge relative to their price. By one market estimate for the first quarter, the default charge came to about 25% of German CAN prices and up to 20% of French UAN prices, but only about 5% of French urea prices (The Metalnomist, Jun 2026). Ammonia is harder to read. Trinidad's shipments to Europe fell 46%, Algeria's rose 49% and U.S. shipments rose 19%, which suggests origin-specific factors as much as the charge itself.
Ground Truth: Europe's demand for imported nitrogen did not shrink under CBAM. Where it could, Europe switched toward urea, the product that carries the least carbon per unit of nitrogen. That matters for trade flows because urea is the product Europe competes for with Brazil, India and the U.S. Gulf. A carbon charge that pushes European buyers from nitrates toward urea adds to competition for the same Egyptian and Algerian cargoes, even while total volume stays flat.
3. The charge is in European prices, and it is small next to Hormuz
What's new: The European Commission has now set the certificate price for the first two quarters. It is €75.36 per tonne of CO2 for imports in the first quarter and €75.28 for the second, and certificates for 2026 imports will be bought on the central platform from February 2027 (European Commission, accessed Sep 16, 2026). Importers are therefore carrying a liability they have not yet paid in cash, and they have been pricing it in.
Evidence: CRU reported in May that the FCA France urea price had carried a larger premium since late 2025, with the spread over delivered import costs widening by roughly $45–58 a tonne, close to its calculated CBAM cost. It put the added import cost at around $40–60 a tonne (BC Insight, May 20, 2026). Argus estimated default charges of about €36 a tonne for Egyptian urea and €37 for Algerian urea in mid-February (Argus Media, Feb 17, 2026). Those are default values. Sandbag, assuming an €80 carbon price, calculated a charge of €41.96 a tonne for Egyptian urea on default values, falling to €16.19 using actual emissions data from an average Egyptian plant and €7.39 for an efficient one (Sandbag, Feb 10, 2026).
| Origin and product | Estimated CBAM charge | Basis | Source |
|---|---|---|---|
| Egyptian urea | €36/t | Default values, Feb 16, 2026 | Argus Media |
| Algerian urea | €37/t | Default values, Feb 16, 2026 | Argus Media |
| Egyptian urea, average plant | €16.19/t | Actual data, €80/t CO2 assumed | Sandbag |
| Egyptian urea, efficient plant | €7.39/t | Actual data, €80/t CO2 assumed | Sandbag |
| Urea from Egypt, Algeria, Nigeria | $52–57/t | Default values, $100.26/t ETS, Dec 29, 2025 | Argus Media |
| UAN from Russia, Trinidad | $82–104/t | Same | Argus Media |
| U.S. UAN | $115.10/t | Same | Argus Media |
| U.S. urea | $143.72/t | Same | Argus Media |
Sources: Argus Media, Dec 29, 2025 and Feb 17, 2026; Sandbag, Feb 10, 2026. The estimates use different carbon prices and currencies and are not directly comparable across rows. They show the ranking of origins and products, not a single current charge.
The EU tried to neutralise part of the cost. On Feb 24 it approved a one-year suspension of the 6.5% most-favoured-nation duty on urea and the 5.5% duty on ammonia for every origin except Russia and Belarus. It estimated the saving at €60 million, a figure it said would broadly offset the CBAM cost, and it set the mark-up on fertilizer default values at 1% (BC Insight, Mar 5, 2026). The suspension does little for Egypt and Algeria, whose urea already entered duty-free (Argus Media, Jan 7, 2026).
Set against the 2026 price shock, the charge is small. Egyptian urea entered the EU at an average customs value of €399 a tonne in January and €651 in May, before easing to €474 in July (Eurostat Comext, Sep 16, 2026; Crop Root Zone unit-value calculation). The €252 rise from January to May is about seven times Argus's default charge for Egyptian urea. The WTO put the global urea price at about $400 a tonne before the Strait of Hormuz conflict, $850 in April and $453 in June (WTO, Jul 10, 2026). The Commission said nitrogen fertilizer prices in the EU were 71% above their 2024 average in April, even though the Gulf supplies only 1–2% of the EU's nitrogen fertilizer imports (European Commission DG AGRI, accessed Sep 16, 2026).
€36/t
Estimated default CBAM charge on Egyptian urea, Europe's largest source. It is about 9% of January's customs value, and the Hormuz shock added about seven times that amount by May. (Argus Media, Feb 17, 2026; Crop Root Zone calculation from Eurostat Comext, Sep 16, 2026)
Ground Truth: CBAM behaves like a regional basis, not a global price driver. It adds $40–60 a tonne to what a European farmer pays, sets that margin between European and world prices, and leaves the world price itself to gas, Hormuz and Chinese export quotas. For a North American buyer, the useful point is that Europe now needs a higher delivered price to attract the same cargo. In a tight market that makes European demand less competitive for marginal tonnes, not more. The one case where that reverses is low-carbon product with verified emissions data, which pays a smaller charge and can earn a premium in Europe.
4. Russian urea that no longer goes to Europe goes to the U.S.
What's new: The Russian tonnage Europe tariffed away has not disappeared. Russia's urea exports rose to 9.7 million tonnes in 2025. The share going to the U.S. rose to 23%, while Europe's fell to 13% (BC Insight, May 20, 2026). By Crop Root Zone's arithmetic, that is roughly 2.2 million tonnes to the U.S. and 1.3 million to Europe in 2025, and Europe's 2026 intake is running far below that.
Evidence: EU imports of Russian and Belarusian nitrogen fell across every product over the ten months.
| Russian and Belarusian product into the EU | Change, Oct 25–Jul 26 vs a year earlier, t | |
|---|---|---|
| Urea | −1,310,288 | ██████████ |
| UAN | −364,815 | ███░░░░░░░ |
| CAN | −208,385 | ██░░░░░░░░ |
| Anhydrous ammonia | −154,146 | █░░░░░░░░░ |
| Ammonium nitrate | −112,254 | █░░░░░░░░░ |
Source: Eurostat Comext DS-045409, retrieved Sep 16, 2026. Crop Root Zone calculation. Bars scale to ten blocks at 1.31 million tonnes.
On the U.S. side, the Census-based trade press shows where that tonnage went. The U.S. imported 480,287 tonnes of Russian urea in April 2026, the highest monthly volume since at least 2010 (Quantum Commodity Intelligence, Jun 9, 2026). In May, when total imports fell, Russia supplied 72% of them (Quantum Commodity Intelligence, Jul 7, 2026). First-quarter U.S. urea imports reached 2.4 million tonnes, up 16% on the year, as Russian supply surged and the Middle East's share dropped (Quantum Commodity Intelligence, May 5, 2026). The trend predates the Hormuz shock. Russia's share of U.S. urea imports rose from 29% in April–May 2024 to 47% in April–May 2025. Russian fertilizer was also exempt from the 2025 IEEPA tariffs because Russia sits in Column 2 of the U.S. tariff schedule, where fertilizer rates are zero (The Fertilizer Institute, Jul 22, 2025). For scale, the U.S. imported 5.24 million short tons of solid urea and 2.36 million short tons of UAN in 2024 (The Fertilizer Institute, Jul 22, 2025).
Russian urea has become a large share of a market that already depended on imports. The U.S. retail urea price in the Aug 31–Sep 4 survey was $655 a ton, 4% above a year earlier (DTN/Progressive Farmer, Sep 9, 2026), while the benchmark urea price tracked by Trading Economics was $459.50 a tonne on Sep 15, up 15.6% on the year (Trading Economics, accessed Sep 16, 2026). Public data cannot show how much of that gap comes from Russian tonnage that no longer has a European outlet. The direction is consistent with it.
Ground Truth: The EU's Russia tariff has done more to shape what a Corn Belt grower pays for urea than CBAM has. It turned the U.S. into the easiest remaining outlet for Russian urea and made the U.S. more dependent on one origin. That cuts both ways. In an ordinary year, Russian urea with fewer places to go competes harder for U.S. business, which helps hold down Gulf import prices. Its availability, though, depends on decisions in Moscow and Washington. Russia's export quota for Jun 1–Nov 30, 2026 is 20 million tonnes, including more than 8.7 million tonnes of nitrogen fertilizers (Interfax, Apr 22, 2026). A U.S. tariff or sanctions change would remove a supply source that now accounts for most of the country's urea imports in some months. A buyer covering spring 2027 needs should treat that concentration as a price risk, not a permanent discount.
5. U.S.-made nitrogen and the carbon wall
What's new: CBAM has had one clear, measurable effect on U.S. trade. From January to July 2026 the EU imported no U.S. UAN. It took 103,146 tonnes in the same months of 2025 and 180,014 tonnes in January–July 2024 (Eurostat Comext, Sep 16, 2026).
Evidence: U.S. UAN did not stop going to Europe altogether. It moved earlier. The EU took 254,835 tonnes of U.S. UAN in October–December 2025, against 218,714 tonnes in the same quarter of 2024. Over the ten-month window, U.S. UAN to the EU fell 21%, while Trinidad's was flat at about 428,000 tonnes. The difference fits Argus's default-value estimates: $115.10 a tonne for U.S. UAN, against $82–104 for Russian and Trinidadian UAN, and $143.72 for U.S. urea, against $52–57 for North African urea (Argus Media, Dec 29, 2025). U.S. UAN also carries a renewed EU anti-dumping duty of €29.48 a tonne, against €22.24 for Trinidad, extended for five years from Jan 6, 2026 (The Union Report, Jan 11, 2026). U.S. ammonia kept moving: 189,951 tonnes in October–July, up 19%.
| U.S. product into the EU | Jan–Jul 2024, t | Jan–Jul 2025, t | Oct–Dec 2025, t | Jan–Jul 2026, t |
|---|---|---|---|---|
| UAN (310280) | 180,014 | 103,146 | 254,835 | 0 |
| Anhydrous ammonia (281410) | 102,779 | 147,218 | 65,654 | 124,297 |
| Urea (310210) | 2,232 | 4,366 | 1,344 | 2,412 |
Source: Eurostat Comext DS-045409, retrieved Sep 16, 2026. Crop Root Zone sums; months with no reported quantity count as zero.
The domestic numbers do not show a flood of UAN kept at home. CF Industries, the largest U.S. UAN producer, sold 1.391 million tons of UAN in the second quarter of 2026, against 1.902 million a year earlier, at an average $441 a ton against $321. It attributed the lower volume to weaker global demand and a production mix that favoured granular urea (CF Industries, Aug 5, 2026). The same company has said low-carbon product can clear Europe's charge. In December it told Argus that CBAM would drive demand for low-carbon nitrogen such as UAN (Argus Media, Dec 29, 2025). In its first-half release it did not mention CBAM (CF Industries, Aug 5, 2026).
The dates to watch are fixed. The Commission publishes the third-quarter certificate price on Oct 5, 2026 and the fourth-quarter price on Jan 4, 2027. Certificate purchases open in February 2027 (European Commission, accessed Sep 16, 2026). The Russian tariff on urea steps to €80 a tonne from July 2027 and can reach €315 after June 2028 if volume thresholds are exceeded (BC Insight, May 20, 2026). This autumn's Eurostat releases will show whether European importers repeat last year's pre-deadline pattern. They have no deadline to beat this year, so a flat fourth quarter would be the expected result, not a new collapse.
Ground Truth: For a North American grower, the effects rank in this order. The largest is the Russian tariff, which keeps sending Russian urea and UAN toward U.S. Gulf ports and makes U.S. supply cheaper in normal times and more exposed to policy shocks. Next is CBAM's timing effect: U.S. UAN that used to ship to Europe in spring now either ships before January or stays in the Americas. That tonnage is modest against 2.36 million short tons of annual U.S. UAN imports, but it lands when U.S. UAN demand peaks. The smallest is CBAM's effect on world prices, which has been negligible next to Hormuz. For anyone pricing spring 2027 nitrogen, the Russian export quota and U.S. trade policy toward Russia matter more than the EU's carbon price.
References
- Eurostat, Comext database, dataset DS-045409 "EU trade since 1988 by HS2-4-6 and CN8," extra-EU imports by partner for HS 310210, 310221, 310230, 310240, 310280, 3102 and 281410, quantity and value, dataset updated Sep 15, 2026, retrieved Sep 16, 2026 — https://ec.europa.eu/eurostat/api/comext/dissemination/statistics/1.0/data/DS-045409
- Access2Markets (European Commission), "EU increases tariff duties on Russian and Belarusian imports of agricultural products and fertilizers," 2025 (duties effective Jul 1, 2025) — https://trade.ec.europa.eu/access-to-markets/en/news/eu-increases-tariff-duties-russian-and-belarusian-imports-agricultural-products-and-fertilizers
- BC Insight (CRU), "Policy impacts on nitrogen markets," Nitrogen+Syngas 401, May 20, 2026 — https://www.bcinsight.crugroup.com/2026/05/20/policy-impacts-on-nitrogen-markets/
- Hortidaily, "Latest EU Commission figures reveal that fertilizer imports have dropped by 80%" (Copa-Cogeca statement), Feb 17, 2026 — https://www.hortidaily.com/article/9811688/latest-eu-commission-figures-reveal-that-fertilizer-imports-have-dropped-by-80/
- Agence Europe, "Fertilizers Europe reports limited impact of CBAM on European fertilizer market," Feb 2026 (statement of Feb 16, 2026) — https://agenceurope.eu/en/bulletin/article/13810/15/fertilizers-europe-reports-limited-impact-of-cbam-on-european-fertilizer-market
- Argus Media, "French urea imports surge in 2H 2025," Feb 17, 2026 — https://www.argusmedia.com/en/news-and-insights/latest-market-news/2789528-french-urea-imports-surge-in-2h-2025
- The Metalnomist, "CBAM Certificate Price Starts Reshaping EU Import Costs Across Fertiliser and Steel," Jun 2026 — https://www.metalnomist.com/2026/06/cbam-certificate-price-starts-reshaping.html
- European Commission, Taxation and Customs Union, "Price of CBAM certificates," accessed Sep 16, 2026 — https://taxation-customs.ec.europa.eu/carbon-border-adjustment-mechanism/price-cbam-certificates_en
- Sandbag, "CBAM and fertiliser inflation in 2026: the facts behind the numbers," Feb 10, 2026 — https://sandbag.be/2026/02/10/cbam-and-fertiliser-inflation-in-2026-the-facts-behind-the-numbers/
- Argus Media, "Viewpoint: CBAM could draw nitrogen exports from the US," Dec 29, 2025 — https://www.argusmedia.com/en/news-and-insights/latest-market-news/2770351-viewpoint-cbam-could-draw-nitrogen-exports-from-the-us
- BC Insight (CRU), "EU suspends fertilizer tariffs to offset CBAM costs," Mar 5, 2026 — https://www.bcinsight.crugroup.com/2026/03/05/eu-suspends-fertilizer-tariffs-to-offset-cbam-costs/
- Argus Media, "EU to suspend import tariffs on ammonia, urea," Jan 7, 2026 — https://www.argusmedia.com/en/news-and-insights/latest-market-news/2772955-eu-to-suspend-import-tariffs-on-ammonia-urea
- World Trade Organization, Data Blog, "Fertilizer trade impacted by Strait of Hormuz conflict," Jul 10, 2026 — https://www.wto.org/english/blogs_e/data_blog_e/blog_dta_10jul26_451_e.htm
- European Commission, DG Agriculture and Rural Development, "Ensuring availability and affordability of fertilisers," accessed Sep 16, 2026 — https://agriculture.ec.europa.eu/common-agricultural-policy/agri-food-supply-chain/ensuring-availability-and-affordability-fertilisers_en
- Quantum Commodity Intelligence, "US imports record high Russian urea volumes in April," Jun 9, 2026 — https://www.qcintel.com/ammonia/article/us-imports-record-high-russian-urea-volumes-in-april-66525.html
- Quantum Commodity Intelligence, "Russia supplies 72% of US urea imports in May," Jul 7, 2026 — https://www.qcintel.com/ammonia/article/russia-supplies-72-of-us-urea-imports-in-may-68339.html
- Quantum Commodity Intelligence, "US urea imports spike in March, as Russian supply surges and Middle East share drops," May 5, 2026 — https://www.qcintel.com/ammonia/article/us-urea-imports-spike-in-march-as-russian-supply-surges-and-middle-east-share-drops-64220.html
- The Fertilizer Institute, Veronica Nigh, "Mid-Year 2025 Fertilizer Market Update," Jul 22, 2025 — https://www.tfi.org/wp-content/uploads/2025/07/Mid-Year-2025-Fertilizer-Market-Update.pdf
- DTN/Progressive Farmer, Russ Quinn, "6 of 8 Fertilizer Prices Lower, Led by UAN28," Sep 9, 2026 — https://www.dtnpf.com/agriculture/web/ag/news/crops/article/2026/09/09/6-8-fertilizer-prices-lower-led
- Trading Economics, Urea, accessed Sep 16, 2026 ($459.50/t on Sep 15, 2026; +15.60% year on year) — https://tradingeconomics.com/commodity/urea
- Interfax, "Quota for Russian fertilizer exports in June-Nov will be 20 mln tonnes," Apr 22, 2026 — https://interfax.com/newsroom/top-stories/117261/
- The Union Report, "EU Renews Anti-Dumping Duties on UAN Fertiliser Imports from Russia, Trinidad and Tobago, and the US," Jan 11, 2026 (Commission Implementing Regulation (EU) 2026/65) — https://www.theunionreport.eu/eu-renews-anti-dumping-duties-on-uan-fertiliser-imports-from-russia-trinidad-and-tobago-and-the-us/
- CF Industries Holdings, Inc., first-half 2026 results release (Form 8-K Exhibit 99.1), Aug 5, 2026 — https://www.sec.gov/Archives/edgar/data/1324404/000132440426000017/cf-08052026_ex991xearnings.htm
- UkrAgroConsult, "EU continues raising tariffs on fertilizer imports from Russia and Belarus," Jul 2026 (second tariff stage effective Jul 1, 2026), accessed Sep 16, 2026 — https://ukragroconsult.com/en/news/eu-continues-raising-tariffs-on-fertilizer-imports-from-russia-and-belarus/
Disclosures
Crop Root Zone is an independent publication. Nothing here is investment advice. Market calls, where included, reflect the editors' own read and are not a recommendation to buy or sell any security.
The Soybean Export Book Is 45% Full Ten Days Into the Year. In 2022 It Was 44.5% Full, and That Year Finished 105 Million Bushels Short.
2026/27 soybean export commitments reached 758 million bushels on September 10, double a year ago and against a five-year norm of about 35% of USDA's September forecast, with China holding 48% of the book. Early pace has not predicted the full-year export number in any of the last five years. What it does predict is fall shipping, and so far the pull has shown up as a wider Iowa-to-Gulf spread rather than a stronger country basis. Central Illinois beans are bid 8 cents better against November than a year ago, and a 30-cent November-to-May carry covers just over half the interest on a $13 bushel.
The US soybean export book for the 2026/27 marketing year stood at 20.63 million metric tons (758 million bushels) on September 10, ten days into the year (USDA FAS via USDA AMS Grain Transportation Report, Sep 17, 2026). That is double the 10.21 million tons booked at the same point last year and equal to 45% of the 45.86 million tons, or 1.685 billion bushels, that USDA's September WASDE projects for the full year (USDA WASDE-675, Sep 11, 2026). Over the last five years the book averaged about 35% of the September forecast at this point. China holds 9.86 million tons of it.
That looks like a strong year, and in one sense it is. But the last time the book was this full in mid-September, in 2022, the year finished 105 million bushels below USDA's September forecast. And 96% of this year's book has not shipped yet. For a grower deciding what to do with beans coming out of the field this week, the useful question is not whether exports are strong. It is whether that strength has reached the local bid, and whether the futures market pays enough to wait for it.
1. The book: twice last year's, ten points above the five-year norm
What's new: Net 2026/27 soybean sales were 1.70 million tons in the week ended September 10, lifting total commitments (shipped plus unshipped) to 20.63 million tons. That is 45% of USDA's September export forecast, against 25% for last year's book measured against last year's final export estimate (USDA FAS via USDA AMS GTR, Sep 17, 2026).
Evidence: The comparison that matters is against the same week in earlier years, measured against the export forecast USDA published each September. That removes the effect of a bigger or smaller crop.
| Marketing year | Week ended | Total commitments (1,000 MT) | Million bu | USDA Sept. export forecast (mil bu) | Book as % of Sept. forecast |
|---|---|---|---|---|---|
| 2021/22 | Sep 9, 2021 | 22,290 | 819 | 2,090* | 39.1% |
| 2022/23 | Sep 8, 2022 | 25,281 | 929 | 2,085* | 44.5% |
| 2023/24 | Sep 14, 2023 | 17,079 | 628 | 1,790 | 35.1% |
| 2024/25 | Sep 12, 2024 | 15,993 | 588 | 1,850 | 31.8% |
| 2025/26 | Sep 11, 2025 | 10,277 | 378 | 1,685 | 22.4% |
| 2026/27 | Sep 10, 2026 | 20,631 | 758 | 1,685 | 45.0% |
| Five-year average, 2021/22–2025/26 | 34.6% |
Source: USDA FAS weekly export sales as tabulated in USDA AMS Grain Transportation Report (Sep 22, 2022; Sep 28, 2023; Sep 26, 2024; Sep 25, 2025; Sep 17, 2026); USDA WASDE, Sep 2023, Sep 2024, Sep 2025 and Sep 11, 2026. *2021/22 and 2022/23 forecasts converted from the GTR's metric-ton figures (56.95 and 56.81 million MT) and rounded. 2025/26 is shown as first reported; FAS has since revised it to 10,208. Bushel conversions and percentages are Crop Root Zone calculations.
| Book as % of USDA's Sept. forecast, mid-September | % | |
|---|---|---|
| 2021/22 | 39.1 | █████████░ |
| 2022/23 | 44.5 | ██████████ |
| 2023/24 | 35.1 | ████████░░ |
| 2024/25 | 31.8 | ███████░░░ |
| 2025/26 | 22.4 | █████░░░░░ |
| 2026/27 | 45.0 | ██████████ |
Source: Crop Root Zone calculation from the table above.
45%
Share of USDA's 1.685-billion-bushel 2026/27 soybean export forecast already under contract on September 10. The five-year average at this point is about 35%. (USDA FAS via USDA AMS GTR, Sep 17, 2026; USDA WASDE-675, Sep 11, 2026)
USDA's September forecast is the same 1.685 billion bushels it published for 2025/26 a year ago. The book behind it is twice as large (USDA WASDE, Sep 2025 and Sep 11, 2026). To reach the forecast, exporters need about 25.2 million tons (927 million bushels) of new sales over the roughly 50 weeks left in the year, or about 0.50 million tons a week. Last week's net sales were more than three times that. Commentary in the trade has already turned to whether the forecast is too low. DTN's Canada Markets desk argued in August that sales momentum points to a higher export number "unless limited supply has an impact" (DTN/Progressive Farmer, Aug 20, 2026). Carrying today's share forward at the five-year average would imply about 2.19 billion bushels. That is a mechanical extrapolation, not a forecast. Section 3 shows why it misleads.
2. China's half of the book
What's new: China bought 875,300 tons in the week ended September 10, bringing its 2026/27 commitments to 9.86 million tons, or 362 million bushels. A year ago at this point it had bought nothing (USDA FAS via USDA AMS GTR, Sep 17, 2026; ADM Investor Services, Sep 17, 2026).
Evidence: China is 48% of the book. That share is in line with 2021/22 and 2022/23, the last years before the trade disruption, though the tonnage is slightly below 2021/22's 10.37 million.
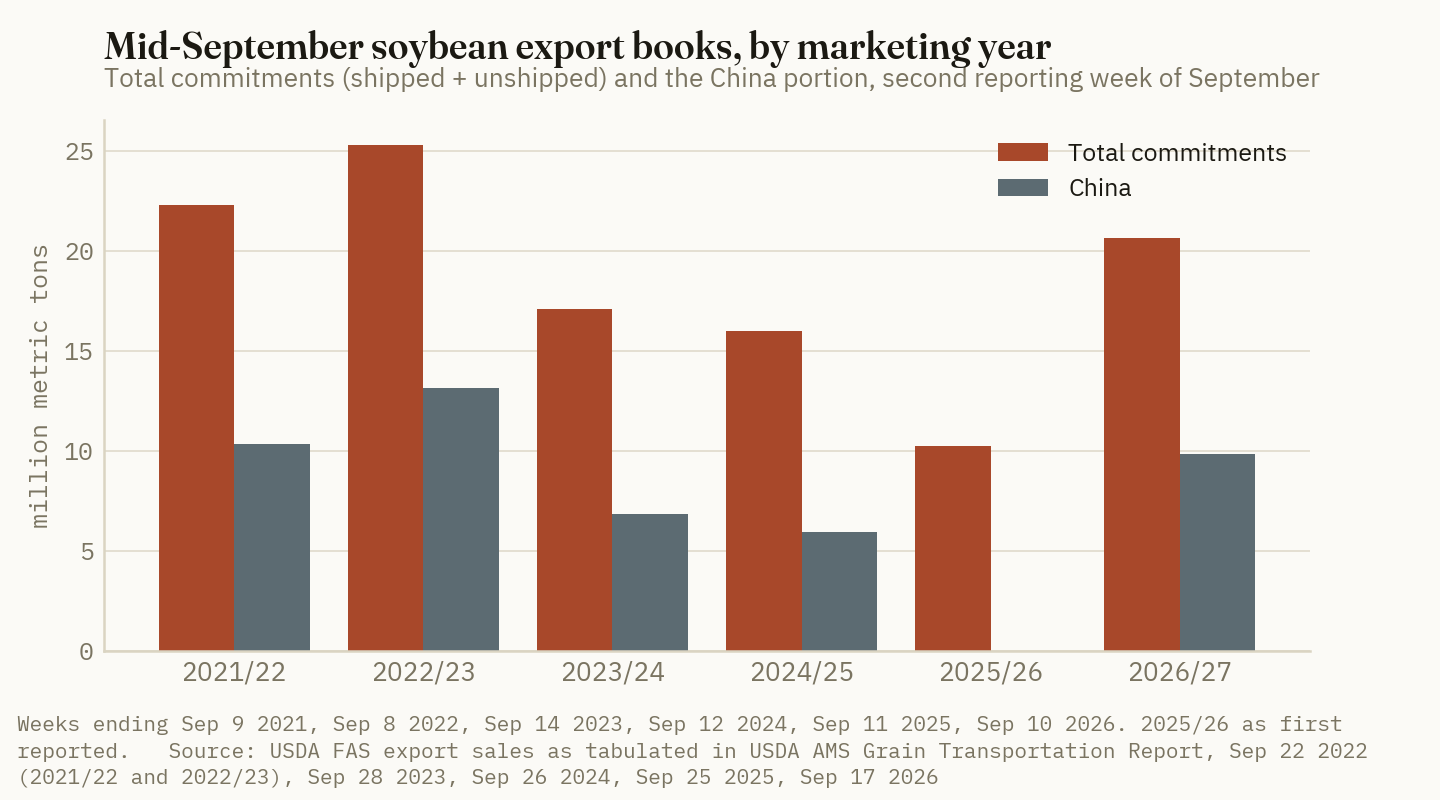
| Mid-September book | 2026/27 | 2025/26 | 2024/25 | 2023/24 | 2022/23 | 2021/22 |
|---|---|---|---|---|---|---|
| China commitments (1,000 MT) | 9,858 | 0 | 5,943 | 6,877 | 13,173 | 10,368 |
| China share of total book | 47.8% | 0.0% | 37.2% | 40.3% | 52.1% | 46.5% |
| Top five named buyers' share | 63% | 34% | 54% | 56% | 63% | 58% |
Source: USDA FAS via USDA AMS GTR (Sep 22, 2022; Sep 28, 2023; Sep 26, 2024; Sep 25, 2025; Sep 17, 2026). Weeks as in Section 1. Top-five share uses the GTR's fixed buyer list for each year. China share is a Crop Root Zone calculation.
Three points put the China number in scale:
- Against USDA's forecast. The 9.86 million tons China has booked equals 21.5% of the full-year US export forecast. Mexico, the second-largest named buyer, holds 1.80 million tons, 18% less than a year ago (USDA FAS via USDA AMS GTR, Sep 17, 2026).
- Against the political commitment. The White House said in November 2025 that China would buy at least 25 million tons of US soybeans "in each of 2026, 2027, and 2028" (The White House, Nov 2025). Those are calendar years. The pledge covers old-crop shipments made from January to August 2026 as well as new-crop sales, so marketing-year commitments cannot be read as progress toward it on a like-for-like basis.
- Against China's own needs. USDA projects Chinese soybean imports at 115.0 million tons in 2026/27 and Brazilian exports at a record 118.0 million tons (USDA WASDE-675, Sep 11, 2026). What China has booked from the US so far covers about 9% of its projected import year.
Another roughly 6 million tons is booked to unknown destinations, according to ADM Investor Services (Sep 17, 2026). Some of that is usually China as well. Market commentary has tied the latest buying to an expected US-China summit in the coming weeks (Price Futures Group, Sep 17, 2026). That makes the timing of the purchases partly political, not only a matter of price.
3. Early pace has not predicted the finish
What's new: Nothing this week. This is the historical record, and it is the part of the story the headline pace leaves out.
Evidence: Set each year's mid-September book against where exports finally landed relative to USDA's September forecast.
| Marketing year | Book as % of Sept. forecast (mid-Sep) | Sept. forecast (mil bu) | Final or latest estimate (mil bu) | Finish vs Sept. forecast |
|---|---|---|---|---|
| 2021/22 | 39.1% | 2,090 | 2,152 | +62 (+3.0%) |
| 2022/23 | 44.5% | 2,085 | 1,980 | −105 (−5.0%) |
| 2023/24 | 35.1% | 1,790 | 1,700 | −90 (−5.0%) |
| 2024/25 | 31.8% | 1,850 | 1,892 | +42 (+2.3%) |
| 2025/26 | 22.4% | 1,685 | 1,520 | −165 (−9.8%) |
| 2026/27 | 45.0% | 1,685 | — | — |
Source: USDA WASDE, Sep 2023 (2021/22 final), Sep 2024 (2022/23 final), Sep 2025 (2023/24 final) and Sep 11, 2026 (2024/25 final; 2025/26 estimate); forecasts and pace as in Section 1. Differences are Crop Root Zone calculations.
The year with the fastest mid-September start, 2022/23, finished 5% below USDA's September number. The year with the second-slowest start, 2024/25, finished above it. Only the extreme case lined up. In 2025/26, with China absent, both the pace and the finish were the weakest in the set.
The reason is when US soybeans actually sell. The US has its window from harvest through about January. Brazil's crop then reaches the market and takes most of the world's spring and summer demand. A large September book means the fall window is well sold. It says much less about the February-to-August sales that decide whether USDA's forecast holds. This year USDA projects Brazil will export a record 118 million tons (USDA WASDE-675, Sep 11, 2026). USDA's own commentary on the latest weekly report said grain and oilseed sales slowed "partially due to high prices compared to other exporters" (USDA FAS, as reported by Brownfield Ag News, Sep 2026).
4. The book is 96% unshipped, and the pull is going into freight
What's new: Of the 20.63 million tons committed, 19.83 million were still unshipped on September 10. Shipments so far this year are 80% of last year's pace, even though the book is twice the size (USDA FAS via USDA AMS GTR, Sep 17, 2026).
Evidence: A book this heavy in unshipped sales has to move from October through December, and it will move during harvest. Harvest was 6% complete through September 13, ahead of the five-year average (USDA NASS via USDA AMS GTR, Sep 17, 2026). This is the channel through which export sales should reach a farm-gate bid. At the moment, higher freight costs are taking a good part of it before it gets there.
| Soybean export flow and freight | Latest | Prior week / year ago | Change |
|---|---|---|---|
| Unshipped 2026/27 sales (1,000 MT), Sep 10 | 19,828 | 9,207 (yr ago) | +115% |
| Shipped marketing year to date (1,000 MT), Sep 10 | 803 | 1,002 (yr ago) | −20% |
| Export inspections, week ended Sep 10 (MT) | 672,759 | 822,666 (yr ago) | −18% |
| Gulf grain vessels loaded, week ended Sep 10 | 22 | — | −27% vs yr ago |
| Illinois River barge rate, % of tariff, Sep 16 | 263 | 219 (yr ago) | +44 pts |
| US average diesel, week ended Sep 14 ($/gal) | 6.285 | +2.546 vs yr ago | record |
| Iowa-to-Gulf soybean price spread, Sep 11 ($/bu) | −1.50 | −1.31 (Sep 4) | −0.19 |
| Iowa-to-Gulf soybean price spread, a year earlier ($/bu) | −1.26 (Sep 12, 2025) | −1.19 (Sep 13, 2024) |
Source: USDA AMS Grain Transportation Report, Sep 17, 2026 (FAS export sales; NASS; EIA diesel; AMS barge and price-spread data); Sep 18 and Sep 19, 2024 and 2025 editions for year-ago spreads; export inspections per Brownfield Ag News, Sep 14, 2026 (year-ago weekly figure derived from the 149,907-ton decline it reports). The spread is the interior price minus the Gulf export price; a more negative number means the interior is cheaper relative to the port.
The Iowa-to-Gulf spread is the key line. It widened 19 cents in one week and is 24 cents wider than a year ago. In other words, the Gulf is paying well for beans relative to Iowa, but moving them there costs more. With diesel at a record and barge rates 44 points of tariff above a year ago, a strong export book can coexist with a soft country bid. The margin goes to the barge line and the truck.
The country bids show it:
| Soybean cash bid | Latest | Basis | Year ago | Basis yr ago | Basis change |
|---|---|---|---|---|---|
| Central Illinois country elevator avg. | $12.94 (Sep 21) | −34X | $9.69 (Sep 22, 2025) | −42X | +8¢ |
| Iowa state avg. | $12.45 (Sep 18) | −59X | $9.61 (Sep 18, 2025) | −76X | +17¢ |
| Iowa processors avg. | $13.335 (Sep 18) | ≈ +30X (range −30X to +75X) | $10.045 (Sep 18, 2025) | ≈ −33X (range −50X to −20X) | ≈ +63¢ |
Source: USDA AMS Illinois Grain Bids, Sep 21, 2026 and Sep 22, 2025; USDA AMS Iowa Daily Cash Grain Bids, Sep 18, 2026 and Sep 18, 2025. X = CBOT November futures. Iowa processor average basis is a Crop Root Zone calculation (average bid less November settlement of $13.035 in 2026 and $10.375 in 2025).
A doubled export book has bought central Illinois 8 cents of basis and Iowa country elevators 17 cents. Iowa processors, meanwhile, moved their average bid about 63 cents against November. At the local bid, the buyer paying up is the crusher, not the exporter. The export book supports the futures price that every bid is quoted off, but the extra basis is coming from domestic crush.
5. The storage decision: a strong book, a thin carry
What's new: November soybeans settled at $13.28 on September 21, with May at $13.58, a 30-cent carry. On September 18, 2025, the same spread was 47¼ cents (CBOT settlements via USDA AMS Illinois Grain Bids, Sep 21, 2026; USDA AMS Iowa Daily Cash Grain Bids, Sep 18, 2025).
Evidence:
| CBOT soybean spread | Sep 21, 2026 (¢/bu) | Sep 18, 2025 (¢/bu) |
|---|---|---|
| November to January | 16 | 19 |
| November to March | 23¾ | 34 |
| November to May | 30 | 47¼ |
| Nov–May carry as % of November | 2.3% | 4.6% |
| Interest on cash beans, harvest to May, 7% a year (est.) | ~53 | ~40 |
Source: CBOT settlements as published in USDA AMS Illinois Grain Bids (Sep 21, 2026) and USDA AMS Iowa Daily Cash Grain Bids (Sep 18, 2025). The interest line is a Crop Root Zone estimate: central Illinois cash price ($12.94 in 2026; $9.69 in 2025) × 7% × 7/12. It excludes shrink, handling, insurance and on-farm storage costs. At 6% the 2026 figure is about 45 cents.
The export book is twice last year's size. In percentage terms, the carry the futures market pays to store beans is half of last year's. That fits USDA's 310-million-bushel carryout: a tight balance sheet does not reward holding grain. It also fits an export book concentrated in October through December. The export demand is near-term, and the curve prices it that way.
Here is how that plays out for a central Illinois bushel. At a 7% cost of money, storing to May costs about 53 cents in interest before any physical costs. The futures carry covers 30 cents of that. The other 23 cents has to come from basis, meaning a May bid of roughly 11 under May futures, up from 34 under November today. Central Illinois processors are already bidding between 20 under and 10 over November (USDA AMS Illinois Grain Bids, Sep 21, 2026). A spring basis near processor levels would roughly cover the interest. It would not pay for the bin, the shrink or the risk that Brazil takes the spring market, as it did in 2022/23.
Ground Truth: The export book is real, but it is a fall book. It is 96% unshipped, half of it is China buying partly on a political timetable, and in the last five years a fast September start has not told anyone where exports finished. So far its strength shows up in the futures price, which every grower already gets, and in freight, which the grower pays. It does not show up as a stronger basis: 8 cents in central Illinois is not a harvest-basis rally. Paired with a 30-cent November-to-May carry, which is less than the interest on a $13 bushel, the pace argues against a default decision to store unpriced beans on the strength of the export headline. The better bet is where the demand is actually showing up. Price harvest bushels against a processor bid within hauling distance, which in Iowa is running close to 90 cents over the state's country-elevator average. Keep storage for bushels that are already hedged, or that can realistically capture a spring basis near today's processor levels. The number to watch between now and the October 9 WASDE is not China's next flash sale. It is whether the Iowa-to-Gulf spread narrows as the unshipped book starts to load. If it does, the export book is reaching the farm. If it keeps widening, the barge line is collecting it.
References
- USDA Agricultural Marketing Service, Grain Transportation Report, Sep 17, 2026 (FAS export sales for week ended Sep 10, 2026, Tables 14 and 16; NASS harvest progress; barge, rail, ocean and price-spread indicators) — https://www.ams.usda.gov/sites/default/files/media/GTR09172026.pdf
- USDA Agricultural Marketing Service, Grain Transportation Report, Sep 25, 2025 (FAS export sales, week ended Sep 11, 2025) — https://www.ams.usda.gov/sites/default/files/media/GTR09252025.pdf ; and Sep 18, 2025 (price spreads) — https://www.ams.usda.gov/sites/default/files/media/GTR09182025.pdf
- USDA Agricultural Marketing Service, Grain Transportation Report, Sep 26, 2024 (week ended Sep 12, 2024) — https://www.ams.usda.gov/sites/default/files/media/GTR09262024.pdf ; and Sep 19, 2024 (price spreads) — https://www.ams.usda.gov/sites/default/files/media/GTR09192024.pdf
- USDA Agricultural Marketing Service, Grain Transportation Report, Sep 28, 2023 (week ended Sep 14, 2023) — https://www.ams.usda.gov/sites/default/files/media/GTR09282023.pdf
- USDA Agricultural Marketing Service, Grain Transportation Report, Sep 22, 2022 (weeks ended Sep 8, 2022 and year-earlier Sep 9, 2021) — https://www.ams.usda.gov/sites/default/files/media/GTR09222022.pdf
- USDA World Agricultural Outlook Board, World Agricultural Supply and Demand Estimates, WASDE-675, Sep 11, 2026 — https://www.usda.gov/oce/commodity/wasde/wasde0926.pdf
- USDA WAOB, WASDE, Sep 2025 — https://esmis.nal.usda.gov/sites/default/release-files/3t945q76s/z890tt821/r494xm02f/wasde0925.pdf
- USDA WAOB, WASDE, Sep 2024 — https://esmis.nal.usda.gov/sites/default/release-files/3t945q76s/rf5610383/t148h943n/wasde0924.pdf
- USDA WAOB, WASDE, Sep 2023 — https://esmis.nal.usda.gov/sites/default/release-files/3t945q76s/9880x805c/v405tt51d/wasde0923.pdf
- USDA AMS Market News, Illinois Grain Bids, Sep 21, 2026 — https://www.ams.usda.gov/mnreports/ams_3192.pdf ; and Sep 22, 2025 (ESMIS archive) — https://esmis.nal.usda.gov/publication/illinois-grain-bids
- USDA AMS Market News, Iowa Daily Cash Grain Bids, Sep 18, 2026 — https://mymarketnews.ams.usda.gov/viewReport/2850 ; and Sep 18, 2025 (ESMIS archive) — https://esmis.nal.usda.gov/publication/iowa-daily-cash-grain-bids
- ADM Investor Services, Ag Market View, Sep 17, 2026 — https://www.admis.com/ag-market-view-for-sept-17-2026/
- Price Futures Group, Grains Report, Sep 17, 2026 — https://blog.pricegroup.com/2026/09/17/grains-report-09-17-2026/
- Brownfield Ag News, "China, Japan lead the way for soybean export inspections," Sep 14, 2026 — https://www.brownfieldagnews.com/news/china-japan-lead-the-way-for-soybean-export-inspections/
- Brownfield Ag News, "Beef, pork export sales rise, while corn, soybeans fall," Sep 2026 — https://www.brownfieldagnews.com/news/beef-pork-export-sales-rise-while-corn-soybeans-fall/
- DTN/Progressive Farmer, Canada Markets blog, "New-Crop Soybean Export Sales May Be Too Hot," Aug 20, 2026 — https://www.dtnpf.com/agriculture/web/ag/blogs/canada-markets/blog-post/2026/08/20/new-crop-soybean-export-sales-may
- The White House, "Fact Sheet: President Donald J. Trump Strikes Deal on Economic and Trade Relations with China," Nov 2025 — https://www.whitehouse.gov/fact-sheets/2025/11/fact-sheet-president-donald-j-trump-strikes-deal-on-economic-and-trade-relations-with-china/
Disclosures
Crop Root Zone is an independent publication. Nothing here is investment advice. Market calls, where included, reflect the editors' own read and are not a recommendation to buy or sell any security.
A Kansas Winter Wheat Acre Repriced to September Retail Costs $311 and Breaks Even at 41.7 Bushels. Three of the Last Ten Kansas Crops Came In Under That.
We rebuild K-State's November 2025 South Central Kansas continuous-wheat budget line by line at this month's retail. Nitrogen at DTN's $0.72/lb N adds $14.30 an acre; phosphate priced off $923/st DAP with the nitrogen credited back gives $3.32 of it straight back, so the fertilizer bill rises only $10.98 and total cost goes from $295.26 to $311.01 — up 5.3%, and less than three-quarters of that increase is fertilizer. Against a July 2027 KC contract at $8.11 on September 4 and Oklahoma basis of 55 to 70 cents under, the acre breaks even at 41.7 bu on full cost and 27.1 bu over direct costs alone, versus a Kansas ten-year average of 45.8 and a K-State budgeted yield of 37. In K-State's own November numbers the same South Central acre returns $202.44 above total cost in grain sorghum and $101.26 in corn, against −$93.61 in wheat. And the Small Grains Summary that fixes the 2026 baseline does not print until September 30 — after most of this drill work is done.
The drills are moving through the hard red winter belt this week against the best deferred price in four years and the smallest HRW crop since the 1950s behind them — and, on the sourced line items, an acre that still does not cover its full cost. USDA's August 12 Crop Production report put 2026 hard red winter production at 462.7 million bushels, down 42% from 804.4 million in 2025 (USDA NASS, Aug 12, 2026). The July 2027 Kansas City contract was quoted at $8.11/bu on September 4 (Southern Ag Today, Sep 10, 2026). The crop-insurance price discovery window for 2027 winter wheat — the August 15 to September 14 average of that same July contract — closed four days before this issue went out. What follows is the acre those three facts actually produce, built from published extension line items and repriced at this month's retail, with every sourced line and every assumed line marked as such.
1. The acre, repriced
What's new: Kansas State's 2026 Farm Management Guide wheat budgets carry a November 1, 2025 date. They are the working cost standard in the HRW belt, and the two fertilizer prices inside them — $0.48/lb N and $0.91/lb P — are now ten months stale. DTN's retail survey for the week of September 7–11, 2026 puts urea at $658/st and anhydrous at $938/st, or $0.72 and $0.57 per pound of nitrogen respectively, with DAP at $923/st and MAP at $962/st (DTN/Progressive Farmer, Sep 16, 2026).
Evidence: We took K-State's Wheat (Continuous) Cost-Return Budget for South Central Kansas — 37 bu/acre planning yield, Ibendahl, O'Brien, Lancaster and Shoup, dated Nov 1, 2025 — and repriced only the lines that current published retail actually speaks to. Everything else is carried at K-State's number.
| Line (South Central KS, 37 bu/ac planning yield) | K-State, Nov 1 2025 | Repriced, Sep 2026 | Change |
|---|---|---|---|
| Seed | 21.00 | 21.00 | — |
| Nitrogen, 60 lb N (urea basis) | 28.90 | 43.20 | +14.30 |
| Phosphate, 18 lb P₂O₅ (DAP basis) | 16.31 | 12.99* | −3.32 |
| Lime, 500 lb | 15.00 | 15.00 | — |
| Herbicide + fungicide | 10.79 | 10.79 | — |
| Custom fertilizer application | 17.69 | 17.69 | — |
| Diesel | 18.93 | 18.93 | — |
| Labor (operator + additional) | 15.74 | 15.74 | — |
| Repairs and maintenance | 18.63 | 18.63 | — |
| Miscellaneous | 7.70 | 7.70 | — |
| Crop insurance premium | 10.02 | 14.29* | +4.27 |
| Interest on operating capital (6.5%, half year) | 5.87 | 6.37* | +0.50 |
| Total direct | 186.58 | 202.33 | +15.75 |
| Cash rent | 37.00 | 37.00 | — |
| Machinery capital recovery (depreciation + interest) | 71.68 | 71.68 | — |
| Total cost, $/acre | 295.26 | 311.01 | +15.75 |
Source: K-State Department of Agricultural Economics, Wheat (Continuous) Cost-Return Budget in South Central KS, Nov 1, 2025, for all Nov-2025 values and all carried lines; DTN/Progressive Farmer retail survey, week of Sep 7–11, 2026, for the nitrogen and phosphate repricing. Basis: non-irrigated, continuous wheat, middle yield, $/acre.
Asterisked cells are Crop Root Zone calculations, not sourced values. Nitrogen: 60 lb N × $0.72/lb N. Phosphate: DAP at $923/st is 360 lb N and 920 lb P₂O₅ per short ton; crediting the nitrogen at urea's $0.72/lb leaves $663.80 against 920 lb of P₂O₅, or $0.72/lb P₂O₅ — coincidentally the same number as nitrogen, and $0.19 below K-State's November phosphate price. Crop insurance: K-State's $10.02 scaled by the ratio of an estimated $8.00 projected price to Kansas's actual $5.61 for the 2026 crop; premium scales with liability, so this is a first-order estimate only and ignores any change in the volatility factor. Interest: K-State's own 3.25% effective rate applied to the repriced direct total.
The repriced acre is $15.75 more expensive, a 5.3% increase. Of that, $10.98 is fertilizer and $4.27 is the insurance premium the higher price guarantee itself generates. A grower who switches the 60 pounds of fall nitrogen from urea to anhydrous at $0.57/lb N pays $34.20 instead of $43.20 and gives back $9.00 of the $14.30 nitrogen increase — which is most of the fertilizer story in one decision.
Ground Truth: The line that decides this acre is not fertilizer. Machinery capital recovery at $71.68 is 23% of total cost and the single largest entry in the budget — larger than nitrogen and phosphate combined, larger than cash rent, and completely insensitive to what urea does between now and the drill. The growers still waiting on a nitrogen break before committing acres are optimizing a $14 term inside a $311 decision while the $72 term runs whether the ground gets seeded or not.
Ranked by size, the repriced acre looks like this:
| Line | $/acre | |
|---|---|---|
| Machinery capital recovery | 71.68 | ██████████ |
| Nitrogen, 60 lb N | 43.20 | ██████ |
| Cash rent | 37.00 | █████ |
| Seed | 21.00 | ███ |
| Diesel | 18.93 | ███ |
| Repairs and maintenance | 18.63 | ███ |
| Custom fertilizer application | 17.69 | ██ |
| Labor | 15.74 | ██ |
| Lime | 15.00 | ██ |
| Crop insurance premium* | 14.29 | ██ |
| Phosphate, 18 lb P₂O₅* | 12.99 | ██ |
| Herbicide + fungicide | 10.79 | ██ |
| Miscellaneous | 7.70 | █ |
| Interest on operating capital* | 6.37 | █ |
Source: as the table above. Bars scaled so the largest line is ten blocks. Asterisked lines are Crop Root Zone calculations.
$0.72/lb N
Retail urea's nitrogen cost in the week of September 7–11, 2026 — 50% above the $0.48/lb N K-State carried when it wrote the wheat budget in November 2025. The 60-pound fall program moves from $28.90 to $43.20 an acre. (DTN/Progressive Farmer, Sep 16, 2026; K-State Farm Management Guide, Nov 1, 2025)
2. The price side, and the window that just closed
What's new: The 2027 crop is the first HRW crop in several years being seeded into a genuinely short balance sheet. September's WASDE cut 2026/27 U.S. all-wheat production to 1,531 million bushels on 32.1 million harvested acres and a 47.8 bu/acre yield, raised the season-average farm price to $6.40/bu from $6.20 in August, and put hard red winter ending stocks at 319 million bushels against 437 a year earlier (USDA WAOB, WASDE-675, Sep 2026). Only 67% of the 2026 winter wheat area was harvested — tied for the lowest on record since the series began in 1909 — and the 990-million-bushel winter wheat crop was the smallest since 1963 (Southern Ag Today, Sep 10, 2026).
Evidence: That supply picture is what the deferred board is pricing. July 2027 Kansas City settled at $8.11/bu on September 4, 2026, against $7.53 for July 2027 Chicago (Southern Ag Today, Sep 10, 2026); the December 2026 HRW contract closed at $7.92 on September 14 after a 26-cent two-session break, with Oklahoma cash basis running 55 to 70 cents under futures (Oklahoma Farm Report, Sep 15, 2026). Take the middle of that basis range off the July 2027 board and the harvest-delivered cash bid a grower can plan against is roughly $7.46/bu — our estimate, not a quote.
The insurance number matters at least as much. RMA sets the winter wheat projected price from the average close of the July contract between August 15 and September 14 (Southern Ag Today, Sep 10, 2026). That window closed on September 14, 2026 — four days ago — and the final figure had not published as of this writing. For the 2026 crop the Kansas winter wheat projected price was $5.61 and Nebraska's was $5.75; for 2025 they were $5.90 and $6.00 (FCSAmerica, per USDA/RMA fall price discovery). On the traded levels visible inside this year's window, a 2027 projected price near $8.00 is the reasonable planning figure — our estimate — which would be roughly a 40% increase over the 2026 Kansas number, against a 5% decline between the 2025 and 2026 crop years.
Ground Truth: The projected price is already fixed; the grower simply does not know the digit yet. That inverts the usual order of the seeding decision. Every other input on this acre — nitrogen, seed, fuel, the rent check — can still be renegotiated between now and the drill, but the single largest determinant of downside revenue was locked by a market that stopped listening on September 14. For an operation that is genuinely on the fence, the question worth asking the agent this week is not what coverage level to buy but what the 85%-of-$8 guarantee does to the number of bushels that have to show up in June, because that is the calculation the acre now turns on.
3. Break-even against the actual yield record
What's new: At $311.01/acre and a $7.46 estimated cash bid, the full-cost break-even is 41.7 bu/acre. At the $8.11 board price it is 38.3. Counting direct expenses only — ignoring rent and machinery capital recovery, which is what a grower with owned ground and paid-for iron effectively does — it is 27.1 bu/acre.
Evidence: Kansas averaged 45.8 bu/acre over the ten crops from 2016 through 2025 and 43.6 bu/acre over the last five (USDA NASS, Kansas Field Office, Kansas Wheat History, December 2025). K-State's own planning yield for a South Central Kansas continuous-wheat acre is 37 bu — four and a half bushels below the full-cost break-even, and the reason its November budget showed −$93.61 in returns above total specified expenses even before any of this year's price move.
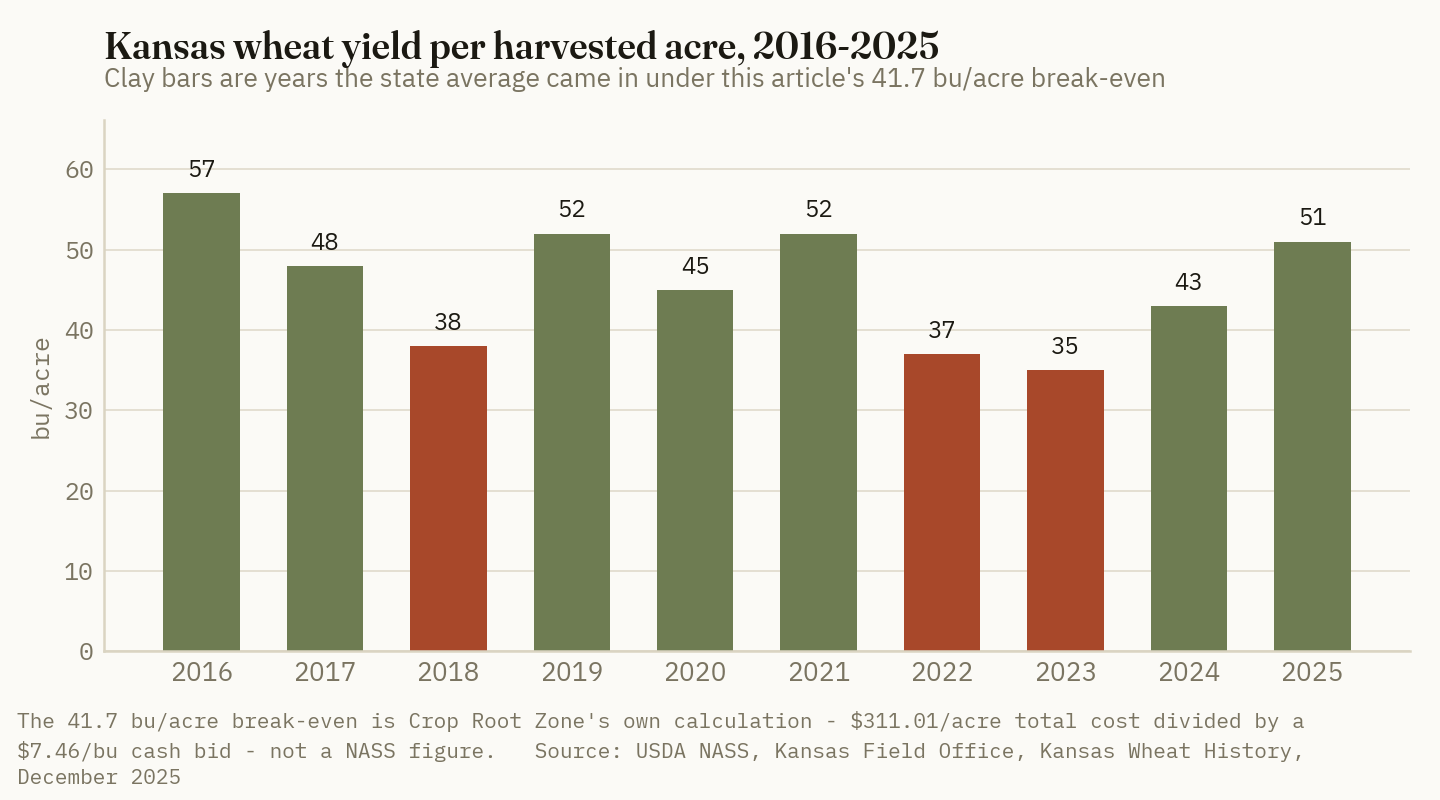
Three of the last ten Kansas crops — 2018 at 38.0, 2022 at 37.0 and 2023 at 35.0 — came in under 41.7 bu/acre. That is a 30% historical frequency of missing full cost on the state average alone, before county and field variation, and before the 2026 crop, whose state-level number does not publish until September 30.
The geography matters. K-State's Southwest Kansas wheat-fallow budget carries a 54 bu/acre planning yield against $196.30 of direct cost and $332.54 total — but it capitalises two years of land into one crop, with cash rent at $72.00/acre rather than $37.00, and still showed −$47.95 above total cost at a $5.27 wheat price. Nebraska's Panhandle no-till fallow budget (UNL #076, 2026) runs a 70 bu/acre goal at $240.83 operating and $377.38 total economic cost, or $5.39/bu — the lowest per-bushel full cost of the three, and entirely a function of the yield assumption, not of cheaper inputs. Its fertilizer line is $95.00/acre against K-State's $60.21.
4. What else the acre could do
What's new: On K-State's own November 2025 prices, wheat was the worst use of a South Central Kansas acre by a wide margin, and repricing the wheat acre to September 2026 closes about $59 of that gap without closing it.
Evidence:
| South Central KS acre (K-State 2026 budgets, middle yield) | Yield, bu/ac | Price, $/bu | Total cost, $/ac | Return above total cost, $/ac |
|---|---|---|---|---|
| Grain sorghum | 110 | 4.56 | 299.16 | +202.44 |
| Soybeans | 40 | 10.53 | 271.81 | +149.39 |
| Corn | 110 | 4.65 | 410.23 | +101.26 |
| Wheat, continuous — K-State, Nov 2025 | 37 | 5.45 | 295.26 | −93.61 |
| Wheat, continuous — repriced, Sep 2026* | 37 | 7.46* | 311.01* | −34.99* |
Source: K-State Department of Agricultural Economics, 2026 Farm Management Guide cost-return budgets for South Central Kansas, all dated Nov 1, 2025. Basis: non-irrigated, middle yield, $/acre, including cash rent of $37.00 and machinery capital recovery. Asterisked row and cells are Crop Root Zone calculations as described in Section 1.
The commodity prices behind the alternatives have not moved the way wheat has. September's WASDE carries 2026/27 sorghum at a $4.60 season-average farm price, corn at $4.80 and soybeans at $12.00 (USDA WAOB, Sep 2026); Oklahoma milo cash bids ran $4.46 to $4.63 on September 15, basis roughly 70 cents under December corn (Oklahoma Farm Report, Sep 15, 2026). K-State's November sorghum price of $4.56 is, within four cents, still the right number. Wheat's is not.
For wheat to match sorghum's budgeted $202.44 return on the same South Central acre, it would have to yield ($311.01 + $202.44) ÷ $7.46 = 68.8 bu/acre. Kansas has never averaged that; the state record is 57.0, set in 2016.
Ground Truth: The comparison table is the wrong frame for a September decision, and running it straight is how growers talk themselves into the wrong answer. Sorghum, corn and soybeans are spring crops. The real alternative to seeding wheat this month is not planting sorghum — it is keeping the acre open and deciding in March, with four more WASDEs, a Small Grains Summary, a January Winter Wheat Seedings report and an actual winter behind you. That option has value, and it is worth more than usual this year precisely because the wheat acre now pencils positive over direct cost (+$73.69 at 37 bu and $7.46) while still losing $35 on full cost: the grower who seeds is buying a modest, near-certain contribution to overhead, and the grower who waits is buying information. Neither is wrong. What is wrong is treating a −$93.61 November budget line as though it still describes the choice.
5. What the pace and the calendar actually show
What's new: The acreage response to $8 wheat is not showing up in the drill yet. As of the week ending September 13, 2026, the 18 states that planted 90% of 2025 winter wheat acreage were 8% seeded, against 10% a year earlier and a 12% five-year average (USDA NASS, Crop Progress, released Sep 14, 2026).
Evidence:
| Winter wheat planted, % | Wk ending Sep 13, 2026 | Sep 13, 2025 | 2021–25 avg |
|---|---|---|---|
| Oklahoma | 0 | 3 | 7 |
| Kansas | 4 | 4 | 6 |
| Nebraska | 5 | 16 | 15 |
| Colorado | 15 | 18 | 25 |
| Montana | 11 | 10 | 15 |
| Texas | 12 | 12 | 13 |
| South Dakota | 17 | 20 | 20 |
| Washington | 33 | 49 | 42 |
| 18 States | 8 | 10 | 12 |
Source: USDA NASS, Crop Progress, released Sep 14, 2026, week ending Sep 13, 2026. Basis: percent of intended winter wheat area planted; the 18 states shown planted 90% of 2025 winter wheat acreage.
Oklahoma had not turned a wheel — zero percent against a 7% average — and Nebraska was a third of its normal pace. The same report rated pasture and range 64% poor or very poor in Oklahoma, 59% in Nebraska, 58% in Texas, 50% in Colorado and 40% in Kansas. Pasture condition is not a topsoil moisture reading, but in the southern plains in September it is a serviceable proxy for whether seed put in the ground will come up, and it is the reason the dual-purpose graze-out acre — the single biggest swing factor in Oklahoma's wheat area — has not been committed.
The calendar compounds it. The USDA Small Grains Summary, which fixes final 2026 state-level winter wheat yield, harvested area and production, does not publish until September 30 (Oklahoma Farm Report, Sep 15, 2026). By then Kansas is inside its optimal seeding window and Oklahoma's dual-purpose acres are committed or abandoned. The number that sets the baseline against which 2027 acreage will be judged arrives after the decision it is supposed to inform — every single year.
Ground Truth: Watch the October 12 Crop Progress, not the September 30 Small Grains Summary. The Summary is history; the pace report is the only near-real-time read on whether $8 wheat is actually buying acres or whether dry seedbeds are rationing them regardless of price. If the 18-state figure is still trailing its five-year average by four or more points in mid-October, the 2027 acreage rebound that the futures curve is currently assuming does not happen on the scale being assumed — and the price that is now locked into every 2027 revenue guarantee will have been set on an acreage expectation the weather declined to deliver.
References
- USDA NASS, Crop Progress, released Sep 14, 2026 (week ending Sep 13, 2026) — https://esmis.nal.usda.gov/sites/default/release-files/796060/prog3726.pdf
- USDA World Agricultural Outlook Board, World Agricultural Supply and Demand Estimates, WASDE-675, September 2026 — https://www.usda.gov/oce/commodity/wasde/wasde0926.pdf
- USDA NASS, Crop Production, Aug 12, 2026 (wheat production by class) — https://esmis.nal.usda.gov/sites/default/release-files/796015/crop0826.pdf
- USDA NASS, Kansas Field Office, Kansas Wheat History, December 2025 — https://www.nass.usda.gov/Statistics_by_State/Kansas/Publications/Cooperative_Projects/KS-wheat-history-25.pdf
- Kansas State University Department of Agricultural Economics, Wheat (Continuous) Cost-Return Budget in South Central KS, 2026 Farm Management Guide, Ibendahl, O'Brien, Lancaster and Shoup, Nov 1, 2025 — https://www.agmanager.info/farm-budgets/2026-farm-management-guides-non-irrigated-crops
- Kansas State University Department of Agricultural Economics, Wheat (W-F) Cost-Return Budget in Southwest KS, Ibendahl, O'Brien, Holman, Lancaster and Haag, Nov 1, 2025 — https://www.agmanager.info/farm-budgets/2026-farm-management-guides-non-irrigated-crops
- Kansas State University Department of Agricultural Economics, Grain Sorghum, Corn and Soybean Cost-Return Budgets in South Central Kansas, Nov 1, 2025 — https://www.agmanager.info/farm-budgets/2026-farm-management-guides-non-irrigated-crops
- University of Nebraska–Lincoln Center for Agricultural Profitability, 2026 Nebraska Crop Budget #076, Wheat, Dryland, Panhandle, No Till, Fallow, One Crop in Two Years — https://cap.unl.edu/crop-budget-reports/
- Glennis McClure, "2026 Nebraska Crop Budgets: Summary and Key Insights," UNL Department of Agricultural Economics, Jan 28, 2026 — https://agecon.unl.edu/2026-nebraska-crop-budgets-summary-and-key-insights/
- DTN/Progressive Farmer, "Fertilizer Prices Continue Lower for 6 of 8 Major Nutrients," Sep 16, 2026 (retail survey, week of Sep 7–11, 2026) — https://www.dtnpf.com/agriculture/web/ag/crops/article/2026/09/16/fertilizer-prices-continue-lower-6-8
- Mark Welch, "Production, Price, and Profit Prospects for the 2027 Wheat Crop," Southern Ag Today, republished by the Texas Wheat Producers Board, Sep 10, 2026 — https://texaswheat.org/production-price-and-profit-prospects-for-the-2027-wheat-crop/
- Oklahoma Farm Report, "USDA Reports Pressure Wheat and Oilseeds While Corn and Milo Find Support," Sep 15, 2026 — https://www.oklahomafarmreport.com/2026/09/15/usda-reports-pressure-wheat-and-oilseeds-while-corn-and-milo-find-support/
- FCSAmerica, Crop Insurance Price Guarantees (USDA/RMA fall price discovery, winter wheat, Kansas and Nebraska) — https://www.fcsamerica.com/insurance/resources/crop-insurance-prices
- Tony St. James, "Higher Prices Improve 2027 Winter Wheat Planting Prospects," Sep 10, 2026 — https://www.allagnews.com/higher-prices-improve-2027-winter-wheat-planting-prospects/
Editor's note on sourcing: Oklahoma State University's enterprise budget files were not retrievable during reporting, so no OSU line appears above. Oklahoma cost figures here are carried from the K-State South Central Kansas budgets, which cover a comparable cropping system, and Oklahoma price and basis figures from the Oklahoma Farm Report. We will run the OSU wheat budget against this one when it is available.
Disclosures
Crop Root Zone is an independent publication. Nothing here is investment advice. Market calls, where included, reflect the editors' own read and are not a recommendation to buy or sell any security.
A $5.30 Harvest Price Adds $121 an Acre to an 85% Corn Guarantee. It Adds Zero Bushels — the Indemnity Still Doesn't Trigger Until 178.5.
RMA set the 2026 projected prices at $4.62 for corn and $11.09 for soybeans off February settlements; on September 17 December corn closed at $5.30½ and November beans at $13.19¾, with the October 1–31 harvest-price discovery window still to open. On a representative 210 bu/acre central Illinois corn farm at 85% Enterprise Unit coverage, an October average of $5.30 lifts the revenue guarantee from $824.67/acre to $946.05/acre — but because actual revenue is valued at the same harvest price, the yield that triggers an indemnity stays at 178.5 bu/acre in both cases. USDA's September 11 Crop Production put Illinois corn at 209.0 bu/acre, so that farm needs a 14.6% yield collapse from where it is tracking before a dollar is paid. We run the trigger yield across five October scenarios from $4.20 to $5.60, price the Harvest Price Exclusion at 22.9 bu/acre of forgone trigger, and show what the 85% upgrade actually buys in bushels. The October average is not yet known and nothing here asserts one.
On October 1 the Chicago Board of Trade's December corn contract and November soybean contract begin an unremarkable month of trading that will decide how much crop insurance protection the 174.4 million acres of U.S. corn and soybeans forecast for harvest this year is actually carrying (USDA NASS, Sep 11, 2026). Under the Risk Management Agency's Commodity Exchange Price Provisions, the harvest price for corn and soybeans in Illinois, Iowa, Indiana, Minnesota, Nebraska and the rest of the March 15 sales-closing-date states is the average daily settlement of those two contracts across every trading day from October 1 to October 31, rounded to the nearest whole cent (24-CEPP-0041 and 24-CEPP-0081, released June 2023, effective for the 2024 and succeeding crop years). RMA set this year's projected prices the same way in February: $4.62/bu for corn and $11.09/bu for soybeans (DTN/Progressive Farmer, Feb 27, 2026; farmdoc daily, Mar 2026). On Thursday, September 17, December corn settled at $5.30½ and November soybeans at $13.19¾ (Brownfield Ag News closing futures, Sep 17, 2026) — 15% and 19% above those February numbers. That gap is about to be priced into every Revenue Protection guarantee in the Corn Belt, and it does considerably less for the grower than the dollar figure suggests.
1. What February locked in, and what October actually decides
What's new: Nothing about the projected price changes. The 2026 projected prices were fixed at the end of February and are the floor of every RP guarantee: the policy pays on the greater of the projected price or the harvest price. What October decides is only whether that floor gets revalued upward.
Evidence: The two discovery windows and the contracts they run on are set out in the CEPP tables by state and sales-closing date. For the March 15 states — which is most of the Corn Belt — corn runs the December contract and soybeans the November contract, February 1–28 for the projected price and October 1–31 for the harvest price. A handful of states sit outside that: corn in Oklahoma and Texas discovers September 1–30, and Idaho, Michigan, Oregon and Washington discover November 1–30. Soybeans in Delaware, Maryland, Oklahoma, Virginia and West Virginia run the January contract and discover November 1–30.
| Crop | Contract | Projected price (Feb 2026) | Volatility factor | Sep 17, 2026 settlement | Gap to projected | Harvest discovery |
|---|---|---|---|---|---|---|
| Corn | CBOT December | $4.62 | 0.15 | $5.30½ | +14.8% | Oct 1–31 |
| Soybeans | CBOT November | $11.09 | 0.13 | $13.19¾ | +19.0% | Oct 1–31 |
Basis: CBOT futures settlements, cents per bushel, March 15 sales-closing-date states (IL, IA, IN, MN, NE and most others). Sources: RMA 24-CEPP-0041 / 24-CEPP-0081; DTN/Progressive Farmer, Feb 27, 2026; farmdoc daily, Mar 2026; Brownfield Ag News, Sep 17, 2026.
The size of that gap is unusual. In four of the last five crop years the October average came in below February's — corn finished at 82.6% of projected in 2023 and 89.8% in 2025, soybeans at 86.8% in 2024 (DTN/Progressive Farmer; farmdoc daily). The harvest-price option earned its premium in 2021 and 2022 and has been dead weight since.
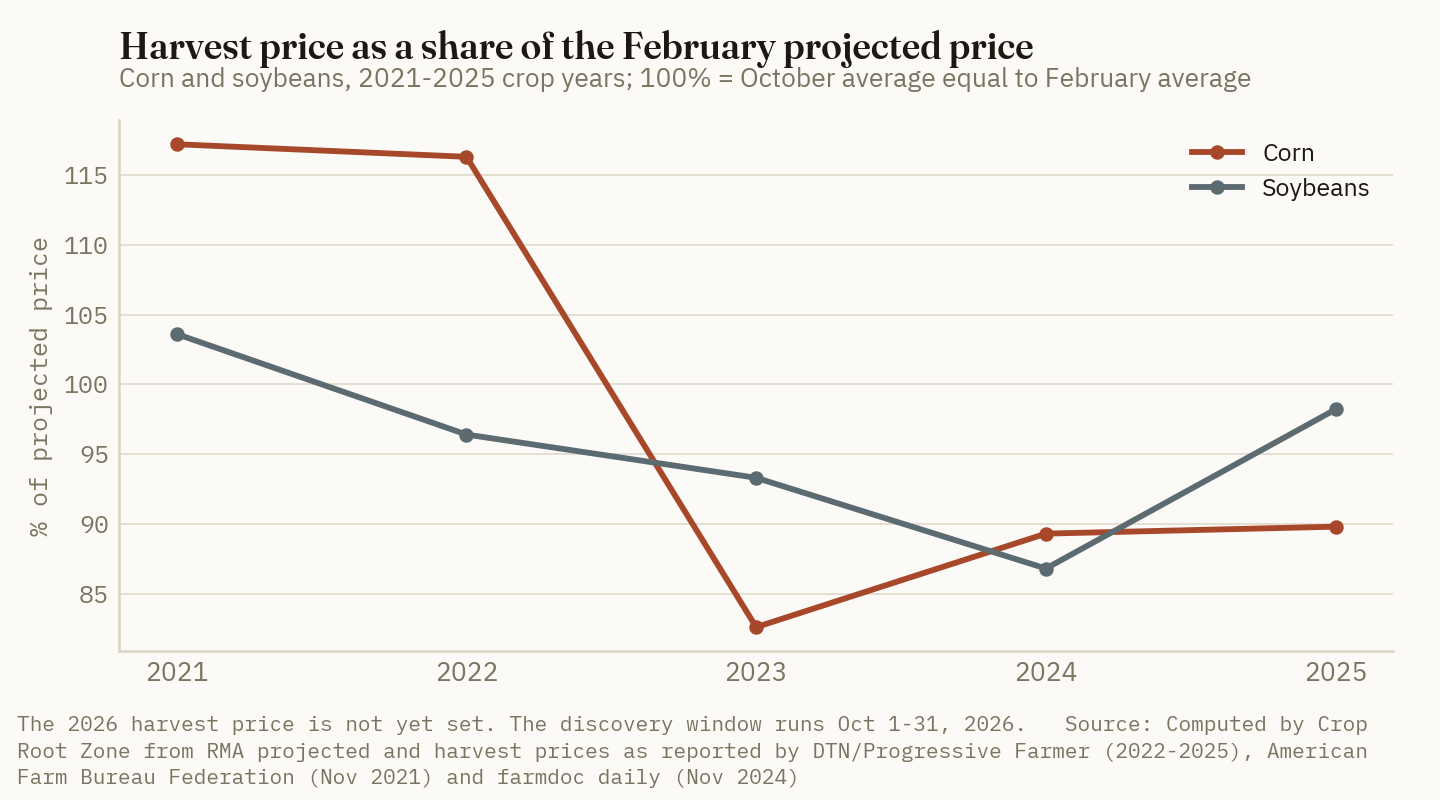
The rally that produced this year's gap is recent and demand-led. December corn settled 2025 at $4.6050, bottomed at $4.2575 on June 30, 2026, and set a contract high of $5.4975 on September 2 (Barchart-sourced levels reported Sep 8, 2026). USDA's September 11 Crop Production report then cut the national corn yield 2.2 bu to 178.5 bu/acre and production to 15.8 billion bushels, down 7% from 2025, with ending stocks at 1.6 billion bushels and the season-average farm price raised 30 cents to $4.80/bu (USDA NASS, Sep 11, 2026; WASDE as reported by High Plains Journal, Sep 14, 2026).
Ground Truth: The market and the insurance mechanism are reading the same crop and drawing opposite conclusions. Futures rallied because the corn carryout tightened; the RP guarantee will rise for exactly that reason. But the guarantee is a revenue floor, and the same tight carryout that lifts the price is lifting the value of every bushel the farm actually harvests. A grower reading the October harvest price as "my coverage went up $121 an acre" is reading a gross number where only the net matters — and the net, as Section 2 shows, is zero.
2. The guarantee moves; the trigger doesn't
What's new: The RP revenue guarantee is APH yield × coverage level × the greater of projected or harvest price. Actual revenue is actual yield × harvest price. When the harvest price exceeds the projected price, the same number appears on both sides of the comparison and cancels. The indemnity trigger reduces to a pure bushel count: coverage level × APH.
Evidence: Take a representative central Illinois corn farm — trend-adjusted APH of 210 bu/acre, Enterprise Unit, standard RP. The 210 bu/acre APH and the Enterprise Unit structure are our assumptions for a worked example, not sourced figures; they are set against Illinois' 214.0 bu/acre actual in 2025 and 209.0 bu/acre September 1 forecast for 2026 (USDA NASS Crop Production, Sep 11, 2026). Every price in the table below is either the RMA projected price or a labeled October scenario. We are not forecasting an October average, and none of these five scenarios is a prediction.
| Oct average (scenario)* | Guarantee price | 80% guarantee, $/acre | 80% trigger yield, bu | 85% guarantee, $/acre | 85% trigger yield, bu |
|---|---|---|---|---|---|
| $4.20 | $4.62 | 776.16 | 184.8 | 824.67 | 196.4 |
| $4.62 | $4.62 | 776.16 | 168.0 | 824.67 | 178.5 |
| $5.00 | $5.00 | 840.00 | 168.0 | 892.50 | 178.5 |
| $5.30 | $5.30 | 890.40 | 168.0 | 946.05 | 178.5 |
| $5.60 | $5.60 | 940.80 | 168.0 | 999.60 | 178.5 |
Basis: 210 bu/acre trend-adjusted APH, Enterprise Unit, standard Revenue Protection, central Illinois corn. Guarantee price is the greater of the $4.62 projected price and the October average. Trigger yield is the actual yield at which actual revenue first falls below the guarantee. *October average scenarios are illustrative only — the 2026 harvest price is unknown until RMA publishes it in early November. Projected price: RMA, Feb 2026. All other cells computed by Crop Root Zone.
Read the fourth row against the second. Going from a $4.62 harvest price to a $5.30 harvest price raises the 85% guarantee by $121.38/acre and the 80% guarantee by $114.24/acre. It moves the trigger yield by nothing at all — 178.5 bu and 168.0 bu in both cases, because 178.5 bu × $5.30 is exactly the guarantee that $5.30 created.
178.5 bu/acre
The yield below which an 85% RP policy on a 210 bu/acre APH pays an indemnity — at any October harvest price of $4.62 or above. The trigger is 85% of APH and nothing else. (Crop Root Zone calculation from RMA's 2026 corn projected price of $4.62/bu)
Only the top row behaves differently. At a $4.20 October average the guarantee stays anchored at $4.62 while revenue is valued at $4.20, so the trigger yield climbs to 196.4 bu at 85% coverage and 184.8 bu at 80% — a 10% price decline converts into roughly 10% more insured bushels. That is what the projected-price floor is for, and it is the only direction in which RP delivers price protection at all.
Ground Truth: In an up-price October, Revenue Protection stops being revenue insurance and becomes yield insurance with an inflation adjustment attached. The practical consequence is a marketing-desk one, not an agronomic one: bushels already priced below the harvest price are not topped up by the higher guarantee, because the guarantee only pays when the bushels are missing. A farm that forward-sold half its corn at $4.50 and harvests a full crop collects nothing from a $5.30 harvest price on either side of the ledger — the insurance does not pay, and the contracts do not reprice. The harvest-price option is a replacement-cost provision for grain that failed to grow, and it has never been anything else.
3. Where the farm is actually tracking
What's new: USDA's first survey-based 2026 yield estimates put Illinois corn at 209.0 bu/acre and Iowa at a record 219.0 bu/acre, against a national 178.5 bu/acre (USDA NASS Crop Production, Sep 11, 2026). Illinois soybeans came in at 66.0 bu/acre and Iowa at 64.0, against a national 52.8.
Evidence: If the representative farm tracks its state, it produces 209 bu/acre. At a $5.30 harvest price that is $1,107.70/acre of insured revenue against an 85% guarantee of $946.05 — a cushion of $161.65/acre, or 30.5 bushels. The farm must lose 14.6% of the crop it is currently on track to make before the policy pays a cent. At 80% coverage the required loss is 19.6%.
The same arithmetic on the soybean side, using a 65 bu/acre APH assumption:
| Coverage | Insured bu | Guarantee at $11.09 projected, $/acre | Guarantee at $13.20 harvest*, $/acre | Trigger yield, bu | Loss required from 66.0 bu/acre |
|---|---|---|---|---|---|
| 80% | 52.00 | 576.68 | 686.40 | 52.0 | 21.2% |
| 85% | 55.25 | 612.72 | 729.30 | 55.25 | 16.3% |
Basis: 65 bu/acre trend-adjusted APH (our assumption), Enterprise Unit, standard Revenue Protection, central Illinois soybeans. *$13.20 is a rounded illustrative October average based on the September 17 November-contract settlement of $13.19¾ — it is a scenario, not the harvest price. Projected price $11.09: RMA, Feb 2026. Illinois 2026 soybean yield forecast 66.0 bu/acre: USDA NASS, Sep 11, 2026. Guarantee and trigger cells computed by Crop Root Zone.
The soybean guarantee gains more in percentage terms — $116.58/acre at 85% coverage, a 19.0% uplift — and it changes the trigger yield by exactly as much as corn's did, which is to say not at all.
There are two ways this farm still collects. The first is a genuine yield failure between now and the combine: late-season stalk rot, a green-snap event, a wet finish that costs test weight and drying charges. Nothing in the September survey rules that out, and the gap between the September 1 forecast and the final January number has run to several bushels in either direction in most years. The second is county-level area coverage — SCO and ECO sit above the RP policy and settle on county revenue, not farm revenue, and their triggers do not collapse the same way because the county yield can fall while an individual farm's does not. Those are separate products with separate elections already made in March; the point here is that the underlying RP policy is not where the protection is coming from this year.
4. The Harvest Price Exclusion and the 85% upgrade, priced in bushels
What's new: Revenue Protection with Harvest Price Exclusion (RP-HPE) carries a lower premium because the guarantee is built on the projected price only and never revalues upward (Iowa State University Ag Decision Maker, A1-48). In a February where corn's projected price came in at a 15-year low and the volatility factor fell to 0.15 from 0.18, that discount looked like free money. It is now costing 22.9 bu/acre of trigger.
Evidence: At a $5.30 October average, RP-HPE holds the 85% guarantee at $824.67/acre while revenue is valued at $5.30, so the trigger yield falls to 155.6 bu/acre against standard RP's 178.5. At 80% coverage the HPE trigger is 146.4 bu against 168.0. Expressed the way a grower will actually experience it — bushels the crop must lose from the 209.0 bu/acre the state is tracking before a dollar is paid:
| Policy configuration | Trigger yield, bu/acre | Bushels of loss required | |
|---|---|---|---|
| RP, 85% coverage | 178.5 | 30.5 | █████ |
| RP, 80% coverage | 168.0 | 41.0 | ███████ |
| RP-HPE, 85% coverage | 155.6 | 53.4 | █████████ |
| RP-HPE, 80% coverage | 146.4 | 62.6 | ██████████ |
Basis: 210 bu/acre APH, central Illinois corn, illustrative $5.30 October harvest-price scenario, measured against Illinois' 209.0 bu/acre September 1 forecast (USDA NASS, Sep 11, 2026). Bars scaled so the longest is ten blocks. All trigger yields computed by Crop Root Zone from RMA's $4.62 projected price.
The coverage-level question prices the same way. Moving from 80% to 85% buys 10.5 insured bushels — $55.65/acre at a $5.30 harvest price — and it is the most expensive five points on the schedule. For the 2026 crop year the Enterprise Unit premium subsidy runs 80% at both the 70% and 75% coverage levels, drops to 71% at 80% and to 56% at 85% (Kansas State University, AgManager.info, "High Coverage Policies, Unit Structure, and the 2026 Crop Insurance Decision"). Those are the post-reconciliation rates, up from 68% and 53% respectively. The grower pays 44 cents of every premium dollar at the 85% level against 29 cents at 80%, for 10.5 bushels of additional trigger.
Ground Truth: The HPE election is the one decision in this chain that can still be re-evaluated on evidence, and the evidence keeps arriving in the wrong order. Its premium saving is a known number in February; its cost is an unknown number in October, and it is large precisely in the years when yields are also short — because a short crop and a high harvest price are the same event. That is the correlation HPE sells away, and this is the first year since 2022 the market has been priced to make the seller regret it. The decision that follows is not about this crop, which is insured under whatever was elected in March. It is about the March 2027 election, and the case for HPE should now be argued against a five-year record in which the harvest-price option was worth nothing four times and, on current futures, would be worth $121/acre at 85% coverage the fifth.
RMA publishes the final harvest prices in the first days of November. Until then, every harvest-price figure in this piece is a scenario with our arithmetic attached, and the only numbers that are settled are $4.62, $11.09, and whatever comes out of the combine.
References
- USDA Risk Management Agency, Commodity Exchange Price Provisions — Section II — Corn, 24-CEPP-0041, released June 2023, effective for the 2024 and succeeding crop years. https://www.rma.usda.gov/sites/default/files/crop-policies/Commodity-Exchange-Price-Provisions---Corn-24-CEPP.pdf
- USDA Risk Management Agency, Commodity Exchange Price Provisions — Section II — Soybeans, 24-CEPP-0081, released June 2023. https://www.rma.usda.gov/sites/default/files/crop-policies/Commodity-Exchange-Price-Provisions---Soybeans-24-CEPP.pdf
- USDA Risk Management Agency, Commodity Exchange Price Provisions (index of current crop-year documents), accessed Sep 18, 2026. https://www.rma.usda.gov/policy-procedure/general-policies/commodity-exchange-price-provisions
- DTN/Progressive Farmer, "Crop Insurance Price Falls to $4.62 for Corn, Soybeans Bump Up to $11.09," Feb 27, 2026. https://www.dtnpf.com/agriculture/web/ag/news/business-inputs/article/2026/02/27/crop-insurance-price-falls-4-62-corn
- farmdoc daily (University of Illinois), "Projected Prices and Volatility Factors for 2026," Mar 2026. https://farmdocdaily.illinois.edu/2026/03/projected-prices-and-volatility-factors-for-2026.html
- Brownfield Ag News, "Closing Grain and Livestock Futures: September 17, 2026," Sep 17, 2026. https://www.brownfieldagnews.com/market-news/closing-grain-and-livestock-futures-september-17-2026/
- USDA National Agricultural Statistics Service, Crop Production, ISSN 1936-3737, released Sep 11, 2026 (conditions as of Sep 1, 2026). https://esmis.nal.usda.gov/sites/default/release-files/796056/crop0926.pdf
- High Plains Journal, "USDA lowers corn production forecast, raises soybean price outlook" (September 2026 WASDE), Sep 14, 2026. https://hpj.com/2026/09/14/wasde-report-sept-11/
- Barchart/Teucrium levels for December 2026 CBOT corn as reported in "Will Corn's Bullish Trend Continue," Sep 8, 2026. https://finance.yahoo.com/markets/commodities/articles/corn-bullish-trend-continue-190002710.html
- DTN/Progressive Farmer, "Harvest Crop Insurance Prices Fall Below Spring Guarantees at $4.16 for Corn, $10.03 for Soybeans," Oct 31, 2024. https://www.dtnpf.com/agriculture/web/ag/news/business-inputs/article/2024/10/31/harvest-crop-insurance-prices-fall-4
- DTN/Progressive Farmer, "Harvest Crop Insurance Prices Fall Below Spring Guarantees at $4.88 for Corn, $12.84 for Soybeans," Oct 31, 2023. https://www.dtnpf.com/agriculture/web/ag/news/business-inputs/article/2023/10/31/harvest-crop-insurance-prices-fall-4
- DTN/Progressive Farmer, "Harvest Price Option Triggers for Corn Revenue Protection Crop Insurance Policies in 2022," Oct 31, 2022. https://www.dtnpf.com/agriculture/web/ag/news/business-inputs/article/2022/10/31/harvest-price-option-triggers-corn
- American Farm Bureau Federation, Market Intel, "Crop Insurance Guarantees Soar" (2021 harvest prices: corn $5.37, soybeans $12.30), Nov 2021. https://www.fb.org/market-intel/crop-insurance-guarantees-soar
- farmdoc daily (University of Illinois), "2024 Harvest Prices and Revenue Insurance Payments for Corn and Soybeans," Nov 2024. https://farmdocdaily.illinois.edu/2024/11/2024-harvest-prices-and-revenue-insurance-payments-for-corn-and-soybeans.html
- Iowa State University Extension, Ag Decision Maker A1-48, "Current Crop Insurance Policies" (Revenue Protection and Harvest Price Exclusion definitions). https://www.extension.iastate.edu/agdm/crops/html/a1-48.html
- Jennifer Ifft, Kansas State University Department of Agricultural Economics / AgManager.info, "High Coverage Policies, Unit Structure, and the 2026 Crop Insurance Decision" (2026 Enterprise Unit premium subsidy rates). https://www.agmanager.info/sites/default/files/pdf/Ifft_CropInsurance_2A.pdf
Disclosures
Crop Root Zone is an independent publication. Nothing here is investment advice. Market calls, where included, reflect the editors' own read and are not a recommendation to buy or sell any security.
The H-2A Wage Rewrite Cut an Iowa Grain Farm's Seasonal Labor Bill by About $5 an Acre and a Washington Apple Orchard's by $345 to $1,150. A Federal Court Has Now Put Both Savings on Notice for Backpay.
The October 2025 rule dropped entry-level H-2A wages by $4.93 to $6.45 an hour in the largest H-2A states and the Corn Belt. For a 2,000-acre Iowa corn-soybean farm using two seasonal workers, that is $5.13 an acre, or 0.64% of total cost, and almost nothing if the job requires experience. For Washington Honeycrisp, where labor is 18% of cost, the state minimum wage caps the cut at $2.69 an hour. On Aug 26 a court found the method unlawful, and the rates in force since Sep 2 could be trued up.
On August 26, a federal judge in Fresno found that the Labor Department's 2025 method for setting H-2A farm wages was unlawful. The judge did not vacate it. The rates stay in force, the department has been told to "promptly produce a new methodology" (Michigan Farm News, Aug 27, 2026), and on September 2 it notified employers that they "may be required to make wage adjustment payments" for work done from that day until new rates are published (DOL OFLC, Sep 2, 2026). The ruling lands in the middle of harvest, and it applies to a program that certified 398,258 positions in fiscal 2025 (AFBF, Jun 23, 2026) and nearly 350,000 at more than 30,600 farms in the first three quarters of fiscal 2026 (DTN, Aug 27, 2026). The rule and the ruling matter very differently depending on what a farm grows. This piece works out how much the rewrite actually moved labor cost per acre, for a Midwest grain farm and for a specialty grower, and how much of that saving is now in question.
1. What changed: survey data out, skill tiers and a housing credit in
What's new: The Adverse Effect Wage Rate (AEWR) is the minimum hourly wage an H-2A employer must offer, advertise and pay, to H-2A workers and to U.S. workers doing the same work. From 1987 to 2025 it came mostly from USDA's Farm Labor Survey (FLS). Two things ended that in late summer 2025. A federal court in Louisiana vacated the 2023 AEWR rule, and USDA announced in late August that it would no longer run the survey, which had been conducted since 1910 and sampled about 18,000 farms (DTN, Sep 2, 2025). The Labor Department answered with an interim final rule, effective October 2, 2025, that made four changes (DOL, 90 FR 47914, Oct 2, 2025):
- Data source. AEWRs now come from the Bureau of Labor Statistics' Occupational Employment and Wage Statistics (OEWS) survey rather than the FLS. OEWS covers farm labor contractors, which the FLS did not survey. Contractors held about 43% of certified H-2A positions in FY2024.
- Two skill levels. Skill Level I, for entry-level jobs that require no formal education or training, is the mean of the lowest third of the state wage distribution. Skill Level II, for jobs that require experience, is the mean of the whole distribution.
- Housing credit. Only for H-2A workers, each rate is reduced by an "Adverse Compensation Adjustment," an hourly value of the free housing the program already requires. It is built from HUD fair market rents for four-bedroom units. The rule's worked example divides the monthly rent by eight occupants and 172 hours a month.
- Separate scales. U.S. workers in corresponding employment are owed the rate before the housing deduction.
Evidence: The first annual update under the rule took effect August 3, 2026, using May 2025 OEWS data, or August 17 for entities covered by the Kansas v. DOL order (DOL, 91 FR 48946, Aug 3, 2026). The table sets it against the last survey-based rates for the five largest H-2A states and three Corn Belt states.
| State | 2025 AEWR (FLS) | 2026-27 U.S. worker, Skill I | Housing credit | 2026-27 H-2A, Skill I | 2026-27 H-2A, Skill II | Change, Skill I | State minimum wage, 2026 |
|---|---|---|---|---|---|---|---|
| Florida | 16.23 | 13.17 | −2.30 | 10.87 | 13.41 | −33.0% | 15.00 from Sep 30† |
| Georgia | 16.08 | 12.57 | −1.77 | 10.80 | 14.72 | −32.8% | 7.25 |
| Washington | 19.82 | 16.93 | −2.44 | 14.49 | 17.18 | −26.9% | 17.13 |
| California | 19.97 | 16.59 | −3.07 | 13.52 | 15.53 | −32.3% | 16.90 |
| North Carolina | 16.16 | 12.84 | −1.69 | 11.15 | 15.13 | −31.0% | 7.25 |
| Michigan | 18.15 | 14.45 | −1.39 | 13.06 | 16.25 | −28.0% | 13.73 |
| Iowa | 18.65 | 14.96 | −1.24 | 13.72 | 18.28 | −26.4% | 7.25 |
| Illinois | 19.57 | 15.81 | −1.80 | 14.01 | 16.95 | −28.4% | 15.00 |
Source: DOL, AEWR notice, Dec 16, 2024 (2025 rates); DOL OFLC, 2026-2027 AEWR spreadsheet, effective Aug 3, 2026; Paycor state minimum wage table, updated Dec 4, 2025. All figures $/hour. The change column compares the H-2A Skill I rate with the 2025 AEWR. The wage owed is the highest of the AEWR, any applicable state minimum wage, a prevailing wage or a collective-bargaining wage, so the state minimum sets the real floor wherever it is higher and covers the farm work in question. †Florida's $15.00 minimum takes effect Sep 30, 2026; the rate before that date is lower. Coverage of agricultural employment under state minimum-wage laws varies by state; check it before relying on the last column.
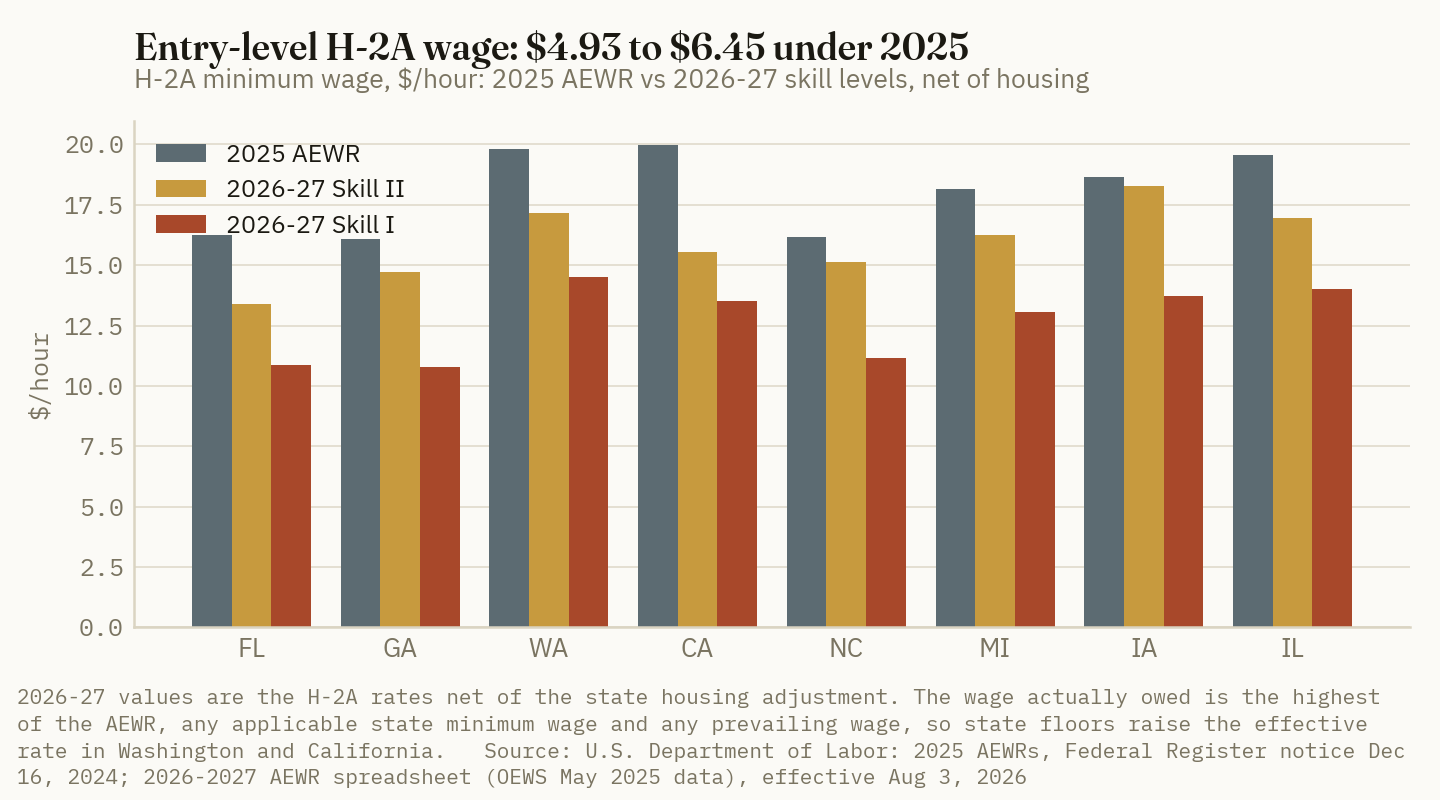
Two numbers put the cut in national terms. The simple average of the 2025 survey-based AEWRs was $17.74 (DOL, Dec 16, 2024). The 2026-27 average across both skill levels, before the housing credit, is $15.96 (DOL, Aug 3, 2026). The average H-2A Skill Level I rate after the credit is $12.31, up 3.5% from $11.89 in the rule's first year (AFBF, Aug 6, 2026). For a benchmark with no program design in it, the last FLS put the 2024 annual average field-and-livestock wage at $18.12 an hour (USDA NASS, Nov 20, 2024).
Ground Truth: The wage an employer owes now depends on two things written into the job order: the qualifications it requires and whether the worker is H-2A. In Iowa the gap between Skill Level I and Skill Level II is $4.56 an hour. That makes the job description the biggest single labor-cost decision a grain farm makes this year. It is also the item most exposed if the next method, or a Wage and Hour investigator, reads the job differently from the employer.
2. Evidence: demand never waited for the cut
What's new: H-2A use kept growing under the higher survey-based rates, and it kept growing after the cut. Certifications reached 254,688 positions in the first half of fiscal 2026. The second quarter alone, January to March, certified about 192,000 (AFBF, Jun 23, 2026).
Evidence: From FY2020 to FY2023, the program added more than 100,000 positions while the national average AEWR rose almost 19% (DOL OFLC, FY2023 Q4; Nigh, AFBF, Dec 7, 2023). Florida, California, Georgia, Washington and North Carolina made up about half of all FY2023 positions. Crop farmworkers accounted for 84.5% of certifications. Agricultural equipment operators, the job title that covers the Midwest harvest hire, accounted for 7.4%, or 28,027 positions (DOL OFLC, FY2023 Q4).
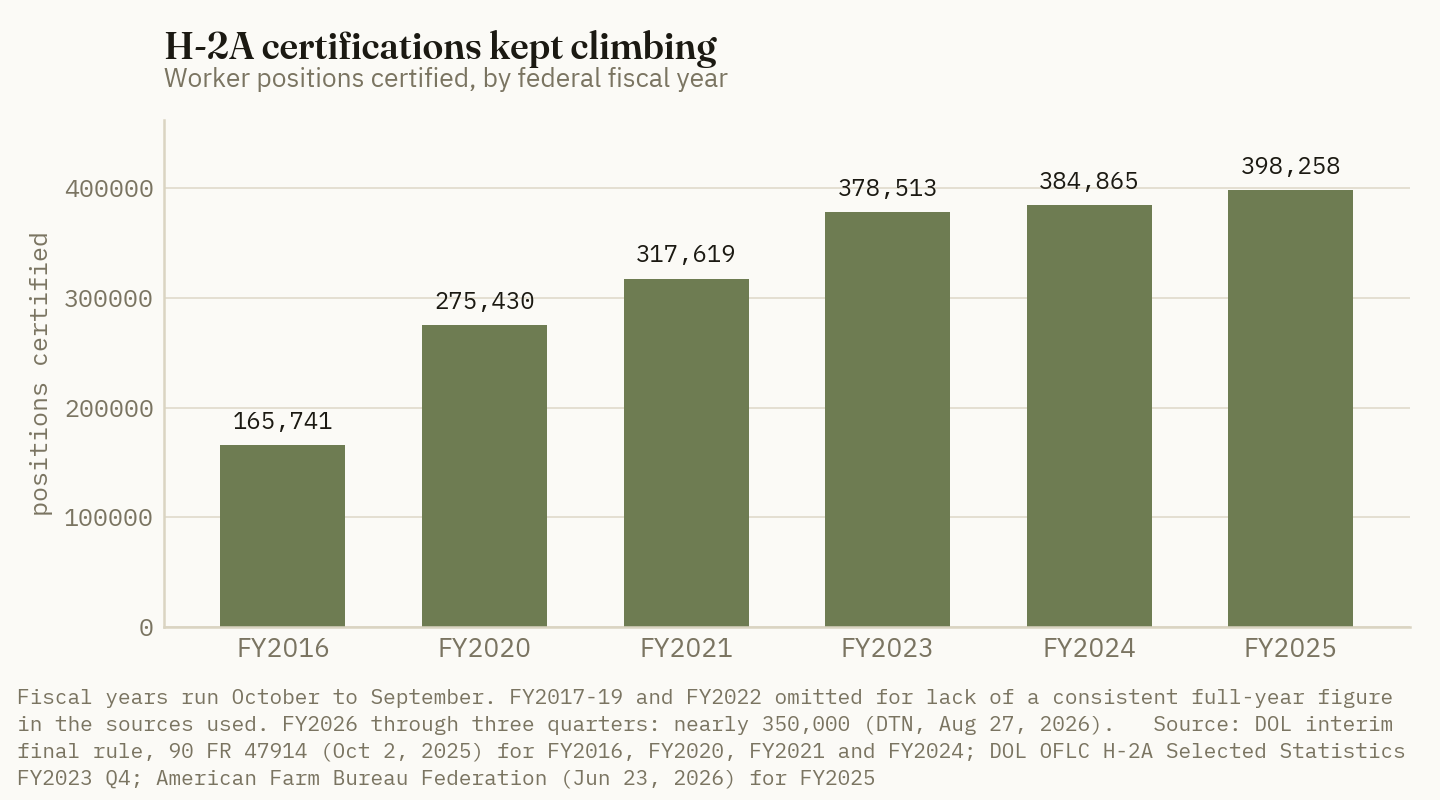
The rule's own economic analysis shows where the money moves. For 2026, the department projected about $878 million in housing-credit transfers and $848 million in skill-level wage transfers from workers to employers, about $1.73 billion in total, over an estimated 395,996 certified workers. It assumed each worker puts in 40 hours a week for 26 weeks, and that 92% of positions would be paid at the entry level (DOL, 90 FR 47914, Oct 2, 2025). Annualized over ten years, that is $2.46 billion at a 7% discount rate.
Ground Truth: A program that grew 45% from FY2020 to FY2025 while its wage floor rose was not being held back by price. That is close to what the Fresno judge wrote: cutting wages "is not economically rational" without evidence that farmers were being priced out (DTN, Aug 27, 2026). Whatever the next method is, growers should expect it to be defended on the record, not written to lower cost. Budget as if the 2026-27 Skill Level I rate is a low point, not a new baseline.
3. Row crops: labor is a small line, and the rule barely moved it
What's new: Iowa State's 2026 budgets carry labor at $20.40 an hour, treated as a fixed cost because most labor on Iowa farms is supplied by the operator, family or permanent hired help. The budgets allow 2.55 hours an acre for corn after soybeans, 2.80 for corn after corn and 2.20 for soybeans (ISU Ag Decision Maker A1-20, Jan 2026).
Evidence: Labor is under 7% of total cost for grain and nearly a fifth for an apple orchard at full production.
| Crop and system | Labor $/acre | Total cost $/acre | Labor share | |
|---|---|---|---|---|
| Iowa soybeans after corn, 61 bu | 44.88 | 679.11 | 6.6% | ███ |
| Iowa corn after soybeans, 211 bu | 52.02 | 911.98 | 5.7% | ███ |
| Iowa corn after corn, 193 bu | 57.12 | 960.02 | 5.9% | ███ |
| Washington Honeycrisp, angled V, full production | 9,315 | 50,592 | 18.4% | ██████████ |
Sources: ISU Ag Decision Maker A1-20, Jan 2026 (mid yield level); WSU TB106E, 2024 Honeycrisp budget, published 2025, Tables 2.1 and 4.1. Honeycrisp labor is Crop Root Zone's sum of pruning and training, thinning, irrigation labor, frost-protection labor, general farm labor, picking labor and other labor (checkers, tractor drivers, supervisors). Warehouse packing charges and hauling are excluded. Bars scale labor share. Per acre, the Honeycrisp labor bill is about 179 times the corn-after-soybeans figure.
To size the rule for a grain farm that hires seasonal help, Crop Root Zone modeled a 2,000-acre Iowa corn-soybean operation bringing in two H-2A workers for planting and harvest. Each works 1,040 hours, the 40-hours-for-26-weeks assumption the Labor Department used in its own analysis. The farm is an illustration, not a survey average.
| Wage basis, Iowa | $/hour | Seasonal wage bill | $/acre | vs 2025 AEWR, $/acre | Share of ISU avg. cost |
|---|---|---|---|---|---|
| 2025 AEWR (FLS) | 18.65 | 38,792* | 19.40* | — | — |
| 2025-26 H-2A Skill I (first IFR year) | 13.05 | 27,144* | 13.57* | −5.82* | −0.73%* |
| 2026-27 H-2A Skill II | 18.28 | 38,022* | 19.01* | −0.38* | −0.05%* |
| 2026-27 H-2A Skill I | 13.72 | 28,538* | 14.27* | −5.13* | −0.64%* |
Source: DOL AEWR notices (Dec 16, 2024; Aug 3, 2026) and 2025-2026 AEWR spreadsheet; ISU Ag Decision Maker A1-20, Jan 2026. *Crop Root Zone estimate: 2,080 hours over 2,000 acres. The ISU average cost of $795.55/acre is the simple mean of corn after soybeans ($911.98) and soybeans after corn ($679.11). Wages only. Housing, transport, visa and recruiting costs are excluded; Washington State University's budget puts those H-2A fixed costs at $4.50 an hour, which would add about $4.68 an acre here.
$5.13 an acre
Estimated 2026-27 saving for an Iowa corn-soybean farm paying two seasonal H-2A hires the entry-level rate instead of the 2025 AEWR. That is 0.64% of total cost, or about 1.1 bushels at USDA's $4.80 corn price. (Crop Root Zone estimate from DOL and ISU data; price from USDA WASDE via High Plains Journal, Sep 14, 2026)
The catch is in the job order. A seasonal hire who runs a combine, a grain cart or a semi at a Corn Belt harvest is usually asked for experience. At Skill Level II, Iowa's H-2A rate is $18.28, only 37 cents under 2025. On this farm, the rule is worth 38 cents an acre.
Ground Truth: For a Midwest grain operation, the new rule's value sits between rounding error and one bushel an acre, and which end applies is set by what the job order requires. That is too little to justify writing entry-level qualifications for an equipment-operator job that plainly needs experience. The savings are small and the misclassification risk is not. Across both skill levels, H-2A seasonal labor at 2026-27 rates, plus housing and travel, still costs this grain farm about $19 to $24 an acre (Crop Root Zone estimate), roughly a quarter of the $84 an acre Iowa State budgets for nitrogen on corn after soybeans.
4. Specialty crops: bigger dollars, and a state floor in the way
What's new: Washington State University's Honeycrisp budget builds its hand-labor rate from the AEWR directly: $23.75 an hour, equal to Washington's 2024 AEWR of $19.25 plus $4.50 an hour of H-2A fixed cost. Machine and irrigation labor is $27.79, and picking is paid by piece at $62 a bin, with another $11 a bin for checkers, tractor drivers and supervisors (WSU TB106E, 2024 budget).
Evidence: At full production on an angled-V trellis, the budget's hourly-paid lines imply about 128 hours an acre: 115 hours of pruning, training and thinning and 13 of irrigation labor (Crop Root Zone calculation from $2,731 at $23.75 and $361 at $27.79). Washington's 2026-27 H-2A Skill I rate, $14.49, sits below the state's $17.13 minimum wage, so the minimum wage is the floor that binds. The Skill II rate, $17.18, is 5 cents higher. Either way, the drop from the 2025 AEWR of $19.82 is about $2.64 to $2.69 an hour, or 13.3% to 13.6%. The rule's headline cut of $5.33 at Skill I does not reach this orchard.
| Honeycrisp scenario, per acre at full production | $/acre | Share of total cost $50,592 | |
|---|---|---|---|
| Hourly labor, 128 h at −$2.69 (floor $19.82 → $17.13) | −345* | −0.68%* | ███ |
| Piece-rate picking and crew ($5,913) if rates fall 13.6% with the floor | −803* | −1.59%* | ███████ |
| Combined upper case | −1,148* | −2.27%* | ██████████ |
| For scale: 26-acre budget block, upper case | −29,850* | — |
Sources: WSU TB106E, 2024 Honeycrisp budget, Tables 2.1 and 4.1; DOL AEWRs (Dec 16, 2024; Aug 3, 2026); Paycor state minimum wage table, Dec 4, 2025. *Crop Root Zone estimate. Holds the machine-labor and fixed-cost premiums constant in dollars. Harvest piece rates in Washington are set by competition for pickers and did not fall automatically with the AEWR, so the upper case is a ceiling, not a forecast. Bars scale absolute dollars.
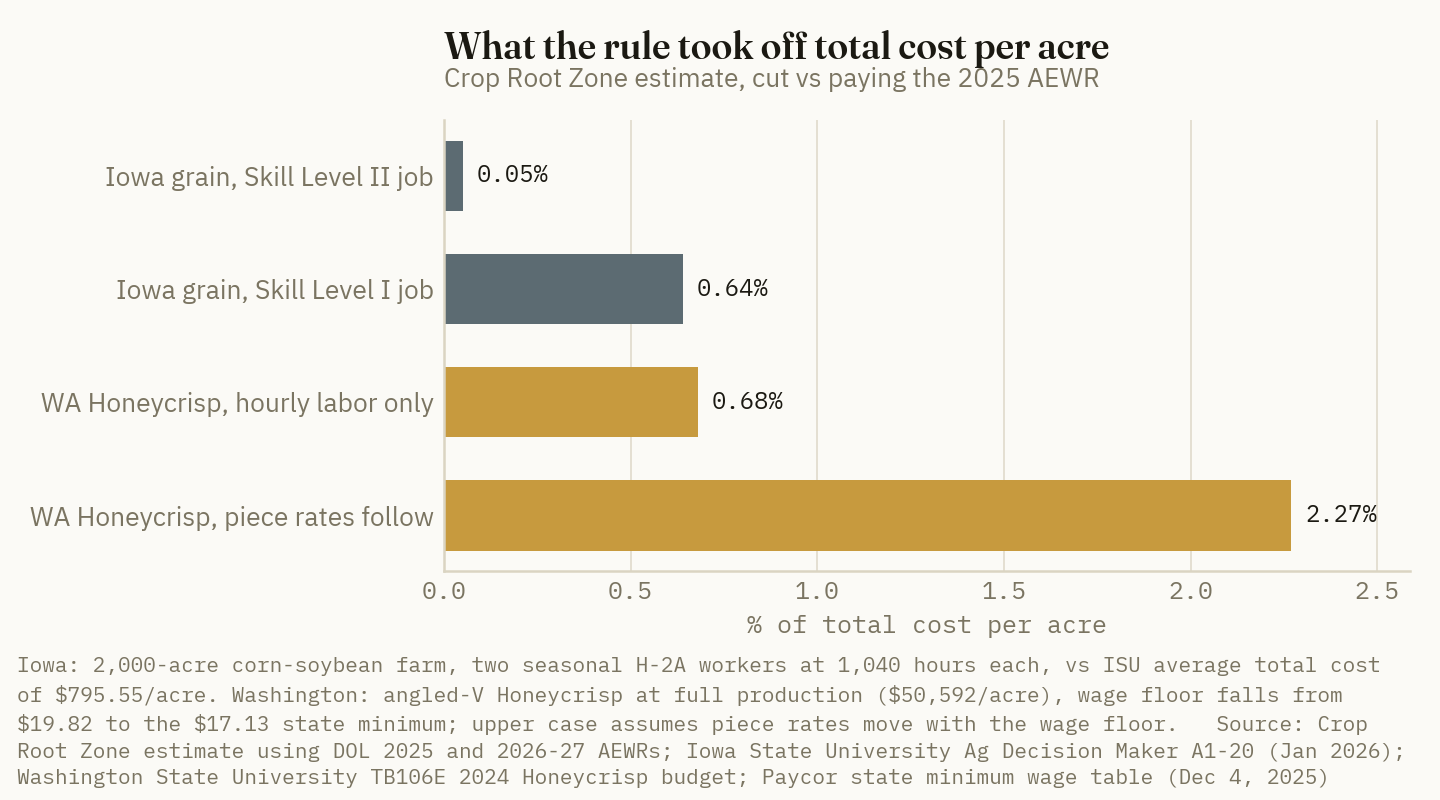
Growers in states with no high state floor saw the full cut. Georgia's entry-level H-2A rate fell $5.28 an hour, to $10.80, and North Carolina's fell $5.01, to $11.15. Neither state has a minimum above the federal $7.25. For a vegetable crew working 10,000 hours in a season, $5.28 an hour is $52,800 (Crop Root Zone arithmetic). California's $16.90 minimum wage holds both skill levels there to a $3.07 cut from the 2025 rate.
Ground Truth: The rule saves the most where labor matters least to state policy: the Southeast, where H-2A work is concentrated and state wage floors are low. In Washington and California, where specialty labor bills are largest, state minimum wages absorb about half the cut. A Honeycrisp grower's real saving is the $345 an acre on hourly work. Treat the piece-rate case as an upside that pickers did not agree to.
5. The backpay window, and what to do before new rates arrive
What's new: The Eastern District of California found all four pillars of the rule arbitrary and capricious: the skill tiers, the housing credit, the use of OEWS data and the "greater than 50%" test for classifying occupations. It faulted the tier design for pushing an estimated 92% of jobs into the lower tier, and the housing credit for conflicting with the rule that H-2A housing be provided at no cost (Fisher Phillips, Aug 27, 2026; United Farm Workers v. DOL, No. 25-cv-01614; DOL OFLC, Sep 2, 2026). The court required a status report within two weeks (Michigan Farm News, Aug 27, 2026). The department says "no employer is under an obligation at this time to pay any back wages." It has asked employers to keep contact and identity records for H-2A workers and corresponding U.S. workers. The National Council of Agricultural Employers called the ruling an "existential threat," and the United Farm Workers welcomed it (DTN, Aug 27, 2026).
Evidence: Nobody knows the new rates yet, so any exposure figure is a scenario. If a replacement method put Iowa back at its 2025 rate, the Iowa farm above would owe $4.93 an hour on the Skill I hours worked after September 2. If half its 2,080 seasonal hours fall in fall harvest, that is about $5,130, or $2.56 an acre (Crop Root Zone illustration). For the Washington orchard, the exposure falls mainly on hourly work and on any piece-rate earner whose pay averaged below a restored floor.
| Grower | Rule's saving at 2026-27 rates | Share of total cost | Illustrative backpay exposure after Sep 2 |
|---|---|---|---|
| Iowa grain, Skill I seasonal hires | $5.13/acre* | 0.64%* | about $2.56/acre if 2025 rates return* |
| Iowa grain, Skill II seasonal hires | $0.38/acre* | 0.05%* | small |
| Washington Honeycrisp, hourly labor | $345/acre* | 0.68%* | up to $2.69 per hourly hour worked* |
| Georgia or North Carolina entry-level crews | $5.01–$5.28/hour | not modeled | up to that gap per hour* |
Source: Crop Root Zone estimates from sections 3 and 4; DOL OFLC, Sep 2, 2026. *Estimate. Actual exposure depends on the rates a new method produces, which are unknown.
Ground Truth: Treat every dollar saved since September 2 as a liability, not income. The window opened just as corn and soybean harvest and apple picking began, the heaviest hours of the year for seasonal crews. For a grain farm the reserve is small, a couple of dollars an acre, and the paperwork costs more than the money. For a Southeast vegetable or Washington tree-fruit operation it can run to five figures. Three steps are cheap now and expensive later: keep full worker contact records, as the department asked; book a reserve for the gap between what you pay and the 2025 AEWR; and don't lower 2027 piece rates or job-order wages on the assumption that the 2026-27 Skill I number survives. Congress could settle it: the Securing Agriculture's Workforce Act would write an AEWR method into law. Until then, the grower who reserved for a reversal is the one without a surprise when new rates come out.
References
- U.S. Department of Labor, Office of Foreign Labor Certification, "OFLC Announces Updates to Implementation of the H-2A Adverse Effect Wage Rate Methodology for Non-Range Occupations Interim Final Rule; Compliance with District Court Order," Sep 2, 2026 — https://flag.dol.gov/announcement/2026-09-02
- Castillo, C., "H-2A Program Usage Continues to Accelerate," American Farm Bureau Federation Market Intel, Jun 23, 2026 — https://www.fb.org/intel/markets/h-2a-program-usage-continues-to-accelerate
- DTN/Progressive Farmer, Washington Insider, "Trump Administration's H-2A Farmworker Wage Rule Struck Down by Federal Judge," Aug 27, 2026 — https://www.dtnpf.com/agriculture/web/ag/columns/washington-insider/article/2026/08/27/trump-administrations-h-2a-wage-rule
- DTN/Progressive Farmer, Washington Insider, "USDA Wants to End Farm Labor Survey," Sep 2, 2025 — https://www.dtnpf.com/agriculture/web/ag/columns/washington-insider/article/2025/09/02/amid-fight-h-2a-wages-trump-moves
- U.S. Department of Labor, Employment and Training Administration, "Adverse Effect Wage Rate Methodology for the Temporary Employment of H-2A Nonimmigrants in Non-Range Occupations in the United States," interim final rule, 90 FR 47914, Oct 2, 2025 — https://www.federalregister.gov/documents/2025/10/02/2025-19365
- U.S. Department of Labor, Employment and Training Administration, "Labor Certification Process for the Temporary Employment of Foreign Workers in Agriculture in the United States: Adverse Effect Wage Rate Updates for Non-Range Occupations," 91 FR 48946, Aug 3, 2026 — https://www.federalregister.gov/documents/2026/08/03/2026-15673
- U.S. Department of Labor, Employment and Training Administration, "Labor Certification Process for the Temporary Employment of Foreign Workers in Agriculture in the United States: Adverse Effect Wage Rates for Non-Range Occupations" (2025 FLS-based AEWRs), FR Doc. 2024-29549, Dec 16, 2024 — https://www.federalregister.gov/documents/2024/12/16/2024-29549
- U.S. Department of Labor, Office of Foreign Labor Certification, "2026-2027 AEWRs" spreadsheet (field and livestock workers, Skill Levels I and II, H-2A Adverse Compensation Adjustment), Aug 2026 — https://flag.dol.gov/sites/default/files/2026-08/DOL-OFLC_2026-2027_AEWRs_FINAL_valuesonly.xlsx
- U.S. Department of Labor, Office of Foreign Labor Certification, "2025-2026 AEWRs" spreadsheet (Oct 2, 2025–Aug 2, 2026), Nov 2025 — https://flag.dol.gov/sites/default/files/2025-11/DOL-OFLC_2025-2026_AEWRs_FINAL.xlsx
- Paycor, "Minimum Wage Rate by State in the U.S. [2026]," updated Dec 4, 2025 — https://www.paycor.com/resource-center/articles/minimum-wage-by-state/
- Castillo, C., "AEWR Changes for 2026-2027," American Farm Bureau Federation Market Intel, Aug 6, 2026 — https://www.fb.org/intel/markets/aewr-changes-for-2026-2027
- USDA National Agricultural Statistics Service, "Farm Labor," Nov 20, 2024 — https://esmis.nal.usda.gov/sites/default/release-files/x920fw89s/pn89g082z/05743k75q/fmla1124.pdf
- U.S. Department of Labor, Office of Foreign Labor Certification, "H-2A Temporary Agricultural Program – Selected Statistics, Fiscal Year 2023" (data as of Sep 30, 2023) — https://www.dol.gov/sites/dolgov/files/ETA/oflc/pdfs/H-2A_Selected_Statistics_FY2023_Q4.pdf
- Nigh, V., "H-2A Growth Slows, But Remains Strong," American Farm Bureau Federation Market Intel, Dec 7, 2023 — https://www.fb.org/intel/markets/h-2a-growth-slows-but-remains-strong
- Iowa State University Extension and Outreach, Ag Decision Maker File A1-20, "Estimated Costs of Crop Production in Iowa — 2026," revised Jan 2026 — https://www.extension.iastate.edu/agdm/crops/pdf/a1-20.pdf
- Washington State University Extension, TB106E, "2024 Cost and Return Estimates of Establishing, Producing, and Packing Honeycrisp Apples in Washington State," published 2025 — https://wpcdn.web.wsu.edu/cahnrs/uploads/sites/5/TB106E_2024-Honeycrisp-Enterprise-Budget.pdf
- High Plains Journal, "USDA lowers corn production forecast, raises soybean price outlook" (September 11 WASDE), Sep 14, 2026 — https://hpj.com/2026/09/14/wasde-report-sept-11/
- Michigan Farm News, "H-2A wages plunged into limbo by California judge's ruling," Aug 27, 2026 — https://www.michiganfarmnews.com/about/news-media/h-2a-wages-plunged-limbo-california-judges-ruling
- Fisher Phillips, "New H-2A Adverse Effect Wage Rates Up in Air as Court Orders DOL to Try Again: What Agricultural Employers Need to Know," Aug 27, 2026 — https://www.fisherphillips.com/en/insights/insights/new-h-2a-adverse-effect-wage-rates-up-in-air-as-court-orders-dol-to-try-again
Disclosures
Crop Root Zone is an independent publication. Nothing here is investment advice. Market calls, where included, reflect the editors' own read and are not a recommendation to buy or sell any security.
A Quarter-Point Rate Move Is Worth About $1 an Acre on a 2027 Illinois Corn Crop. The Budget Projects a $36 Profit.
Midwest farm operating loans averaged 7.12% at the end of June, 135 basis points below mid-2024 but no longer falling. Financing the $579 of direct costs in farmdoc's 2027 central Illinois corn budget from a fall fertilizer draw to a November 2027 payoff costs about $28.60 an acre at that rate, and each 25 bp adds or removes about $1.00 — roughly 3% of the projected $36 farmer return. The Fed's Sept. 16 decision was pending at writing, but rates, loan demand and bank liquidity were already moving against borrowers.
Seventh District agricultural lenders reported an average rate of 7.12% on new farm operating loans at the end of June, up from 7.08% three months earlier (Federal Reserve Bank of Chicago, Aug 2026). It is a four-basis-point move and would not matter on its own. What matters is when it came. It was the first quarterly increase in that series since at least mid-2024, and it came while the federal funds target sat unchanged at 3.50% to 3.75%. The Federal Open Market Committee ends its Sept. 15–16 meeting this afternoon. At writing its statement had not been published, and futures traders put the chance of a 25-basis-point increase at 92.5% (Fox Business, Sep 15, 2026). This piece does not forecast the decision. It measures what farm borrowing costs going into harvest and 2027 input purchases, and what a quarter point either way does to a corn acre. On farmdoc's 2027 central Illinois budget, the answer is about a dollar an acre, against a projected farmer return of $36 (farmdoc daily, Sep 1, 2026).
1. Farm loan rates had already stopped falling
What's new: Three Federal Reserve district surveys covering the first half of 2026 show the same thing. Farm loan rates are well below their 2024 levels, but they stopped falling after the Fed's last cut in December 2025.
Evidence: The Chicago Fed's series (Illinois, Indiana, Iowa, Michigan and Wisconsin) shows the flattening most clearly. Operating loan rates fell 136 basis points from mid-2024 to the end of 2025, then moved sideways at about 7.1% for three quarters. Real estate loan rates found their low in the fourth quarter of 2025 at 6.63% and have risen in both quarters since, to 6.79% (Federal Reserve Bank of Chicago, Feb 2026; Aug 2026).
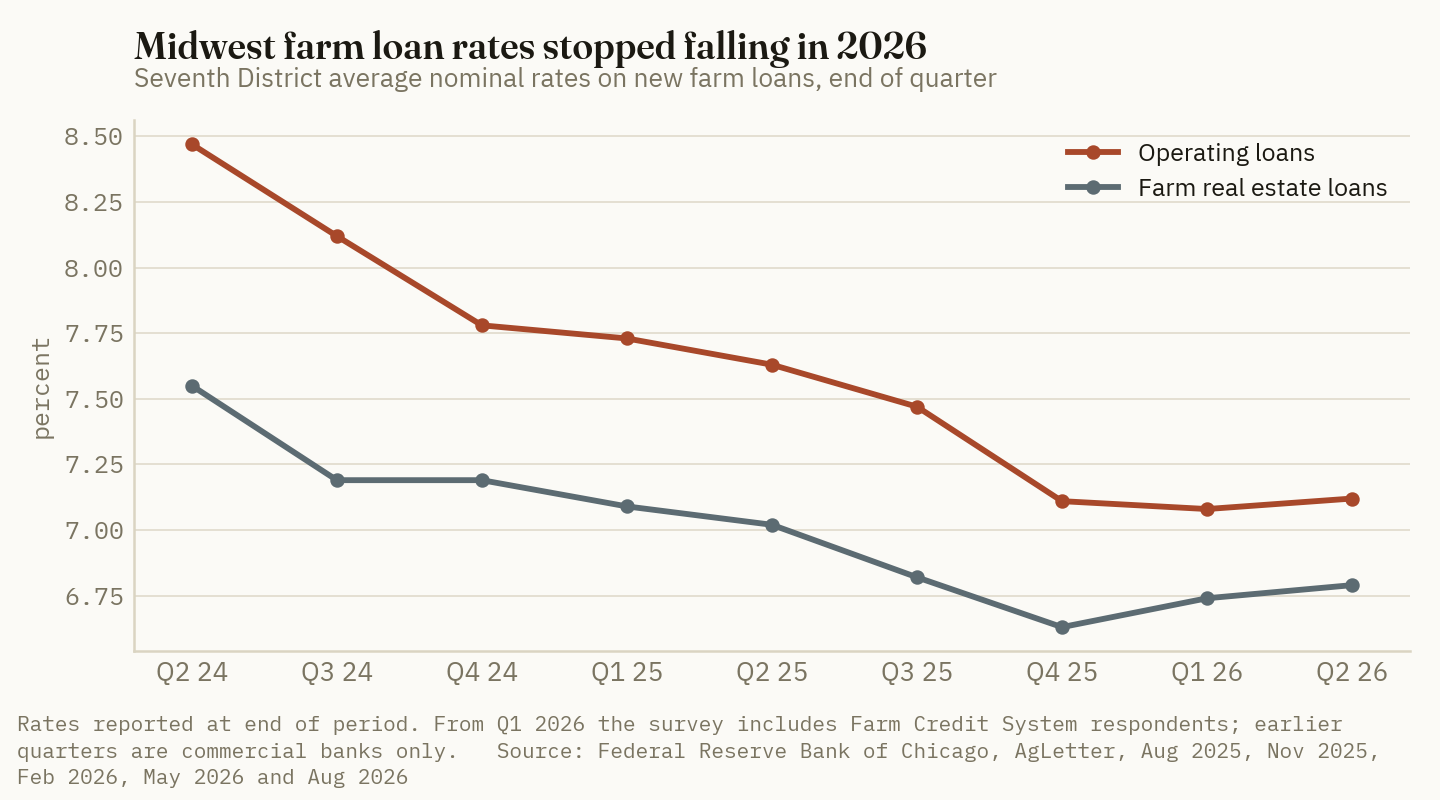
The other districts agree. In the Kansas City Fed's Tenth District survey (Colorado, Kansas, Nebraska, Oklahoma, Wyoming, northern New Mexico and western Missouri), the average rate on all major types of farm loans was nearly unchanged from the first quarter. Rates were 50 basis points below a year earlier and 120 basis points below the same point in 2024, but still slightly above their 20-year average (Federal Reserve Bank of Kansas City, Aug 14, 2026). In the Minneapolis Fed's Ninth District, the April survey put the fixed operating rate at 7.4%, the same as in January, and the fixed real estate rate at 6.8%; the bank described rates on most loan categories as up slightly (Federal Reserve Bank of Minneapolis, May 18, 2026). St. Louis district lenders, who cover southern Illinois, reported a 7.2% average fixed operating rate for the first quarter, against 7.1% in Chicago (farmdoc daily, Jun 12, 2026).
| District survey | Latest quarter | Operating rate | Real estate rate | Operating, a year earlier | Change, bp |
|---|---|---|---|---|---|
| Chicago (Seventh), avg nominal | Q2 2026 | 7.12% | 6.79% | 7.63% | −51 |
| Minneapolis (Ninth), fixed | Q1 2026 | 7.4% | 6.8% | 7.9% | −50 |
| St. Louis (Eighth), fixed | Q1 2026 | 7.2% | 7.1% | 7.9% | −70 |
| Kansas City (Tenth), all major types | Q2 2026 | Not stated in text | Not stated in text | — | about −50 |
Sources: Federal Reserve Bank of Chicago, AgLetter, Aug 2026 (rates at end of period); Federal Reserve Bank of Minneapolis, May 18, 2026 (April survey); farmdoc daily, Jun 12, 2026 (St. Louis district figures, rounded to one decimal); Federal Reserve Bank of Kansas City, Aug 14, 2026. Kansas City change is the survey's description of all major loan types, not an operating-loan figure. Minneapolis and St. Louis Q2 2026 results had not been published in a form this desk could read at writing.
The Chicago series has a break worth noting. From the first quarter of 2026 the survey includes Farm Credit System respondents; earlier quarters are commercial banks only (Federal Reserve Bank of Chicago, Aug 2026). Part of the flattening could reflect the change in who answers the survey. It does not explain the Minneapolis and Kansas City readings, which show the same pattern.
Ground Truth: Borrowers who waited through 2025 for cheaper money got it: an operating line priced in mid-2024 cost about 135 basis points more than one priced this summer. That tailwind ended in January. For 2027 input budgets, the working baseline is today's ~7.1%, not an extension of 2025's decline. Section 4 prices each quarter point either side of it.
2. The Fed decision was pending; the hold in July was not unanimous
What's new: The FOMC held its target range at 3.50% to 3.75% on July 29, but three voting members, Beth Hammack, Neel Kashkari and Lorie Logan, dissented in favor of a quarter-point increase (Federal Reserve Board, Jul 29, 2026). The Sept. 16 statement was not out when this piece was written.
Evidence: The July statement said inflation "remains elevated" relative to the 2% goal, partly because of supply shocks in sectors including energy (Federal Reserve Board, Jul 29, 2026). Consumer prices rose 3.4% in the year to August, and the PCE price index was up 3.7% in the year to July (Fox Business, Sep 15, 2026, citing government data). On Sept. 15 the CME FedWatch tool implied a 92.5% probability of a 25-basis-point increase to 3.75%–4.00%, and a 49.7% chance of two increases by year-end (Fox Business, Sep 15, 2026). The last change was the Dec. 10, 2025 cut to the current range (Federal Reserve Board, Dec 10, 2025). The bank prime rate, a common index for variable-rate lines, has been 6.75% since then, and the prime rate is conventionally set at the federal funds upper bound plus three points (FedPrimeRate.com, Jul 29, 2026).
The more useful question for a borrower is how much of a Fed move reaches a farm loan. The easing cycle gives a guide. At mid-2024 the target range was 5.25% to 5.50%, before the Sept. 18, 2024 cut (Federal Reserve Board, Sep 18, 2024).
| Rate | Mid-2024 | Mid-2026 | Change, bp | Share of the 175 bp policy move |
|---|---|---|---|---|
| Fed funds target, upper bound | 5.50% | 3.75% | −175 | 100% |
| Prime rate (upper bound + 3 points) | 8.50%* | 6.75% | −175 | 100% |
| Chicago Fed, farm operating loans | 8.47% | 7.12% | −135 | 77% |
| Minneapolis Fed, fixed operating (Q2 2024 to Q1 2026) | 8.8% | 7.4% | −140 | 80% |
| Chicago Fed, farm real estate loans | 7.55% | 6.79% | −76 | 43% |
Sources: Federal Reserve Board, Sep 18, 2024 and Dec 10, 2025 (target ranges); FedPrimeRate.com, Jul 29, 2026 (prime rate and its link to the target range); Federal Reserve Bank of Chicago, AgLetter, Aug 2025 and Aug 2026 (Q2 2024 and Q2 2026, end of period); Federal Reserve Bank of Minneapolis, May 18, 2026. *Mid-2024 prime derived from the stated relationship. Pass-through shares are Crop Root Zone calculations and describe one cycle, not a fixed rule.
Operating loans passed through roughly three-quarters to four-fifths of the policy move. Real estate loans passed through less than half, which fits their dependence on longer-term rates rather than the overnight rate. USDA's own direct lending rates show the longer end moving without the Fed. The Farm Service Agency's direct operating loan rate was 4.625% in January, 5.000% in June and 5.250% in September, a 62.5-basis-point rise over a period in which the Fed did nothing (USDA FSA, Jan 2, 2026; Jun 1, 2026; Sep 1, 2026). A year ago it was 4.875% (USDA FSA, Sep 2, 2025).
Ground Truth: If the last cycle is a guide, a 25-basis-point Fed increase would reach the average farm operating loan at about 19 to 20 basis points and reach a prime-indexed variable line in full. The distinction matters more this fall than usual, because FSA's rate shows market rates rising ahead of the Fed. Borrowers who fix a rate for 2027 inputs are already paying for part of any increase. Borrowers who float will pay the full move when and if it happens.
3. Demand is up, repayment is down, and banks are running out of room
What's new: The rate is only one price of credit. The Chicago Fed's second-quarter survey shows lenders tightening on everything else too. The district's loan-to-deposit ratio reached 80.7%, the highest since the data began in the 1970s (Federal Reserve Bank of Chicago, Aug 2026).
Evidence: The diffusion indexes compare each quarter with the same quarter a year earlier; 100 means no change.
| Seventh District index | Q2 2025 | Q1 2026 | Q2 2026 | Read | |
|---|---|---|---|---|---|
| Demand for non-real-estate loans | 121 | 141 | 111 | ████████░░ |
Higher than a year ago |
| Loan renewals and extensions | 135 | 136 | 124 | █████████░ |
More than a year ago |
| Funds availability | 90 | 90 | 90 | ██████░░░░ |
Less than a year ago |
| Loan repayment rates | 71 | 63 | 73 | █████░░░░░ |
Worse than a year ago |
| Loan-to-deposit ratio, % | 78.1 | 79.8 | 80.7 | — | Record high |
Source: Federal Reserve Bank of Chicago, AgLetter, Aug 2026 and May 2026. Index = % of lenders reporting "higher" minus % reporting "lower," plus 100. Bars scale each Q2 2026 index against 140 across ten blocks.
No responding Seventh District lender reported better loan repayment than a year earlier; 27% reported worse. The share of farm loans with "major" or "severe" repayment problems was 3.7%, up from 2.9% and the highest since 2020 (Federal Reserve Bank of Chicago, Aug 2026). Collateral requirements were higher than a year earlier. Lenders said Farm Credit System institutions and "merchants, dealers, and other input suppliers" lent more to agriculture than normal in the first half. For the third quarter they expected higher volumes of operating loans, feeder cattle loans and FSA-guaranteed loans than a year ago, and lower volumes of machinery, grain storage and real estate loans (Federal Reserve Bank of Chicago, Aug 2026).
Nationally, the picture is less one-sided. The Kansas City Fed's Survey of Terms of Lending to Farmers showed non-real-estate loan volumes in the second quarter down about 10% from their two-year average, with most loan purposes lower except machinery and equipment, which rose more than 50% from recent years. Average rates were slightly under 7% on loans above $100,000 and slightly over 7% on smaller loans (Federal Reserve Bank of Kansas City, Jul 10, 2026). In the Minneapolis and St. Louis districts, the share of lenders reporting lower repayment rates than a year ago fell from about 50% on average in 2025 to about 30% in the latest survey (Federal Reserve Bank of Kansas City, Aug 26, 2026).
Ground Truth: An 80.7% loan-to-deposit ratio is the constraint to watch, more than the Fed. A community bank within a few points of its desired ratio rations credit by terms, collateral and which borrowers it renews, not only by rate. The first-half shift to Farm Credit and input-supplier financing is what that looks like on the ground. A grower renewing this fall should expect the conversation to be about working capital and collateral first. Supplier financing on fertilizer and seed will look cheaper than it did, and its terms deserve the same scrutiny as a bank line.
4. What the rate does to a 2027 corn acre
What's new: farmdoc's first 2027 Illinois budgets, released Sept. 1, put direct costs for corn on central Illinois high-productivity farmland at $579 an acre, up from $534 projected for 2026. Fertilizer is $263 of that, up from $229 (farmdoc daily, Sep 1, 2026). Those are the dollars an operating line has to carry, and most of them are spent months before the crop is sold.
Evidence: The budget projects a $5.00 corn price, 245 bushels, $1,242 of gross revenue, $885 of non-land costs, $321 of cash rent and a farmer return of $36 an acre. Its non-land interest line is $40, up from $36 in 2025 (farmdoc daily, Sep 1, 2026). To isolate the operating loan, the table below assumes a common draw pattern: half the fertilizer bought for fall application in November 2026, seed prepaid in December, the rest of the inputs drawn through the season, and the whole balance repaid from grain sales at the end of November 2027. The schedule is an assumption, not a farmdoc figure.
| Draw (per acre) | Amount, $ | Months to Nov 2027 payoff | Average-balance $ | Interest at 7.12%, $ |
|---|---|---|---|---|
| Fertilizer, fall half (Nov 2026) | 131.50 | 12 | 131.50 | 9.36 |
| Seed prepay (Dec 2026) | 134.00 | 11 | 122.83 | 8.75 |
| Fertilizer, spring half (Apr 2027) | 131.50 | 7 | 76.71 | 5.46 |
| Pesticides, pre-plant (Apr 2027) | 59.50 | 7 | 34.71 | 2.47 |
| Pesticides, post-emergence (Jun 2027) | 59.50 | 5 | 24.79 | 1.77 |
| Crop insurance premium (Aug 2027) | 35.00 | 3 | 8.75 | 0.62 |
| Drying and storage (Oct 2027) | 28.00 | 1 | 2.33 | 0.17 |
| Total | 579.00 | — | 401.62 | 28.60 |
Crop Root Zone estimate. Direct-cost lines from farmdoc daily, Sep 1, 2026 (2027 central Illinois high-productivity corn; pesticides split evenly). Rate: Seventh District average operating loan rate, Q2 2026 (Federal Reserve Bank of Chicago, Aug 2026). Simple interest; excludes fees, compensating balances and power and overhead costs.
$1.00 an acre
Change in interest on a staged draw of the $579 2027 central Illinois corn direct-cost budget for each 25-basis-point move in the operating rate. About $1,000 per 1,000 corn acres. (Crop Root Zone estimate from farmdoc daily, Sep 1, 2026 and Federal Reserve Bank of Chicago, Aug 2026)
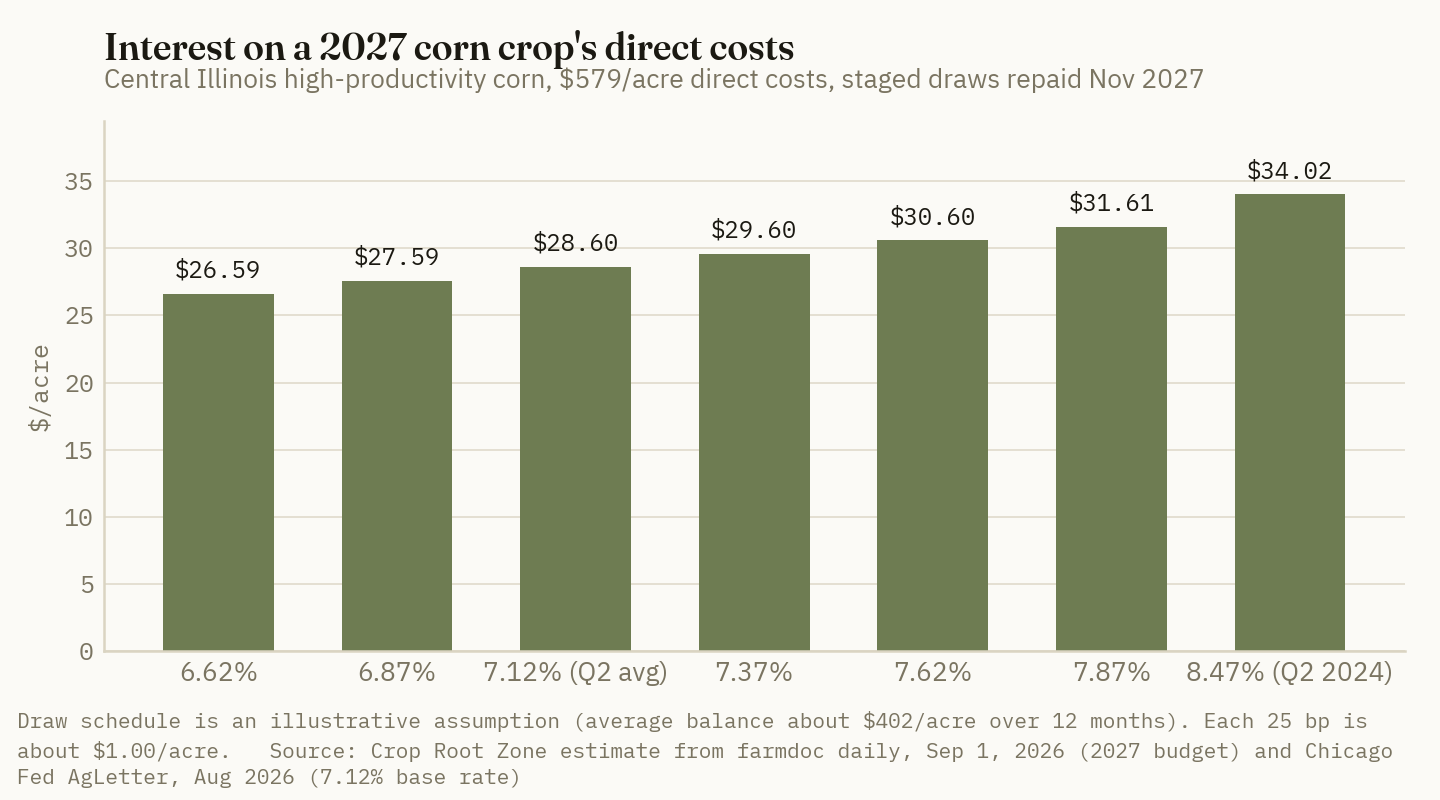
| Operating rate | Staged draws, $/acre | Full $579 for 12 months, $/acre | vs 7.12%, staged | Bushels at $5.00 |
|---|---|---|---|---|
| 6.62% | 26.59 | 38.33 | −2.01 | 5.3 |
| 6.87% | 27.59 | 39.78 | −1.00 | 5.5 |
| 7.12% (Q2 2026 avg) | 28.60 | 41.22 | 0.00 | 5.7 |
| 7.37% | 29.60 | 42.67 | +1.00 | 5.9 |
| 7.62% | 30.60 | 44.12 | +2.01 | 6.1 |
| 7.87% | 31.61 | 45.57 | +3.01 | 6.3 |
| 8.47% (Q2 2024 avg) | 34.02 | 49.04 | +5.42 | 6.8 |
Crop Root Zone estimate. "Full" assumes the entire $579 is outstanding for 12 months, an upper bound. Bushels = staged interest ÷ farmdoc's $5.00 2027 price assumption. Rates other than 7.12% and 8.47% are scenarios, not forecasts.
On the staged schedule, a quarter point is worth $1.00 an acre; with the whole balance out for a year, it is $1.45. Against farmdoc's $36 farmer return, one quarter point is about 3% to 4% of the projected margin. Soybeans need less financing. The same draw timing applied to farmdoc's $256 of soybean direct costs puts interest near $12.64 an acre at 7.12%, and each quarter point at about $0.44 (Crop Root Zone estimate from farmdoc daily, Sep 1, 2026).
Ground Truth: The rate is a small lever and the fertilizer bill is a big one. The $34 rise in budgeted 2027 corn fertilizer equals about 34 quarter-point rate moves on this schedule. The sensitivity that matters is timing: a November fertilizer draw carries interest for 12 months and an April draw for seven, so the fall-versus-spring decision now carries a financing cost of roughly $3.90 an acre on half the fertilizer at 7.12%. That is not enough to decide the question alone. It is enough to include when comparing a fall prepay discount with a spring price.
5. Where the cheaper money is, and what to watch
What's new: The spread between the cheapest and the average farm credit is wide. FSA's direct operating rate for September is 5.25% and its commodity loan rate 5.00% (USDA FSA, Sep 1, 2026), against 7.12% for the average Seventh District operating loan.
Evidence: Applying the 187-basis-point gap between FSA direct operating credit and the Chicago average to the staged corn schedule is worth about $7.51 an acre (Crop Root Zone estimate). FSA direct credit is limited by eligibility and loan limits, and most Corn Belt acres will not be financed that way. The gap still shows how much of a farm loan's price reflects the lender's funding, risk and liquidity rather than the Fed. The CCC commodity loan rate matters for a different reason this fall. Farmdoc's authors say pricing more than the usual share of the 2026 crop at harvest "may be warranted" after the recent price rise (farmdoc daily, Sep 1, 2026). A grower who stores instead of selling is carrying both the grain and the operating balance.
| Credit | Rate | Date | Basis |
|---|---|---|---|
| CCC commodity loan (under one year) | 5.000% | Sep 2026 | USDA, marketing loan on stored grain |
| FSA direct farm operating loan | 5.250% | Sep 2026 | USDA direct, eligibility limits |
| FSA direct farm ownership loan | 6.000% | Sep 2026 | USDA direct, eligibility limits |
| Bank prime rate | 6.75% | Since Dec 2025 | Index for many variable lines |
| Seventh District farm real estate loans | 6.79% | End Q2 2026 | Bank and FCS survey average |
| Tenth District loans over $100,000 | slightly under 7% | Q2 2026 | Commercial bank terms survey |
| Seventh District farm operating loans | 7.12% | End Q2 2026 | Bank and FCS survey average |
| Ninth District fixed operating loans | 7.4% | Apr 2026 survey | Commercial bank survey |
Sources: USDA FSA, Sep 1, 2026; FedPrimeRate.com, Jul 29, 2026; Federal Reserve Bank of Chicago, AgLetter, Aug 2026; Federal Reserve Bank of Kansas City, Jul 10, 2026; Federal Reserve Bank of Minneapolis, May 18, 2026. This desk did not find a public posted operating-loan rate for Farm Credit System lenders or Farmer Mac to include.
Four releases will show where 2027 input financing lands. The FOMC statement is due this afternoon. FSA has published each month's lending rates on or about the first business day of the month, so October's should arrive around Oct. 1 (USDA FSA, Sep 1, 2026; Sep 2, 2025). The Chicago Fed's November AgLetter should report rates as of Oct. 1, as last year's did (Federal Reserve Bank of Chicago, Nov 2025), the first reading that covers fall line renewals. The Kansas City Fed's third-quarter credit survey should follow in November if it keeps the timing of this year's releases.
Ground Truth: The number to track in November is not the Fed's but the gap between the Chicago Fed's operating rate and the prime rate. It was 37 basis points at the end of June. If a Fed increase lifts prime by 25 points and the survey average rises by less, lenders are absorbing part of it to keep volume. If the survey average rises by more, lenders are adding a risk and liquidity premium on top. That second case is more consistent with a record loan-to-deposit ratio and falling repayment. Either way, the per-acre stakes of a single Fed decision are modest. What adds up is the cost of the fertilizer the loan is paying for and how long the balance stays out.
References
- Federal Reserve Bank of Chicago, AgLetter, "Second Quarter Midwest Farmland Values Unchanged," Aug 2026 (Q2 2026 survey; 79 respondents) — https://www.chicagofed.org/publications/agletter/2025-2029/august-2026
- Federal Reserve Bank of Chicago, AgLetter, "First Quarter Midwest Farmland Values Up Some from a Year Ago," May 2026 — https://www.chicagofed.org/publications/agletter/2025-2029/may-2026
- Federal Reserve Bank of Chicago, AgLetter, "Midwest Farmland Values Ended 2025 with Solid Growth," Feb 2026 — https://www.chicagofed.org/publications/agletter/2025-2029/february-2026
- Federal Reserve Bank of Chicago, AgLetter, "Midwest Farmland Values Moved Up Modestly in the Third Quarter," Nov 2025 — https://www.chicagofed.org/publications/agletter/2025-2029/november-2025
- Federal Reserve Bank of Chicago, AgLetter, "Midwest Farmland Values Continued to Grow in the Second Quarter," Aug 2025 — https://www.chicagofed.org/publications/agletter/2025-2029/august-2025
- Federal Reserve Bank of Kansas City, Ty Kreitman, "Steady Tightening of Agricultural Credit Conditions Persists," Aug 14, 2026 (Q2 2026 Tenth District survey; 142 respondents) — https://www.kansascityfed.org/agriculture/ag-credit-survey/steady-tightening-of-agricultural-credit-conditions-persists/
- Federal Reserve Bank of Kansas City, "New Farm Loan Originations Ease Slightly," Jul 10, 2026 (Survey of Terms of Lending to Farmers, Q2 2026) — https://www.kansascityfed.org/center-for-agriculture-and-the-economy/agricultural-finance/new-farm-loan-originations-ease-slightly/
- Federal Reserve Bank of Kansas City, Ty Kreitman, "Farm Finance Deterioration Eases Slightly," Aug 26, 2026 — https://www.kansascityfed.org/center-for-agriculture-and-the-economy/agricultural-finance/farm-finance-deterioration-eases-slightly/
- Federal Reserve Bank of Minneapolis, Joe Mahon, "Higher input costs pressure district farmers," May 18, 2026 (Q1 2026 Ag Credit Survey, including rate table Q2-24 to Q1-26) — https://www.minneapolisfed.org/article/2026/higher-input-costs-pressure-district-farmers
- farmdoc daily, G. Mashange, "Agricultural Credit Conditions in Illinois – First Quarter 2026," Jun 12, 2026 — https://farmdocdaily.illinois.edu/2026/06/agricultural-credit-conditions-in-illinois-first-quarter-2026.html
- farmdoc daily, N. Paulson, G. Schnitkey, C. Zulauf and B. Zwilling, "Illinois Crop Budgets for 2027," Sep 1, 2026 (Tables 1 and 2) — https://farmdocdaily.illinois.edu/2026/09/illinois-crop-budgets-for-2027.html
- Board of Governors of the Federal Reserve System, FOMC statement, Jul 29, 2026 — https://www.federalreserve.gov/newsevents/pressreleases/monetary20260729a.htm
- Board of Governors of the Federal Reserve System, FOMC statement, Dec 10, 2025 — https://www.federalreserve.gov/newsevents/pressreleases/monetary20251210a.htm
- Board of Governors of the Federal Reserve System, FOMC statement, Sep 18, 2024 — https://www.federalreserve.gov/newsevents/pressreleases/monetary20240918a.htm
- Fox Business, "Federal Reserve expected to hike interest rates 25 basis points at FOMC meeting," Sep 15, 2026 (CME FedWatch probabilities; August CPI; July PCE) — https://www.foxbusiness.com/economy/stubborn-inflation-sets-stage-federal-reserve-hike-interest-rates
- FedPrimeRate.com, "Fifth FOMC Monetary Policy Meeting of 2026 Adjourned: United States Prime Rate Remains at 6.75%," Jul 29, 2026 — https://primerate.fedprimerate.com/2026/07/USA--Banks--Banking--FOMC--JULY--29--2026--United--States--Prime--Rate--REMAINS--at--6--Point--75--Percent.html
- USDA Farm Service Agency, "USDA Announces September 2026 Lending Rates for Agricultural Producers," Sep 1, 2026 — https://www.fsa.usda.gov/news-events/news/09-01-2026/usda-announces-september-2026-lending-rates-agricultural-producers
- USDA Farm Service Agency, "USDA Announces June 2026 Lending Rates for Agricultural Producers," Jun 1, 2026 — https://www.fsa.usda.gov/news-events/news/06-01-2026/usda-announces-june-2026-lending-rates-agricultural-producers
- USDA Farm Service Agency, "USDA Announces January 2026 Lending Rates for Agricultural Producers," Jan 2, 2026 — https://www.fsa.usda.gov/news-events/news/01-02-2026/usda-announces-january-2026-lending-rates-agricultural-producers
- USDA Farm Service Agency, "USDA Announces September 2025 Lending Rates for Agricultural Producers," Sep 2, 2025 — https://www.fsa.usda.gov/news-events/news/09-02-2025/usda-announces-september-2025-lending-rates-agricultural-producers
Disclosures
Crop Root Zone is an independent publication. Nothing here is investment advice. Market calls, where included, reflect the editors' own read and are not a recommendation to buy or sell any security.
At $1.48 Propane, a Late-September Day of Field Drydown Saves About $4.40 an Acre. By Late October It Saves $1.90, and Above 21% Moisture the Dryer Sets the Harvest Pace.
Iowa farm propane averaged $1.48 a gallon on September 18, which puts owned-dryer energy near 2.8 cents per bushel-point. At extension drydown rates, waiting a day in late September pays unless a field is losing more than about 0.5% of its yield a day, a bar healthy October corn clears easily and stalk-rotted corn may not. A dryer's wet-corn capacity roughly halves between 20% and 25% moisture, so the useful decision is which fields get the dryer, not whether to run it.
About two-fifths of the U.S. corn crop is still short of black layer, and the part that is mature is starting to split between fields that can wait and fields that cannot. USDA's Crop Progress report put the 18-state crop at 58% mature and 13% harvested as of September 20, slightly ahead of the five-year averages of 55% and 11%. The national pace hides a wide spread by state. Illinois was 16% harvested against a 9% average, while Ohio was only 32% mature (USDA NASS, Sep 21, 2026). Farm propane in Iowa averaged $1.48 a gallon in the week ending September 18 (USDA AMS, Sep 18, 2026). Agronomists in southeast Nebraska and southwest Iowa are reporting stalk rot and crown rot in "just about every hybrid" (Brownfield Ag News, Sep 18, 2026). Put those together and the old question of whether to let corn dry in the field or run the dryer has a dated answer. Field drying is worth a lot per day now and loses value quickly through October. Most healthy corn should keep standing for the moment. The dryer's limited capacity for wet corn should go to the fields whose stalks will not last.
1. The calendar sets how much a field day is worth
What's new: Extension drydown rates fall by roughly three-quarters between late September and mid-November. That drop, not the propane price, is the main reason the value of waiting changes.
Evidence: Mature corn usually dries 3/4 to 1 point a day in mid-to-late September, 1/2 to 3/4 point in early-to-mid October, 1/4 to 1/2 point from late October into early November, and close to nothing after mid-November (Ohio State University C.O.R.N. Newsletter 2019-32; Pioneer Agronomy Sciences, 2019). Iowa State's weekly version of the same pattern is 4.5 points a week in September, then 2.5, 1 and 0.5 in October, November and December (Iowa State University Integrated Crop Management, Sep 11, 2019). Kernels are at about 30% moisture at black layer. Purdue's work shows grain that matures in late August drying about 0.8 point a day, while grain maturing in mid-to-late September dries about 0.4 point a day (Purdue University, Nielsen, Sep 2018).
| Period | Extension drydown, points/day | Midpoint used | Iowa State weekly rate | Basis |
|---|---|---|---|---|
| Mid-late September | 0.75–1.00 | 0.875 | 4.5 pts/week (Sep) | Sunny, breezy days |
| Early-mid October | 0.50–0.75 | 0.625 | 2.5 pts/week (Oct) | About 5–10 GDD/day |
| Late October–early November | 0.25–0.50 | 0.375 | 1.0 pt/week (Nov) | Cooler, shorter days |
| Mid-November on | 0–0.25 | 0.125 | 0.5 pt/week (Dec) | Little or none |
Source: Ohio State University C.O.R.N. Newsletter 2019-32 (Thomison); Pioneer Agronomy Sciences, "Timing Corn Harvest," 2019; Iowa State University ICM News, Sep 11, 2019. Midpoints are Crop Root Zone's. Degree-day rules give a wider range: about 30 GDD per point from 30% to 25% moisture and 45 GDD per point from 25% to 20%, with seed-company estimates as low as 15–30 GDD per point.
Where the crop stands matters because of that Purdue split. Nebraska Extension recorded corn losing 0.8 to 1.0 point a day in the early-September heat before a cooler spell (Nebraska Extension, Rees, Sep 13, 2026). The 42% of the crop still immature on September 20 will reach black layer into a cooler calendar.
| State | Mature, Sep 20 | 5-yr avg | Harvested, Sep 20 | 5-yr avg | |
|---|---|---|---|---|---|
| Kansas | 86% | 72% | 40% | 28% | █████████░ |
| Illinois | 69% | 63% | 16% | 9% | ███████░░░ |
| Minnesota | 64% | 48% | 4% | 4% | ██████░░░░ |
| Iowa | 56% | 58% | 4% | 5% | ██████░░░░ |
| South Dakota | 56% | 44% | 7% | 4% | ██████░░░░ |
| Nebraska | 54% | 56% | 7% | 8% | █████░░░░░ |
| Indiana | 46% | 49% | 7% | 7% | █████░░░░░ |
| Ohio | 32% | 43% | 2% | 4% | ███░░░░░░░ |
| 18 states | 58% | 55% | 13% | 11% | ██████░░░░ |
Source: USDA NASS, Crop Progress, week ending Sep 20, 2026 (released Sep 21, 2026). Bars scale percent mature, one block per 10%.
Take a field that reaches black layer around October 1 at about 30% moisture and dries at Purdue's 0.4 point a day for late-maturing grain. It would reach 20% in about 25 days, around October 26 (Crop Root Zone estimate). By then the calendar rate has dropped toward 1/4 to 1/2 point a day. In practice, late-maturing corn in Ohio, Indiana and parts of Iowa faces a choice between harvesting in the low 20s in late October and waiting into November for moisture that barely moves.
2. What a point costs at this week's propane
What's new: Iowa's farm propane average of $1.48 a gallon is the first farm-level fuel price this harvest that can be put straight into the extension drying formulas. EIA does not resume its weekly state propane survey until October.
Evidence: USDA's Iowa Production Cost Report quoted propane at $1.30 to $1.67 a gallon, averaging $1.48, down 4 cents from the prior report (USDA AMS, Sep 18, 2026). The Mont Belvieu hub was $0.83 on September 21, up 15% in a month and 17% from a year earlier (Trading Economics, Sep 21, 2026). Iowa State's rule of thumb for a high-temperature dryer is 0.018 gallon of propane per bushel per point removed, with a range of 0.010 to 0.025, plus about 0.01 kWh of electricity per bushel-point (Iowa State University Ag Decision Maker A2-31). North Dakota State uses a slightly higher 0.02 gallon and a cost rule of $0.022 per bushel-point for each $1 a gallon of propane (NDSU Extension, Hellevang). Iowa's commercial electricity averaged 12.79 cents per kWh in June, and Illinois's 14.53 cents (EIA, Electric Power Monthly, Table 5.6.A, Jun 2026). Iowa's 2026 custom-rate survey, which includes fuel, electricity and labor, puts continuous-flow drying at a median $0.060 per bushel-point (average $0.055, range $0.025–$0.090, 21 responses) and bin drying at a median $0.055 (Iowa State University Ag Decision Maker A3-10, Mar 2026).
| Drying cost basis | $/bu-pt | 10 pts (25%→15%), $/acre | 7 pts (22%), $/acre | 5 pts (20%), $/acre | 3 pts (18%), $/acre |
|---|---|---|---|---|---|
| Owned dryer, energy only (0.018 gal + 0.01 kWh) | 0.0279 | 49.84 | 34.88 | 24.92 | 14.95 |
| NDSU rule (0.022 × propane) + electricity | 0.0338 | 60.40 | 42.28 | 30.20 | 18.12 |
| Iowa 2026 custom median, continuous flow | 0.0600 | 107.10 | 74.97 | 53.55 | 32.13 |
| Energy-only range, 0.010–0.025 gal at $1.30–$1.67 | 0.014–0.043 | — | — | — | — |
Sources: USDA AMS Iowa Production Cost Report, Sep 18, 2026 (propane $1.48/gal FOB distributor, average); EIA Electric Power Monthly, Jun 2026 (Iowa commercial 12.79¢/kWh); ISU A2-31; NDSU Extension; ISU A3-10, Mar 2026. Per-acre figures are Crop Root Zone calculations at USDA's 178.5 bu/acre national yield (WASDE, Sep 11, 2026), drying to 15%.
Two cautions shape how this table should be used. First, the energy-only line is the right marginal cost only for a farm that already owns a dryer with spare capacity. The custom median also covers labor, repairs, capital and a margin, which is roughly what an elevator or a neighbor will charge. Second, the water weight is not part of the comparison. Corn loses the same water whether the sun takes it off in the field or the burner takes it off in the bin, and it sells on the same dry-matter basis either way. What differs between the two routes is the fuel, the handling loss and the risk of over-drying. On-farm handling shrink has measured between 0.22% and 1.71% (Iowa State University Ag Decision Maker A2-32). Iowa State also estimates that drying cost rises about 14% for every 20°F drop in average outdoor temperature (ISU ICM News, Sep 11, 2019). That makes a bushel-point removed in November somewhat more expensive than one removed in September.
$0.028 per bushel-point
Energy cost of drying in an owned high-temperature dryer at Iowa's $1.48 farm propane average and 12.79¢ electricity. That is less than half the $0.060 Iowa custom median, and it is the number that should decide whether an owned dryer runs harder this fall. (Crop Root Zone calculation from USDA AMS, Sep 18, 2026; EIA, Jun 2026; ISU A2-31)
3. The break-even: what a field day saves against what the field loses
What's new: Divide one day's drydown, priced at the drying cost, by the price of corn and you get the daily field loss at which waiting stops paying. Yield cancels out of the calculation, so the threshold is the same for a 150-bushel field and a 230-bushel field.
Evidence: Iowa ethanol plants were bidding an average of $4.93 a bushel in eastern Iowa and $4.96 in western Iowa on September 21. A year earlier the bids were $3.90 and $3.88 (USDA AMS, National Daily Ethanol Report, Sep 21, 2026). December futures settled at $5.27½ on September 18 (Brownfield Ag News, Sep 18, 2026). At a $4.94 cash price, the break-even works out as follows.
| Period | Drydown, pts/day | Saved per day, owned dryer, $/acre | Saved per day, custom, $/acre | Break-even daily loss, owned | Break-even, custom | |
|---|---|---|---|---|---|---|
| Mid-late Sep | 0.875 | 4.36 | 9.37 | 0.50% (0.88 bu) | 1.06% (1.90 bu) | ██████████ |
| Early-mid Oct | 0.625 | 3.11 | 6.69 | 0.35% (0.63 bu) | 0.76% (1.36 bu) | ███████░░░ |
| Late Oct–early Nov | 0.375 | 1.87 | 4.02 | 0.21% (0.38 bu) | 0.46% (0.81 bu) | ████░░░░░░ |
| Mid-Nov on | 0.125 | 0.62 | 1.34 | 0.07% (0.13 bu) | 0.15% (0.27 bu) | █░░░░░░░░░ |
Source: Crop Root Zone estimates. Drying costs from Section 2; drydown midpoints from Section 1; corn at $4.94/bu, the midpoint of eastern and western Iowa ethanol-plant averages (USDA AMS, Sep 21, 2026); bushels at 178.5 bu/acre (WASDE, Sep 11, 2026). Bars scale the owned-dryer saving.
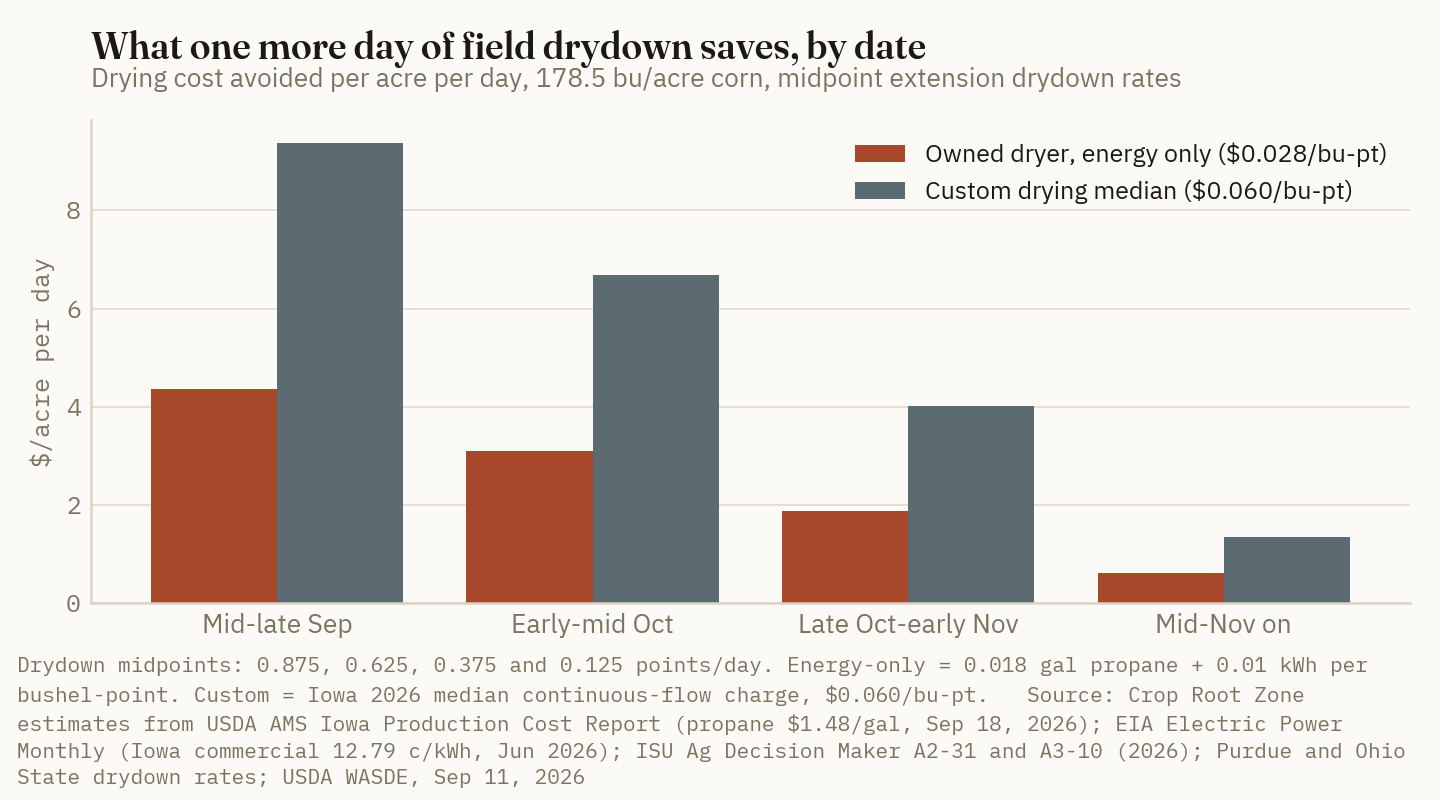
Harvest-date trials give the other side of the comparison. In eight Ohio State experiments across three years, yield fell about 13% between early-to-mid-October and December harvests. About 11 points of that loss came after early-to-mid November. Grain moisture fell 5.8 points between the October and November harvests and only 0.5 point after that (Ohio State University C.O.R.N. Newsletter 2019-37). Spread over roughly a month, the October-to-November loss is about 0.07% of yield a day and the November-to-December loss about 0.37% a day (Crop Root Zone estimate). Compare those with the break-even column. From October into early November, healthy corn loses about a fifth to a third of what a day of drydown is worth. After mid-November, it loses about five times as much. Pioneer's 2013 trials at 18 sites in Wisconsin, Minnesota and South Dakota point the same way for October. Harvesting at 25.2% instead of 22.1% preserved 2.9 bushels an acre but added about $18 an acre of drying cost, against about $10 of grain value, on the page's working assumptions of $1.50 propane and $3.50 corn (Pioneer Agronomy Sciences, 2019).
Averages hide the fields that matter most. Three of Ohio State's eight experiments lost 21% to 24% of yield. Weaker-stalk hybrids showed more stalk rot, more lodging and larger losses when harvest was delayed, and stalk rot increased most between the October and November dates. That is the window a grower would normally use for field drying. Pioneer's field rule makes the threshold easy to scout: each ear lost per 100 plants is about 1% of yield (Pioneer, "Measuring and Reducing Corn Field Losses"). At the late-September owned-dryer break-even of 0.50% a day, a field needs to be dropping or lodging roughly one ear per 100 plants every two days before waiting stops paying. Downed corn also costs more to harvest. Iowa's survey puts the added charge for a corn reel at an average of $12.55 an acre (ISU A3-10, Mar 2026).
4. Dryer throughput is the real constraint
What's new: Wetter corn costs more per bushel to dry, and it also cuts the number of acres a dryer can clear in a day. That second cost is the one that sets the harvest pace.
Evidence: Iowa State's continuous-flow dryer at its Kent Feed Mill is rated at 1,772 bushels an hour for five points of moisture removal and 918 bushels an hour for ten points (Iowa State University ICM News, Mensing and Maier, Sep 15, 2025). Both ratings work out to about 9,000 bushel-points an hour, so capacity falls roughly in proportion to the points removed. Purdue's Maier and Michigan State's Bakker-Arkema advise sizing dryers on 20 operating hours a day and note that the Corn Belt typically averages about five points of removal (GEAPS, Maier and Bakker-Arkema, 2002). Iowa State's field-capacity tables put an 8-row corn head at 8.7 acres an hour and a 12-row at 12.8 (Iowa State University Ag Decision Maker A3-24, Feb 2026).
| Harvest moisture (to 15%) | Points removed | Dryer output, bu/day per 1,000 bph rated at 5 pts | Acres/day at 178.5 bu | |
|---|---|---|---|---|
| 18% | 3 | 33,300* | 187* | ██████████ |
| 20% | 5 | 20,000 | 112 | ██████░░░░ |
| 22% | 7 | 14,300* | 80* | ████░░░░░░ |
| 25% | 10 | 10,360 | 58 | ███░░░░░░░ |
| 30% | 15 | 6,700* | 37* | ██░░░░░░░░ |
| 8-row combine, 10-hour day | — | 15,530* | 87* | █████░░░░░ |
Sources: ISU ICM News, Sep 15, 2025 (5- and 10-point ratings, scaled to 1,000 bph); GEAPS 2002 (20 operating hours a day); ISU A3-24, Feb 2026 (8.7 acres/hour); WASDE, Sep 11, 2026. *Crop Root Zone estimates assuming capacity inversely proportional to points removed, as the two ISU ratings imply; the 10-hour combine day is an assumption. Actual capacity also depends on ambient temperature, airflow and fines.
On these assumptions, a dryer rated at 1,000 bushels an hour at five points keeps pace with a single 8-row combine only when harvest moisture is below about 21.4% (Crop Root Zone estimate). Wetter than that, the combine either waits or wet corn piles up in holding. Holding time is short. The same Iowa State article reports that 20% corn at the Kent mill cleared the dryer within 12 hours and 25% corn took 22 hours, and it advises keeping wet holding under 24 hours. It also notes that grain deteriorates about twice as fast for every 10°F rise in temperature and every 2-point rise in moisture. The extension options for adding capacity are well established: dryeration raises dryer capacity by about 50% to 75% and in-storage cooling by 20% to 40% (NDSU Extension, Hellevang).
Ground Truth: At $1.48 propane the drydown-versus-dryer question is not really about fuel. A September field day is worth about $4.40 an acre in energy, and healthy corn loses a fraction of that. What is scarce is the dryer's capacity for 25% corn, and every field harvested wet uses up about twice the dryer hours of one harvested at 20%. The best use of that capacity this fall is to put the fields that fail a push or pinch test (Pioneer and the extension services use more than 10% to 15% of stalks as the trigger) first in line, whatever their moisture. Let good-stalk corn keep drying through the early-October window, when it is still earning more than half a point a day. Flip the rule around the first of November, when the daily saving drops below the loss rate. The expensive mistake is running the dryer on standing, healthy 24% corn in late September because the combine is available, then reaching the rotted fields in mid-October with the dryer already full.
5. What this fall changes, and what to watch
What's new: Three 2026 conditions move the break-even: a higher corn price, a split between early- and late-maturing crops, and stalk problems reported in both dry and wet areas.
Evidence: Iowa ethanol-plant bids are about 26% above a year ago, while the propane hub is 17% higher (USDA AMS, Sep 21, 2026; Trading Economics, Sep 21, 2026). The break-even loss rate moves inversely with the corn price. If farm propane has moved with the hub, the threshold for waiting is roughly 7% lower than it was last fall (Crop Root Zone estimate; farm propane's year-ago level was not checked). That leans slightly toward earlier harvest, but not by enough to change the ordering in Section 3. The stalk reports cover both halves of this season's rainfall split. Brownfield's September 18 report quoted a Wyffels Hybrids agronomist on widespread stalk integrity, crown rot and stalk rot problems in southeast Nebraska and southwest Iowa. Nebraska Extension noted internode rot around ear level and crown rot in some fields after a hot spell in which average temperatures ran above 80°F across most locations south of the Platte River (Nebraska Extension, Sep 13, 2026). Farther east, the crop is behind: Ohio is 32% mature against a 43% average and Indiana 46% against 49%. Those fields will reach black layer into the 0.4-point-a-day part of the calendar.
| Signal | Latest reading | Why it matters to the decision |
|---|---|---|
| Farm propane, Iowa | $1.30–$1.67, avg $1.48/gal (Sep 18) | Each 10¢/gal moves owned-dryer energy about $0.0018/bu-pt* |
| Propane hub | $0.83/gal, +15% m/m, +17% y/y (Sep 21) | Leads farm contract offers; EIA weekly state prices resume in October |
| Corn mature, 18 states | 58% vs 55% avg (Sep 20) | The immature 42% will dry at the slower late-season rates |
| Iowa corn cash, ethanol plants | $4.93 east / $4.96 west (Sep 21) | Higher corn lowers the daily loss that justifies harvesting now |
| Stalk quality | Stalk and crown rot reported, SE Nebraska/SW Iowa (Sep 13–18) | More than 10–15% failing stalks moves a field to the front of the queue |
Sources: USDA AMS Iowa Production Cost Report, Sep 18, 2026; Trading Economics, Sep 21, 2026; USDA NASS Crop Progress, Sep 21, 2026; USDA AMS National Daily Ethanol Report, Sep 21, 2026; Brownfield Ag News, Sep 18, 2026; Nebraska Extension, Sep 13, 2026; Pioneer Agronomy Sciences, 2019. *Crop Root Zone calculation at 0.018 gal/bu-pt.
Field-level tools now make this a per-field decision instead of a calendar habit. Iowa State's Corn DryDown Calculator projects a field's moisture 5 and 10 days ahead from a black-layer date or a moisture reading, using Corn Belt weather data and forecasts. In its published example, central Iowa corn at 35% on September 2 was projected at 23.8% ten days later (Iowa State University ICM, Archontoulis and Saenz, Sep 2, 2025). Combined with a 100-plant stalk count, the forecast gives the two numbers the break-even needs: how many points the next week will remove, and how much yield the field is losing while it waits.
Limits. The drying costs use extension coefficients with a wide stated range, and the energy-only figure runs from $0.014 to $0.043 per bushel-point across that range. The drydown rates are regional averages, and a cool, wet week can deliver none of it. The Ohio State daily loss rates are Crop Root Zone conversions of totals measured between harvest dates about a month apart, from one state's trials. The dryer-capacity scaling beyond five and ten points, and the 10-hour combine day, are estimates. Propane is quoted FOB distributor, not delivered to a farm tank.
References
- USDA National Agricultural Statistics Service, Crop Progress, week ending Sep 20, 2026 (released Sep 21, 2026) — https://esmis.nal.usda.gov/sites/default/release-files/796068/prog3826_0.txt
- USDA Agricultural Marketing Service, Iowa Production Cost Report (Bi-Weekly), week ending Sep 18, 2026 — https://www.ams.usda.gov/mnreports/ams_2863.pdf
- USDA Agricultural Marketing Service, National Daily Ethanol Report, Sep 21, 2026 — https://www.ams.usda.gov/mnreports/ams_3617.pdf
- Trading Economics, Propane price, accessed Sep 21, 2026 — https://tradingeconomics.com/commodity/propane
- U.S. Energy Information Administration, Electric Power Monthly, Table 5.6.A, Average Price of Electricity to Ultimate Customers by End-Use Sector, by State, June 2026 — https://www.eia.gov/electricity/monthly/epm_table_grapher.php?t=epmt_5_6_a
- Brownfield Ag News, "Closing Grain and Livestock Futures: September 18, 2026" — https://www.brownfieldagnews.com/market-news/closing-grain-and-livestock-futures-september-18-2026/
- Brownfield Ag News, "Agronomist warns of corn stalk issues heading into harvest," Sep 18, 2026 — https://www.brownfieldagnews.com/news/agronomist-warns-of-corn-stalk-issues-heading-into-harvest/
- Jenny Rees, Nebraska Extension, "High Heat and Early Harvest," Sep 13, 2026 — https://jenreesources.com/2026/09/13/high-heat-and-early-harvest/
- USDA World Agricultural Outlook Board, World Agricultural Supply and Demand Estimates, Sep 11, 2026 — https://www.usda.gov/oce/commodity/wasde/wasde0926.pdf
- Iowa State University Extension and Outreach, Ag Decision Maker File A3-10, "2026 Iowa Farm Custom Rate Survey," revised March 2026 — https://www.extension.iastate.edu/agdm/crops/pdf/a3-10.pdf
- William Edwards, Iowa State University Ag Decision Maker File A2-31, "Estimating the Cost for Drying Corn," Sep 2014 — https://www.extension.iastate.edu/agdm/crops/html/a2-31.html
- William Edwards, Iowa State University Ag Decision Maker File A2-32, "Corn Drying and Shrink Comparison," Nov 2014 — https://www.extension.iastate.edu/agdm/crops/html/a2-32.html
- Iowa State University Ag Decision Maker File A3-24, "Estimating the Field Capacity of Farm Machines," revised February 2026 — https://www.extension.iastate.edu/agdm/crops/pdf/a3-24.pdf
- Kristina TeBockhorst and Shawn Shouse, Iowa State University ICM News, "Grain Drying Considerations this Fall," Sep 11, 2019 — https://crops.extension.iastate.edu/cropnews/2019/09/grain-drying-considerations-fall
- Tony Mensing and Dirk Maier, Iowa State University ICM News, "Corn Harvest, Handling, Drying, and Early Storage Considerations for 2025," Sep 15, 2025 — https://crops.extension.iastate.edu/cropnews/2025/09/corn-harvest-handling-drying-and-early-storage-considerations-2025
- Sotirios Archontoulis and Ezequiel Saenz, Iowa State University ICM, "The Corn DryDown Calculator: A Tool to Guide Harvest Timing," Sep 2, 2025 — https://crops.extension.iastate.edu/post/corn-drydown-calculator-tool-guide-harvest-timing
- R.L. (Bob) Nielsen, Purdue University Agronomy, "Field Drydown of Mature Corn Grain," Sep 2018 — https://www.agry.purdue.edu/ext/corn/news/timeless/GrainDrying.html
- Peter Thomison, Ohio State University C.O.R.N. Newsletter 2019-32, "Drydown in Corn – What to Expect?" — https://agcrops.osu.edu/newsletter/corn-newsletter/2019-32/drydown-corn-%E2%80%93-what-expect
- Peter Thomison, Ohio State University C.O.R.N. Newsletter 2019-37, "Field Drying and Harvest Losses in Corn" — https://agcrops.osu.edu/newsletter/corn-newsletter/2019-37/field-drying-and-harvest-losses-corn
- Pioneer Agronomy Sciences, "Timing Corn Harvest," Apr 12, 2019 — https://www.pioneer.com/us/agronomy/timing-corn-harvest.html
- Pioneer Agronomy Sciences, "Measuring and Reducing Corn Field Losses" — https://www.pioneer.com/us/agronomy/corn-field-losses.html
- Ken Hellevang, North Dakota State University Extension, "Drying High-moisture Corn Can Be Tricky," Oct 26, 2009 — https://www.ag.ndsu.edu/news/newsreleases/2009/oct-26-2009/drying-high-moisture-corn-can-be-tricky/
- Dirk E. Maier and Fred W. Bakker-Arkema, "Grain Drying Systems," GEAPS Facility Design Conference, July 2002 — https://fyi.extension.wisc.edu/energy/files/2016/09/Grain-drying-Systems-GEAPS-2002-secured.pdf
Disclosures
Crop Root Zone is an independent publication. Nothing here is investment advice. Market calls, where included, reflect the editors' own read and are not a recommendation to buy or sell any security.
818 Percent of Tariff Times a $3.99 Benchmark Is $32.64 a Ton, or 91.4 Cents on a Bushel of Corn Out of St. Louis. The Memphis Gauge Is at −1.3 Feet, Not −11.91.
USDA AMS priced downbound freight out of St. Louis at 818.1 percent of tariff for the week ending September 15 — $32.64/ton, 91.4 cents per bushel of corn, the highest mid-September print in five years and 110 percent above July 7. But this is not 2022: the Memphis gauge read −1.3 feet on September 17 against a record −11.91 feet in October 2023, and a major carrier on the system has cut tow size 13 percent while leaving loading drafts unrestricted from the Gulf to Cairo. We convert percent-of-tariff into cents per bushel, chain it through the CIF NOLA export bid — where the October corn basis is 22 cents stronger than nearby while freight is only 4.6 cents higher — and then run the same arithmetic backwards on the northbound leg, where fall fertilizer is bidding for the same shortened tows. August upbound fertilizer through Mississippi Lock 27 ran 548,800 short tons, in line with 2025; the October restock is the number actually at risk, and in the 2022 low-water autumn it came in at 465,400 tons against 928,700 two years later.
USDA's Agricultural Marketing Service priced downbound grain barge freight out of St. Louis at 818.1 percent of tariff for the week ending September 15 — the highest mid-September print in five years and more than double the 389.1 percent posted on July 7. Against the $3.99-per-ton 1976 benchmark AMS uses for that origin, 818.1 percent is $32.64 a ton, or 91.4 cents on a bushel of corn. The Mississippi at Memphis, meanwhile, read −1.3 feet at 10:56 a.m. on September 17. The record is −11.91 feet, set on October 17, 2023. The freight is priced for a low-water autumn; the river has so far delivered a mild one. That gap is the story, and it has consequences in both directions — down to the Gulf with a 15.8-billion-bushel corn crop, and back up with the fertilizer that has to be in position before the ground freezes.
1. The rate, converted
What's new: Every origin on the system repriced sharply in the first half of September, and the increase got larger the farther south the origin sits.
Evidence: AMS publishes barge rates as a percent of a 1976 tariff benchmark specific to each origin. The conversion is arithmetic: multiply the percentage by that origin's benchmark rate. AMS's own worked example — a 289-percent St. Louis rate equals 2.89 × $3.99, or $11.53 per ton — fixes the St. Louis benchmark at $3.99/ton (USDA AMS, Barge Dashboard, accessed Sep 18, 2026). From there, corn converts at 56 lb/bu (0.028 short tons) and soybeans at 60 lb/bu (0.030 short tons).
| Origin | Sep 15 | Sep 8 | Aug 25 | Aug 25 → Sep 15 | Basis |
|---|---|---|---|---|---|
| Mid-Mississippi | 919.0 | 850.0 | 689.0 | +33.4% | % of 1976 tariff, downbound |
| Twin Cities | 878.0 | 839.0 | 727.0 | +20.8% | % of 1976 tariff, downbound |
| Cincinnati | 869.4 | 820.6 | 637.5 | +36.4% | % of 1976 tariff, downbound |
| Lower Ohio | 869.4 | 820.6 | 637.5 | +36.4% | % of 1976 tariff, downbound |
| Lower Illinois | 861.1 | 818.8 | 637.5 | +35.1% | % of 1976 tariff, downbound |
| Cairo–Memphis | 847.2 | 856.3 | 537.5 | +57.6% | % of 1976 tariff, downbound |
| St. Louis | 818.1 | 792.2 | 579.7 | +41.1% | % of 1976 tariff, downbound |
Source: USDA AMS, Downbound Grain Barge Rates (agtransport.usda.gov, dataset deqi-uken), accessed Sep 18, 2026.
Percent-of-tariff is each origin's rate measured against its own 1976 benchmark, so the levels are not directly comparable between rows — but the movement is, and that is where the season's signature sits. Cairo–Memphis ran 42.2 points below St. Louis on August 25. Three weeks later it is above it. The premium has migrated to the reach between Cairo and Natchez, which is exactly the reach where the operating restrictions bind.
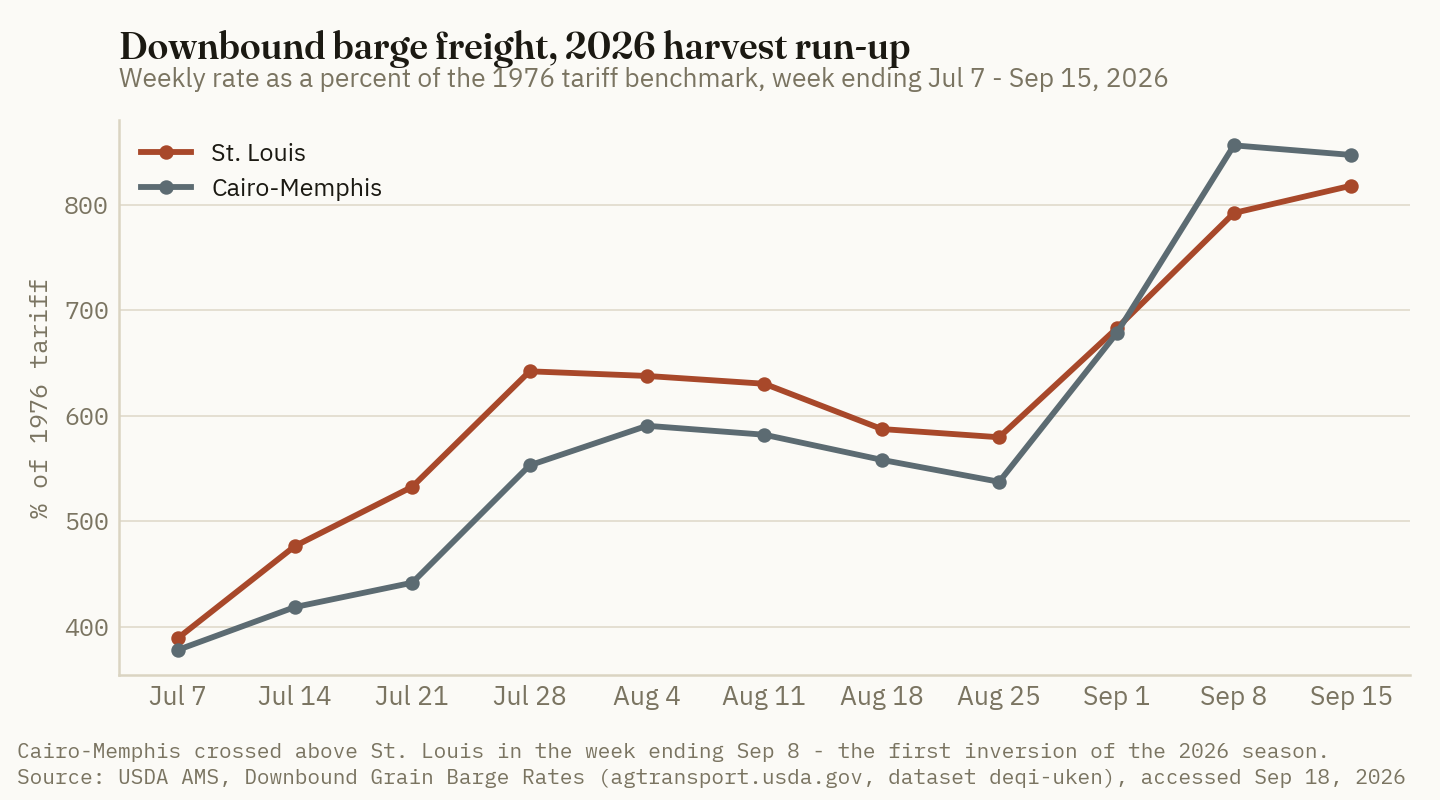
+29.2 pts
Cairo–Memphis traded 29.2 percentage points of tariff above St. Louis in the week ending September 15, after running 42.2 points below it three weeks earlier. (USDA AMS, Downbound Grain Barge Rates, Sep 15, 2026)
2. What the river is actually doing
What's new: American Commercial Barge Line activated its low-water protocol on September 5, 2026, when the Memphis gauge touched 0.0 feet, and as of September 18 has cut tow size by 13 percent — five barges — pending horsepower classification. Loading drafts remain unrestricted from the Gulf to Cairo.
Evidence: That last sentence is the whole difference between 2026 and the two autumns everyone is remembering. A draft restriction destroys payload directly: a jumbo hopper loaded to a 12-foot draft carries roughly 1,500 tons, and each foot of reduced draft costs about 200 tons — three feet off the draft is roughly 20,000 fewer bushels of soybeans per barge (University of Arkansas System Division of Agriculture, Sep 5, 2024). A tow-size cut is a different, milder animal: the same barges still load full, but each towboat moves fewer of them per trip, so the cost is boat-days rather than tons. ACBL's own thresholds put low-water territory at stages below 5 feet from Caruthersville to Memphis, below 20 feet from Memphis to Vicksburg, and below 10 feet from Vicksburg to Natchez (American Commercial Barge Line, river advisories, Sep 18, 2026).
Against those thresholds, the gauges as of the morning of September 17 were Cairo 16.1 ft, Memphis −1.3 ft, Helena 5.3 ft, Greenville 11.6 ft, Vicksburg 6.6 ft — with Memphis forecast to hold between −0.6 and −1.7 ft through September 22 (NWS Lower Mississippi River Forecast, ORN, Sep 17, 2026). Memphis had been at −4.7 ft on September 14 and recovered nearly three and a half feet in three days.
| Year | Week ending | St. Louis, % tariff | $/ton | ¢/bu corn | That autumn's peak | Peak ¢/bu corn |
|---|---|---|---|---|---|---|
| 2022 | Sep 13 | 693.8 | 27.68 | 77.5 | 2,653.1 (Oct 11) | 296.4 |
| 2023 | Sep 12 | 720.8 | 28.76 | 80.5 | 1,326.4 (Sep 26) | 148.2 |
| 2024 | Sep 17 | 810.7 | 32.35 | 90.6 | 848.2 (Oct 29) | 94.8 |
| 2025 | Sep 16 | 615.3 | 24.55 | 68.7 | 618.6 (Sep 23) | 69.1 |
| 2026 | Sep 15 | 818.1 | 32.64 | 91.4 | — | — |
Source: USDA AMS, Downbound Grain Barge Rates, accessed Sep 18, 2026. Dollar and cents-per-bushel columns are Crop Root Zone conversions at the $3.99 St. Louis benchmark and 56 lb/bu.
The 2026 level is a five-year high for the date and it is also 69 percent below the 2022 peak. Both statements are true, and trade press coverage tends to pick one. The useful read is that 2026 has arrived at roughly the 2024 freight level — 2024 being the year a low-water autumn produced a peak of 848.2 percent, not 2,653 percent — while the water is materially better than 2024's, when Memphis was already below −6 feet in the first week of September (University of Arkansas System Division of Agriculture, Sep 5, 2024).
It is also worth saying plainly that water is not the only constraint on the system this month. Barkley Lock has been closed since August 10 for miter-gate repairs, with traffic detouring via Kentucky Lock and the Barkley Canal; Newburgh's chamber has had intermittent closures since August 28; Upper Mississippi Lock 25 ran daily twelve-hour closures through September 19; and Olmsted is under repair (American Commercial Barge Line river advisories, Sep 18, 2026; Waterways Council news digest, Sep 16, 2026). Scheduled maintenance stacked onto a harvest surge removes tow-days from the system just as effectively as a shallow channel does.
And the tonnage is arriving. AMS counted 435,800 tons of barged grain moving downbound in the week ending September 12 — 315 barges, 50 more than the prior week — with 726 grain barges unloaded in the New Orleans region, 2 percent above the week before (USDA AMS, Grain Transportation Report, Sep 17, 2026). That is a rising, not a stalled, flow — which is itself evidence that the channel is passing traffic and the constraint is equipment, not depth.
Ground Truth: The freight spike is being driven more by tonnage than by water. USDA cut the corn crop 213 million bushels on September 11 and it is still 15.8 billion bushels, with exports held at 3.3 billion — the largest downbound program the system has ever had to absorb — meeting a fleet that is short tow-days for reasons that are only partly hydrological. Read that way, the risk profile is inverted from 2022. In 2022 the rate was a water story and it collapsed the moment rain arrived. In 2026 a rain event relieves the tow-size restriction but does nothing about the crop, so the downside in freight is smaller than the gauge chart suggests. Anyone waiting for a weather break to cure October freight is waiting for the wrong variable.
3. From percent of tariff to the elevator bid
What's new: The Gulf export bid is currently absorbing the freight increase rather than passing it back up the river — and the October structure absorbs more of it than the nearby does.
Evidence: Roughly 48 percent of US corn and soybean exports begin the trip on a barge down this system, and New Orleans handles 43 percent of all bulk agricultural exports (American Farm Bureau Federation Market Intel, Sep 24, 2025) — so the Gulf bid is not one outlet among many, it is the outlet that sets the alternative for most river-served elevators. USDA AMS quoted Louisiana Gulf CIF barge bids for No. 2 yellow corn on September 14 at 60–66 cents over December for current delivery, 84–86 over for October, and 89–90 over for November. Every one of those is quoted against the same December contract, so the spreads are internally consistent. Set the export bid against the barge freight for the matching period and the implied value at a St. Louis-area river terminal falls out:
| Line item | Nearby (¢/bu vs Dec) | October (¢/bu vs Dec) |
|---|---|---|
| CIF NOLA corn bid, midpoint | +63.0 | +85.0 |
| Less St. Louis barge freight | −91.4 | −96.0* |
| = Implied river-terminal value | −28.4 | −11.0 |
Source: USDA AMS, Louisiana and Texas Export Bids, Sep 14, 2026; USDA AMS, Downbound Grain Barge Rates, Sep 15, 2026. Crop Root Zone calculation. *October freight is the AMS one-month forward quote of 859.7 percent of tariff converted at the $3.99 benchmark. Excludes elevation, barge loading, storage and merchandising margin, so the absolute values are not a bid — the change between the two columns is the usable number.
The October column is 17.4 cents better than nearby. The export bid rose 22 cents while the freight rose 4.6. That is the opposite of the 2022 pattern, where the freight move outran the Gulf bid and the difference landed on the farm. Research published in June puts a number on how much of that difference normally travels: in the most exposed corn counties of Louisiana, Arkansas, Kentucky and Tennessee, a $1.00/bu increase in barge rates reduced local corn basis by roughly 60 to 71 cents, and soybean basis by roughly 49 to 53 cents (Zhang, Anderson & Loy, Southern Ag Today, Jun 22, 2026). The pass-through is weaker where local buying competition is stronger and where the elevator sits farther from a river port.
Apply that elasticity honestly and the exposure is regional, not national. The St. Louis freight move from July 7 to September 15 is 47.9 cents per bushel of corn. At a 65-cent pass-through, a lower-river elevator with no competing outlet is carrying roughly 31 cents of it in weaker basis; a central-Iowa elevator that can load a unit train to the Pacific Northwest or sell to a local ethanol plant is carrying a fraction of that. The river premium is a location tax this year, not a crop tax.
4. The northbound leg: fertilizer is bidding for the same tows
What's new: August upbound fertilizer through Mississippi Lock 27 — the Granite City gateway just above St. Louis, and the single best proxy for Corn Belt river-terminal restock — ran 548,800 short tons, essentially level with August 2025's 543,600 and 46 percent above the August 2022 low-water figure.
Evidence: Fertilizer is not an afterthought on this system. It was 27.6 percent of Mississippi River commodity tonnage in 2020, and a modeled 2022-style drought disruption produced a 289.4 percent barge-rate increase and a 0.299-percentage-point rise in the producer price index in the published simulation (Chen et al., Risk Analysis, Jul 13, 2025). The northbound leg is structurally tighter than the southbound one during harvest, and the mechanism is arithmetic on the same equipment: a tow-size cut applies in both directions, so every boat-day spent clearing the grain queue is a boat-day unavailable to push fertilizer upriver — against the current, which is the more power-hungry of the two moves. There is no public weekly index for northbound rates the way there is for downbound grain, so the honest way to track the northbound leg is by tonnage rather than by price.
| Year | August (st) | October (st) | |
|---|---|---|---|
| 2021 | — | 632,500 | ███████ |
| 2022 | 377,000 | 465,400 | █████ |
| 2023 | 746,200 | 840,100 | █████████ |
| 2024 | 634,910 | 928,700 | ██████████ |
| 2025 | 543,600 | 762,900 | ████████ |
| 2026 | 548,800 | pending | — |
Source: USDA AMS, Monthly Grain and Fertilizer Barge Movements (agtransport.usda.gov, dataset sthp-khuk; underlying data U.S. Army Corps of Engineers), upbound fertilizer at Mississippi Lock 27, accessed Sep 18, 2026. Bars scaled to the October maximum.
October is the month that matters. In every year where both months print, October runs above August as terminals fill for fall application — by 13 percent in 2023, 23 percent in 2022, 40 percent in 2025 and 46 percent in 2024. What the 2022 low-water autumn shows is not a missing seasonal build but a build off a much lower base: October 2022 came in at 465,400 short tons, the lowest October in the series, half the 928,700 tons that moved in October 2024 and 45 percent below October 2023. That autumn did not primarily show up as a fertilizer price event. It showed up as tonnage that never got upriver, and as a spring in which the Corn Belt started short.
The price backdrop going into that window is soft, which helps. DTN's retail survey for the week of September 7–11 had anhydrous at $938/ton, urea at $658/ton, UAN32 at $457/ton and DAP at $923/ton, with six of eight nutrients lower month over month (DTN/Progressive Farmer, Sep 16, 2026). Anhydrous is still up 22 percent year over year, and the global urea benchmark closed at $460.25/MT on September 17, up 17.9 percent in a month and 17.3 percent on the year (Trading Economics, Sep 17, 2026). A retail market that is drifting lower while the underlying international nitrogen benchmark climbs is a market whose downstream prices are being held up by inventory already in position — which is precisely the inventory that the northbound barge leg refills.
Ground Truth: For a fall fertilizer buyer, the number to watch is not the price of the ton, it is Lock 27's October tonnage. A restricted river does not usually deliver a visible upriver price spike, because the retail quote is set off inventory that is already sitting at the terminal; it delivers a quiet shortfall in restock that surfaces four months later as spring allocation and full-freight truck backfill. The decision implication is asymmetric: taking fall tons at a soft retail quote costs you carry if freight unwinds on schedule, but waiting costs you position if October repeats 2022. With the October upbound number not yet printed and the AMS forward curve already discounting freight by 27 percent into December, the buyer who wants to split the difference should be securing position now — physical tons at an upriver terminal — and leaving the price open, rather than the other way around.
5. What the forward curve says
What's new: AMS's own forward quotes show the trade expecting this entire premium to unwind by December.
Evidence: For the week ending September 15, the St. Louis nearby rate was 818.1 percent of tariff, the one-month (October) quote 859.7 percent, and the three-month (December) quote 595.3 percent. Cairo–Memphis runs the same shape: 847.2 nearby, 808.3 one-month, 538.9 three-month. Converted at the St. Louis benchmark, that is $32.64/ton now, $34.30 in October and $23.75 in December — 96.0 cents, then 66.5 cents, on a bushel of corn.
| St. Louis quote | % of tariff | $/ton | ¢/bu corn |
|---|---|---|---|
| Nearby (week ending Sep 15) | 818.1 | 32.64 | 91.4 |
| One-month forward (October) | 859.7 | 34.30 | 96.0 |
| Three-month forward (December) | 595.3 | 23.75 | 66.5 |
Source: USDA AMS Grain Transportation Report barge rate table, week 37, 2026. Dollar and cents-per-bushel columns are Crop Root Zone conversions at the $3.99 St. Louis benchmark and 56 lb/bu.
A 27 percent discount from nearby to December is a normal post-harvest shape, not a forecast of rain. It says the market expects the tonnage surge to clear, not that it expects the gauge to recover. That is consistent with the read in section 2: the constraint that made this rate is a harvest-sized tonnage flow meeting a fleet short of tow-days, and the thing that fixes it is the calendar.
Three things would break that. A genuine draft restriction below Cairo — as opposed to the current tow-size limit — would take payload out of every loaded barge and put the 2023 shape back on the board. A second is the maintenance stack: if the lock work now scheduled through late September and early October slips, tow-days come out of the fleet during the peak week rather than before it. The third is the northbound side quietly losing the competition for equipment, which would not show up in the downbound rate at all. It would show up in October's Lock 27 tonnage, and that number publishes after the fall application window has already opened.
References
- USDA Agricultural Marketing Service, Downbound Grain Barge Rates, weekly series (dataset
deqi-uken), accessed Sep 18, 2026 — https://agtransport.usda.gov/Barge/Downbound-Grain-Barge-Rates/deqi-uken/data - USDA Agricultural Marketing Service, Barge Dashboard — 1976 tariff benchmark methodology and the St. Louis $3.99/ton benchmark worked example, accessed Sep 18, 2026 — https://agtransport.usda.gov/stories/s/Barge-Dashboard/965a-yzgy/
- USDA Agricultural Marketing Service, Grain Transportation Report, week 37, 2026 — nearby, one-month and three-month barge rate quotes by origin (accessed via published GTR data summary, Sep 17, 2026) — https://www.indexbox.io/blog/usda-grain-transportation-report-september-17-2026/
- National Weather Service, Lower Mississippi River Forecast (RVA product, WFO ORN), issued Sep 17, 2026, 10:56 a.m. CDT — https://forecast.weather.gov/product.php?site=NWS&product=RVA&issuedby=orn
- American Commercial Barge Line, river advisories and American Currents operating notices, low-water protocol activation Sep 5, 2026 and restriction status Sep 18, 2026 — https://www.bargeacbl.com/river-closures-restricted-movements/ and https://www.bargeacbl.com/american-currents/
- University of Arkansas System Division of Agriculture (Scott Stiles), "Mississippi River continues to trend lower; draft restrictions in place for shipping," Sep 5, 2024 — draft-to-tonnage arithmetic and the Oct 2023 record stage — https://www.uaex.uada.edu/media-resources/news/2024/september2024/09-05-2024-ark-miss-river-trends-lower.aspx
- USDA Agricultural Marketing Service, Louisiana and Texas Export Bids, Sep 14, 2026 (accessed via published report summary) — https://www.indexbox.io/blog/usda-louisiana-and-texas-export-bids-report-corn-soybean-and-wheat-prices-for-september-14-2026/
- Yuan Zhang, Andrew Anderson and Ryan Loy, "When the River Runs Low, Southern Grain Farmers Pay the Most," Southern Ag Today, Jun 22, 2026 (relayed Jun 24, 2026) — https://www.oklahomafarmreport.com/2026/06/24/when-the-river-runs-low-southern-grain-farmers-pay-the-most/
- USDA Agricultural Marketing Service, Monthly Grain and Fertilizer Barge Movements (dataset
sthp-khuk; underlying data U.S. Army Corps of Engineers), upbound fertilizer at Mississippi Lock 27, accessed Sep 18, 2026 — https://agtransport.usda.gov/Barge/Monthly-Grain-and-Fertilizer-Barge-Movements/sthp-khuk - Chen et al., "Regional supply-chain impacts of Mississippi River fertilizer shipments disrupted by climate change," Risk Analysis, Jul 13, 2025 — https://pmc.ncbi.nlm.nih.gov/articles/PMC12516647/
- DTN/Progressive Farmer, "Fertilizer Prices Continue Lower for 6 of 8 Major Nutrients," Sep 16, 2026 (retail survey week of Sep 7–11, 2026) — https://www.dtnpf.com/agriculture/web/ag/crops/article/2026/09/16/fertilizer-prices-continue-lower-6-8
- Trading Economics, urea benchmark, Sep 17, 2026 — https://tradingeconomics.com/commodity/urea
- USDA, Crop Production and WASDE, Sep 11, 2026 — corn production 15.8 billion bu, exports 3.3 billion bu (relayed) — https://www.dtnpf.com/agriculture/web/ag/news/article/2026/09/11/usda-releases-september-crop-wasde-2
- Waterways Council Inc., news digest, Sep 16–17, 2026 — Barkley Lock dewatering and Olmsted Locks and Dam repairs — https://www.waterwayscouncil.org/media/in-the-news
- American Farm Bureau Federation Market Intel (Daniel Munch), "Low Mississippi River Levels Again Jeopardize Farm Income," Sep 24, 2025 — share of corn and soybean exports moving by barge (48 percent) and Gulf export concentration — https://www.fb.org/market-intel/low-mississippi-river-levels-again-jeopardize-farm-income
- USDA Agricultural Marketing Service, Grain Transportation Report, Sep 17, 2026 — downbound barge grain movements of 435,800 tons for the week ending Sep 12 and 726 barges unloaded in the New Orleans region (accessed via published report summary) — https://www.indexbox.io/blog/usda-grain-transportation-report-september-17-2026/
Disclosures
Crop Root Zone is an independent publication. Nothing here is investment advice. Market calls, where included, reflect the editors' own read and are not a recommendation to buy or sell any security.
Hired Drones Now Cost About What a Plane Costs. Owning One Beats Hiring Only Past About 1,000 Acres a Year, and Tariffs and Insurance Can Push That Past 2,300.
In the first university custom-rate surveys to list drones, Iowa operators charged an average $12.50 an acre, against $12.00 for a plane and $9.35 for a self-propelled ground rig. Ohio and Nebraska drone averages ran $15 to $15.17. On Missouri's cost inputs, an owned drone matches Iowa's hired rate at about 970 acres a year. Double the drone price for the new 100% tariff and add full insurance, and the crossover moves to about 2,400 acres. The base-case break-even is about what one drone can spray in a single fungicide window. The case holds best for fungicide and insecticide passes on tall corn, wet ground and late soybeans, not for herbicides.
Spray drones have their own line in the university custom-rate surveys now. The 2026 Iowa Farm Custom Rate Survey lists them for the first time: $12.50 an acre on average, $12.00 median, with a range of $8.00 to $16.00 across 47 responses. The same survey lists aerial application at $12.00 and a self-propelled ground rig at $9.35 (Iowa State University, Mar 2026). Over the same stretch, the supply side has tightened sharply. U.S. sales of new spray drones fell from about 8,950 units in 2024 to about 3,711 in 2025 (American Spray Drone Coalition, Jan 2026). In December 2025 the Federal Communications Commission stopped authorizing new foreign-made drone models. In July 2026 it proposed to extend that to spray drones already on sale (AgFunderNews, Aug 7, 2026). And from September 3, drones heavier than 25 kg at takeoff carry a 100% import tariff (KPMG, Aug 2026). That bracket includes loaded spray drones such as DJI's Agras T50. For a farm deciding whether to buy a drone or keep hiring one for 2027, the questions are what a hired pass costs, what an owned pass costs, and where a drone does work a ground rig or a plane can't.
1. What a hired pass costs in 2026
What's new: Three of the four big state surveys published in 2026 now price drone application separately, and all three put it at or above manned aircraft. Ohio's 2026 survey, with 343 respondents, reports $14.98 an acre for drone chemical application (42 responses) and $14.84 for airplane or helicopter (40 responses) (Ohio State University Extension, Jun 2026). Nebraska's biennial survey reports $15.17 for drone spraying, but only 6 operators reported. The self-propelled ground rate there is $9.85, from 29 (Nebraska Extension, Apr 24, 2026). Kansas does not survey drones yet. Its aerial fungicide and insecticide rate averaged $10.23, against $8.74 for a ground rig (Kansas Department of Agriculture and K-State, 2026).
Evidence:
| State survey, 2026 | Method | $/acre avg | Responses | |
|---|---|---|---|---|
| Nebraska | Drone | 15.17 | 6 | ██████████ |
| Ohio | Drone, chemical | 14.98 | 42 | ██████████ |
| Ohio | Airplane/helicopter, chemical | 14.84 | 40 | ██████████ |
| Ohio | Self-propelled, late season (high clearance) | 12.59 | 38 | ████████ |
| Iowa | Drone | 12.50 | 47 | ████████ |
| Iowa | Aerial | 12.00 | 54 | ████████ |
| Iowa | Self-propelled, tall crop | 11.15 | 65 | ███████ |
| Ohio | Self-propelled | 10.63 | 105 | ███████ |
| Kansas | Aerial, insecticide/fungicide | 10.23 | 48 | ███████ |
| Nebraska | Self-propelled | 9.85 | 29 | ██████ |
| Iowa | Self-propelled, broadcast | 9.35 | 121 | ██████ |
| Kansas | Ground rig, insecticide/fungicide | 8.74 | 136 | ██████ |
Sources: Iowa State University Ag Decision Maker A3-10, Mar 2026; Ohio State University Extension, Ohio Farm Custom Rates 2026, Jun 2026; Nebraska Extension EC823, Apr 24, 2026; Kansas Department of Agriculture and K-State Land Use Survey Office, Kansas Custom Rates 2026. Materials excluded in all cases. Survey methods differ by state, and Nebraska's drone line rests on six responses.
The industry's own numbers show how quickly drone pricing fell before it settled at those levels. The American Spray Drone Coalition, a trade group, surveyed operators holding an FAA Part 137 certificate. It found the average drone price per acre dropped 38% in one year, from $21 in 2024 to $13 in 2025. Over the same year, the number of certificated drone operators rose 58% to 1,710 (American Spray Drone Coalition, Jan 2026). The coalition blames much of the price drop on uncertificated operators undercutting in the Corn Belt. By its estimate, 86% of drones sold are held by operators without Part 137 certificates.
$21 → $13
Average price per acre for drone spraying, 2024 to 2025, among FAA-certificated drone operators, a 38% drop in one year. (American Spray Drone Coalition, Jan 2026)
Manned and ground rates have been rising while drone rates fell. Kansas publishes a 20-year series.
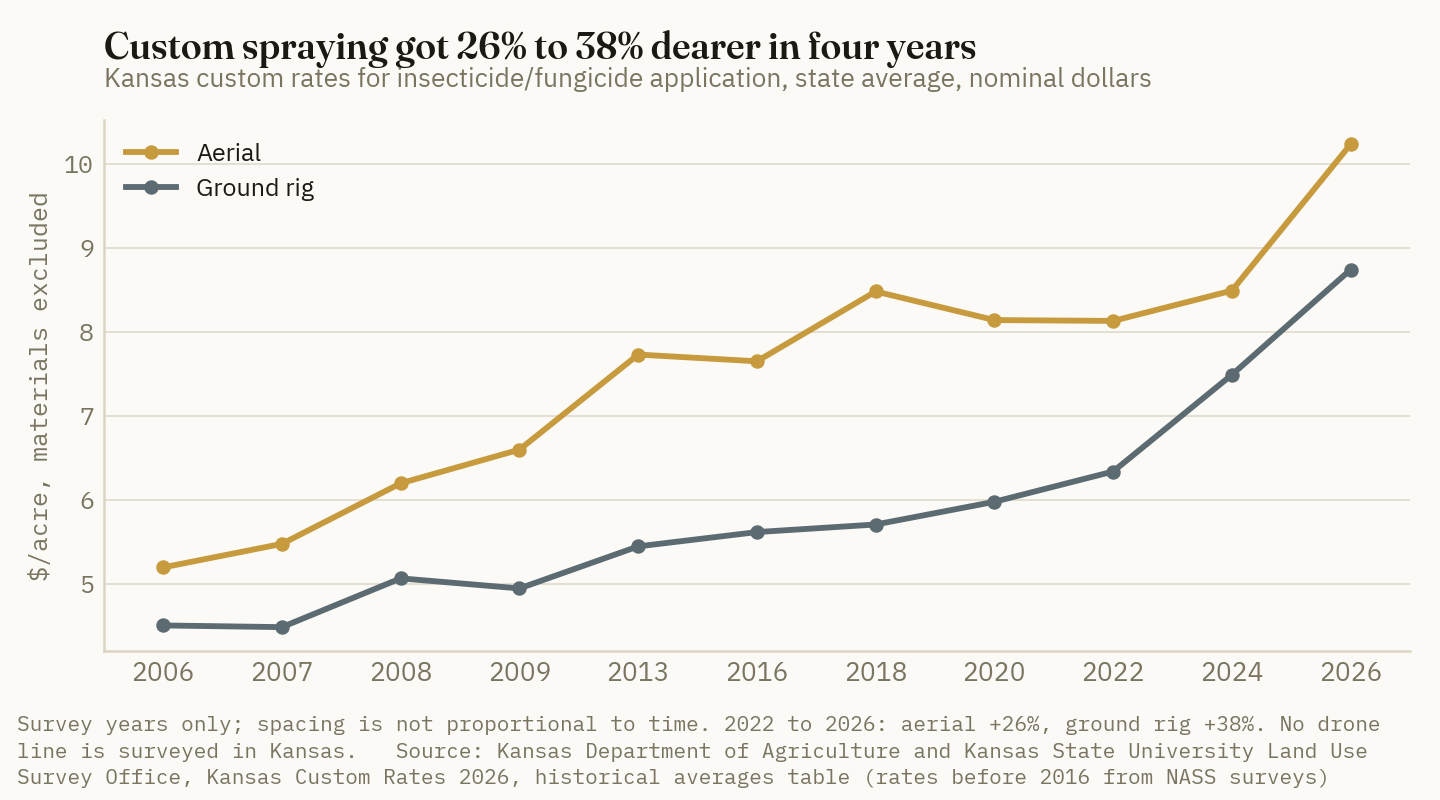
Ground Truth: Drone pricing has come down to meet aircraft pricing; it has not gone below it. At $12 to $15 an acre, a hired drone costs $3 to $5 more than a hired ground rig and about the same as a plane. The competition that cut drone prices 38% came from uncertificated operators. A farmer hiring one should ask for the Part 137 certificate number and proof of liability insurance before the fungicide goes in the tank. When a cheap operator causes drift or misapplies product, the farm usually carries the problem.
2. What a drone can actually cover, and what the label allows
What's new: Drone capacity is set by tank size, carrier volume and battery cycles. Aircraft and ground rigs work on a different scale. DJI's Agras T50, one of the newer models the coalition's survey names, carries a 40-liter (10.6-gallon) spray tank, sprays a 4 to 11 meter (13 to 36 foot) swath, and weighs up to 92 kg at takeoff when spraying (DJI, accessed Sep 17, 2026). Ohio State's Erdal Ozkan puts typical spray-drone tanks at 5 to 15 gallons and flights at 5 to 15 minutes per battery, at 1.5 to 2 gallons per acre (Ozkan, Jan 17, 2024). A Syngenta agronomy note describes drone efficiency as limited to under 50 acres an hour (Golden Harvest, 2024).
Evidence:
| Method | Working capacity | Basis | Source |
|---|---|---|---|
| Self-propelled sprayer, 120-ft boom | 96.7 ac/hr | Budgeted field capacity | farmdoc, 2025 |
| Self-propelled sprayer, 90-ft, high-crop ready | 72.5 ac/hr | Budgeted field capacity | farmdoc, 2025 |
| Agricultural airplane | 1,800 ac per 12-hr day | Industry example | NAAA |
| Ground rig (NAAA comparison) | 450 ac per 12-hr day | Industry example | NAAA |
| Spray drone, 10-gallon class, 2 gal/acre | 25–45 ac/hr* | Includes refills and battery swaps | Crop Root Zone estimate |
Sources: farmdoc, Machinery Cost Estimates: Field Operations, 2025; National Agricultural Aviation Association, industry facts, accessed Sep 17, 2026; Golden Harvest (Syngenta), 2024; Ozkan, Ohio State, Jan 17, 2024. *Estimate: a 10.6-gallon tank at 2 gal/acre covers 5.3 acres a load; the range assumes 7 to 12 minutes per load cycle, consistent with Purdue's 7 to 12 minutes of flight per battery and Syngenta's under-50-acre ceiling.
Carrier volume matters more than any other variable, and the pesticide label sets it. Labels do not yet carry drone-specific directions, and a drone application must meet or exceed the label's minimum spray volume. Penn State lists label minimums for common herbicides: 10 gal/acre for Liberty, 3 for glyphosate products and for Assure II and Select Max, and 2 for Peak. Status, DiFlexx and the Enlist products carry no aerial label, which rules out drones (Wallace and Mazzone, Penn State Extension, Jan 27, 2026). Purdue notes that many labels specify 5 to 10 gallons an acre, well beyond what a drone can carry economically (Purdue Extension PPP-154, May 27, 2026).
| Label minimum carrier | Acres per 10.6-gal load | Loads per 100 acres | |
|---|---|---|---|
| 2 gal/acre (most aerial fungicide labels) | 5.3 | 19 | ██████████ |
| 3 gal/acre (glyphosate, Assure II, Select Max) | 3.5 | 29 | ███████ |
| 5 gal/acre | 2.1 | 48 | ████ |
| 10 gal/acre (Liberty) | 1.1 | 95 | ██ |
Source: Crop Root Zone calculation from the DJI Agras T50 tank capacity (DJI, accessed Sep 17, 2026) and label minimums reported by Penn State Extension, Jan 27, 2026, and Golden Harvest, 2024. Bars scale acres per load.
The efficacy evidence at 2 to 5 gallons is encouraging but still thin. In Purdue's 2023 corn trials, a DJI T10 at 5 gal/acre gave the lowest tar spot severity at one location. At another, the 2 gal/acre drone and the 15–20 gal/acre ground rig both raised yield significantly. Disease pressure was generally low (Telenko and Mizuno, Purdue, 2023 trials). A 2024 Kentucky trial found ground application at 15 gal/acre gave better spray coverage and deposition than a drone at 2.5 gal/acre. Drought kept disease below 1%, so the trial could not test control (Wise, Stombaugh and Barlow, University of Kentucky, Apr 30, 2025). The strongest field result comes from seed company Beck's. In its 2025 corn plots across Indiana, central Illinois and Ohio, the first year with heavy disease pressure, untreated corn yielded 227 bu/acre, a ground rig at 15–20 gal/acre 235, and a drone at 2 gal/acre 237 (Dobberstein, Precision Farming Dealer, Jan 22, 2026).
Ground Truth: A drone is a fungicide and insecticide machine. It is not a herbicide program. A 2 gal/acre fungicide load covers five acres. A Liberty load covers one, which makes the drone about a fifth as productive, and some of the most widely used dicamba and 2,4-D products can't go on by air at all. When a drone budget counts "all spray passes," throughput comes out several times too high. Count only the passes whose labels allow 2 to 3 gallons.
3. The rules and the hardware in 2026
What's new: A farmer who sprays his own crop by drone faces the same federal requirements as a hired operator. That means an FAA Part 107 remote pilot certificate, a Part 137 agricultural aircraft operator certificate, and a Section 44807 exemption, because loaded spray drones exceed 55 pounds. State applicator licensing and liability insurance come on top (DTN, Aug 5, 2026). The FAA's proposed Part 108 rule for flights beyond visual line of sight was published on August 7, 2025 (Federal Register, Aug 7, 2025). It includes lower-risk permits suited to routine agricultural work. As of mid-September the rule had cleared internal FAA review and was at the White House regulatory review office, and the FAA hopes to publish it by the end of 2026 (The Flight Brief, Sep 14, 2026). Until then, operations run under the current rules, which generally require a second person at the site (Purdue Extension PPP-154, May 27, 2026).
The hardware side has moved faster than the flight rules. On December 22, 2025, the FCC barred new foreign-made drone models and critical components from authorization. Models already cleared could still be sold. On July 21, 2026, the FCC proposed also ending sales of listed foreign drones in several categories, including those capable of dispensing "economic poison," the FAA's term for pesticides. Comments closed September 2 (AgFunderNews, Aug 7, 2026; DroneLife, Jul 30, 2026). On August 13, a Section 232 proclamation set a 100% tariff on drones with a maximum takeoff weight above 25 kg and 25% on lighter ones, effective September 3, with lower caps for allied countries (KPMG, Aug 2026). A T50 at 92 kg is well inside the top bracket.
Evidence:
| Market indicator | 2024 | 2025 | Change |
|---|---|---|---|
| New U.S. spray-drone sales, units | 8,950 | 3,711 | −59% |
| China-made share of units sold | 93.5% | 75.8% | −17.8 pts |
| U.S.-made share of units sold | 6.5% | 24.3% | +17.8 pts |
| Average price per acre, Part 137 operators | $21 | $13 | −38% |
| Approved Part 137 drone operators | ~1,080* | 1,710 | +58% |
| Average acres per operator | — | 9,584 | "statistically flat" |
Source: American Spray Drone Coalition, 2025 U.S. Agricultural Spray Drone Industry Survey, Jan 2026. Units and shares come from manufacturer and distributor interviews. *2024 operator count back-calculated by Crop Root Zone from the reported 58.3% increase.
The same survey found that 49% of certificated operators would pay no premium for a U.S.-made drone, and 41% would pay up to 25% more. The 2025 drop in sales came before the FCC and tariff actions. It followed U.S. Customs' October 2024 enforcement against DJI imports under the Uyghur Forced Labor Prevention Act (American Spray Drone Coalition, Jan 2026).
Ground Truth: Supply restrictions weigh more heavily on a would-be owner than on a customer. A hired operator already has a fleet in place, and its costs rise only when a machine needs replacing. A farmer buying in 2027 pays for whatever the tariff and the FCC leave on the market, and takes on parts and firmware risk for five years. Two forces pull custom rates in opposite directions. Uncertificated competition pushed them down in 2025, and constrained fleet replacement should push them up. Our read is that the 2026 survey rates of $12.50 to $15 are closer to the floor than the ceiling for certificated service in 2027.
4. The break-even: owning versus hiring
What's new: The most detailed public drone budget is the University of Missouri's. It prices a farm kit for a DJI Agras T40 (10.6-gallon tank) at $56,000 total investment. The kit includes a $23,000 drone package, three $2,500 batteries, a $7,500 generator, a $9,000 trailer and a quarter of a $50,000 truck. The analysis assumes 8% interest, $21-an-hour labor and 6.5 acres per battery cycle. On those inputs, cost comes to $12.27 an acre at 1,000 acres a year: $3.37 operating and $8.90 ownership. For a two-drone custom operator spraying 4,000 acres, it is $7.39. Missouri puts the farm's ownership threshold at roughly 980 acres (University of Missouri Extension G1274, Mar 2025).
Evidence: We rebuilt that budget as a fixed-plus-variable model, charging drone depreciation per acre as Missouri does over an 8,000-acre life. The base case matches Missouri's result at 1,000 acres. Then we added the two 2026 cost changes a buyer can see. First, Purdue puts full insurance at $4,000 to $6,000 a year per unit (Purdue Extension PPP-154, May 27, 2026), against Missouri's $590 for taxes, insurance and housing combined. Second, the drone package price doubles, the upper bound if the 100% tariff passes fully through to the farm.
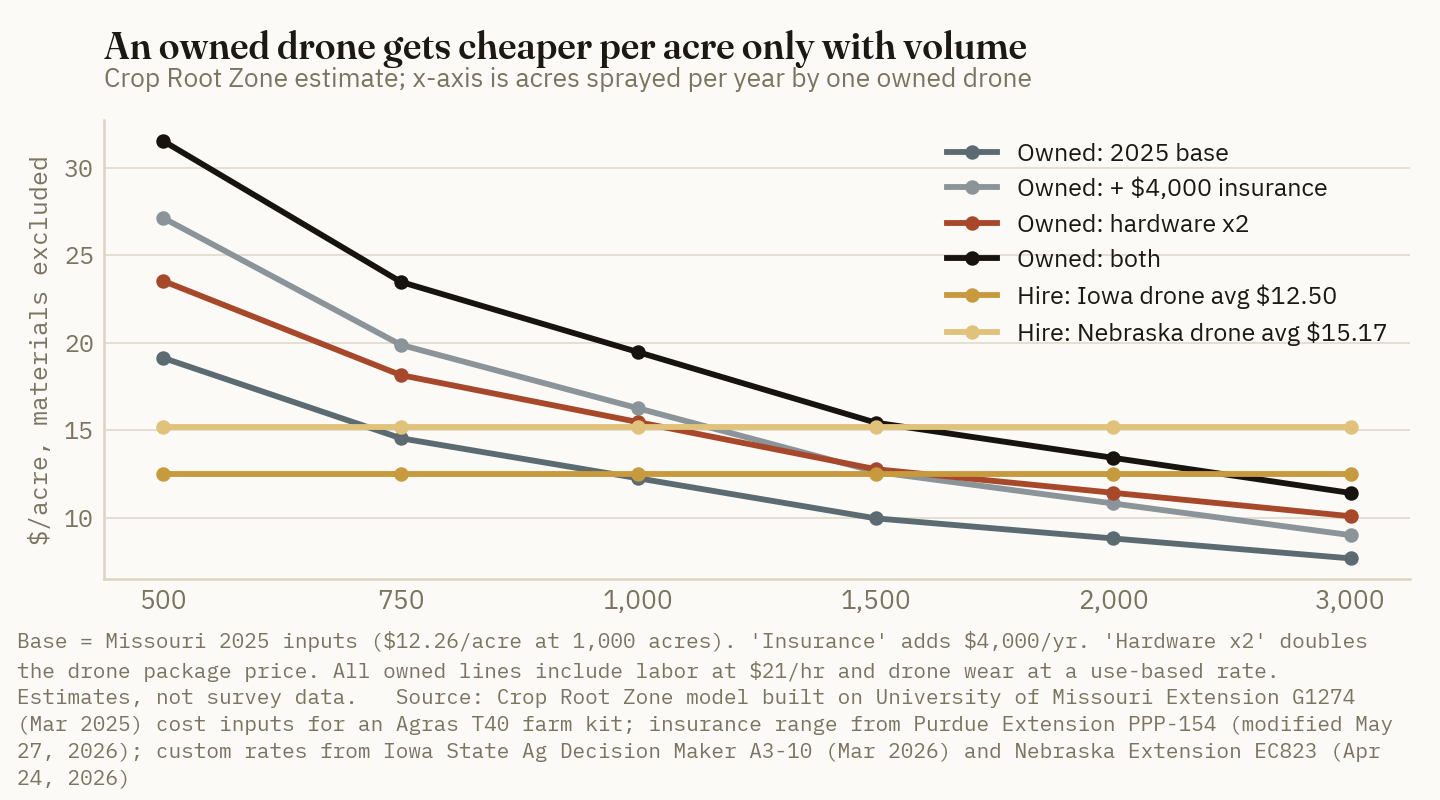
| Break-even acres per year vs hired rate | Iowa drone $12.50 | Ohio drone $14.98 | Nebraska drone $15.17 | Iowa aerial $12.00 | Kansas aerial $10.23 |
|---|---|---|---|---|---|
| 2025 base (Missouri inputs) | 966* | 717* | 703* | 1,039* | 1,419* |
| + $4,000/yr insurance | 1,528* | 1,133* | 1,111* | 1,644* | 2,244* |
| Drone package price x2 | 1,581* | 1,064* | 1,038* | 1,753* | 2,848* |
| Both | 2,365* | 1,592* | 1,553* | 2,622* | 4,259* |
Source: Crop Root Zone estimate. Base fixed cost $6,878/yr and variable cost $5.38/acre, derived from University of Missouri Extension G1274, Mar 2025 (depreciation and interest $6.58/acre, batteries $1.72, taxes/insurance/housing $0.59 and operating $3.37, all at 1,000 acres; drone depreciation of $2.01/acre treated as variable). Hardware x2 adds $1,196/yr interest and $2.01/acre depreciation. Hired rates from the 2026 Iowa, Ohio, Nebraska and Kansas surveys. *All cells are model estimates. Owner labor is priced at $21/hr; in a peak spray window its opportunity cost is likely higher.
The comparison that matters most is not in the table. Nearly every Corn Belt farm large enough to consider a drone already owns a ground sprayer. farmdoc budgets a 120-foot self-propelled rig at $6.10 an acre, running 8,028 acres a year (farmdoc, 2025). At that cost, a drone never wins on a pass the ground rig can make. In the base model, owning one would take more than 1,700 acres a year just to match a hired ground rig at Iowa's $9.35, and the other scenarios run far higher. The drone's market is only the passes the ground rig can't make well, and that is a much smaller acreage.
Capacity sets a ceiling on the math too. At 25 to 45 acres an hour over 8 flying hours, one drone covers about 200 to 360 acres a day (Crop Root Zone estimate). If weather allows five spray days in a VT–R1 fungicide window, that is roughly 1,000 to 1,800 acres. The base-case break-even is already about the most one drone can spray in one window. Under the 2026 cost scenarios, reaching break-even takes more than one window a year: a soybean R3 pass, a wheat heading pass, or cover-crop seeding.
Ground Truth: Before any drone quote, count the farm's "drone-only" acres. Those are the passes the ground rig can't make because the crop is too tall, the ground too wet, or the tracks too costly. If that count is under about 1,000 acres a year in a typical season, hire. Between 1,000 and 2,400, ownership depends on insurance and the hardware price actually paid, so get both in writing first. Above 2,400 acres, spread over at least two separate spray windows, ownership beats hired drone rates at almost any 2026 price. That farm is also close to running a custom business of its own, with the certificate and liability exposure that comes with it.
5. Where drones actually win
What's new: Three situations turn the drone's higher per-acre cost into a return: late-season tall corn, wet ground, and late soybeans where wheel tracks cost yield. Growers and operators cite the timing benefit most. A grower told DTN that timeliness is the main advantage, spraying "right after a rain" when a ground rig would rut (DTN, Aug 5, 2026). Industry has also put a figure on the operator base. More than 16.4 million acres were drone-treated in 2025, up 58.7% (American Spray Drone Coalition, Jan 2026). Manned aircraft treat about 127 million acres of cropland a year, roughly 28% of U.S. cropland (NAAA, accessed Sep 17, 2026).
Evidence: Wheel-track losses are the most directly measurable benefit. In University of Wisconsin trials reported by DTN, sprayer tracks made at R3 or later cost soybean yield that the crop could not recover. Losses were 2.5%, 1.9% and 1.3% with 60-, 90- and 120-foot booms (DTN, Jul 10, 2014).
| Situation | Drone gain or cost vs alternative | $/acre | Basis |
|---|---|---|---|
| Soybeans at R3–R5, 60-ft boom tracks avoided | 2.5% of 52.8 bu at $12.00 | +15.84* | Wisconsin track-loss rate |
| Soybeans at R3–R5, 90-ft boom tracks avoided | 1.9% of 52.8 bu | +12.04* | Wisconsin track-loss rate |
| Soybeans at R3–R5, 120-ft boom tracks avoided | 1.3% of 52.8 bu | +8.24* | Wisconsin track-loss rate |
| Corn fungicide, heavy disease, drone vs ground rig | +2 bu at $4.80 | +9.60* | Beck's 2025 plots, one season |
| Hired drone vs hired plane, Iowa | $12.50 − $12.00 | −0.50 | Iowa survey |
| Hired drone vs hired self-propelled tall-crop rig, Iowa | $12.50 − $11.15 | −1.35 | Iowa survey |
| Hired drone vs owned 120-ft self-propelled rig | $12.50 − $6.10 | −6.40 | Iowa survey; farmdoc |
Sources: DTN/Progressive Farmer, Jul 10, 2014 (Wisconsin wheel-track data); USDA 2026/27 soybean yield of 52.8 bu/acre and season-average prices of $12.00 soybeans and $4.80 corn (WASDE via High Plains Journal, Sep 14, 2026); Dobberstein, Precision Farming Dealer, Jan 22, 2026; Iowa State University A3-10, Mar 2026; farmdoc, 2025. *Crop Root Zone estimates. The track-loss rates are over a decade old and come from narrower booms than many farms now run. The Beck's result is one company's plots in one high-disease season, with no significance test reported.
The ledger explains where the market has gone. Against an owned ground rig, a hired drone starts $6.40 an acre behind. It closes that gap only when it saves about a bushel of late soybeans, when disease is heavy enough for application timing to pay, or when the ground rig can't go at all. Against a plane, the gap is 50 cents in Iowa and 14 cents in Ohio, so the choice comes down to scheduling. When every corn grower in a county wants a fungicide pass the same week, the applicator who can start earliest wins the work.
Ground Truth: The best 2027 plan for most corn-soybean farms is a mix. Keep the ground rig for burndown, pre-emergence and early post-emergence herbicides. Book a certificated drone or aerial operator in writing before July for the VT–R1 corn fungicide pass and any R3 soybean pass on narrow-boom or thin-stand fields. Keep a drone option for fields that are wet when the window opens. Buying makes sense only where a farm can show about 1,000 to 2,400 drone-only acres a year across more than one window. With new foreign-made supply restricted and duties at 100%, the drones already in local fleets are the lowest-cost capacity available for 2027.
References
- Iowa State University Extension and Outreach, Ag Decision Maker File A3-10, "2026 Iowa Farm Custom Rate Survey," revised Mar 2026 — https://www.extension.iastate.edu/agdm/crops/pdf/a3-10.pdf
- American Spray Drone Coalition, "2025 U.S. Agricultural Spray Drone Industry Survey: Growth, Efficiency, and Market Dynamics," Jan 2026 — https://americanspraydronecoalition.com/wp-content/uploads/2026/01/2025-ASDC-Impact-Survey-Results.pdf
- Watson, E., "New FCC proposal could 'retroactively ban' some existing ag spray drones, warns DJI," AgFunderNews, Aug 7, 2026 — https://agfundernews.com/new-fcc-proposal-could-retroactively-ban-some-existing-ag-spray-drones-warns-dji
- KPMG, "United States imposes Section 232 tariffs on unmanned aircraft systems (drones) and components," TaxNewsFlash, Aug 2026 — https://kpmg.com/us/en/taxnewsflash/news/2026/08/united-states-section-232-tariffs-drones-components.html
- Ward, B.; Richer, E.; Barker, J.; Bennett, A., "Ohio Farm Custom Rates 2026," Ohio State University Extension, Jun 2026 (release post Jun 26, 2026) — https://farmoffice.osu.edu/sites/aglaw/files/site-library/Ohio%20Farm%20Custom%20Rate%20Summary%202026%20June%2029.pdf
- McClure, G.; Jansen, J., "Nebraska Agricultural Custom Rates 2026," Nebraska Extension EC823, Apr 24, 2026 — https://cap.unl.edu/sites/unl.edu.ianr.agecon.center-for-ag-profitability/files/media/file/2026-nebraska-custom-rates-report_ada.pdf
- Kansas Department of Agriculture and Kansas State University Land Use Survey Office, "Kansas Custom Rates 2026," 2026, accessed Sep 17, 2026 — https://www.agmanager.info/sites/default/files/pdf/CustomRates_2026.pdf
- DJI Agriculture, "AGRAS T50 Specs," accessed Sep 17, 2026 — https://ag.dji.com/t50/specs
- Ozkan, E., "Drones for Spraying Pesticides—Opportunities and Challenges," Ohio State University Extension fact sheet FABE-540, Jan 17, 2024 — https://cfaes.osu.edu/fact-sheet/drones-spraying-pesticides-opportunities-and-challenges
- Golden Harvest (Syngenta), "The Basics About Drones for Fungicide Application," 2024 — https://www.goldenharvestseeds.com/agronomy/articles/the-basics-about-drones-for-fungicide-application
- farmdoc, University of Illinois, "Machinery Cost Estimates: Field Operations," 2025 — https://farmdoc.illinois.edu/assets/management/machinery-costs/field_operations_2025.pdf
- National Agricultural Aviation Association, "Industry Facts, Environmental Benefits and FAQs," accessed Sep 17, 2026 — https://www.agaviation.org/about/about-ag-aviation/industry-facts-faqs/
- Wallace, J.; Mazzone, T.R., "Herbicide Applications with Drones: Stay On-Label and On-Target!," Penn State Extension, updated Jan 27, 2026 — https://extension.psu.edu/herbicide-applications-with-drones-stay-on-label-and-on-target
- Purdue University Extension, PPP-154, "Current Challenges of Using Spray Drones," page modified May 27, 2026 — https://ag.purdue.edu/department/extension/ppp/resources/ppp-publications/mobile/ppp-154/4.current-challenges-of-using-spray-drones.html
- Telenko, D.; Mizuno, M., "Evaluation of Drone Technology for Foliar Disease Management in Indiana Soybean and Corn," Purdue Field Crop Pathology, 2023 trials, accessed Sep 17, 2026 — https://indianafieldcroppathology.com/research/drone/
- Wise, K.; Stombaugh, T.; Barlow, W., "Ground-Truthing Drone Fungicide Efficacy," University of Kentucky Research and Education Center, Apr 30, 2025 — https://ukrec.mgcafe.uky.edu/articles/ground-truthing-drone-fungicide-efficacy
- Dobberstein, J., "Drones Proving Valuable for Applying Fungicides," Precision Farming Dealer, Jan 22, 2026 — https://www.precisionfarmingdealer.com/articles/6941-drones-proving-valuable-for-applying-fungicides
- Jenkins, J., "Spray Drones Offer Solid ROI With Better Application Timing, Improving Autonomous Workflows," DTN/Progressive Farmer, Aug 5, 2026 — https://www.dtnpf.com/agriculture/web/ag/equipment/article/2026/08/05/spray-drones-offer-solid-roi-better
- Federal Aviation Administration, "Normalizing Unmanned Aircraft Systems Beyond Visual Line of Sight Operations" (proposed rule), Federal Register, Aug 7, 2025 — https://www.federalregister.gov/documents/2025/08/07/2025-14992/normalizing-unmanned-aircraft-systems-beyond-visual-line-of-sight-operations
- The Flight Brief, "Part 108 Nears Publication, FAA Says," updated Sep 14, 2026 — https://www.theflightbrief.com/articles/faa-part-108-bvlos-update-september-2026
- McNabb, M., "Military or Farm Tool? FCC's Proposed Drone Categories Blur the Line," DroneLife, Jul 30, 2026 — https://dronelife.com/2026/07/30/fcc-agricultural-spray-drones-proposal/
- University of Missouri Extension, G1274, "Economics of Drone Ownership for Agricultural Spray Applications," Mar 2025 — https://extension.missouri.edu/publications/g1274
- Smith, P., "Sprayer Tracks Cut Yield," DTN/Progressive Farmer, Jul 10, 2014 — https://www.dtnpf.com/agriculture/web/ag/perspectives/blogs/production-blog/blog-post/2014/07/10/sprayer-tracks-cut-yield
- High Plains Journal, "USDA lowers corn production forecast, raises soybean price outlook" (September 11 WASDE), Sep 14, 2026 — https://hpj.com/2026/09/14/wasde-report-sept-11/
Disclosures
Crop Root Zone is an independent publication. Nothing here is investment advice. Market calls, where included, reflect the editors' own read and are not a recommendation to buy or sell any security.
A 40-Foot Tile Job Now Costs About $1,470 an Acre and Needs 24 Bushels of Corn a Year to Carry at 6.8%. Iowa's Most Conservative Trial Measured 13.
Built from Iowa State's 2026 custom tiling rate, NC State's per-foot costs and a plastic pipe index up 4.6% in a year, pattern tile runs roughly $780 to $2,370 an acre depending on spacing. At farmdoc's $5.00 corn and $12.00 soybeans and a 6.79% land-loan rate, a 40-foot job pays back in about 18 years on somewhat poorly drained ground and never on the 13-bushel corn response Iowa State measured over nine years. Wider spacing, full expensing and controlled drainage change the math more than this fall's pipe price does.
The tile plows are going back out behind the combines, and the numbers they have to earn changed this week. On Sept. 16 the Federal Open Market Committee raised its target range by a quarter point to 3.75% to 4.00%, a unanimous vote (Federal Reserve Board, Sep 16, 2026). The same day, December corn settled at $5.34¼ and November soybeans at $13.20½ (Brownfield Ag News, Sep 16, 2026). The producer price index for plastics pipe, which had been falling since mid-2022, jumped 5.4% between April and May and stood 4.6% above a year earlier in August (U.S. Bureau of Labor Statistics via FRED, accessed Sep 17, 2026). A pattern-tile job signed this fall is a 30-to-50-year asset priced on this year's pipe, this year's interest rate and a guess at the yield response. This piece builds a 2026 cost per acre from public extension figures, sets it against the long-running university yield trials, and shows how many years the investment takes to pay back at current prices and rates, and how quickly that number moves.
1. What a tile acre costs in 2026
What's new: Iowa State's 2026 custom rate survey puts tile plowing, excluding materials, at an average of $1.15 a foot, with a median of $1.00 and a range of $0.50 to $1.75 across 12 responses (ISU Ag Decision Maker A3-10, Mar 2026). That is the most current public installation rate we found for the Corn Belt. It is a small sample of custom operators. Large pattern-tile contractors usually quote a job by the acre, not the foot.
Evidence: North Carolina State Extension publishes a per-acre table built from $0.47 a foot for 4-inch perforated tubing without fabric wrap and $0.60 a foot for installation, last revised in February 2025 (Poole, Youssef and Skaggs, NC State Extension, Feb 19, 2025). Southern installation labor is cheaper than the Iowa survey average, so the table below treats the NC State figure as a low case. For a high case, we pair Iowa's $1.15 installation rate with the NC State pipe price, indexed by the change in plastics pipe producer prices from February 2025 to August 2026 (up 1.8%). That gives $1.63 a foot. Lateral footage per acre is 43,560 square feet divided by spacing.
| Lateral spacing | Feet per acre | Low case, $1.07/ft | High case, $1.63/ft | Midpoint | |
|---|---|---|---|---|---|
| 30 ft | 1,452 | 1,554 | 2,365* | 1,960* | ██████████ |
| 40 ft | 1,089 | 1,165 | 1,774* | 1,470* | ████████ |
| 60 ft | 726 | 777 | 1,182* | 980* | █████ |
| 80 ft | 545 | 583 | 887* | 735* | ████ |
Sources: NC State Extension, Feb 19, 2025 (low case, $/acre as published for 30, 40, 60 and 80 ft without fabric); ISU Ag Decision Maker A3-10, Mar 2026 (installation rate); BLS PPI series PCU3261223261221 via FRED, accessed Sep 17, 2026 (pipe index). *Crop Root Zone estimate. Laterals only: mains, outlets, surface inlets, design, surveying and any fabric wrap are extra. Bars scale the high case.
These figures agree with what older benchmarks imply once they are brought forward. In 2017, an Iowa State farm management specialist put 4-inch tile at about 80 cents a foot installed by wheel machine, with plowed-in tile at roughly half that (Wallaces Farmer, Apr 20, 2017). Plastics pipe producer prices are up 73% since April 2017. Indexing the whole 80 cents by that change gives about $1.39 a foot. That is crude, because the pipe index says nothing about labor, but it lands inside our range. farmdoc daily's 2022 break-even work used $1,000 an acre as its base case (Schnitkey et al., farmdoc daily, Nov 29, 2022). At 2026 costs, $1,000 buys roughly 60-foot spacing.
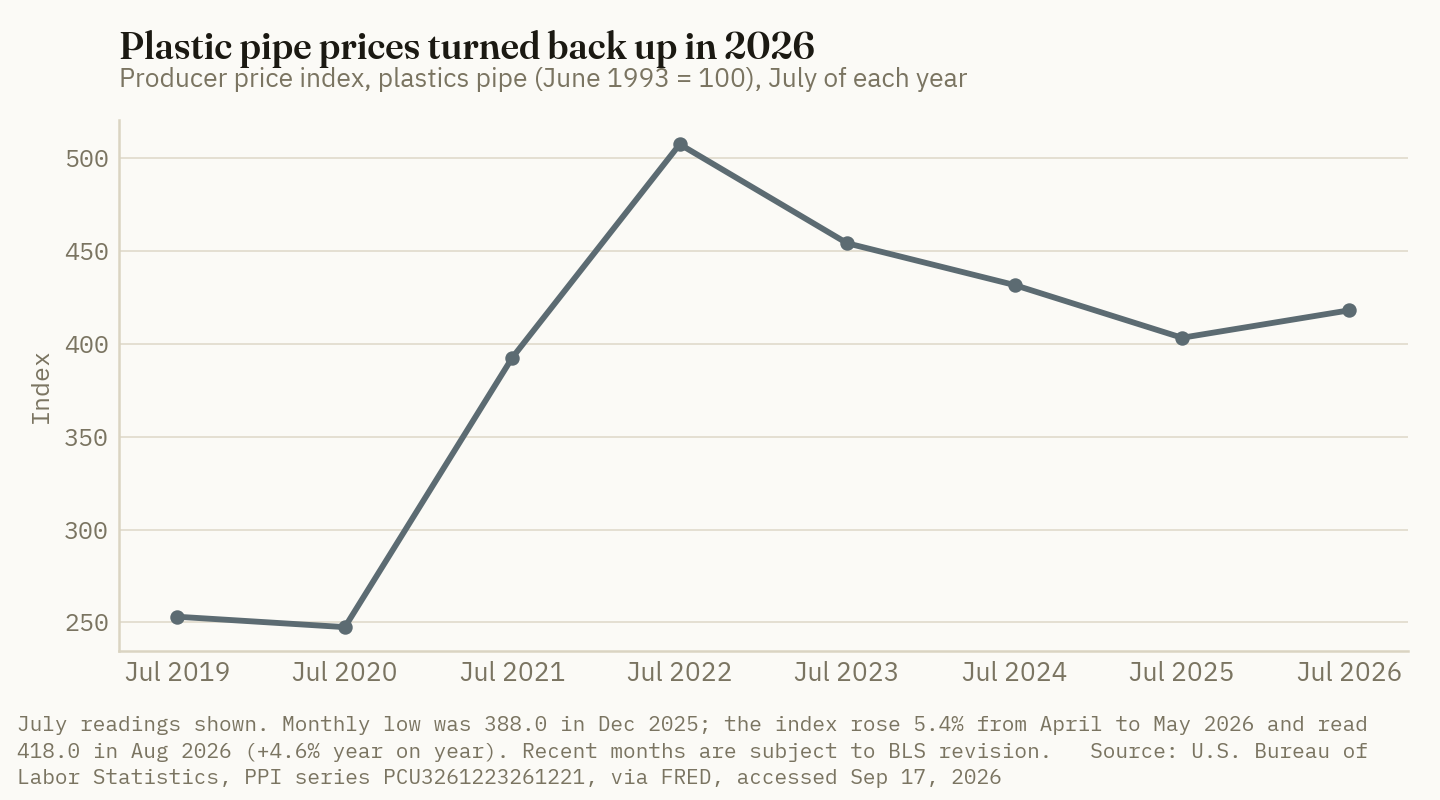
The pipe index peaked at 507.5 in July 2022, fell to 388.0 by December 2025, and read 418.0 in August 2026. It is still 18% below the peak and about 70% above January 2020 (BLS via FRED, accessed Sep 17, 2026).
Ground Truth: Spacing sets the price of the job. The pipe market does not. On the high case, pipe is about 29% of the cost of a lateral foot, so a further 5% rise in pipe prices adds roughly $26 an acre to a 40-foot job. Moving from 60-foot to 40-foot spacing adds about $490 an acre at the midpoint. A grower hurrying to sign before the next pipe increase is watching the smaller number. The quote to question is the spacing, and whether the soil's drainage class and permeability justify it.
2. What the long-term trials say tile returns
What's new: The strongest long-running independent evidence comes from three land-grant sites: Purdue's Southeast Purdue Agricultural Center in Indiana, Ohio State's Hoytville silty clay plots, and Iowa State's Southeast Research Farm. They agree that tile raises corn yields on poorly drained ground. They do not agree on how much, or on soybeans.
Evidence: Purdue's 37-year SEPAC trial compared 5-, 10- and 20-meter drain spacing (about 16, 33 and 66 feet) with undrained plots. Drainage raised corn yields by 12% to 17% but had no significant effect on soybeans. Corn yields in the undrained plots were flat over the 37 years, while yields in the drained plots kept rising (Rui, Goller and Kladivko, Agronomy Journal, Jun 28, 2024).
| Study | Site and period | Corn response | Soybean response | Note |
|---|---|---|---|---|
| Purdue SEPAC | SE Indiana, 1984–2020 | +12% to +17% | Not significant | Benefit grew in later years |
| Ohio State | Hoytville silty clay, 25 years | +24% to +39% | +13% to +46% | 30% average, both crops |
| Iowa State, Southeast Research Farm | 60-ft, 4-ft deep drains, 9 years | +13 bu/acre | +6 bu/acre | Reported as likely conservative |
| Iowa State rule of thumb | Moderately well to somewhat poorly drained | +12 bu/acre | +5 bu/acre | Planning figure |
| Iowa State rule of thumb | Somewhat poorly drained | +30 bu/acre | +12 bu/acre | Planning figure |
| Iowa State rule of thumb | Very poorly to poorly drained | +54 bu/acre | +18 bu/acre | Planning figure |
| University of Minnesota | Crookston, 2020 (wet year) | Not grown | 40 vs 34 bu/acre | Drained wheat trailed by 2 bu in dry 2023 |
Sources: Rui, Goller and Kladivko, Agronomy Journal, Jun 28, 2024; Clevenger, Ohio Ag Manager (Ohio State), Jan 4, 2013; Wallaces Farmer, Mar 24, 2017 (Iowa State Southeast Research Farm); Wallaces Farmer, Apr 20, 2017 (Iowa State rules of thumb); Agweek, May 26, 2026 (University of Minnesota Northwest Research and Outreach Center).
The report on the Iowa State trial called the 13- and 6-bushel figures likely conservative, because the undrained plots sat next to drained plots and all plots were planted on the same day (Wallaces Farmer, Mar 24, 2017). On a real farm, tile also buys earlier planting. The Minnesota results show the other side: in dry years the response can be zero or slightly negative (Agweek, May 26, 2026).
Ground Truth: The yield response is a property of the soil, not a property of tile. The rule-of-thumb figures depend on drainage class, so the first document to pull before a quote is the county soil survey's drainage class for the field, not the contractor's brochure. On ground that is only moderately well drained, budget the conservative 13 and 6 bushels. Purdue's finding that the benefit grew over 37 years supports the long-run case, but it does nothing for a loan's first ten payments.
3. Payback at today's prices and interest rates
What's new: The money costs more than it did last week. Seventh District lenders reported an average farm real estate loan rate of 6.79% at the end of June, with operating loans at 7.12% (Federal Reserve Bank of Chicago, AgLetter, Aug 2026). That survey came before the Sept. 16 increase. USDA's direct farm ownership rate for September is 6.000%, and its joint-financing rate is 4.000% (USDA FSA, Sep 1, 2026).
Evidence: The payback model uses farmdoc's 2027 central Illinois price assumptions of $5.00 corn and $12.00 soybeans, which are based on 2027 harvest futures adjusted for basis. It deducts farmdoc's $28-an-acre drying and storage cost over 245 bushels, or about $0.11 a bushel, from the extra corn (farmdoc daily, Sep 1, 2026). The rotation is half corn and half soybeans. Discounted payback counts the years until the discounted yield benefit repays the cost. "Never" means the yearly benefit does not cover interest on the full cost, so the balance never shrinks.
| Yield response, corn / soy (bu/acre) | Basis | Annual benefit, $/acre | Simple payback, yr | At 6.00% | At 6.79% | At 8.50%* |
|---|---|---|---|---|---|---|
| 13 / 6 | Iowa State, measured | 67.76 | 21.7 | never | never | never |
| 20 / 8* | Interpolated | 96.86 | 15.2 | 41.4 | never | never |
| 30 / 12 | Somewhat poorly drained | 145.29 | 10.1 | 16.0 | 17.7 | 24.1 |
| 54 / 18 | Very poorly drained | 239.91 | 6.1 | 7.9 | 8.2 | 9.0 |
Crop Root Zone estimate on a $1,470/acre 40-ft job (Section 1 midpoint). Prices from farmdoc daily, Sep 1, 2026; yield responses from Wallaces Farmer, Mar 24 and Apr 20, 2017; rates from USDA FSA, Sep 1, 2026 and Federal Reserve Bank of Chicago, Aug 2026. *The 20/8 response and the 8.50% rate are scenarios, not published figures. Excludes repairs, extra seed and fertilizer on higher yields, and any land-value gain.
24 bu corn, 10 bu soybeans
Yearly yield response a $1,470 40-ft tile acre needs to cover a 30-year recovery at 6.79%, about $116 an acre a year. Over 50 years, the requirement falls only to $104. (Crop Root Zone estimate from NC State Extension, Iowa State, farmdoc daily and Federal Reserve Bank of Chicago)
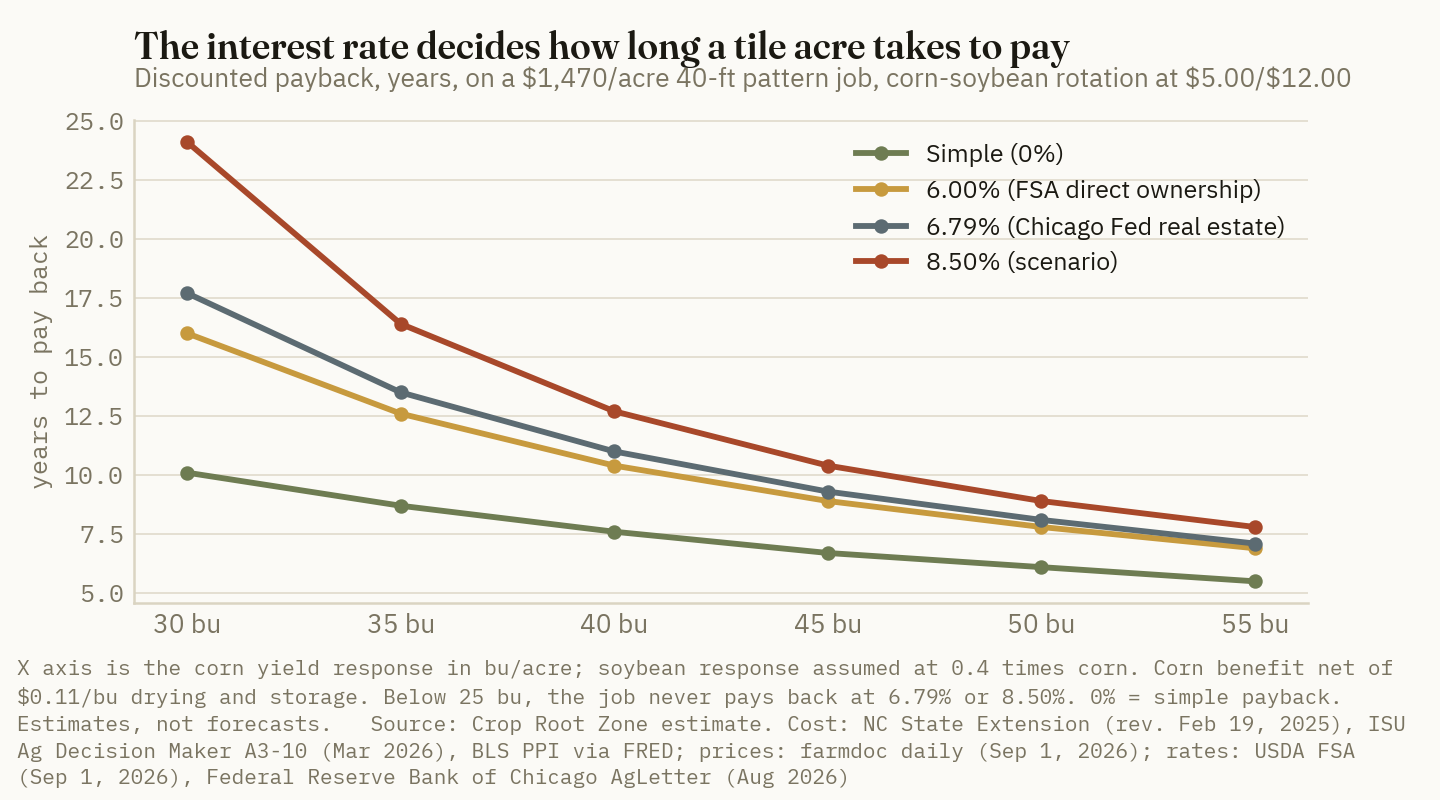
Spacing moves the answer as much as the rate does. On somewhat poorly drained ground (30/12) at 6.79%, a 60-foot job at $980 pays back in 9.3 years, a 40-foot job at $1,470 in 17.7 years, and a 30-foot job at $1,960 in 37.7 years. With the interpolated 20/8 response, only the 60-foot job pays back at all, in 17.7 years (Crop Root Zone estimate).
Crop prices matter less than a quarter point of interest might suggest, because the yield response carries most of the weight. Holding the 30/12 response and the $1,470 cost at 6.79%:
| Price case, corn / soybeans | Annual benefit, $/acre | Simple payback, yr | Discounted payback at 6.79%, yr | |
|---|---|---|---|---|
| Stress case, $4.25 / $10.50* | 125.04 | 11.8 | 24.4 | ██████████ |
| USDA 2026/27 season average, $4.80 / $12.00 | 142.29 | 10.3 | 18.4 | ████████ |
| farmdoc 2027 budget, $5.00 / $12.00 | 145.29 | 10.1 | 17.7 | ███████ |
| Dec/Nov 2026 futures, Sep 16, $5.34¼ / $13.20½ | 157.65 | 9.3 | 15.3 | ██████ |
Sources: High Plains Journal, Sep 14, 2026 (September WASDE season-average prices); farmdoc daily, Sep 1, 2026; Brownfield Ag News, Sep 16, 2026 (futures, no basis deducted). *Stress case is a Crop Root Zone scenario. Bars scale discounted payback.
Ground Truth: Simple payback flatters tile by nearly half. The 10-year figure a partial budget produces becomes 18 years once the money costs 6.79%. That is longer than most growers hold a note, and longer than many rent the ground. Two decisions follow. First, a tenant should not tile rented ground on the 30/12 response without a lease long enough to recover it, or a landlord cost share. Second, on the 30/12 case, borrowing at FSA's 6.000% direct ownership rate instead of 6.79% takes about 2 years off payback, and money at the 4.000% joint-financing rate takes about 4½ years off (13.2 years), for growers and projects that qualify. For tile, the rate on the note matters more than the next dollar in corn futures.
4. Depreciation: expensing helps less than it looks
What's new: Farm drainage tile is 15-year MACRS property under the General Depreciation System, depreciated by 150% declining balance or straight line, or over 20 years straight line under the Alternative Depreciation System. Materials and labor together form the basis. Tile does not qualify as a Section 175 soil and water conservation expense, and when the land is sold, prior depreciation is recaptured as ordinary income under Section 1245 (Clevenger, Ohioline OAM-1, Aug 16, 2012). The 2025 tax law made 100% bonus depreciation permanent for property acquired after Jan. 19, 2025 (IRS, Jan 14, 2026) and raised the Section 179 limit to $2.5 million with a $4 million phase-out threshold (American Farm Bureau Federation, Jul 17, 2025). Growers still working from older extension material should note that Iowa State's tile economics page, last updated in May 2023, still shows bonus depreciation phasing down to 20% in 2026 (Leibold and Johanns, ISU Ag Decision Maker C2-90, May 2023).
Evidence: If the whole cost is expensed in the first year and the extra crop income is taxed at the same marginal rate later, the tax code pays the same share of the cost as it takes of the return. Simple payback does not change. What does change is the discount rate, because farm interest is deductible, so the after-tax cost of money is the loan rate times one minus the tax rate.
| Marginal tax rate | After-tax rate on a 6.79% loan | 13 / 6 | 20 / 8* | 30 / 12 | 54 / 18 | Year-one tax saved, $/acre |
|---|---|---|---|---|---|---|
| 0% | 6.79% | never | never | 17.7 | 8.2 | 0 |
| 25%* | 5.09% | never | 29.8 | 14.6 | 7.5 | 368 |
| 35%* | 4.41% | 73.1 | 25.7 | 13.7 | 7.3 | 515 |
Crop Root Zone estimate: discounted payback in years on a $1,470/acre 40-ft job at $5.00/$12.00. *Tax rates are illustrative combined federal, state and self-employment rates, not advice. Assumes full expensing in year one, enough taxable income to use it, and the same marginal rate on future benefits. Treatment for a specific operation should be confirmed with a tax adviser.
Ground Truth: Expensing does not rescue a job that fails before tax. It shortens payback by about three to four years on the 30/12 case, and all of that comes through deductible interest, not the deduction itself. The deduction is worth the most when it lands in a year taxed at a higher rate than the years the extra bushels arrive. A grower expecting an unusually high-income 2026 should run that comparison with an adviser before choosing between this fall and next spring. The recapture rule also applies: the deduction is partly a loan from the Treasury that comes due at sale.
5. Nitrate: what tile adds, and what managing it costs
What's new: Tile moves nitrate out of the root zone and into ditches. In 23 monitored fields in northwest Illinois, University of Illinois researchers measured about 14 pounds of nitrate per acre a year under corn and about 7 under soybeans, against an Illinois statewide average of about 15 pounds and a Corn Belt average of 25 to 35. A few high-flow fields lost 50 to 80 pounds (AgriNews, Aug 13, 2026). At Iowa State's Gilmore City site, with 150 to 160 pounds of N applied to corn, average annual losses ranged from 9 to 52 pounds across multi-year periods from 1990 to 2004 (Sawyer, ISU Integrated Crop Management, Jun 13, 2011).
Evidence: At DTN's Sept. 7–11 retail anhydrous price of $0.57 per pound of N (DTN/Progressive Farmer, Sep 16, 2026), 15 pounds of lost N is about $8.55 an acre, and the Gilmore City range is roughly $5 to $30 (Crop Root Zone estimate). The larger cost is the regulatory and downstream exposure, and several practices cut it without giving up the yield gain.
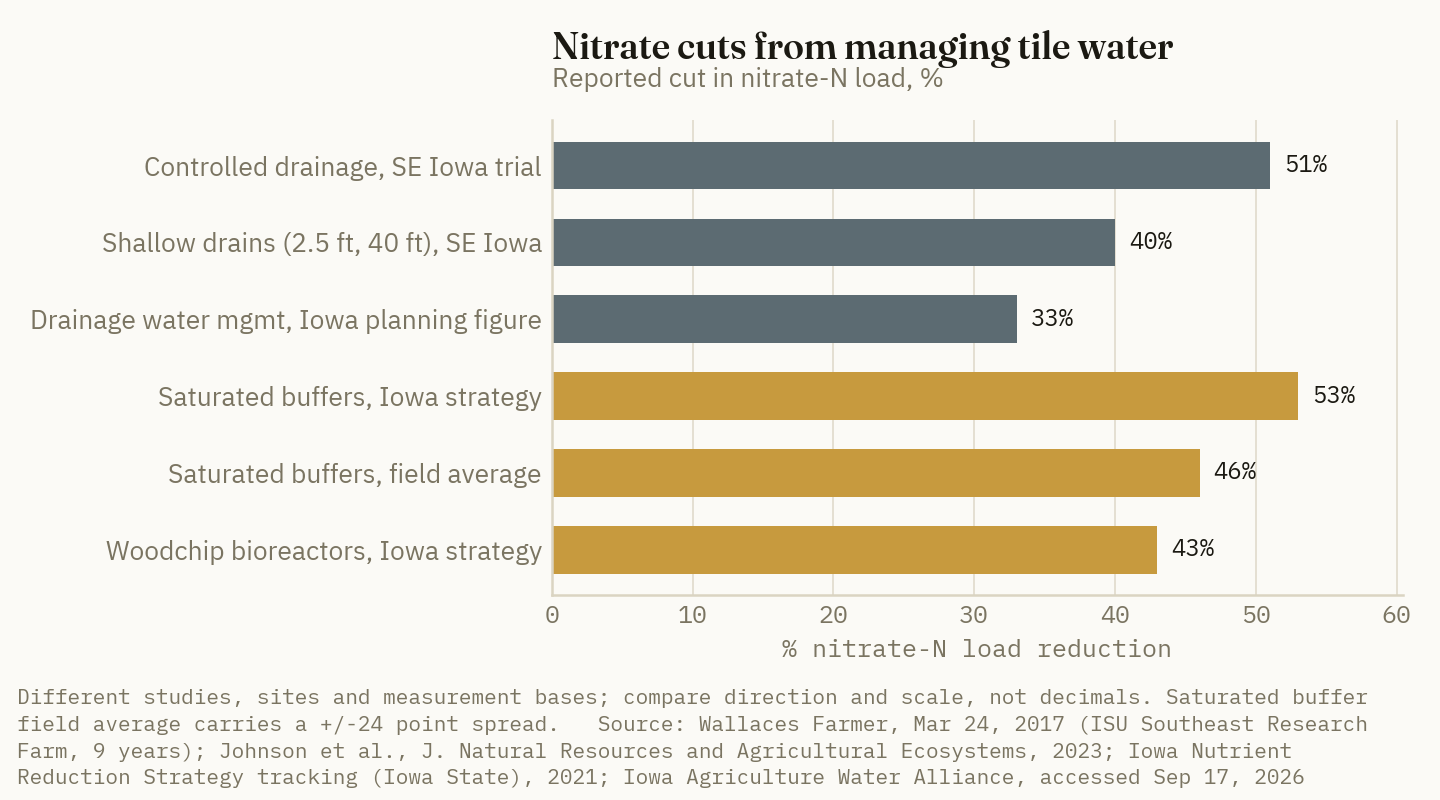
| Practice | Yield effect reported | Cost reported | Fit |
|---|---|---|---|
| Controlled drainage (control structures) | NW Ohio: +3.3% corn, +2.1% soybeans over 23 site-years; SE Iowa: no significant difference | $600–$3,000 per structure; $30–$100/acre | Slopes under about 1% |
| Shallow drains, 2.5 ft deep at 40 ft | SE Iowa: no significant difference from conventional | Closer spacing than 60-ft conventional | Designed in at installation |
| Saturated buffer | None in field | $10–$27/acre treated per year; $2.13/lb N removed | Tile outlet next to a stream buffer |
Sources: Ghane, Fausey et al., Journal of Soil and Water Conservation, Nov 2012; Wallaces Farmer, Mar 24, 2017; Ohio State AgBMPs, Controlled Drainage (NRCS 554), accessed Sep 17, 2026; Iowa Agriculture Water Alliance, accessed Sep 17, 2026; Johnson et al., Journal of Natural Resources and Agricultural Ecosystems, 2023 (via Conservation Drainage Network); Iowa State, Tracking the Iowa Nutrient Reduction Strategy, Aug 6, 2021.
In the nine-year Iowa State trial, controlled drainage cut drainage volume by 48% and nitrate loss by 51%. Shallow drainage cut them by 50% and 40%, and neither changed corn yields significantly from conventional drainage (Wallaces Farmer, Mar 24, 2017). Ohio State describes controlled drainage as cutting nitrogen loads by as much as 22 pounds an acre (Ohio State AgBMPs, accessed Sep 17, 2026). If the northwest Ohio yield gains held on farmdoc's 245-bushel corn and 77-bushel soybean trend yields, they would be worth about $29.50 an acre a year, enough to repay a $30-to-$100 structure cost in roughly one to three and a half years (Crop Root Zone estimate). If the Iowa result holds instead, the structure is a water-quality cost with no yield return.
Ground Truth: On flat ground, controlled drainage is the cheapest nitrate tool attached to a tile job. The shallow-drain alternative needs 40-foot spacing where conventional drains run at 60, about $490 more an acre on our midpoints, for a smaller nitrate cut than a $30-to-$100 control structure delivered in the same trial. The decision has to be made at design, not later: laterals laid along the contour in zones a structure can hold, and mains sized for it. Fields over about 1% slope should budget for a saturated buffer or a bioreactor at the outlet instead. A tile plan that treats nitrate as a later problem is locking in the most expensive fix.
References
- Board of Governors of the Federal Reserve System, "Federal Reserve issues FOMC statement," Sep 16, 2026 — https://www.federalreserve.gov/newsevents/pressreleases/monetary20260916a.htm
- Brownfield Ag News, "Closing Grain and Livestock Futures: September 16, 2026," Sep 16, 2026 — https://www.brownfieldagnews.com/market-news/closing-grain-and-livestock-futures-september-16-2026/
- U.S. Bureau of Labor Statistics, Producer Price Index by Industry: Plastics Pipe and Pipe Fitting Manufacturing: Plastics Pipe (PCU3261223261221), via Federal Reserve Bank of St. Louis FRED, accessed Sep 17, 2026 — https://fred.stlouisfed.org/series/PCU3261223261221
- Iowa State University Extension and Outreach, Ag Decision Maker File A3-10, "2026 Iowa Farm Custom Rate Survey," Mar 2026 — https://www.extension.iastate.edu/agdm/crops/pdf/a3-10.pdf
- Poole, C.; Youssef, M.; Skaggs, W., "Agricultural Subsurface Drainage Cost in North Carolina," NC State Extension, published Jan 10, 2020, revised Feb 19, 2025 — https://content.ces.ncsu.edu/agricultural-subsurface-drainage-cost-in-north-carolina
- Swoboda, R., "Does tiling pay?," Wallaces Farmer / Farm Progress, Apr 20, 2017 (Iowa State's Charles Brown) — https://www.farmprogress.com/farm-operations/does-tiling-pay-
- Schnitkey, G.; Paulson, N.; Baltz, J.; Rhea, B.; Zulauf, C., "Evaluating Returns Necessary to Justify Installation of Tile Drainage," farmdoc daily, Nov 29, 2022 — https://farmdocdaily.illinois.edu/2022/11/evaluating-returns-necessary-to-justify-installation-of-tile-drainage.html
- Clevenger, W.B., "Returns to Farm Drainage," Ohio Ag Manager (Ohio State University Extension), Jan 4, 2013 — https://u.osu.edu/ohioagmanager/2013/01/04/returns-to-farm-drainage/
- Rui, Y.; Goller, B.; Kladivko, E.J., "Long-term crop yield benefits of subsurface drainage on poorly drained soils," Agronomy Journal 116(5), Jun 28, 2024 — https://doi.org/10.1002/agj2.21621
- Swoboda, R., "Drainage design — for profit and water quality," Wallaces Farmer / Farm Progress, Mar 24, 2017 (Iowa State Southeast Research Farm) — https://www.farmprogress.com/farm-business/drainage-design-for-profit-and-water-quality
- Agweek, "Study looks at effects of drain tile on yields and nutrient loss," May 26, 2026 (University of Minnesota, Crookston) — https://www.agweek.com/crops/study-looks-at-effects-of-drain-tile-on-yields-and-nutrient-loss
- Federal Reserve Bank of Chicago, AgLetter, "Second Quarter Midwest Farmland Values Unchanged," Aug 2026 — https://www.chicagofed.org/publications/agletter/2025-2029/august-2026
- USDA Farm Service Agency, "USDA Announces September 2026 Lending Rates for Agricultural Producers," Sep 1, 2026 — https://www.fsa.usda.gov/news-events/news/09-01-2026/usda-announces-september-2026-lending-rates-agricultural-producers
- Paulson, N.; Schnitkey, G.; Zulauf, C.; Zwilling, B., "Illinois Crop Budgets for 2027," farmdoc daily, Sep 1, 2026 — https://farmdocdaily.illinois.edu/2026/09/illinois-crop-budgets-for-2027.html
- High Plains Journal, "USDA lowers corn production forecast, raises soybean price outlook" (September 11 WASDE), Sep 14, 2026 — https://hpj.com/2026/09/14/wasde-report-sept-11/
- Clevenger, W.B., "Depreciation of Farm Drainage Tile," Ohioline OAM-1 (Ohio State University Extension), Aug 16, 2012 — https://ohioline.osu.edu/factsheet/OAM-1
- Internal Revenue Service, "Treasury, IRS issue guidance on the additional first year depreciation deduction amended as part of the One, Big, Beautiful Bill" (Notice 2026-11, IR-2026-06), Jan 14, 2026 — https://www.irs.gov/newsroom/treasury-irs-issue-guidance-on-the-additional-first-year-depreciation-deduction-amended-as-part-of-the-one-big-beautiful-bill
- Munch, D.; Ayoub, S.; Parum, F., "One Big Beautiful Bill Act: Final Agricultural Provisions," American Farm Bureau Federation Market Intel, Jul 17, 2025 — https://www.fb.org/intel/markets/one-big-beautiful-bill-act-final-agricultural-provisions
- Leibold, K.; Johanns, A.M., "Understanding the Economics of Tile Drainage," Iowa State University Ag Decision Maker File C2-90, updated May 2023 — https://www.extension.iastate.edu/agdm/wholefarm/html/c2-90.html
- AgriNews, "Monitoring system evaluates nutrient losses through field tiles," Aug 13, 2026 (University of Illinois, Andrew Margenot) — https://www.agrinews-pubs.com/news/science/2026/08/13/monitoring-system-evaluates-nutrient-losses-through-field-tiles/
- Sawyer, J., "Estimating Nitrogen Losses," Iowa State University Integrated Crop Management News, Jun 13, 2011 — https://crops.extension.iastate.edu/cropnews/2011/06/estimating-nitrogen-losses
- Quinn, R., "Fertilizer Prices Continue Lower for 6 of 8 Major Nutrients," DTN/Progressive Farmer, Sep 16, 2026 (retail survey Sep 7–11, 2026) — https://www.dtnpf.com/agriculture/web/ag/crops/article/2026/09/16/fertilizer-prices-continue-lower-6-8
- Ghane, E.; Fausey, N.R.; Shedekar, V.S.; Piepho, H.P.; Shang, Y.; Brown, L.C., "Crop yield evaluation under controlled drainage in Ohio, United States," Journal of Soil and Water Conservation 67(6), Nov 2012 — https://doi.org/10.2489/jswc.67.6.465
- The Ohio State University, AgBMPs, "Controlled Drainage/Drainage Water Management (NRCS 554)," accessed Sep 17, 2026 — https://agbmps.osu.edu/bmp/controlled-drainagedrainage-water-management-nrcs-554
- Iowa Agriculture Water Alliance, "Drainage Water Management," Conservation Library, accessed Sep 17, 2026 — https://www.iaagwater.org/conservation-library/improve-drainage/drainage-water-management/
- Johnson, G.; Christianson, L.; Christianson, R.; Davis, M.; Díaz-García, C.; Groh, T.; Rogovska, N., "Effectiveness of saturated buffers on water pollutant reduction from agricultural drainage," Journal of Natural Resources and Agricultural Ecosystems, 2023 (summary via Conservation Drainage Network) — https://conservationdrainage.net/effectiveness-of-saturated-buffers-on-water-pollutant-reduction-from-agricultural-drainage/
- Iowa State University, "Accessibility Version: Tracking the Iowa Nutrient Reduction Strategy," Aug 6, 2021 — https://nrstracking.cals.iastate.edu/accessibility-version-tracking-iowa-nutrient-reduction-strategy
Disclosures
Crop Root Zone is an independent publication. Nothing here is investment advice. Market calls, where included, reflect the editors' own read and are not a recommendation to buy or sell any security.
In-Furrow Iron Chelate Needs 1.5 Bushels to Pay on Chlorosis Ground. Minnesota's Trials Gave a Tolerant Soybean 2.2 and a Susceptible One 9.9.
In University of Minnesota strip trials, in-furrow Fe-EDDHA added about 10 bushels to an IDC-susceptible soybean under severe chlorosis and about 2 to a tolerant one. At $12 soybeans and an estimated $6 a pound for the chelate, 3 pounds needs 1.5 bushels, so it clearly pays only on the susceptible variety. That variety is also the one a grower should not plant on severe ground: untreated, the tolerant soybean still out-yielded the treated susceptible one. On a tolerant variety, 50,000 extra seeds and the chelate each rescued a hotspot, and paying for both did not add yield. The decision that sets the IDC bill is the variety-by-zone map, and it is made with this fall's seed order.
On September 8, North Dakota State University published its 2026 iron deficiency chlorosis (IDC) ratings: 90 Enlist, GT27, Roundup Ready, Xtend and conventional soybean varieties, scored 1 to 5 at three growth stages on a site with a history of chlorosis (NDSU via Morning Ag Clips, Sep 8, 2026). The timing is not accidental. The season just ending was a bad IDC year. Cool, wet weather and saturated soils across central North Dakota made symptoms worse (NDSU via Morning Ag Clips, Sep 8, 2026), and by late June yellow fields were "once again" common across central, northwestern and southwestern Minnesota (Minnesota Soybean, Jun 25, 2026). IDC is an old problem with a well-studied toolkit: a tolerant variety, an ortho-ortho Fe-EDDHA chelate dribbled in-furrow at planting, a higher seeding rate, and an oat companion crop. The toolkit is not the question. The question is which of those tools a grower pays for, on which acres, at 2026 seed and soybean prices. Most of that is settled this fall, when the 2027 seed order goes in and the harvest yield map still shows where the yellow spots were.
1. What the problem costs, and why this fall is when it gets managed
What's new: Two replicated University of Minnesota programs now let the tools be priced against each other. The first is a set of six strip trials on calcareous Mollisols in western and central Minnesota, run from 2010 to 2012 and published in Agronomy Journal (Kaiser et al., Oct 29, 2014). The second is a 2021 factorial trial at three western Minnesota farms, six sites in all, that crossed variety tolerance, seeding rate and chelate rate in the same plots (da Silva and Naeve, 2022). Minnesota's check-off funded both. A multistate follow-up led by Seth Naeve at Minnesota and Ana Carcedo at NDSU is now testing variety, chelate, seeding rate and companion crops together on farms (Minnesota Soybean, Jun 25, 2026).
Evidence: The scale is regional but not small. The Minnesota team, citing earlier work, puts soybeans on IDC-prone soils in the North Central states at about 4.45 million acres, with yield losses averaging 12 bushels an acre where it occurs (da Silva and Naeve, 2022, citing Hansen et al., 2004, and Peiffer et al., 2012). At $12 soybeans that is about $144 an acre on affected ground (Crop Root Zone arithmetic). Those acreage estimates are two decades old and should be read as an order of magnitude. U.S. soybean planting rose 5% this year, to 85.4 million acres (USDA NASS, Jun 30, 2026).
The chemistry explains why the fix has to go in at planting. IDC is not a lack of iron in the soil. On soils with pH above about 7.5, calcium carbonate equivalent above 5% and high soluble salts, bicarbonate stops soybean roots from turning ferric iron into a form they can take up (da Silva and Naeve, 2022). Wet soils and high soil nitrate both add bicarbonate at the root. The symptoms show up between the second and seventh trifoliate (NDSU, Jun 30, 2022), which is too late to change the variety, the population or the in-furrow program. Foliar iron applied after symptoms appear has a weak record. In one set of trials, foliar Fe-EDDHA raised yield at one location out of seven (Liesch et al., 2011, as summarized in Kaiser et al., 2014).
Ground Truth: The cheapest IDC data a grower will ever get is on the combine monitor right now. The 2026 yield map shows exactly where chlorosis cost bushels, in a year bad enough to show all of it. Export those zones before the data gets averaged into a whole-field number. Every decision priced below depends on knowing which acres are severe, which are moderate and which are clean. The same fields that turned yellow this June will be the ones to watch when 2027 soybeans go in.
2. What the chelate actually returns: it depends on the variety under it
What's new: The Kaiser trials tested 3 pounds an acre of a 6% Fe-EDDHA product (Soygreen, then sold by West Central Inc. and now a CHS product), mixed in water and applied on the seed through the planter's liquid system. Each field was split into zones by how bad the chlorosis was. They tested it on a susceptible and a tolerant variety, with and without an oat companion crop. Yields are reported relative to the tolerant variety, untreated, in areas with little or no chlorosis (Kaiser et al., 2014).
Evidence: The table converts those relative yields into bushels at the trials' own reference yield. That reference is 2.9 Mg/ha, or about 43 bushels an acre, the average of the four sites where chlorosis was most severe (Crop Root Zone conversion of Kaiser et al., 2014, Tables 2 and 6). The chelate margin prices 3 pounds at an estimated $6 a pound against $12 soybeans.
| IDC severity | Variety | No treatment, % | With in-furrow Fe, % | No treatment, bu/a | With Fe, bu/a | Fe gain, bu/a | Chelate margin, $/a |
|---|---|---|---|---|---|---|---|
| None or low | Susceptible | 110 | 111 | 47.4 | 47.8 | +0.4 | −13 |
| None or low | Tolerant | 100 | 100 | 43.1 | 43.1 | 0.0 | −18 |
| Moderate | Susceptible | 83 | 102 | 35.8 | 44.0 | +8.2 | +80 |
| Moderate | Tolerant | 97 | 100 | 41.8 | 43.1 | +1.3 | −2 |
| Severe | Susceptible | 48 | 71 | 20.7 | 30.6 | +9.9 | +101 |
| Severe | Tolerant | 82 | 87 | 35.3 | 37.5 | +2.2 | +8 |
Source: Kaiser, Lamb, Bloom and Hernandez, Agronomy Journal 106:1963–1974, Oct 29, 2014 (relative yields, Table 6, Sites 1, 2, 3 and 5, no oat treatment). Bushels are Crop Root Zone conversions at the trials' 43.1 bu/a reference. Chelate margin = Fe gain × $12/bu − $18 (3 lb at an estimated $6/lb); both prices are estimates, see Section 4. Relative yield and bushel gains scale with yield potential. At a 60-bushel reference every bushel figure is about 39% larger.
Three things in that table matter more than any single number in it.
First, the chelate works. Under moderate chlorosis it brought the susceptible variety back to 102% of the clean-ground tolerant check, and under severe chlorosis it raised the susceptible variety by about half. When the authors wrote the paper, 3 pounds cost US$12.20 a hectare (about $4.94 an acre). At a soybean price of $367 per tonne (about $10 a bushel), that needed only 33 kg/ha, or half a bushel, to break even, and every measured gain was at least 0.1 Mg/ha (Kaiser et al., 2014).
Second, most of that gain comes from rescuing a variety that should not have been on the ground. Under severe chlorosis the tolerant variety with no treatment yielded 82%. The susceptible variety with the chelate yielded 71%. Adding an oat companion crop to the chelate brought the susceptible variety to 87%, still no better than the tolerant variety could reach. The authors conclude that choosing a tolerant variety "was still the best management strategy" for moderate to severe IDC (Kaiser et al., 2014).
Third, the tolerant variety has a cost where the ground is clean. With little or no chlorosis, the susceptible variety out-yielded the tolerant one by about 10%, roughly 4.3 bushels, or $52 an acre at $12 (Crop Root Zone arithmetic from Kaiser et al., 2014).
| Severe IDC, all eight combinations | Relative yield, % | |
|---|---|---|
| Susceptible, no treatment | 48 | █████░░░░░ |
| Susceptible + in-furrow Fe | 71 | ████████░░ |
| Susceptible + oat | 73 | ████████░░ |
| Tolerant + oat | 76 | ████████░░ |
| Tolerant, no treatment | 82 | █████████░ |
| Susceptible + oat + Fe | 87 | █████████░ |
| Tolerant + in-furrow Fe | 87 | █████████░ |
| Tolerant + oat + Fe | 93 | ██████████ |
Source: Kaiser et al., Agronomy Journal, Oct 29, 2014, Table 6 (Sites 1, 2, 3 and 5; 100 = tolerant variety, untreated, on no-or-low-IDC ground). Bars scale to the largest value.
Ground Truth: A seed dealer's pitch for a high-yield, IDC-susceptible bean "plus Soygreen" on chlorosis ground is true on its own terms: the chelate pays on that bean. But the comparison it leaves out is the tolerant bean with no treatment, which beat it. The right way to price the chelate is to charge the susceptible variety for both the treatment and the yield it still loses. On severe acres, the price is too high. On clean acres, the argument reverses: the susceptible variety's roughly 10% yield edge is worth about $50 an acre, and a field that is mostly clean with a few hotspots is paying that on every acre if it is planted to the tolerant variety wall to wall.
3. Seed or chelate: on a tolerant variety they substitute, they don't stack
What's new: The 2021 Minnesota factorial answered a question the 2014 paper could not: what happens when seeding rate is added as a tool. Two Asgrow varieties, one rated highly tolerant (AG13XF0) and one moderately tolerant (AG12XF1), were planted at 125,000 and 175,000 plants an acre. Each was treated with 0, 2 or 4 pounds of Soygreen in-furrow, with and without 69 pounds of nitrogen used to make chlorosis worse. The trial ran at a hotspot and a less-affected site on each of three farms, with four replications each (da Silva and Naeve, 2022). These are one-year results from a progress report. They show direction, not a published recommendation.
Evidence: The Danvers hotspot is the clearest case.
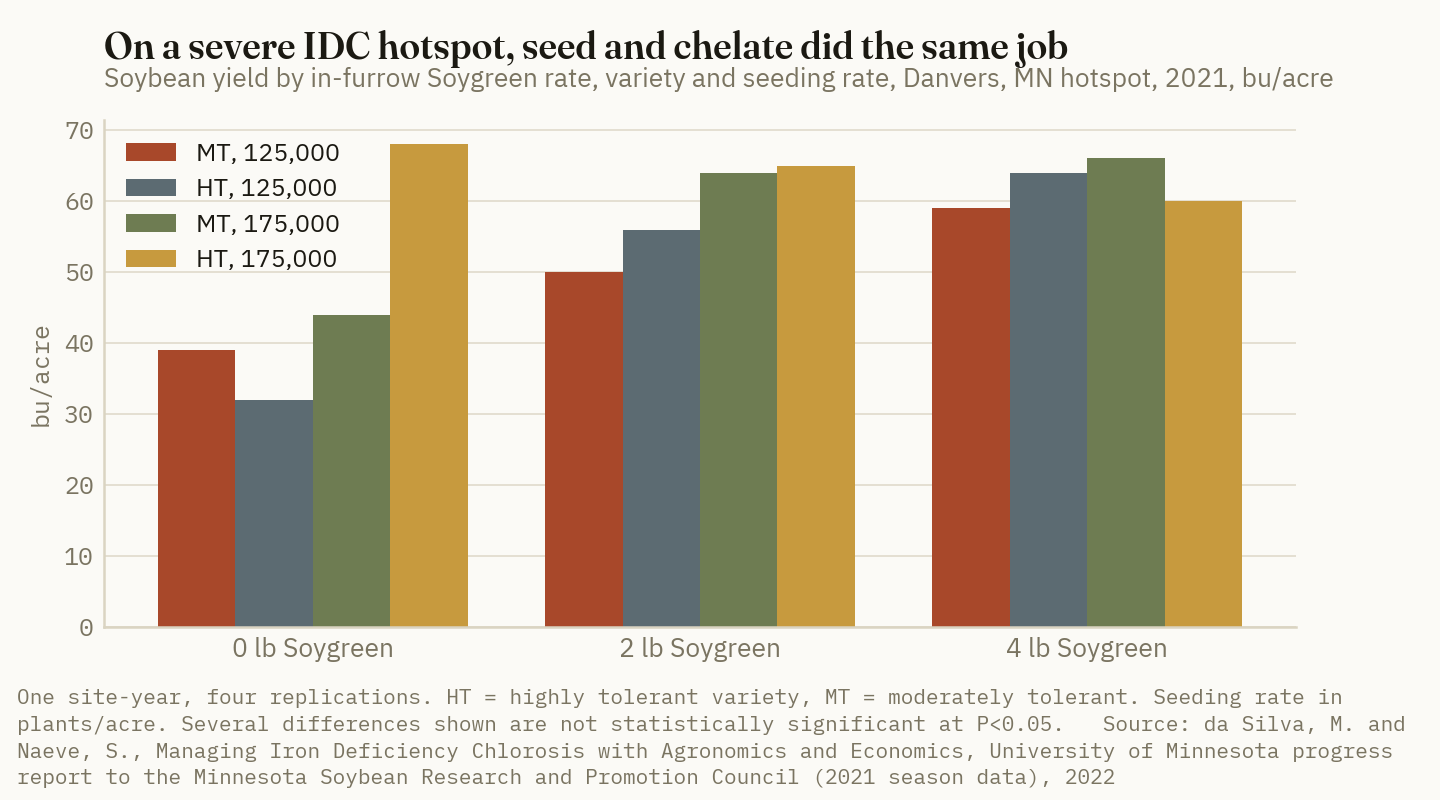
At 125,000 plants and no chelate, the highly tolerant variety yielded 32 bushels, the lowest of the tolerant treatments. Raising the population to 175,000 added 36 bushels and produced the best yield on the hotspot, 68. Adding chelate to the high population did nothing useful: 65 bushels at 2 pounds and 60 at 4. At the low population, the chelate did the same rescue job: 56 bushels at 2 pounds and 64 at 4. The authors' reading is that tolerance alone "is not enough" where IDC is severe. A second tool is needed, "Soygreen application and/or increased seeding rate" (da Silva and Naeve, 2022). The data say "or" more clearly than "and."
Pricing the Danvers treatments shows what that means per acre. Seed is priced at Iowa State's 2026 budget figure of $63.10 per 140,000 seeds, so the extra 50,000 seeds cost $22.54 (Iowa State Extension, Jan 2026). Soygreen is priced at an estimated $6 a pound, and soybeans at $12. Only the treatment costs are subtracted.
| Danvers hotspot, highly tolerant variety | Yield, bu/a | Revenue at $12, $/a | Treatment cost, $/a | Revenue less treatment, $/a |
|---|---|---|---|---|
| 125,000 plants, no chelate | 32 | 384 | 0 | 384 |
| 125,000 plants, 2 lb Soygreen | 56 | 672 | 12 | 660 |
| 125,000 plants, 4 lb Soygreen | 64 | 768 | 24 | 744 |
| 175,000 plants, no chelate | 68 | 816 | 23 | 793 |
| 175,000 plants, 2 lb Soygreen | 65 | 780 | 35 | 745 |
| 175,000 plants, 4 lb Soygreen | 60 | 720 | 47 | 673 |
Source: yields from da Silva and Naeve, University of Minnesota progress report, 2022 (2021 season, Danvers hotspot, Fig. 11); seed cost from Iowa State University Extension, Estimated Costs of Crop Production in Iowa – 2026 (FM 1712, Jan 2026). Soybean price and chelate price are Crop Root Zone estimates. One site-year; several of these yield differences are not statistically significant.
The other hotspot says the same thing more loudly. At Graceville, with no added nitrogen, the moderately tolerant variety yielded 35 bushels untreated and 77 to 80 with chelate. The highly tolerant variety yielded 61 untreated and 75 to 76 with chelate (da Silva and Naeve, 2022). The gain on the tolerant variety was 14 to 15 bushels, or $168 to $180 at $12, against $12 to $24 of product. That is a strong return even on a tolerant variety, although the report notes the tolerant variety's gain was not statistically significant. Where chlorosis is severe, the chelate's return on a tolerant variety runs from a few dollars (Kaiser) to well over $100 (Graceville). The spread depends on the site and the year, and it is why a single trial average should not decide a purchase.
The nitrogen treatment was the warning. At the Graceville site that was not a hotspot, adding N to the moderately tolerant variety cut yield from 69 to 48 bushels with no chelate (da Silva and Naeve, 2022). High residual nitrate turned ground that was normally fine into IDC ground.
Ground Truth: On a tolerant variety, a higher population and an in-furrow chelate are two ways to buy the same thing: enough root activity to take up iron on a high-pH hotspot. Buy the cheaper one for the zone, not both. A grower with a variable-rate planter and zone maps already owns the seeding-rate option, which costs about 1.9 bushels. A grower with an in-furrow liquid system owns the chelate option. The mistake the Danvers data expose is stacking both on the same acre by default, which gave up about $50 to $120 an acre against the best single treatment. There is a September decision here too. Fall manure or fall nitrogen on ground going to soybeans next year, on IDC-prone fields, raises the nitrate that turns moderate zones into severe ones. Put that manure on next year's corn ground instead.
4. Break-evens at 2026 prices, and what is not known
What's new: November soybean futures closed at $13.04 on September 18, up 7 cents on the week (University of Tennessee, Sep 18, 2026). Upper Midwest harvest cash bids trade at a basis below futures. The 2027 crop's price will not be known until it is sold. Soygreen does not publish a list price. The last public per-pound figure found was about $6 a pound, or $18 an acre at 3 pounds (Crop Quest, Jun 2, 2020). In 2022 Naeve described the chelate as "an extra $20 or $30 an acre" (Soybean Research & Information Network, May 2, 2022). The table uses $6 and $8 a pound to bracket 2026 retail. Those are estimates.
Evidence:
| Treatment | Cost, $/acre | Break-even at $11/bu | at $12/bu | at $13/bu |
|---|---|---|---|---|
| Soygreen 2 lb at $6/lb* | 12.00 | 1.09 | 1.00 | 0.92 |
| Soygreen 3 lb at $6/lb* | 18.00 | 1.64 | 1.50 | 1.38 |
| Soygreen 4 lb at $6/lb* | 24.00 | 2.18 | 2.00 | 1.85 |
| Soygreen 3 lb at $8/lb* | 24.00 | 2.18 | 2.00 | 1.85 |
| Soygreen 4 lb at $8/lb* | 32.00 | 2.91 | 2.67 | 2.46 |
| +50,000 seeds/acre | 22.54 | 2.05 | 1.88 | 1.73 |
| Kaiser trial era: 3 lb at US$12.20/ha, soybeans $367/t | 4.94 | — | 0.49 at $9.99 | — |
Sources: seed cost from Iowa State University Extension, FM 1712, Jan 2026 ($63.10 per 140,000 seeds); Kaiser et al., Agronomy Journal, Oct 29, 2014 (trial-era chelate cost and break-even, converted to U.S. units); Crop Quest, Jun 2, 2020 (~$6/lb). *Estimated 2026 chelate price; no 2026 public list price was available. Break-even in bu/acre = cost ÷ soybean price. Assumes an existing in-furrow liquid system and no extra trip.
1.5 bushels
Estimated break-even for 3 pounds of in-furrow Fe-EDDHA at $6 a pound and $12 soybeans. In Minnesota's strip trials the chelate returned 9.9 bushels on a susceptible variety under severe chlorosis and 2.2 on a tolerant one. (Crop Root Zone estimate from Kaiser et al., Oct 29, 2014)
The trials show the chelate got more expensive against the crop. At the Kaiser trials' prices, it needed half a bushel. At the Crop Quest price and $12 beans, it needs one and a half. That still clears easily wherever a susceptible or moderately tolerant variety is under real chlorosis. It is roughly break-even on a tolerant variety in moderate zones, and a loss on clean ground whatever the variety. On-farm industry data run optimistic by comparison. Beck's 2025 Practical Farm Research reported a 7.5 to 8.0 bushel Soygreen response and a return of $53 to $59 an acre on both a more susceptible and a more tolerant variety (Beck's Hybrids, 2025 PFR). That is one company's one-year result at its own sites. It fits the Graceville hotspot better than the Kaiser tolerant-variety average, and it should be read as the upper end of the range, not the midpoint.
Three things remain unclear. The first is the optimum rate. Kaiser et al. said their rate "may be greater than needed," and at Danvers and Graceville 2 pounds did most of the work that 4 pounds did (Kaiser et al., 2014; da Silva and Naeve, 2022). At $6 to $8 a pound, the second 2 pounds is where the money goes. The second is the oat companion crop. It helped the susceptible variety under severe IDC. But when it was terminated late, above about 25 cm, it cut soybean yield by an average of 16% at two of the six Kaiser sites, and by about 25% on those sites' low-IDC ground (Kaiser et al., 2014). Its cost is mostly risk, not seed. The third is prediction. No routine soil test variable predicted where IDC would be severe within a field. The best model in the Kaiser study explained about 20% of the variation (Kaiser et al., 2014). That makes the yield map, not the soil test, the best guide to zones.
Ground Truth: Build the 2027 IDC plan in this order, at this fall's seed order. (1) Use the 2026 yield map and scouting notes to sort each field into clean, moderate and severe zones. (2) Put the highest-yielding variety on the clean zones and a variety with a strong NDSU or company IDC score on the severe zones. A split or multi-variety planter pays for itself here, because the yield edge of the susceptible variety on clean ground is worth about $50 an acre. (3) On severe zones only, buy one rescue treatment for the tolerant variety: 2 pounds of chelate if you run in-furrow liquid, or about 50,000 more seeds if you variable-rate. Do not buy both by default. (4) Keep fall nitrogen and manure off those fields until after soybeans. A wall-to-wall chelate program on a tolerant variety spends $12 to $32 an acre on clean acres, where the trials show no response. That money is better spent on seed genetics matched to the zones.
References
- North Dakota State University Extension, "NDSU Releases 2026 Soybean Iron Deficiency Chlorosis Scores," via Morning Ag Clips, Sep 8, 2026 — https://www.morningagclips.com/ndsu-releases-2026-soybean-iron-deficiency-chlorosis-scores/
- North Dakota State University, "NDSU releases soybean iron deficiency chlorosis scores" (2025 trial, 131 varieties), Aug 14, 2025 — https://www.ag.ndsu.edu/news/newsreleases/2025/august/ndsu-soybean-iron-deficiency-chlorosis-scores-available
- Cabello Leiva, S., "Why are my Soybeans turning yellow? Understanding Iron deficiency chlorosis (IDC) in Minnesota," Minnesota Soybean Research & Promotion Council, Jun 25, 2026 — https://mnsoybean.org/39991-2/
- Kaiser, D.E.; Lamb, J.A.; Bloom, P.R.; Hernandez, J.A., "Comparison of Field Management Strategies for Preventing Iron Deficiency Chlorosis in Soybean," Agronomy Journal 106(6):1963–1974, published Oct 29, 2014, doi:10.2134/agronj13.0296 — https://mssoy.org/sites/default/files/documents/kaiser-2014-aj.pdf
- da Silva, M.; Naeve, S., "Managing Iron Deficiency Chlorosis with Agronomics and Economics," University of Minnesota project report (2021 field season), 2022 — https://www.soybeanresearchdata.com/files/progress5/54292_2022_IDC_Project_Report_comp.pdf
- da Silva, M., "Managing Soybean Iron Deficiency Chlorosis with Agronomics, Economics, and Remote Sensing," M.S. thesis, University of Minnesota, Mar 2023 — https://conservancy.umn.edu/handle/11299/254106
- Soybean Research & Information Network, "Finding the Best Management Strategy Combination in the Iron Deficiency Chlorosis Battle," May 2, 2022 — https://soybeanresearchinfo.com/research-highlight/finding-the-best-management-strategy-combination-in-the-iron-deficiency-chlorosis-battle%EF%BF%BC/
- North Dakota State University, "Iron Deficiency Chlorosis in Soybean" (adapted from Crop & Pest Report), Jun 30, 2022 — https://www.ndsu.edu/agriculture/ag-hub/ag-topics/crop-production/crops/soybeans/iron-deficiency-chlorosis-soybean
- USDA National Agricultural Statistics Service, "Corn planted acreage down 3% from 2025, soybean acreage up 5% from last year," Acreage report news release, Jun 30, 2026 — https://www.nass.usda.gov/Newsroom/2026/06-30-2026.php
- Iowa State University Extension and Outreach, "Estimated Costs of Crop Production in Iowa – 2026," Ag Decision Maker File A1-20 (FM 1712), revised Jan 2026 — https://www.extension.iastate.edu/agdm/crops/pdf/a1-20.pdf
- University of Tennessee Department of Agricultural and Resource Economics, "Crop Comments," Tennessee Market Highlights, Sep 18, 2026 — https://arec.tennessee.edu/extension/tennessee-market-highlights/crop-comments/
- Smith, T., "When Average Won't Cut It – Variable Rate Soygreen Application," Crop Quest, Jun 2, 2020 — https://www.cropquest.com/soygreen-application/
- Beck's Hybrids, "Soybean Iron Deficiency Chlorosis Product Study," Practical Farm Research, 2025 — https://www.beckshybrids.com/resources/pfr-studies/soybean-iron-deficiency-chlorosis-product-study
- Liesch, A.M.; Ruiz Diaz, D.A.; Martin, K.L.; Olson, B.L.; Mengel, D.B.; Roozeboom, K.L., "Management strategies for increasing soybean yield on soils susceptible to iron deficiency," Agronomy Journal 103:1870–1877, 2011 (as summarized in ref. 4)
Disclosures
Crop Root Zone is an independent publication. Nothing here is investment advice. Market calls, where included, reflect the editors' own read and are not a recommendation to buy or sell any security.
A Biosolids Application Now Replaces About $190 an Acre of Fertilizer. On Average Cropland, That Pays Only If the Chance of a PFAS Write-Off Stays Below About 3%.
At September 2026 DTN retail prices, a dry ton of digested biosolids replaces about $63 of first-year N, P, K and S, up from $39 at 2021 prices. At 3 dry tons an acre that is $190 where the soil needs phosphorus and $91 where it does not. EPA has pulled back to voluntary guidance, while Michigan, Maryland, Virginia, Wisconsin and Pennsylvania converge on 20, 25, 50 and 100 ppb PFOS/PFOA tiers. Farm-level risk is concentrated in the small share of sources above those tiers, and a 12-month test average is the cheapest protection a grower has.
On June 29, 2026, EPA's Office of Water signed a draft guidance memorandum on PFOA and PFOS in biosolids. It says the agency's own January 2025 draft risk assessment "exhibited a number of serious flaws" and offers farmers and utilities voluntary recommendations in place of a limit (EPA Office of Water, Jun 29, 2026). Comments are open until October 5, 2026 (EPA, accessed Sep 17, 2026). The federal floor is therefore still Part 503, which does not address PFAS. Meanwhile, five states have written or proposed concentration tiers, two ban land application outright, and Texas has a county disaster declaration and no statute. For the grower, the product has not changed. It is still the cheapest phosphorus and organic matter many farms can get, and it usually arrives free and spread. With urea N at $0.72 a pound and DAP at $923 a ton, its nutrients are worth about 63% more than at 2021 prices. What has changed is the downside. This article prices both sides for an acre.
1. What's new: EPA backs away from the 1 ppb finding
What's new: EPA released its Draft Sewage Sludge Risk Assessment for PFOA and PFOS on January 14, 2025. It found that human health risks could exceed EPA's acceptable thresholds in some modeled scenarios when sludge containing 1 part per billion of PFOA or PFOS is land-applied. The exposed population was a farm family on or near the field, eating its own milk, beef and eggs, drinking its own well water, and eating fish from a farm pond (EPA, FAQ on the draft risk assessment, Jan 2025). Maryland's legislative analysts described the exceedances as "sometimes by several orders of magnitude" in some scenarios, at a concentration "near the current detection limit" (Maryland DLS, Apr 15, 2026).
Evidence: The current administration extended the comment period twice. Then the June 2026 memo set out three objections to the draft: EPA ran no national sludge survey, it modeled only "higher-risk hypothetical scenarios" without estimating how often they occur, and the 1 ppb starting point was misread as a safe level (EPA Office of Water, Jun 29, 2026). The memo's recommendations for bulk land appliers are practices, not numbers:
- avoid application near fishable waters, drinking-water reservoirs and vulnerable groundwater;
- avoid areas where children under 5 have or may have access;
- favor "lower risk crops for human exposure, like farms growing grain, fiber crops, or corn for ethanol production";
- avoid "agricultural practices that have higher risks for human exposures."
The same memo gives the national scale. About 2.3 million dry metric tons of sludge are land-applied each year, on less than 1% of farmland, at a median rate of about 3 dry metric tons an acre. About 60% of all sludge is land-applied: 31.5% on agricultural sites, 20% sold to the public, 1% on reclamation sites and 7% elsewhere (EPA Office of Water, Jun 29, 2026). The court route to a federal limit is also stalled. On September 29, 2025, the D.C. district court dismissed the suit by Johnson County, Texas farmers and others that sought to force EPA to regulate PFAS in sludge. The appeal was briefed in March 2026 and was undecided as of June (MG+M, Jun 12, 2026).
Ground Truth: Don't wait for a federal number. The guidance, if finalized, gives no ppb threshold, and its crop-type advice points in one direction: biosolids belong on grain, fiber and ethanol corn, not on the grazing, dairy-forage and farm-pond operations that drove the modeled risk. A livestock operation taking biosolids on hay or pasture is now doing what EPA's own draft guidance tells land appliers to avoid. That is a fact a plaintiff's lawyer or a milk buyer can use, whatever the final rule says.
2. The state map: tiers at 20, 25, 50 and 100 ppb
What's new: With no federal limit, the working rules are being set in Lansing, Annapolis, Richmond, Madison and Harrisburg. Most borrow Michigan's structure: an action tier that caps the application rate and requires the plant to hunt down its industrial sources, and a higher prohibition tier.
Evidence:
| Jurisdiction | Instrument | Land application prohibited at | Restricted tier | Rate cap in restricted tier | Key date |
|---|---|---|---|---|---|
| Maine | Law, LD 1911 (2022) | All sludge, any PFAS level | — | — | Ban effective Aug 8, 2022 |
| Connecticut | Law, SB 292 (2024) | Sludge containing PFAS | — | — | Enacted 2024 |
| Michigan | EGLE interim strategy | ≥100 ppb PFOS or PFOA | 20 to <100 ppb | 1.5 dry t/acre | 2024 revision in force |
| Maryland | Law, SB 719 (2026) | ≥50 ppb PFOA + PFOS | 25 to <50 ppb | 3 dry metric t/acre, 14-day notice | Oct 1, 2028 |
| Virginia | Law, SB 386 (2026) | ≥50 ppb PFOS or PFOA | 25 to <50 ppb | 3 dry t/acre | Jul 1, 2027 |
| Pennsylvania | Proposed DEP general permits | ≥100 ppb PFOA or PFOS | ≥20 ppb | Reduced; not specified | Comments closed Sep 2, 2026 |
| Wisconsin | Law, Act 201 (2026) | DNR permit conditions | >20 ppb PFOA + PFOS | Set by DNR | Effective Apr 8, 2026 |
| Texas | No PFAS limit; HB 1674 died May 2025 | — | — | — | — |
| Federal (EPA) | Draft voluntary guidance | None | None | None | Comments to Oct 5, 2026 |
Sources: EPA Office of Water draft guidance, Jun 29, 2026 (Maine, Connecticut, Michigan history); Michigan EGLE, accessed Sep 17, 2026; Maryland DLS fiscal note on SB 719, Apr 15, 2026; VACo, Mar 12, 2026; Waste Dive, Jul 21, 2026; Wisconsin Legislative Council, Apr 9, 2026; Texas Tribune, Jun 2, 2025; EPA, accessed Sep 17, 2026. 1 ppb = 1 µg/kg, dry weight.
A few details matter for growers. Michigan has tightened over time: land application was prohibited above 150 ppb PFOS in 2021 and above 100 ppb by 2026 (EPA Office of Water, Jun 29, 2026). Of the 173 Michigan facilities that reported 2024 results, most were below 20 ppb, and 11% fell between 20 and 100 ppb (Michigan EGLE, accessed Sep 17, 2026). Virginia sends landowners the concentration by email or mail and switches to a combined PFOS-plus-PFOA measure on July 1, 2029 (VACo, Mar 12, 2026). Maryland judges compliance on a 12-month average of at least quarterly samples run by EPA Method 1633A, and lets a plant blend sludge down below 25 ppb for up to two years (Maryland DLS, Apr 15, 2026). Maine's ban was the costly one: about 40% of Maine's sludge had been land-applied, against roughly 7% in Connecticut, where about 93% is incinerated (EPA Office of Water, Jun 29, 2026).
Pressure keeps building elsewhere. Oklahoma's SB 3, which would have banned land application by July 1, 2027, passed the Senate in 2025 and died in the House Agriculture Committee. New York now requires composters that use biosolids to test for PFAS (Waste Dive, Jan 28, 2026). In Texas, Rep. Helen Kerwin's HB 1674 would have required monthly PFAS testing of biosolids products and diverted high-testing material to landfill or incineration. It died in committee in May 2025, and she has said she will bring back a broader bill (Texas Tribune, Jun 2, 2025).
Ground Truth: Read the table as a price signal, not a legal map. Tiers at 20 to 50 ppb do not end land application. They split sludge into a large, low-PFAS supply that keeps flowing and a small, high-PFAS supply that utilities must landfill, burn or blend. Where a state has no tier, as in Texas, nothing keeps that second stream off farm fields except the grower's own question: what is this plant's 12-month average?
3. What a dry ton is worth at September 2026 prices
What's new: Retail fertilizer has stayed high into fall. In the second week of September, DTN's survey put urea at $658 a ton ($0.72/lb N), anhydrous at $938 ($0.57/lb N), DAP at $923, MAP at $962 and potash at $494 (DTN, Sep 16, 2026). Biosolids nutrients are priced against those numbers.
Evidence: The most usable public benchmark is PNW 508. Its typical anaerobically digested biosolids analyze 4–7% total N, 1.5–3.5% P, 0.1–0.6% K and 60–80% organic matter, which is 1,200–1,600 lb of organic matter per dry ton. In the first year, a dry ton replaces about 35 lb N, 20 lb P (46 lb P₂O₅), 6 lb K (8 lb K₂O as rounded in the publication) and 7 lb S (PNW 508, Apr 2022). The authors valued that at $38.81 per dry ton at April 2021 Oregon prices. Here it is repriced at September 2026 retail.
| Nutrient, first-year available | lb per dry ton | Price basis, Sep 7–11, 2026 | $/lb | $/dry ton, 2026 | $/dry ton, Apr 2021 (PNW) |
|---|---|---|---|---|---|
| Nitrogen (N) | 35 | Urea, $658/ton | 0.72 | 25.20 | 15.40 |
| Phosphate (P₂O₅) | 45.8 | DAP $923/ton, net of N credit | 0.72 | 32.98 | 18.60 |
| Potash (K₂O) | 7.2 | Potash, $494/ton | 0.41 | 2.97 | 2.64 |
| Sulfur (S) | 7 | 2021 value carried forward | 0.31* | 2.17* | 2.17 |
| Total | 63.32 | 38.81 |
Sources: nutrient availability and 2021 values from PNW 508, Fertilizing with Biosolids, Apr 2022; 2026 prices from DTN retail survey, Sep 16, 2026. Crop Root Zone calculation: P₂O₅ from DAP (18-46-0) after crediting its N at $0.72/lb. MAP on the same basis gives $0.77/lb and $35.27/dry ton. Nitrogen at the anhydrous price ($0.57) gives $19.95. *Estimate: DTN does not survey a sulfur product; the 2021 ammonium-sulfate-based value is carried forward unchanged.
$63 per dry ton
Estimated first-year fertilizer replacement value of digested biosolids at September 2026 retail prices, up about 63% from $39 at 2021 prices. (Crop Root Zone estimate from PNW 508, Apr 2022, and DTN, Sep 16, 2026)
Per acre, two things decide the value: the rate and whether the field needs phosphorus. At the national median of about 3 dry tons an acre, the application supplies about 105 lb of plant-available N. PNW 508 says that can fully replace commercial N for the first grain crop. It also supplies about 137 lb of P₂O₅ that is available in the first year, several times what a crop removes. The publication notes that a crop taking up 100 lb N takes up only 5–20 lb P, and that fields already high in soil-test P are "unlikely to benefit" (PNW 508, Apr 2022). The dollar value of the phosphate therefore depends on the soil test.
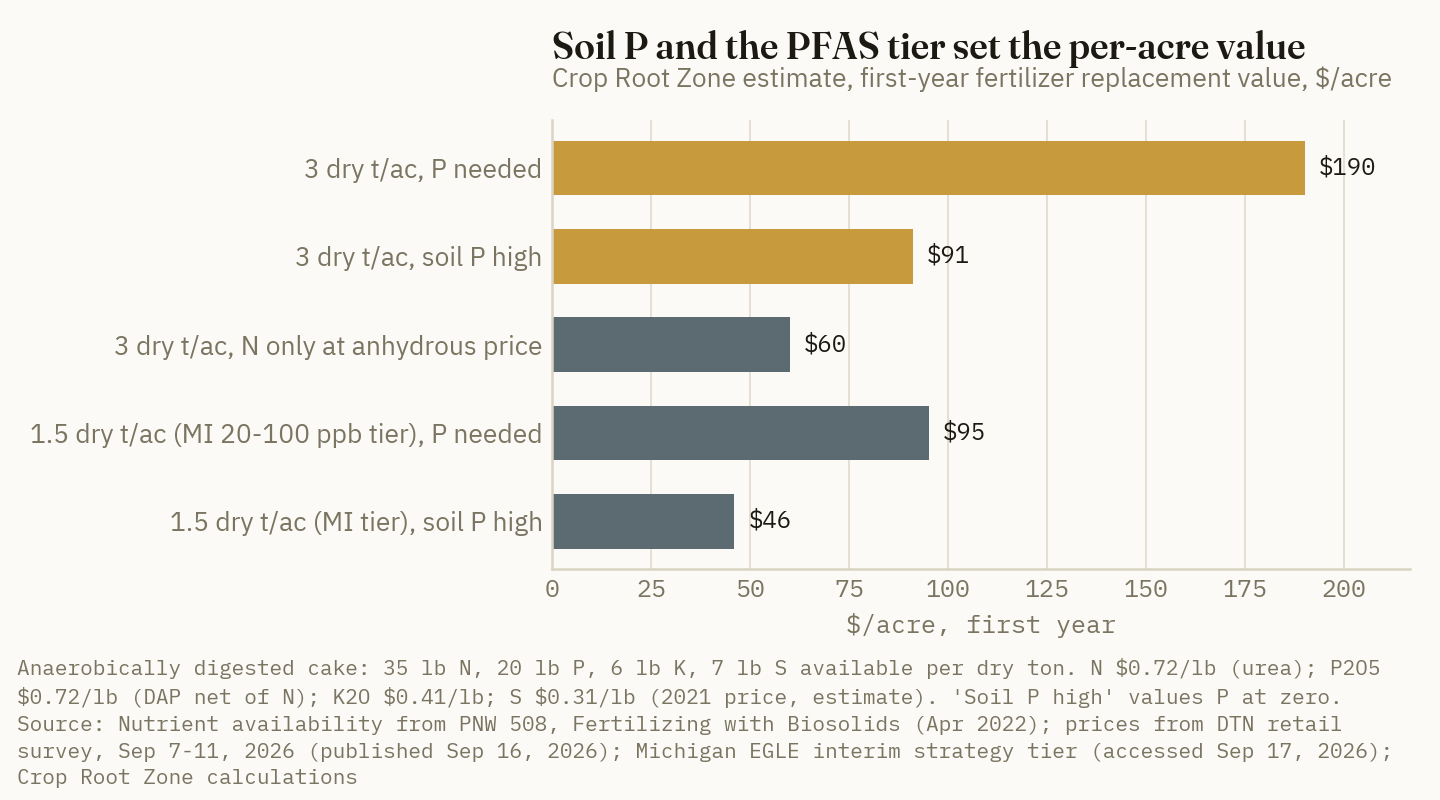
The full nutrient load is larger than the first-year credit. At 5% N and 2.5% P, a dry ton carries about 100 lb N and 115 lb P₂O₅, worth about $164 at the same prices with sulfur estimated. Most of that N is organic and releases over several seasons (Crop Root Zone estimate from PNW 508). The organic matter is real value too. In one central Washington dryland wheat trial, five applications of 3 dry tons an acre over 16 years doubled topsoil organic carbon (PNW 508, Apr 2022). But no one pays cash for it, so it is left out of the per-acre figures here.
Ground Truth: The value of biosolids is mostly a phosphorus story, and phosphorus is where the PFAS tiers bite hardest. A low-P field at 3 dry tons is worth about $190 in the first year. Put the same field under Michigan's 1.5-ton cap for 20–100 ppb material and the value drops to about $95, which is less than an honest N-only credit on a field with high soil-test P. Material in a restricted tier does double damage: it halves the fertilizer value, and it signals that the source is the kind the grower least wants. On a high-P field, even clean material at full rate is roughly a $60–$90 nitrogen credit.
4. Who pays whom: the utility's side of the ledger
What's new: For bulk Class B cake, the usual arrangement is that the farmer neither pays nor is paid. Penn State Extension notes that biosolids are "usually supplied and applied at no cost to the farmer" (Penn State Extension, accessed Sep 17, 2026). Heat-dried Class A pellets are different: they are sold. Milwaukee's Milorganite brought in $12.2 million of net revenue in 2023, just over 10% of its sewer district's operations budget (Michigan Public, Jan 17, 2025). Philadelphia distributes more than 50,000 tons of pellets a year from its biosolids recycling center (Grid Magazine, Jul 1, 2026).
Evidence: The free-and-spread offer only makes sense next to what the utility avoids by making it. Maine's ban is the one clean natural experiment. The Portland Water District said its biosolids handling cost about $71 per wet ton in 2018, when it was land-applying. By early 2023 it was $133, with annual costs up from about $1.5 million to $3.2 million. Maine utilities were "not uncommon[ly]" paying $190 to $240 per wet ton to haul and landfill (TPO, Mar 2023). In Maryland, the Washington Suburban Sanitary Commission told legislators that SB 719 would raise its sludge costs by $4.1 million to $8.2 million a year through blending, lower land-application rates and landfilling, and that on-site PFAS destruction would cost $200 million in capital (Maryland DLS, Apr 15, 2026).
| Per acre at 3 dry tons (≈15 wet tons of 20%-solids cake) | $/acre | |
|---|---|---|
| Grower's first-year fertilizer value, soil needs P | 190 | █ |
| Utility's added cost if diverted, Portland blended increase ($62/wet ton) | 930* | ████ |
| Utility's added cost if landfilled at $190/wet ton vs $71 | 1,785* | ███████ |
| Utility's added cost if landfilled at $240/wet ton vs $71 | 2,535* | ██████████ |
Sources: TPO, Mar 2023 (Maine per-wet-ton costs); PNW 508, Apr 2022 (cake at 16–25% dry matter); DTN, Sep 16, 2026. *Crop Root Zone estimate: cost gap per wet ton × 15 wet tons (3 dry tons at 20% solids). Maine costs reflect a New England landfill squeeze and will not transfer directly to states with cheap landfill or incineration capacity. Bars scale to the largest value.
Ground Truth: In a tight-disposal market, taking biosolids saves the utility five to thirteen times what it saves the grower, and that gap is the grower's leverage. "Free and spread" is where negotiations start, not the fair price. A reasonable ask in 2027 contracts: the source's rolling 12-month PFOS/PFOA results by Method 1633 before every application, the right to refuse any load from a period above 20 ppb, soil sampling of the field paid by the applier before the first application, and an indemnity from the utility or contractor, not just the hauler. A utility that won't put its test results in writing has told the grower what they would show.
5. Liability and land value: pricing the downside
What's new: The worst outcomes are now documented with prices. Maine had identified 82 PFAS-contaminated farms as of January 2025, about 1% of its roughly 7,000 farms; five had closed and three had scaled back. The state paid $333,000 for a 107-acre Palermo hay farm, whose forage tested at 36.9 ppb PFOA and 21.2 ppb PFOS, at "fair market precontamination value" set by third-party appraisers (Press Herald, Mar 5, 2025). In May 2026 it bought its second property, the 45-acre Songbird Farm in Unity. The Agriculture department is managing 127 contaminated sites and testing 1,100 sites where sludge was once spread (Press Herald, May 22, 2026). Maine restricts milk sales at 210 ppt PFOS and beef at 3.4 ppb (Maine CDC, accessed Sep 17, 2026). In Texas, Johnson County farmers sued Synagro in Maryland state court in February 2024 over its Granulite biosolids product. They allege that material spread on a neighbor's farm contaminated their water, killed livestock and cut their property values, and they claim strict product liability, negligence and private nuisance (Texas A&M AgriLife, Feb 24, 2025). Pennsylvania shows the enforcement exposure too: the Philadelphia Water Department paid EPA $203,563 to settle violations involving biosolids distributed to 25 farmers and land managers in 2024 (Grid Magazine, Jul 1, 2026).
Evidence: Wisconsin's Act 201, effective April 8, 2026, is the first statute that directly addresses a farmer's liability for past application. It exempts from the state's remediation "spills law" a person who owns property "used primarily for agricultural or residential purposes" on which PFAS-contaminated wastewater or industrial waste was spread "pursuant to a license or permit." Contractors who spread under a permit that did not address PFAS are exempt too (Wisconsin Legislative Council, Apr 9, 2026). The exemption covers state cleanup liability. It does not reach a neighbor's nuisance suit, a milk or grain buyer's refusal, a lender's appraisal, or a buyer's discount. Organic certification is lost regardless: PNW 508 notes that the National Organic Program prohibits biosolids, and that some food processors will not accept crops from fields that received them (PNW 508, Apr 2022).
Set the first-year value against the asset underneath it. USDA puts 2026 U.S. cropland at $6,020 an acre, pasture at $2,000 and Corn Belt cropland at $9,280 (DTN, Jul 31, 2026).
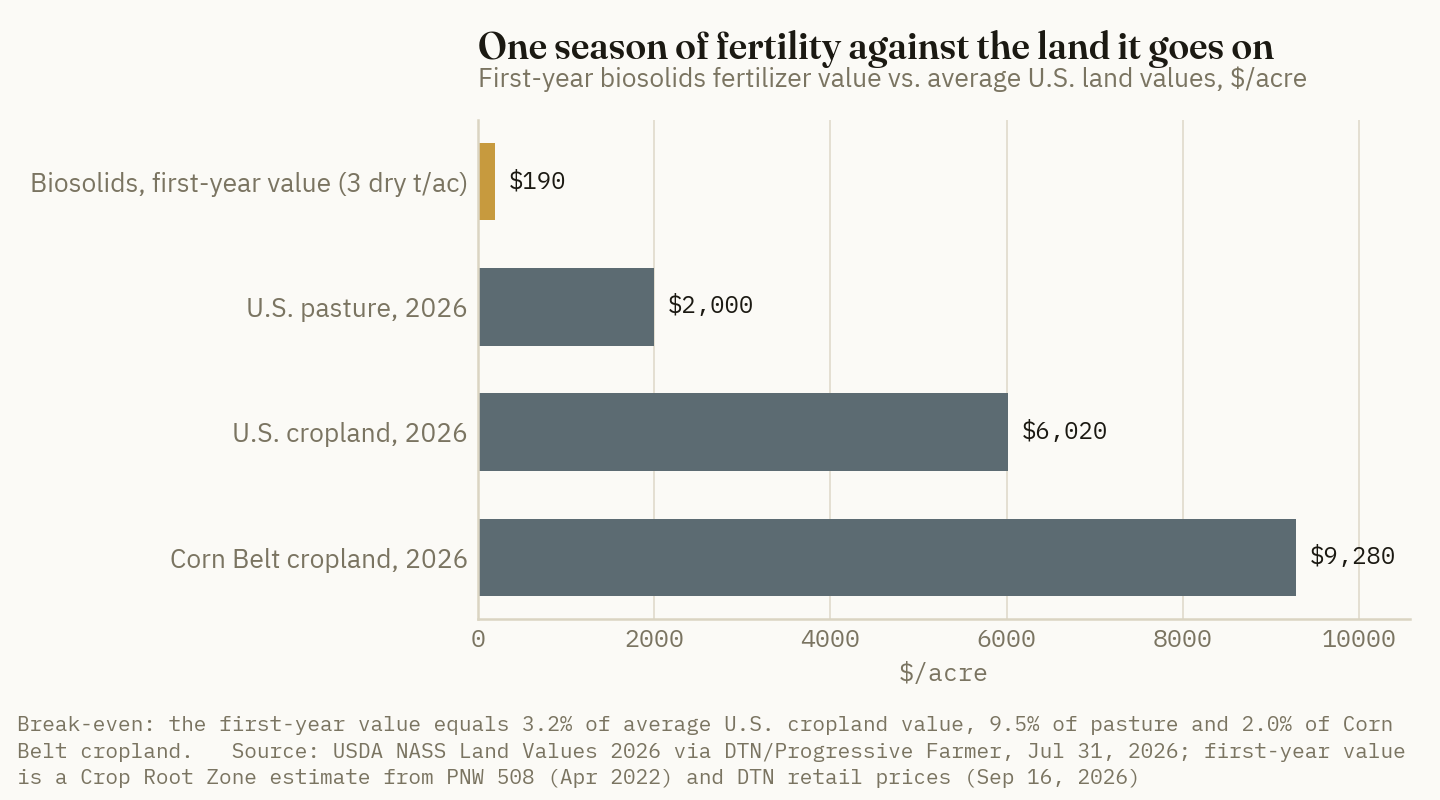
That gives a simple break-even. If an application carries more than about a 3.2% chance of eventually making average cropland unmarketable at its precontamination price, the free fertilizer loses on expected value. The threshold is about 2% on Corn Belt ground and about 9.5% on pasture. This counts only land value, not lost income, well replacement or livestock (Crop Root Zone estimate). The base rates behind that chance are uneven. Maine's 82 farms were about 1% of all farms statewide, but they came from decades of spreading, most of it before any PFAS screening existed. Where screening now exists, the high-PFAS share of supply is small. Michigan puts 11% of reporting facilities in its 20–100 ppb range (Michigan EGLE, accessed Sep 17, 2026). Maryland reports that only two of 50 land-applying plants exceed 25 ppb, and that none of the respondents to the legislature's fiscal survey reported land-applied sludge above 50 ppb (Maryland DLS, Apr 15, 2026).
Ground Truth: Averaged over all sources, the risk looks tolerable on cropland and too thin to justify on pasture. But the risk is not spread evenly. It sits in a minority of plants with industrial PFAS dischargers, and a test identifies them. That turns the decision from "biosolids, yes or no" into four checks. First, is the source's 12-month average below 20 ppb? Second, does the field grow grain, fiber or ethanol corn rather than forage for milk or beef? Third, is soil-test P low enough that the phosphate is worth something? Fourth, will the utility indemnify the grower in writing? A field that passes all four is taking about $190 an acre of fertility against a small, documented risk. A pasture that fails the first check is risking a $2,000 acre for about $60 of nitrogen. Landlords should put the same four checks into cash-rent leases, because a tenant who takes free biosolids is spending the owner's land value, not his own.
References
- U.S. Environmental Protection Agency, "Frequent Questions and Answers: Draft Sewage Sludge Risk Assessment for PFOA and PFOS," Jan 2025 (draft released Jan 14, 2025), accessed Sep 17, 2026 — https://www.epa.gov/biosolids/frequent-questions-and-answers-draft-sewage-sludge-risk-assessment-pfoa-and-pfos
- U.S. EPA Office of Water, "Draft Guidance for Reducing Risk from Perfluorooctanoic Acid (PFOA) and Perfluorooctane Sulfonic Acid (PFOS) in Biosolids," draft guidance memorandum, Jun 29, 2026 — https://www.epa.gov/system/files/documents/2026-06/draft-guidance-reducing-risk-pfoa-pfos-biosolids.pdf
- U.S. EPA, "Draft Guidance for Reducing Risk from PFOA and PFOS in Biosolids" (docket EPA-HQ-OW-2026-2509; comment period extended to Oct 5, 2026), accessed Sep 17, 2026 — https://www.epa.gov/biosolids/draft-guidance-reducing-risk-perfluorooctanoic-acid-pfoa-and-perfluorooctane-sulfonic
- Maryland Department of Legislative Services, "Fiscal and Policy Note, Enrolled – Revised: Senate Bill 719, Sewage Sludge – Per- and Polyfluoroalkyl Substances – Regulation," 2026 Session, revised Apr 15, 2026 — https://mgaleg.maryland.gov/2026RS/fnotes/bil_0009/sb0719.pdf
- Virginia Association of Counties, "PFAS Regulatory Framework for Biosolids Headed to the Governor," Mar 12, 2026 — https://www.vaco.org/capitol-contact/pfas-regulatory-framework-for-biosolids-headed-to-the-governor/
- Michigan Department of Environment, Great Lakes, and Energy, "Interim strategy requirements: land application of biosolids containing PFAS," accessed Sep 17, 2026 — https://www.michigan.gov/egle/about/organization/water-resources/biosolids/pfas-related/interim-strategy
- Waste Dive, "Pennsylvania regulators propose PFAS in biosolids limits," Jul 21, 2026 — https://www.wastedive.com/news/pennsylvania-regulators-propose-pfas-in-biosolids-limits/825770/
- Wisconsin Legislative Council, "Act Memo: 2025 Wisconsin Act 201 — Programs and Policies to Address PFAS," Apr 9, 2026 — https://docs.legis.wisconsin.gov/2025/related/lcactmemo/act201
- Waste Dive, "Worries over PFAS in biosolids spill into 2026 legislative sessions," Jan 28, 2026 — https://www.wastedive.com/news/state-action-pfas-contamination-sewage-sludge-oklahoma-maryland-mid-atlantic-biosolids/810713/
- Texas Tribune, "Bills to study, restrict 'forever chemicals' fail in Texas," Jun 2, 2025 — https://www.texastribune.org/2025/06/02/texas-pfas-forever-chemicals-bills-legislation-fail/
- MG+M The Law Firm, "PFAS in Sewage Sludge: DC Circuit to Clarify EPA's Regulatory Obligations," Jun 12, 2026 — https://www.mgmlaw.com/news-insights/pfas-in-sewage-sludge-dc-circuit-to-clarify-epas-regulatory-obligations
- DTN/Progressive Farmer, "Fertilizer Prices Continue Lower for 6 of 8 Major Nutrients" (retail survey, Sep 7–11, 2026), Sep 16, 2026 — https://www.dtnpf.com/agriculture/web/ag/crops/article/2026/09/16/fertilizer-prices-continue-lower-6-8
- Sullivan, D.M.; Tomasek, A.; Griffin-LaHue, D. et al., "Fertilizing with Biosolids," PNW 508, Pacific Northwest Extension Publishing, Apr 2022 — https://extension.oregonstate.edu/sites/extd8/files/documents/pnw508.pdf
- Penn State Extension, "Use of Biosolids in Crop Production," accessed Sep 17, 2026 — https://extension.psu.edu/use-of-biosolids-in-crop-production
- Michigan Public, "Fertilizer from sewage, a utility money maker, faces uncertain future," Jan 17, 2025 — https://www.michiganpublic.org/environment-climate-change/2025-01-17/fertilizer-from-sewage-a-utility-money-maker-faces-uncertain-future
- Seal, B., "Regional farmers uneasy about contamination risks in using processed sewage as fertilizer," Grid Magazine, Jul 1, 2026 — https://gridphilly.com/blog-home/2026/07/01/american-farmland-threatened-by-tainted-processed-sewage/
- Treatment Plant Operator, "Utilities in Maine Seek Solutions Amidst Biosolids Disposal Crisis," Mar 2023 — https://www.tpomag.com/online_exclusives/2023/03/utilities-in-maine-seek-solutions-amidst-biosolids-disposal-crisis
- Portland Press Herald, "Maine buys farm tainted by toxic sludge fertilizer," Mar 5, 2025 — https://www.pressherald.com/2025/03/05/maine-makes-first-purchase-of-farm-contaminated-by-forever-chemicals/
- Portland Press Herald, "Maine buys second PFAS-contaminated farm," May 22, 2026 — https://www.pressherald.com/2026/05/22/maine-buys-second-pfas-contaminated-farm/
- Maine Center for Disease Control & Prevention, "PFAS and Agriculture," accessed Sep 17, 2026 — https://www.maine.gov/dhhs/mecdc/healthy-living/health-and-safety/pfas-in-maine/pfas-and-agriculture
- Texas A&M AgriLife, Texas Agriculture Law, "Lawsuits, Disaster Declaration After PFAS Contaminates Farms in Johnson County, Texas," Feb 24, 2025 — https://agrilife.org/texasaglaw/2025/02/24/lawsuits-disaster-declaration-after-pfas-contaminates-farms-in-johnson-county-texas/
- DTN/Progressive Farmer, "USDA Land Values Report: US Cropland Tops $6,000 an Acre in 2026," Jul 31, 2026 — https://www.dtnpf.com/agriculture/web/ag/news/business-inputs/article/2026/07/31/usda-land-values-report-us-cropland
Disclosures
Crop Root Zone is an independent publication. Nothing here is investment advice. Market calls, where included, reflect the editors' own read and are not a recommendation to buy or sell any security.
Low-Carbon Ammonia Earns About $20 a Ton in 2026. A Corn Grower Who Uses It Can Claim None of the 45Z Value It Would Create.
In North America, one plant makes certified low-carbon ammonia at scale today: CF's Donaldsonville complex. Blue Point One and Wabash won't start before 2028 or 2029, and Air Products, ExxonMobil, LSB and Nutrien have cancelled or paused their projects. CF says its low-carbon tons earned more than $20 over conventional in the first half. On an Iowa corn acre that works out to about $1.93. If USDA credited the lower footprint under 45Z, it could be worth about $34 an acre before the ethanol plant takes its share. In its June final rule, USDA declined to model blue or green ammonia, so the value a grower can claim in 2026 is zero.
On August 26, CF Industries, JERA and Mitsui broke ground in Modeste, Louisiana, on Blue Point One. The $3.7 billion plant is designed to make 1.4 million metric tons a year of ammonia and capture 98% of the CO2 it generates, starting in 2029 (CF Industries, Aug 26, 2026). The same summer went badly for low-carbon ammonia elsewhere. Air Products cancelled its Louisiana Clean Energy Complex and wrote off $2.9 billion (Industrial Info Resources, Jul 23, 2026). Woodside put its newly finished Beaumont, Texas, ammonia plant under strategic review (Chemical Week, Aug 31, 2026). For growers, the key sentence came earlier, in USDA's June 29 final rule on low-carbon biofuel feedstocks. USDA wrote that it "currently does not have the time or resources to model the benefits of blue and green ammonia" (Federal Register, Jun 29, 2026). Low-carbon nitrogen now has a producer, a certification scheme and a price premium. The question here is whether any of that value reaches the farm in 2026. On the numbers, it doesn't yet.
1. What is producing, what is being built, and what was shelved
What's new: The North American pipeline has split into a few projects with steel in the ground and a longer list of projects that were cancelled or paused. CF's Donaldsonville CCS unit started up in July 2025. It can capture and permanently store up to 2 million metric tons of CO2 a year, enough for up to about 1.9 million tons a year of low-carbon ammonia certified under The Fertilizer Institute's Verified Ammonia Carbon Intensity (VACI) program (CF Industries, Oct 2, 2025). CF's Yazoo City, Mississippi, CCS project is expected to start in 2028 (CF Industries, Aug 5, 2026). Woodside's Beaumont New Ammonia plant made its first ammonia in December 2025. It produced 279,000 tonnes in the first half of 2026, all conventional. Output was held back by feedstock shortfalls from third-party suppliers, and Q2 averaged 69% of capacity. Low-carbon output is now targeted for 2027, subject to Linde's hydrogen plant and ExxonMobil's CCS permits (Woodside, Aug 25, 2026).
Evidence:
| Project | Sponsor | Nameplate | Status, Sep 2026 | Low-carbon output |
|---|---|---|---|---|
| Donaldsonville CCS, LA | CF Industries | up to 1.9M tons/yr NH3 | Operating since Jul 2025 | Now |
| Beaumont New Ammonia, TX | Woodside | 1.1 Mt/yr NH3 | Running conventional; under strategic review | Targeted 2027 |
| Blue Point One, LA | CF 40%, JERA 35%, Mitsui 25% | 1.4 Mt/yr NH3 | JV formed Apr 2025; ground broken Aug 2026 | 2029 |
| Wabash, West Terre Haute, IN | Wabash Valley Resources | 500,000 t/yr NH3 | Ground broken Jan 2026; $1.559B DOE loan | 2028–2029 |
| Yazoo City CCS, MS | CF Industries | not disclosed | Proceeding | 2028 |
| Houston Ship Channel, TX | LSB, INPEX, Air Liquide, Vopak Moda | 1.1 Mt/yr NH3 | Paused Apr 2025 | — |
| Geismar, LA | Nutrien | 1.3M tons/yr NH3 | Suspended Aug 2023; dropped Jun 2024 | — |
| Baytown, TX | ExxonMobil | 1 bcf/d hydrogen | Paused Nov 2025 | — |
| Louisiana Clean Energy Complex | Air Products | 750 MMscf/d hydrogen | Cancelled; $2.9B write-off | — |
Sources: CF Industries, Oct 2, 2025, Aug 5, 2026 and Aug 26, 2026; CF Industries Form 10-Q, quarter ended Jun 30, 2026; Woodside Half-Year Report, Aug 25, 2026; Chemical Week, Aug 31, 2026; Samsung E&A, Jan 2026; Honeywell, Oct 30, 2025; Quantum Commodity Intelligence, Apr 30, 2025 and Nov 24, 2025; Argus Media, Aug 3, 2023; The Canadian Press, Jun 12, 2024; Industrial Info Resources, Jul 23, 2026. CF reports ammonia in short tons; other sponsors report metric tonnes.
The cancelled projects share a theme. LSB's CEO blamed tariff-driven cost increases and "a slower-than-anticipated ramp-up of low carbon ammonia demand" (Quantum Commodity Intelligence, Apr 30, 2025). ExxonMobil cited weak customer demand for Baytown (Quantum Commodity Intelligence, Nov 24, 2025). Nutrien had earlier pointed to higher capital costs and uncertain timing for new clean-ammonia uses (Argus Media, Aug 3, 2023). Industrial Info Resources tracks $45 billion of U.S. blue hydrogen, ammonia and methanol projects and rates 65% of that value as having a low probability of starting on its scheduled date (Industrial Info Resources, Jul 23, 2026).
Tax law changed which route gets built. The 2025 budget law, signed July 4, 2025, ends the 45V clean-hydrogen credit for facilities that begin construction after 2027. It also sets the 45Q carbon-capture credit at the same $85 per metric ton for sequestration and enhanced oil recovery, for equipment placed in service after enactment (Kirkland & Ellis, Aug 2025). Electrolytic "green" ammonia depends on 45V, and it now has a construction deadline 15 months away. Capture-based "blue" ammonia depends on 45Q, which survived. Every project still moving in the table is a capture project.
Ground Truth: Only two of these plants are aimed at the Corn Belt fertilizer trade. Wabash is being built for farmers and co-ops in Illinois, Indiana and Ohio (Honeywell, Oct 30, 2025). Donaldsonville sits on the Mississippi River, upstream of the Gulf. Blue Point's anchor volumes, about 1 million tons, are committed to its Japanese partners (CF Industries Q2 2026 earnings call, Aug 12, 2026). Beaumont was developed around export sales. A grower pricing fall 2026 anhydrous is not competing with a flood of low-carbon supply. The only certified supply at scale comes from one complex, and the one low-carbon sale it has described in detail went to a European buyer preparing for CBAM.
2. The carbon difference per tonne
What's new: Woodside published the clearest like-for-like comparison of 2026. Its contracted low-carbon threshold at Beaumont is 0.8 tonnes of CO2 per tonne of ammonia on a Scope 1-3 lifecycle basis. It compares that with 2.3 tonnes for unabated ammonia, citing Hydrogen Europe (Woodside, Aug 25, 2026). That is a 65% cut. A 2024 study built on Argonne's GREET model puts conventional gas-reformed ammonia at 2.55 g CO2e per gram and renewable-electrolysis ammonia at 0.22, a 91% cut (Arzumanyan, Lin and Wang, Dec 2024). The same study estimates that blue ammonia with CCS lowers per-bushel corn emissions from 3.09 to 2.27 kg CO2, or 26%.
Evidence: The EU sets a sharper number for U.S. product. Under 2026 CBAM default values, U.S.-origin ammonia is assigned 3.44 t CO2e per tonne. That compares with 2.44 for Trinidad and 2.07 for Egypt, against a free-allocation benchmark of 1.484 t. Argus reported that the U.S. default rose because the recorded production route changed from natural gas to petroleum coke. At a €100.35/t ETS price, it put the implied default charge at up to $196 per tonne for U.S. ammonia (Argus Media, Dec 17, 2025).
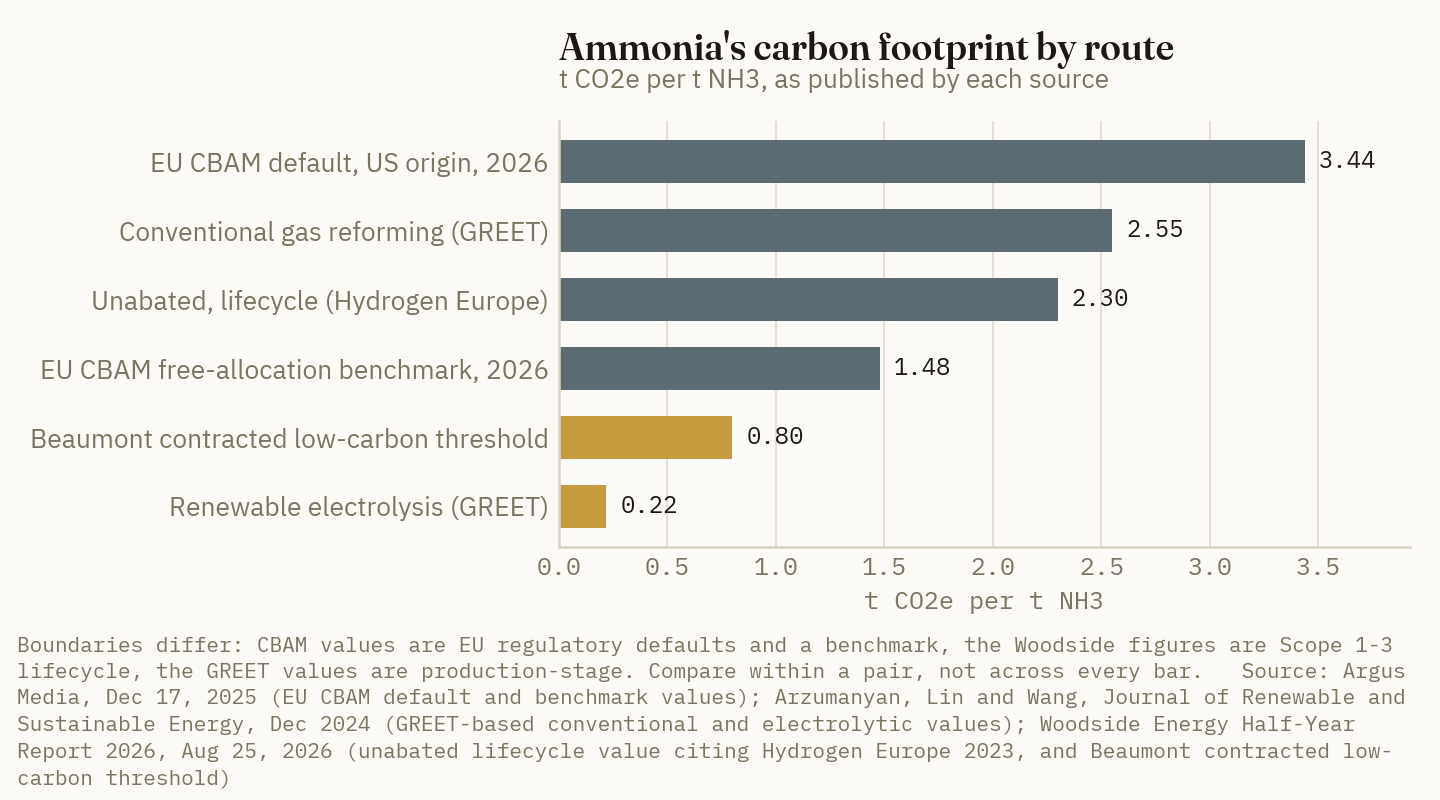
Ground Truth: A one-tonne-plus carbon gap is worth money only where a rule counts it. In the EU, a U.S. exporter with no verified footprint pays the CBAM default. That gives European buyers a regulatory reason to pay for a VACI certificate. On a U.S. farm, no rule counts that tonne in 2026. The lower footprint is real, but no farm-side market pays for it yet.
3. The premium: about $20 a ton, and why it is that small
What's new: CF gave the first hard number from a North American producer. About 10% of its first-half 2026 ammonia sales volumes were low-carbon, and they "earned an average premium of more than $20 per ton" (CF Industries Q2 2026 earnings call, Aug 12, 2026). Its first certified low-carbon cargo was 23,500 metric tons, loaded September 25, 2025, sold to Trafigura for Envalior in Antwerp. CF described it as positioning ahead of CBAM (CF Industries, Oct 2, 2025). Argus has launched cost-based benchmarks for U.S. Gulf blue ammonia delivered to Japan and Korea and to Amsterdam-Rotterdam-Antwerp (Argus Media, press releases), but the assessed values are behind its paywall. We found no public figure that updates them for 2026.
Evidence: Set against the ammonia prices it attaches to, the premium is small. It is also smaller than the tax credit CF already collects on the same tons.
| Measure, Sep 2026 | $/ton | Basis | |
|---|---|---|---|
| Retail anhydrous | 938 | Delivered retail, short ton, Sep 7–11 | ██████████ |
| NOLA barge ammonia | 405 | FOB barge, short ton, September | ████░░░░░░ |
| CBAM default charge, U.S. origin | up to 196 | Per metric tonne, at €100.35 ETS | ██░░░░░░░░ |
| 45Q at $85/t CO2, Donaldsonville nameplate ratio | 89* | Per short ton NH3 | █░░░░░░░░░ |
| 45Q at $60/t CO2, same ratio | 63* | Per short ton NH3 | █░░░░░░░░░ |
| CF low-carbon premium, H1 2026 average | >20 | Per ton, CF reporting basis | ░░░░░░░░░░ |
Sources: DTN, Sep 16, 2026; Fertilizer International (CRU), Sep 15, 2026; Argus Media, Dec 17, 2025; CF Industries Q2 2026 earnings call, Aug 12, 2026; CF Industries, Oct 2, 2025. *Crop Root Zone estimate: 2 million metric tons of CO2 capacity divided by 1.9 million tons of low-carbon ammonia capacity is about 1.05 t CO2 per ton, multiplied by the credit rate. Actual storage per ton varies with turnarounds and how much CO2 goes into upgraded products. Bars scale to retail anhydrous.
CF recognized $43 million of 45Q credits in the first half of 2026 (CF Industries, Aug 5, 2026). Management said the rate rises from $60 to $85 per ton once a Class VI well permit is approved, which it expects later in 2026 (CF Industries Q2 2026 earnings call, Aug 12, 2026). Using nameplate ratios, that is roughly $63 a ton of ammonia now and $89 later. Both are three to four times the market premium.
>$20/ton
CF's average premium on low-carbon ammonia in H1 2026, about 2% of the retail anhydrous price. (CF Industries Q2 2026 earnings call, Aug 12, 2026; DTN, Sep 16, 2026)
Ground Truth: Treasury, not the buyer, pays most of the low-carbon margin. That is why a $20 premium can clear. The producer earns 45Q on capture whether or not anyone pays extra for the certificate, and CBAM gives European buyers a reason to pay a little more. A U.S. co-op offered certified low-carbon anhydrous at list plus $20 a ton is being quoted a low price for an attribute. The question is whether anything downstream will pay for that attribute.
4. What reaches the farm: the 45Z math, and USDA's no
What's new: The link to the farm runs through ethanol. The 45Z clean fuel credit pays up to $1.00 a gallon for non-aviation fuel at a 0 kg CO2e/MMBtu emissions rate, scaling down to zero at 50 (farmdoc daily, May 27, 2026). The 2025 law extended it through December 31, 2029 (Kirkland & Ellis, Aug 2025). The IRS said in Notice 2026-53 that fuel producers may use USDA's forthcoming 45Z feedstock calculator for qualifying low-carbon farm practices (AgBull, Sep 8, 2026). USDA's final rule, effective July 29, covers corn, soybeans, sorghum and spring canola (Iowa State CALT, Jun 30, 2026). The practices it credits are no-till, reduced till, cover crops, nitrification inhibitors, split in-season nitrogen and spring-only nitrogen (farmdoc daily, Jun 18, 2026). Low-carbon ammonia is not on that list. When commenters asked USDA to include it, the department answered that it does not have "the time or resources to model the benefits of blue and green ammonia" and "may consider" them later (Federal Register, Jun 29, 2026).
The supply chain is already testing it anyway. CF, POET, WinField United and three co-ops, NuWay-K&H, New Cooperative and Farmer's Cooperative, applied low-carbon ammonia in fall 2025 across Iowa, Minnesota, Missouri and Nebraska. POET expects the corn to make 5 to 6 million gallons of lower-CI ethanol (CF Industries, Jan 26, 2026). CF said in 2024 that such corn can cut ethanol carbon intensity "up to 10 percent" (CF Industries, Jul 15, 2024). The 2026 pilot announcement names no grower payment.
Evidence: Below is what the lower footprint would be worth if the calculator counted it. The acre is Iowa State's 2026 corn-after-soybeans budget, 211 bu/acre and 159 lb N at $0.53/lb (ISU Ag Decision Maker A1-20, Jan 2026).
| Line, per acre | Blue (0.8 vs 2.3 t/t) | Electrolytic (0.22 vs 2.55 t/t) |
|---|---|---|
| Nitrogen applied, lb N | 159 | 159 |
| Ammonia equivalent, lb NH3 | 193* | 193* |
| Emissions avoided, kg CO2e/acre | 132* | 204* |
| Emissions avoided, kg CO2e/bu | 0.62* | 0.97* |
| Fuel emissions-rate cut, kg CO2e/MMBtu | 2.8* | 4.4* |
| 45Z value, $/gal | 0.056* | 0.087* |
| 45Z value, $/bu at 2.9 gal/bu | 0.163* | 0.254* |
| 45Z value, $/acre at 211 bu | 34.47* | 53.54* |
| Premium cost at $20/ton NH3, $/acre | 1.93* | not public |
| 45Z value a grower can claim in 2026 | 0.00 | 0.00 |
Sources: ISU Ag Decision Maker A1-20, Jan 2026; Woodside, Aug 25, 2026; Arzumanyan, Lin and Wang, Dec 2024; farmdoc daily, May 27, 2026; Irwin, farmdoc daily, Feb 18, 2026; CF Industries Q2 2026 earnings call, Aug 12, 2026; Federal Register, Jun 29, 2026. *Crop Root Zone estimate. Assumptions: ammonia is 82.2% N; ethanol at 76,330 Btu/gal (lower heating value, the GREET convention); 2.9 gal/bu, below the 3.03 gal/bu industry average for 2025, which makes the result conservative; the full $1.00/gal rate before inflation adjustment, which requires the plant to meet wage and apprenticeship rules; every farm-stage reduction assigned to ethanol with none to distillers grains, which makes the result generous. Blue uses Woodside's lifecycle pair and electrolytic uses the GREET production-stage pair, so the two columns are not on identical boundaries.
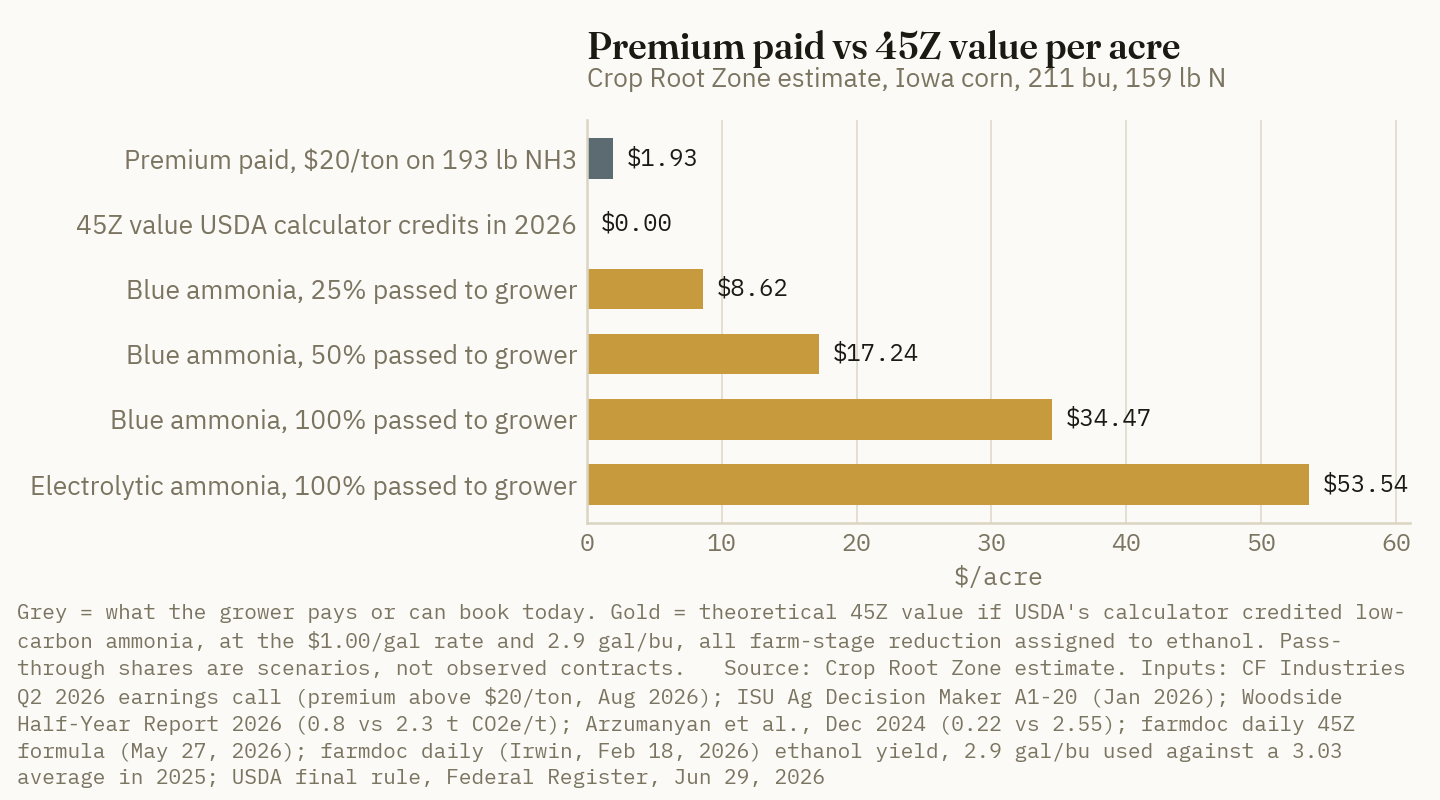
The arithmetic follows directly from the formula. Each kg CO2e/MMBtu cut is worth 2 cents a gallon at the $1.00 rate, or about 5.8 cents a bushel at 2.9 gallons, so the blue case's 2.8-point cut comes to 5.6 cents a gallon. The value also has to be shared. The ethanol producer claims the credit, and any payment to the grower depends on how the credit is calculated, monetized and passed back (Pinion Global, Sep 10, 2026). At a 25% share, blue ammonia would return about $8.62 an acre. At 50%, it would return $17.24. Either way it is well above a $1.93 premium, if the calculator ever credits it.
Ground Truth: The farm economics would work if the calculator counted low-carbon ammonia. It doesn't. The premium is about a twentieth of the theoretical value, so price is not the barrier. Recognition is. That makes the 2029 dates in Section 1 matter. 45Z expires on December 31, 2029. Blue Point targets 2029 and Wabash 2028–2029. Unless USDA adds blue and green ammonia soon, and Congress extends 45Z, the Corn Belt's first large blocks of low-carbon supply will arrive with a year or less of credit left to share.
5. What a grower can do with fall 2026 nitrogen
What's new: Fall anhydrous is priced off a market that has come down from spring but is still up on last year. Retail anhydrous averaged $938 a ton in the second week of September, $0.57 per pound of N, 22% above a year earlier (DTN, Sep 16, 2026). The August Tampa contract settled at $635 a tonne CFR, and the trade expected September to settle nearer $600 (Fertilizer International, Sep 15, 2026).
Evidence: Three levers affect low-CI corn value, and only one depends on the fertilizer's origin.
| Lever | Credited in USDA calculator, 2026 | Grower cost signal | Where the value goes |
|---|---|---|---|
| Nitrification inhibitor on fall/spring N | Yes | Product cost per acre | Ethanol plant CI, shared by contract |
| Split in-season or spring-only N | Yes | Extra pass or timing risk | Ethanol plant CI, shared by contract |
| Certified low-carbon ammonia | No | About $1.93/acre at $20/ton* | Producer's 45Q; EU and Asian buyers; pilot programs |
Sources: farmdoc daily, Jun 18, 2026; Federal Register, Jun 29, 2026; CF Industries Q2 2026 earnings call, Aug 12, 2026. *Crop Root Zone estimate from Section 4.
USDA's rule already requires growers to report actual nitrogen rates and yields and to keep records for five years (Iowa State CALT, Jun 30, 2026). A grower who buys certified low-carbon ammonia this fall and keeps the certificate with those records gives up nothing if USDA later adds it. A grower who pays a premium expecting 45Z money this crop year will not get any under the current rule.
Ground Truth: For fall 2026, do not pay a low-carbon premium on your own. Buy certified low-carbon anhydrous when the premium is paid by someone who can use the attribute: an ethanol plant, a pilot like the POET-WinField program, or a co-op contract that pays per bushel. At about $2 an acre, it is also a cheap option on a rule change, so keep the VACI certificate with your nitrogen records. The practice that earns 45Z value on corn delivered this year is a nitrification inhibitor or a split application, not a cleaner ton of ammonia. Watch two dates: whether USDA's next calculator release adds blue and green ammonia, and whether Congress extends 45Z past 2029.
References
- CF Industries, "CF Industries, JERA and Mitsui Break Ground on Blue Point One, the World's Largest Low-Carbon Ammonia Plant in Louisiana," press release, Aug 26, 2026 — https://www.cfindustries.com/newsroom/2026/blue-point-groundbreaking
- Industrial Info Resources, "U.S. Blue Hydrogen, Similar Projects Face Wave of Setbacks," Jul 23, 2026 — https://www.industrialinfo.com/iirenergy/industry-news/article/us-blue-hydrogen-similar-projects-face-wave-of-setbacks--360467
- Chemical Week, "Woodside puts US blue ammonia project under strategic review," Aug 31/Sep 7, 2026 issue — https://chemweek.mydigitalpublication.com/publication/?i=869634&article_id=5205821&view=articleBrowser
- U.S. Department of Agriculture, "Technical Guidelines for the Production of Regenerative Agricultural Biofuel Feedstocks," final rule, Federal Register Vol. 91, No. 123, Jun 29, 2026 — https://www.govinfo.gov/content/pkg/FR-2026-06-29/html/2026-13092.htm
- CF Industries, "CF Industries, Trafigura and Envalior Announce Shipment of Certified Low-Carbon Ammonia," press release, Oct 2, 2025 — https://www.cfindustries.com/newsroom/2025/low-carbon-ammonia-shipment
- CF Industries, Form 8-K Exhibit 99.1, second-quarter 2026 results, Aug 5, 2026 — https://www.sec.gov/Archives/edgar/data/0001324404/000132440426000017/cf-08052026_ex991xearnings.htm
- Woodside Energy Group, "Half-Year Report for Period Ended 30 June 2026," Aug 25, 2026 — https://www.woodside.com/docs/default-source/investor-documents/quarterly-and-half-yearly-pdfs-and-data-tables/2026/half-year-2026-report.pdf
- CF Industries, Form 10-Q for the quarter ended Jun 30, 2026 — https://www.sec.gov/Archives/edgar/data/0001324404/000132440426000019/cf-20260630.htm
- Samsung E&A, "SAMSUNG E&A announces Groundbreaking of Wabash Low-Carbon Ammonia Project," Jan 2026 (ceremony Jan 5, 2026) — https://www.samsungena.com/en/newsroom/news/view?idx=15775
- Honeywell, "Honeywell Carbon Capture Technology to Help Transform Shuttered Power Plant Into Fertilizer Facility Supporting U.S. Farmers," press release, Oct 30, 2025 — https://www.honeywell.com/us/en/news/press-releases/2025/10/honeywell-carbon-capture-cechnology-to-help-transform-shuttered-power-plant-into-fertilizer-facility-supporting-us-farmers
- Quantum Commodity Intelligence, "LSB pauses low-carbon ammonia project in Houston Ship Channel," Apr 30, 2025 — https://www.qcintel.com/ammonia/article/lsb-pauses-low-carbon-ammonia-project-in-houston-ship-channel-40271.html
- Quantum Commodity Intelligence, "Exxon pauses Baytown blue ammonia, hydrogen project," Nov 24, 2025 — https://www.qcintel.com/ammonia/article/exxon-pauses-baytown-blue-ammonia-hydrogen-project-53508.html
- Argus Media, "Nutrien suspends work on US low-carbon ammonia plant," Aug 3, 2023 — https://www.argusmedia.com/en/news-and-insights/latest-market-news/2475833-nutrien-suspends-work-on-us-low-carbon-ammonia-plant
- The Canadian Press, "Nutrien no longer pursuing Geismar clean ammonia project," Jun 12, 2024 (via Yahoo Finance Canada) — https://ca.finance.yahoo.com/news/nutrien-no-longer-pursuing-geismar-214404382.html
- Kirkland & Ellis, "'One Big Beautiful Bill Act' Brings Big Changes to Green Energy Tax Credits," Kirkland Alert, Aug 2025 (accessed Sep 17, 2026) — https://www.kirkland.com/publications/kirkland-alert/2025/08/one-big-beautiful-bill-act-brings-big-changes-to-green-energy-tax-credits
- CF Industries, Q2 2026 earnings call transcript, via The Motley Fool, Aug 12, 2026 — https://www.fool.com/earnings/call-transcripts/2026/08/12/cf-industries-cf-q2-2026-earnings-call-transcript/
- Arzumanyan, M.; Lin, N.; Wang, H., "Greening the Corn Belt: Low-carbon-intensity ammonia's role in the future of sustainable corn production," Journal of Renewable and Sustainable Energy 16(6), 065903, Dec 2024 — https://pubs.aip.org/aip/jrse/article/16/6/065903/3323863/Greening-the-Corn-Belt-Low-carbon-intensity
- Argus Media, "CBAM documents outline preliminary ammonia values," Dec 17, 2025 — https://www.argusmedia.com/en/news-and-insights/latest-market-news/2766788-cbam-documents-outline-preliminary-ammonia-values
- Argus Media, "Argus launches global low-carbon ammonia benchmark" (JKLAB) and "Argus launches EU Low-carbon Ammonia Benchmark" (EULAB), press releases, accessed Sep 17, 2026 — https://www.argusmedia.com/en/about-argus/media-centre/press-releases/argus-launches-global-low-carbon-ammonia-benchmark and https://www.argusmedia.com/en/about-argus/media-centre/press-releases/argus-launches-eu-low-carbon-ammonia-benchmark
- DTN/Progressive Farmer, "Fertilizer Prices Continue Lower for 6 of 8 Major Nutrients," Sep 16, 2026 — https://www.dtnpf.com/agriculture/web/ag/crops/article/2026/09/16/fertilizer-prices-continue-lower-6-8
- Fertilizer International (CRU/BCInsight), "Market Insight," issue 534, Sep 15, 2026 — https://www.bcinsight.crugroup.com/2026/09/15/market-insight-41/
- Coppess, J.; Chen, Z., "The Clean Fuel Production Tax Credit (45Z); Introductory Discussion," farmdoc daily, University of Illinois, May 27, 2026 — https://farmdocdaily.illinois.edu/2026/05/the-clean-fuel-production-tax-credit-45z-introductory-discussion.html
- AgBull Trading, "IRS Opens New 45Z Opportunities for Agriculture, With Key Rules Still Pending" (Notice 2026-53), Sep 8, 2026 — https://www.agbull.com/rs-opens-new-45z-opportunities-for-agriculture-with-key-rules-still-pending/
- Tidgren, K.A., "USDA Finalizes Guidance for Low-Carbon Biofuel Feedstocks," Iowa State University Center for Agricultural Law and Taxation, Jun 30, 2026 — https://www.calt.iastate.edu/post/usda-finalizes-guidance-low-carbon-biofuel-feedstocks
- Chen, Z.; Coppess, J., "The Clean Fuel Production Tax Credit (45Z), Part 2: Carbon Intensity," farmdoc daily, University of Illinois, Jun 18, 2026 — https://farmdocdaily.illinois.edu/2026/06/the-clean-fuel-production-tax-credit-45z-part-2-carbon-intensity.html
- CF Industries, "CF Industries, POET, and Major Agriculture Co-Operatives Launch Low-Carbon Fertilizer Pilot to Cut Ethanol Production Carbon Intensity," press release, Jan 26, 2026 — https://www.cfindustries.com/newsroom/2026/poet-winfield-trial
- CF Industries, "CF Industries and POET to Demonstrate the Use of Low-Carbon Fertilizer in Corn Production to Reduce Carbon Intensity of Ethanol," press release, Jul 15, 2024 — https://www.cfindustries.com/newsroom/2024/cf-poet-low-carbon-ammonia
- Iowa State University Extension and Outreach, Ag Decision Maker File A1-20, "Estimated Costs of Crop Production in Iowa — 2026," revised Jan 2026 — https://www.extension.iastate.edu/agdm/crops/pdf/a1-20.pdf
- Irwin, S., "Trends in the Operational Efficiency of the U.S. Ethanol Industry: 2025 Update," farmdoc daily, University of Illinois, Feb 18, 2026 — https://farmdocdaily.illinois.edu/2026/02/trends-in-the-operational-efficiency-of-the-u-s-ethanol-industry-2025-update.html
- Pinion Global, "Low-CI Corn and 45Z: What Producers Should Know Before Chasing a Premium," Sep 10, 2026 — https://www.pinionglobal.com/blog/low-ci-corn-and-45z-what-producers-should-know-before-chasing-a-premium/
Disclosures
Crop Root Zone is an independent publication. Nothing here is investment advice. Market calls, where included, reflect the editors' own read and are not a recommendation to buy or sell any security.
Short Corn at Bayer's Recommended Seeding Rate Needs 4.7 Bushels Just to Pay for the Extra Seed. Bayer's Own Matched-Year Data Show 2.9.
Short-stature corn stands up to wind: in 444 Bayer site-years, 3.8% of short plots took wind damage against 10.6% of tall ones. But in Bayer-funded yield data, short hybrids trailed tall ones by about 7 bushels at normal density and led by about 3 only when planted 10,000 plants thicker. At $3.79 per 1,000 kernels and $4.80 corn, the 6,000 to 8,000 extra seeds Bayer recommends cost 4.7 to 6.3 bushels before any trait premium, which is not yet public. On Bayer's own damage rates, avoided wind loss is worth roughly a bushel a year.
On the morning of August 11, a storm line crossed northeast and east-central Iowa with measured gusts of 60 mph at Independence and 70 mph near Greeley, and an estimated 80 mph at Farley, while 94% of U.S. corn had silked and only 16% had dented (AgBull, Aug 11, 2026). Weeks like that are the sales case for short-stature corn: hybrids roughly a third shorter, sold on standing through wind, taking more plants per acre, and letting a ground rig reach the crop after tassel. Bayer says its Preceon Smart Corn System has begun commercialization in the U.S. and targets 26 million acres by 2035 (Bayer, Sep 2, 2026). Its 2026 program was planned at 200,000 acres, up from 85,000 in 2025 (Red River Farm Network, Dec 17, 2025). Two things matter as 2027 seed orders open. Nearly all of the large-sample evidence was produced or paid for by the seller, and the seller has not published a price. What can be done is to work out, in bushels, what the system has to earn and set that against the data that exist.
1. What is being sold, and by whom
What's new: Bayer's short-stature program has two tracks. The first is conventionally bred hybrids; Iowa State's Mark Licht describes that trait as non-transgenic, with plants about 30% shorter, under 7 feet, and ears above 24 inches (Licht, presentation, accessed Sep 16, 2026). The second is a biotech-derived version (Dohleman et al., Nov 19, 2025). Bayer pitches Preceon as a system, not just a hybrid: higher densities, in-season ground access, and FieldView digital tools (Bayer, Sep 2, 2026). Corteva's advanced-genetics spin-off, Vylor, says it will launch reduced-stature corn "through the end of this decade" on next-generation platforms, with no year and no performance figures (Corteva, Sep 1, 2026).
Evidence: The product claims are specific, and all of them come from Bayer.
| Claim | Figure | Basis | Author |
|---|---|---|---|
| Yield advantage, short corn with "enhanced management" vs tall | 16 bu/acre | Not stated on page | Bayer |
| Late N at VT via drag tubes | 4.8 bu/acre | 15 locations, 2022 | Bayer |
| Optimal density, short vs tall | +8% | 77 locations, 2023 | Bayer |
| Recommended seeding-rate increase | +6,000 to 8,000 seeds/acre | Guidance (36,000–42,000 ppa range) | Bayer |
| Yield, 32,000 vs 56,000 seeds/acre, Gothenburg, NE | 223.4 vs 228.9 bu/acre | One site, 2022; no stalk lodging at any density | Bayer |
| Standing and harvestable in wind | up to ~75 mph | 2020 derecho observations | Bayer (Kelly Gillespie) |
Sources: Bayer, "Positioning Preceon Smart Corn," Nov 1, 2024; Bayer, "Row Spacing and Seeding Rate Effects on Short Stature Corn Yields" (2022 trial), accessed Sep 16, 2026; CBS2 Iowa, Apr 12, 2021.
On price, nothing is public. We found no published seed-per-unit price for Preceon hybrids, no trait-premium figure, and no Bayer statement on either. Iowa State's 2026 budgets price corn seed at $3.79 per 1,000 kernels (ISU Ag Decision Maker A1-20, Jan 2026). That is a conventional-hybrid benchmark, and this article uses it as a floor. Any short-stature premium comes on top of it.
Ground Truth: The headline claim, 16 bushels with "enhanced management," is a system number. It folds in the density, the row spacing and the late passes the grower pays for separately. A seed order cannot buy 16 bushels. It buys a hybrid that may earn part of that if the grower also buys the rest of the system. Before a 2027 order, ask the dealer for two numbers in writing: the per-unit price against the same-maturity tall hybrid, and the yield gap at the grower's own planter width and seeding rate.
2. Who produced the evidence
What's new: Since 2023, a body of peer-reviewed and extension work on short-stature corn has built up. Sorted by who ran it and who paid for it, the independent part is small and the large samples are Bayer's.
Evidence:
| Study | Authorship / funding | Scale | Yield finding | Standability finding |
|---|---|---|---|---|
| Evers et al., Crop Science, 2026 | Authors include Bayer scientists (Kosola, Barten) | 444 site-years, 2019–21 | Loss of 28–75 kg/ha per unit of plant damage | 3.8% of short plots vs 10.6% of tall plots damaged |
| Dohleman et al., J. Environ. Qual., 2025 | "All research was funded by Bayer's Crop Science Division" | 107 + 92 site-years, 2017–22 | Conventionally bred: 14.0 vs 14.5 t/ha (normal density); biotech: 14.5 vs 14.3 t/ha, not significant | Root volume +39% |
| Ordóñez et al., Crop Science, 2024 | Purdue; co-author Dohleman | 2 experiments, West Lafayette, IN | Grain-yield parity across 0–224 kg N/ha | Not in abstract |
| Quinn & Oliva, Purdue, 2024 | Purdue "in partnership with Bayer CropScience" | 2 Indiana sites, 2023 | "Same or slightly lower" than tall | Plant height 67 vs 86 in. |
| Mendes da Silva & Singh, MSU, 2026 | Two Bayer short hybrids; funding not stated | 2 Michigan sites, 2024–25 | Short hybrids responded to narrow rows and 42,000 seeds/acre; tall did not | No significant harvest-loss difference |
| Licht, Iowa State, slides | Deck thanks an unnamed research sponsor | Ames, Nashua, Sutherland, 2023–24 | 20-in. vs 30-in. rows: 216.3 vs 209.2 bu/acre (P = 0.089) | — |
| Elmore, Ortez & Lindsey, Ag. & Environ. Letters, 2026 | No vendor authorship identified | Methods paper | — | Tall border plots may shelter short plots and inflate short-corn results |
Sources: Evers et al., Crop Science, 2026 (abstract); Dohleman et al., Journal of Environmental Quality, Nov 19, 2025; Ordóñez et al., Crop Science, Sep 19, 2024 (abstract); Quinn and Oliva, Purdue Kernel News, Feb 16, 2024; Mendes da Silva and Singh, Michigan Farm News, Mar 16, 2026; Licht, presentation deck, accessed Sep 16, 2026; Elmore, Ortez and Lindsey, Agricultural & Environmental Letters, Mar 23, 2026 (abstract).
The last row deserves more attention than it has had. Elmore, Ortez and Lindsey point out that when tall corn sits next to short corn, wind speed over the short plots could be reduced for 25 to 30 times the height difference. For a 0.6-meter gap, that is 15 to 18 meters downwind of the tall corn (Elmore, Ortez and Lindsey, Mar 23, 2026). Most comparison trials use narrow borders sized for shading, not wind. If the effect is not accounted for, they say, it "could inflate research results in favor of" short corn. That applies directly to small-plot lodging comparisons like the ones behind the 64% figure.
A Purdue systematic review of 45 studies and 17 patents from 1965 to 2024 explains why earlier short corn failed commercially: the dwarfing traits of the time damaged reproductive development. Modern hybrids avoid that with milder dwarfing, or with effects kept away from the ear (Wassgren et al., Nov 1, 2025).
Ground Truth: The independent university work agrees with Bayer on direction: short hybrids like more plants and narrower rows, and they don't give up much at harvest. But it is small-plot and mostly Bayer-germplasm work. None of it gives a public, replicated yield gap on a grower's 30-inch planter at a normal seeding rate, which is the comparison that decides a seed order. Treat the 444-site-year wind data as the strongest evidence in the file and the most exposed to the border problem at the same time.
3. Yield: parity at normal density is not parity
What's new: The largest yield data set, Bayer's 107 site-years of conventionally bred hybrids from 2017 to 2022, reports short hybrids at 14.0 t/ha under normal population and 15.1 t/ha under high population. Tall comparators came in at 14.5 and 15.0 t/ha (Dohleman et al., Nov 19, 2025). Normal density was 79,000–89,000 plants/ha, and high was 104,000–119,000. That is about 32,000–36,000 and 42,000–48,000 plants per acre (Crop Root Zone conversion).
Evidence: The high-density averages include 2017, a 17.2–17.4 t/ha year with no normal-density plots. Dropping 2017 and averaging the year means for 2018–2022 gives a like-for-like comparison.
| Comparison, 2018–22 year means | t/ha difference | bu/acre | |
|---|---|---|---|
| Short at high density vs short at normal | +0.62 | +9.9 | ██████████ |
| Short at high density vs tall at normal | +0.18 | +2.9 | ███ |
| Short at high density vs tall at high | +0.12 | +1.9 | ██ |
| Tall at high density vs tall at normal | +0.06 | +1.0 | █ |
| Short at normal density vs tall at normal | −0.44 | −7.0 |
Source: Dohleman et al., Journal of Environmental Quality, Nov 19, 2025, Table 5 (Bayer-funded). Crop Root Zone calculation: unweighted means of 2018–2022 yearly means, converted at 15.93 bu/acre per t/ha (56 lb/bu; the moisture basis is as reported in the paper). Year means may draw on different site counts, so treat these as indicative. Bars scale positive differences.
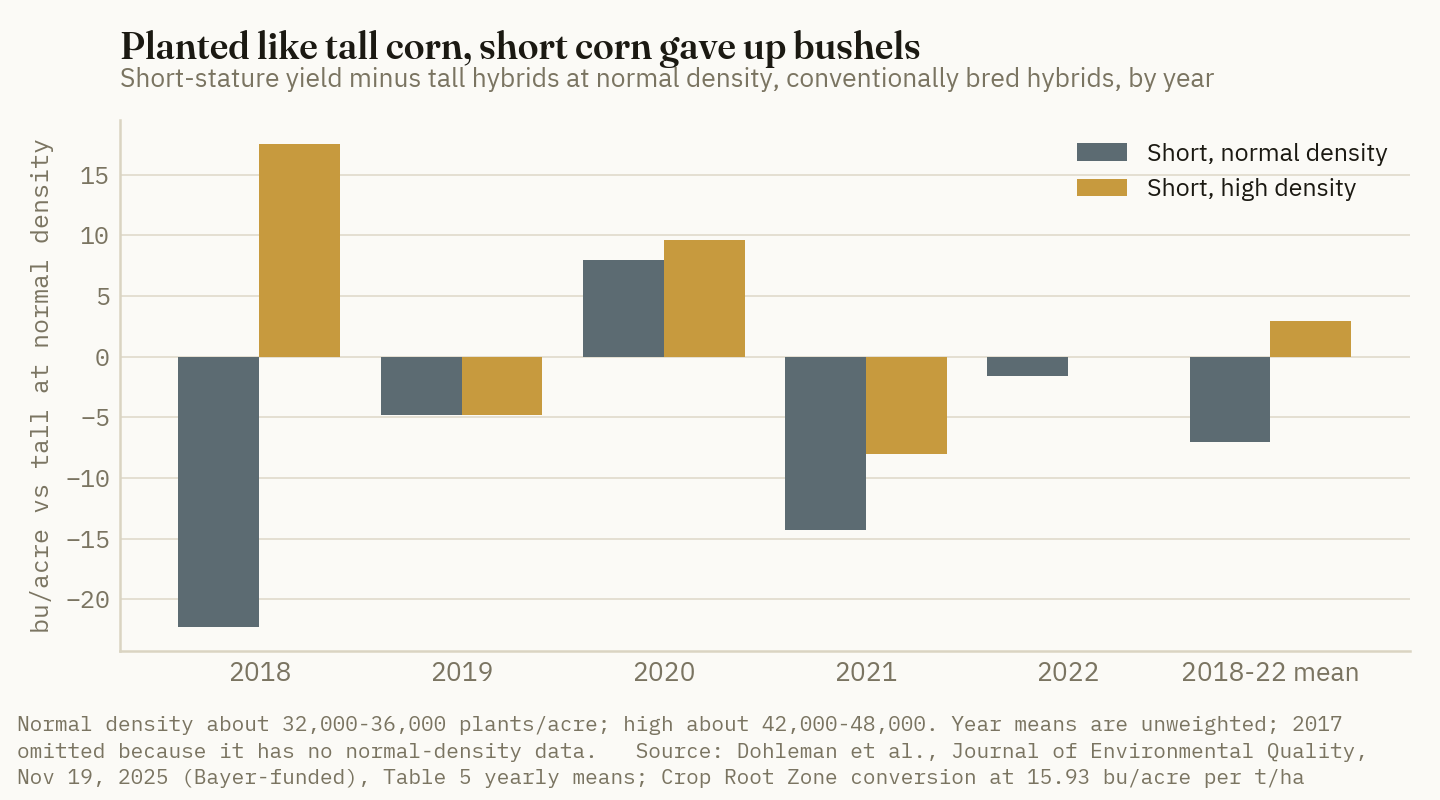
Two patterns stand out. First, a short hybrid planted at a tall hybrid's density gave up yield in four of the five years, 7 bushels on average. The one year it came out ahead at normal density was 2020, the derecho year, by 8 bushels. Second, the density response belongs to the short hybrids. Thick-planted tall corn gained about a bushel, and thick-planted short corn gained about 10. Against what most growers plant now, tall hybrids at normal density, the net edge in matched years is about 2.9 bushels.
The independent plots add a condition: row width. At Sutherland, Iowa, in 2023, a single short hybrid went from 222.8 bu/acre at 50,000 seeds in 20-inch rows to 209.3 at the same rate in 30-inch rows. In 30-inch rows, going from 34,000 to 50,000 seeds did nothing (210.1 vs 209.3). The seeding-rate effect across both widths was not significant (P = 0.41) (Licht, accessed Sep 16, 2026). Michigan State found that tall hybrids showed "no benefit of narrow rows" or of seeding above 34,000. Short hybrids peaked at 42,000 seeds, but pushing populations higher "may not always pay" (Mendes da Silva and Singh, Mar 16, 2026). The Michigan gains ran 7.6% at Lansing and 13% at Richville, measured from a 26,000-seed base that few Corn Belt growers use.
Ground Truth: The yield case for short corn is really a density-and-row-width case. Bayer's own data say that planting a short hybrid like a tall one costs bushels. The independent plots suggest the density payoff is strongest in rows narrower than the 30 inches most Corn Belt planters run. A grower who won't raise the seeding rate, or can't narrow the rows, should expect to give up yield in a calm year. For that grower, short corn is wind insurance with a premium paid in bushels.
4. What standing up is worth
What's new: The Bayer-authored wind study gives the first large-sample numbers for pricing standability. Across 444 site-years from 2019 to 2021, 10.6% of tall-hybrid plots and 3.8% of short-stature plots took some wind damage, a 64% reduction (Evers et al., Crop Science, 2026). Root lodging made up most of the data (39 site-years), with stalk lodging and greensnap at 9 and 8 site-years. Yield data from 41 damaged locations showed losses of 28 to 75 kg/ha per unit of plant damage, averaging 34 kg/ha.
3.8% vs 10.6%
Share of short-stature vs tall plots with wind damage across 444 Bayer site-years, 2019–2021. (Evers et al., Crop Science, 2026)
Evidence: We read "per unit of plant damage" as per percentage point of plants damaged. On that reading, the average loss is 0.54 bu/acre per point, with a range of 0.45 to 1.19 (Crop Root Zone conversion at 56 lb/bu). The abstract gives how often damage happened, but not how bad it was, so severity has to be assumed.
| Avg plant damage when an event hits | Loss rate, bu per point | Avoided loss, bu/acre/yr | $/acre/yr at $4.80 |
|---|---|---|---|
| 10% | 0.54 | 0.4 | 1.77 |
| 25% | 0.45 | 0.8 | 3.64 |
| 25% | 0.54 | 0.9 | 4.42 |
| 25% | 1.19 | 2.0 | 9.75 |
| 50% | 0.54 | 1.8 | 8.84 |
| 50% | 1.19 | 4.1 | 19.50 |
Source: Crop Root Zone estimate. Inputs: the 6.8-point gap in damage frequency (10.6% vs 3.8%) and loss rates of 28, 34 and 75 kg/ha per point (Evers et al., Crop Science, 2026); corn at $4.80/bu, the USDA 2026/27 season-average price (WASDE via High Plains Journal, Sep 14, 2026). Assumes equal severity in short and tall plots when damage occurs, which flatters tall corn, and research-plot damage frequencies, which may not match a given farm.
Extension rules of thumb for greensnap are harsher than Bayer's all-damage average. University of Nebraska and University of Minnesota work found yield falling about 1% for each 1% of stalks broken, and a Minnesota study put it at 0.5% to 0.73% (Licht and Clemens, ISU Integrated Crop Management, reviewed Jun 15, 2026). At the 211 bu/acre mid-case yield in Iowa State's 2026 corn-after-soybeans budget, 1% is about 2.1 bushels per point of greensnap. Root lodging early in the season often recovers. A University of Wisconsin study cited by Iowa State put losses at 2–6% for lodging at V10–V12 and 5–15% at V13–V15 (Sorenson, Glisan and Licht, Jul 8, 2022).
Two break-evens follow. Paying for 6,000 extra seeds ($22.74/acre) from wind protection alone would take about 8.7 points of plant damage avoided every year at Bayer's average loss rate. Spread over the 6.8-point frequency gap, that works out to more than 100% damage per event, which is impossible. On the stricter greensnap rule, it would take about 2.2 points of below-ear greensnap avoided every year, averaged across calm years and storm years (Crop Root Zone estimate).
Ground Truth: On the seller's own damage rates, wind protection is worth about a bushel an acre a year on an average field, not five. The value is lumpy: close to nothing in most years, and the whole crop in a 2020 year. That makes it insurance, and it should be priced by field, not across a whole farm. The fields where it pays are the greensnap-prone hybrid slots, high-rate irrigated corn, and ground where lodged corn has cost harvest time before. Harvest slowdown and field loss in lodged corn are real costs, but they are not in the per-point yield numbers above, so the true value in a bad year is higher than the table shows.
5. In-season access, and the full bushel ledger
What's new: The third claim is access. Short corn lets a ground sprayer or high-clearance applicator reach the crop after tassel, for VT nitrogen or R-stage fungicide, where tall corn needs a plane or a drone. Bayer credits split nitrogen with 0.24 t/ha on short hybrids, about 3.8 bu/acre (Dohleman et al., Nov 19, 2025), and cites 4.8 bushels from VT nitrogen at 15 locations (Bayer, Nov 1, 2024).
Evidence: Access is only worth something if the pass pays for itself, and the independent evidence says it depends on disease. In a Purdue trial at West Lafayette in 2023, three short hybrids yielded 257.8 bu/acre with no fungicide, 266.7 with an R1 application and 273.7 with R1 plus R3. Tar spot severity at R5 fell from 12.1% to 1.2% and 0.1% (Licht, accessed Sep 16, 2026). The same deck's summary says the hybrids "only have a response to fungicide when disease is present." What changes is the cost of the trip. Iowa's 2026 custom rates are $8.50/acre for ground broadcast spraying, $12.00 aerial, $12.50 by drone and $13.25 for high-clearance drop-hose liquid (ISU Ag Decision Maker A3-10, Mar 2026). Replacing a plane with a ground rig saves $3.50 a pass, about 0.7 bushels. Tall corn can still be sprayed from the air, so the access benefit per trip is a cost difference plus timing, not the full fungicide response.
Putting the pieces together gives the ledger.
| Item | $/acre | bu at $4.26 | bu at $4.80 | bu at $5.36 | |
|---|---|---|---|---|---|
| Hurdles | |||||
| +6,000 seeds/acre at $3.79/1,000 | 22.74 | 5.3 | 4.7 | 4.2 | ███████ |
| +8,000 seeds/acre | 30.32 | 7.1 | 6.3 | 5.7 | █████████ |
| +10,000 seeds/acre (Bayer "high" density) | 37.90 | 8.9 | 7.9 | 7.1 | ██████████ |
| Each $10/acre of trait premium (not public) | 10.00 | 2.3 | 2.1 | 1.9 | ███ |
| Documented offsets | |||||
| Matched-year yield edge, short high vs tall normal | — | — | 2.9 | — | ████ |
| Avoided wind loss, 25% severity, Bayer average rate | — | — | 0.9 | — | █ |
| Ground instead of aerial, per fungicide pass | 3.50 | 0.8 | 0.7 | 0.7 | █ |
Sources: Crop Root Zone estimate. Seed price from ISU Ag Decision Maker A1-20, Jan 2026; seeding guidance from Bayer, Nov 1, 2024; densities and yields from Dohleman et al., Nov 19, 2025; wind loss from Evers et al., Crop Science, 2026; custom rates from ISU Ag Decision Maker A3-10, Mar 2026. Prices: USDA NASS July 2026 price received, $4.26/bu (accessed Sep 16, 2026); USDA WASDE 2026/27 season-average price, $4.80/bu (High Plains Journal, Sep 14, 2026); December 2026 futures, $5.35¾ on Sep 15, 2026 (Brownfield Ag News). The yield edge already includes whatever wind damage hit the 2018–22 plots, so the offsets are separate lenses and should not simply be added. Bars scale bushels at $4.80.
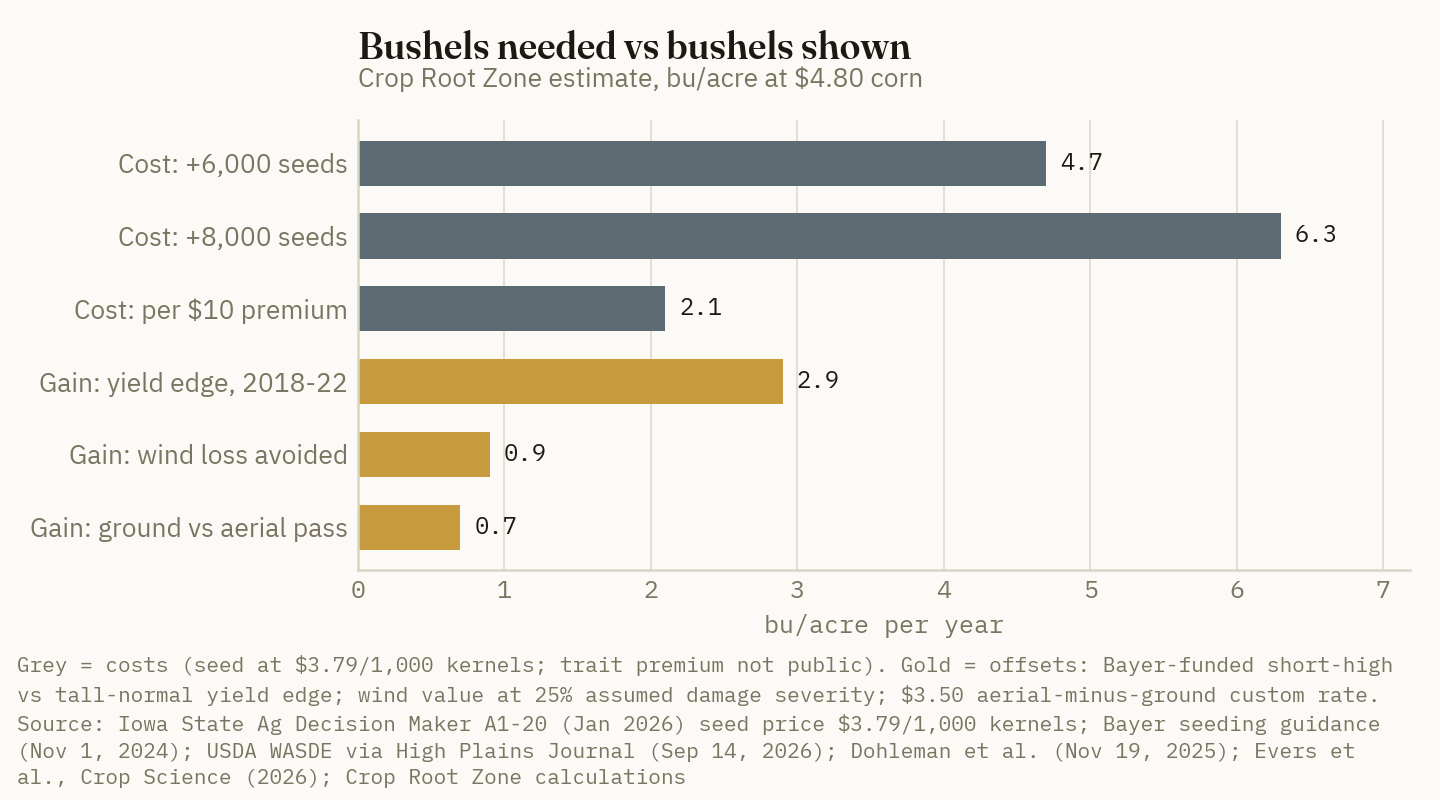
On matched-year data, the offsets do not cover the seed. At USDA's $4.80, the lowest Bayer-recommended seed increase costs 4.7 bushels, and the documented yield edge is 2.9. Adding a generous bushel of wind value still leaves a gap, before any trait premium. December futures near $5.36 after a late-August rally of roughly 90 cents (DTN, Sep 9, 2026) shrink the seed hurdle to 4.2 bushels, still above the edge. The case closes only under conditions that raise the offsets: disease pressure that makes a ground fungicide pass pay, a VT nitrogen response in the range Bayer reports, narrow rows, or a wind-prone field.
Ground Truth: For 2027, the rational order is a field-level trial, not a switch. Put short corn on the two or three fields where the offsets are most likely to show up: a history of greensnap or root lodging, a tar spot or southern rust history that already justifies an R-stage pass, and ideally a narrow-row planter. Plant it at the higher rate and leave a tall check at the grower's normal rate in the same field, with borders wide enough that the tall corn isn't sheltering the short. The quote to push the dealer on is the per-unit premium. At $4.80 corn, every $10 an acre is two more bushels a system that has documented about three has to find.
References
- AgBull Trading, "The Derecho That Wasn't — Until It Was: Complex Spares Western Belt Overnight, Then Reloads Over Eastern Iowa with 80-MPH Gusts," Aug 11, 2026 — https://www.agbull.com/the-derecho-that-wasnt-until-it-was-complex-spares-western-belt-overnight-then-reloads-over-eastern-iowa-with-80-mph-gusts/
- Bayer, "Bayer Advances Combined Seed and Crop Protection Pipeline and Enters Phase of Blockbuster Launches," press release, Huxley, Iowa, Sep 2, 2026 (via BioSpace) — https://www.biospace.com/press-releases/bayer-advances-combined-seed-and-crop-protection-pipeline-and-enters-phase-of-blockbuster-launches
- Red River Farm Network, "More Acres Devoted to Short-Stature Corn," Dec 17, 2025 — https://www.rrfn.com/2025/12/17/more-acres-devoted-to-short-stature-corn/
- Licht, M., "It's Not The Size Of The Corn But How It Yields," Iowa State University presentation deck (University of Missouri Crop Management Conference), undated, accessed Sep 16, 2026 — https://ipm.missouri.edu/crop_management_conference/presentations/licht.pdf
- Dohleman, F.G.; Barten, T.J.; Kosola, K.R. et al., "Short-stature maize systems reduce carbon intensity of grain production by an average of 13% compared to commercially relevant tall comparators," Journal of Environmental Quality, Nov 19, 2025 — https://pmc.ncbi.nlm.nih.gov/articles/PMC12628288/
- Corteva, "Vylor Launches a New Era in Corn," press release, Sep 1, 2026 — https://www.corteva.com/resources/media-center/vylor-launches-new-era-in-corn.html
- Bayer, "Positioning Preceon Smart Corn," Nov 1, 2024 — https://www.cropscience.bayer.us/articles/channel/positioning-preceon-smart-corn
- Bayer, "Row Spacing and Seeding Rate Effects on Short Stature Corn Yields" (2022 Gothenburg, NE trial), accessed Sep 16, 2026 — https://www.cropscience.bayer.us/articles/bayer/row-spacing-and-seeding-rate-effects-on-short-stature-corn-yields
- CBS2 Iowa, "Short stature corn gives promising results to withstand derecho wind speeds," Apr 12, 2021 — https://cbs2iowa.com/news/local/short-stature-corn-gives-promising-results-to-withstand-derecho-wind-speeds
- Iowa State University Extension and Outreach, Ag Decision Maker File A1-20, "Estimated Costs of Crop Production in Iowa — 2026," revised Jan 2026 — https://www.extension.iastate.edu/agdm/crops/pdf/a1-20.pdf
- Evers, B.; Dohleman, F.; Kosola, K.R.; Barten, T.J. et al., "Short-stature maize hybrids reduce the number of locations with wind damage by 64% in the US Midwest," Crop Science, 2026 (abstract) — https://doi.org/10.1002/csc2.70281
- Ordóñez, R.A.; Olmedo Pico, L.B.; Dohleman, F.; Fernández-Juricic, E.; Verhagen, G.S.; Vyn, T.J., "Short-statured maize achieved similar growth and nitrogen uptake but greater nitrogen efficiencies than conventional tall maize," Crop Science, Sep 19, 2024 (abstract) — https://doi.org/10.1002/csc2.21345
- Quinn, D.; Oliva, E., "Short-Stature Corn Hybrids: Next Evolution in U.S. Corn Production?," Purdue Agronomy Kernel News, Feb 16, 2024 — https://ag.purdue.edu/news/department/agry/kernel-news/2024/02/short-stature-corn-hybrids-next-evolution-us-corn-production.html
- Mendes da Silva, W.; Singh, M., "Does row spacing and seeding rates differ for short vs. tall corn hybrids?," Michigan State University via Michigan Farm News, Mar 16, 2026 — https://www.michiganfarmnews.com/does-row-spacing-and-seeding-rates-differ-for-short-vs-tall-corn-hybrids-
- Elmore, R.; Ortez, O.; Lindsey, A., "Windbreak effects may affect short-stature and tall-stature corn comparisons," Agricultural & Environmental Letters, Mar 23, 2026 (abstract) — https://doi.org/10.1002/ael2.70067
- Wassgren, A.S.; Poudel, P.; Brouder, S.; Quinn, D.J.; Volenec, J., "Short-statured maize, past challenges and future prospects: A systematic review," Agronomy Journal, Nov 1, 2025 (abstract) — https://doi.org/10.1002/agj2.70218
- High Plains Journal, "USDA lowers corn production forecast, raises soybean price outlook" (September 11 WASDE), Sep 14, 2026 — https://hpj.com/2026/09/14/wasde-report-sept-11/
- Licht, M.; Clemens, Z., "Greensnap," Iowa State University Integrated Crop Management Encyclopedia, last reviewed Jun 15, 2026 — https://crops.extension.iastate.edu/encyclopedia/greensnap
- Sorenson, G.; Glisan, J.; Licht, M., "Effects of the Derecho on Corn in NW Iowa," Iowa State University Integrated Crop Management, Jul 8, 2022 — https://crops.extension.iastate.edu/post/effects-derecho-corn-nw-iowa
- Iowa State University Extension and Outreach, Ag Decision Maker File A3-10, "2026 Iowa Farm Custom Rate Survey," revised Mar 2026 — https://www.extension.iastate.edu/agdm/crops/pdf/a3-10.pdf
- USDA NASS, "Prices Received: Corn Prices Received by Month, US" (data file), accessed Sep 16, 2026 — https://www.nass.usda.gov/Charts_and_Maps/Agricultural_Prices/pricecn.php
- Brownfield Ag News, "Closing Grain and Livestock Futures: September 15, 2026," Sep 15, 2026 — https://www.brownfieldagnews.com/market-news/closing-grain-and-livestock-futures-september-15-2026/
- Montgomery, R., "After Historic Late-August Price Rallies, USDA Returns With New Forecasts," DTN/Progressive Farmer, Sep 9, 2026 — https://www.dtnpf.com/agriculture/web/ag/news/article/2026/09/09/historic-late-august-price-rallies
Disclosures
Crop Root Zone is an independent publication. Nothing here is investment advice. Market calls, where included, reflect the editors' own read and are not a recommendation to buy or sell any security.
Discussion
USDA had 13% of the corn crop harvested on September 20, ahead of the 11% average. This issue's drying feature puts owned-dryer energy near 2.8 cents per bushel-point at Iowa's $1.48 farm propane, and it argues that dryer throughput, not fuel, now sets the harvest pace. So: at what moisture are you starting corn this fall, what is your propane contracted or delivered at per gallon, and are you deciding which fields go to the dryer first by moisture or by stalk quality? Tell us your custom drying charge per point too, if you pay one, and whether it has changed from last year.
Corrections are as welcome as answers. If you check our arithmetic against a primary source and find we have it wrong, tell us. The sharpest replies get answered in next week's Letters & Responses.