Issue 09 · 2026-09-14
This issue carries a question and its answer side by side, and we have left both in on purpose. Our preview of the September report, written the day before it came out, pointed out that the trade expected a 233-million-bushel corn cut to take only 120 million off the carryout, and asked which 113 million bushels of demand were supposed to disappear. USDA answered on Friday: it cut the crop by 213 million, and took 150 million out of feed and residual — the one line nobody measures directly. The carryout fell 86 million. You can read the question and then the answer, and judge the preview against the outcome.
The same pattern runs through the rest of the book. The soybean price forecast rose 60 cents on a crop that got bigger, and the arithmetic sits in soybean meal, not in stocks. Anhydrous is still the cheapest nitrogen per pound, but its discount to urea has narrowed by about a third in a year — and record diesel explains less than a dollar an acre of that.
In each case the headline number is accurate and the line underneath it does the work. This week we tried to print the line underneath.
— Crop Root Zone, Editorial Desk
Letters & Responses
No reader correspondence reached us this week. We searched the inbox for the eight days since RZ-008 went up and found nothing on the issue — no questions, no corrections, no pushback. Email is the only inbound route to this publication, so an empty week here is an empty week in fact. We would rather say so than invent a letter.
Two items stay on the record.
RZ-008's closing question is still unanswered. We asked what you are being quoted for a fall anhydrous stabiliser, per acre and by product, and whether your retailer prices it per acre, per ton of product, or bundled into application. No one wrote in. This issue's nitrogen feature adds a reason to ask: anhydrous's per-pound discount to urea is down to about 15 cents from roughly 22 a year ago, so a stabiliser that fit inside a $33-an-acre advantage last autumn has to fit inside about $22.50 this one, at 150 pounds of N.
The standing question on nitrogen hedging remains open. A reader wrote to RZ-004 that a grower has no practical instrument for hedging a nitrogen bill the way grain can be hedged. Nothing has changed, and this week's numbers restate the exposure: wholesale urea futures rose about 15% in the month to September 11 while the late-August retail survey still showed urea falling. The correspondent asked to remain anonymous and remains so.
A note on our own preview. TRZ-0181, written before the September report, relayed a consensus of a 233-million-bushel corn cut and a 120-million-bushel carryout cut. USDA delivered 213 and 86. We run the preview in this issue beside TRZ-0189, which covers the actual report, so readers can see where the expectation and the outcome diverged. Nothing in the preview was a forecast of our own, and it is not corrected; it was an accurate account of what the trade expected.
Corrections, disagreements and quotes from your own operation are all welcome. The sharpest get answered here next week.
In This Issue
This week's features, by department.
- Anhydrous's Discount to Urea Shrank by About a Third in a Year. Record Diesel Took Less Than a Dollar an Acre of It.Anhydrous is still the cheapest retail nitrogen at $0.56 a pound against $0.71 for urea — a $22.50-an-acre edge at 150 pounds. The extra application fuel for a toolbar pass at $5.95 diesel is $2.38 an acre, and diesel would have to reach about $56 a gallon to erase the gap. What narrowed the discount was anhydrous itself, up 21% on the year while urea rose 4%.
- China Is Supplying Two-Thirds of India's Urea Tender at $390. The Same Buyer Paid $935 in April.Beijing's export allowance reopened at the moment India was short, and the 58% collapse in the tender price is now the reference every northern-hemisphere fall fill program is being written against.
- Nitrogen Fell 20% Since May. Phosphate Rose 0.4%. That Is Not a Lag — It Is Two Different Export Policies.Retail urea, anhydrous, UAN28 and UAN32 are all down 17% to 22% since late May while DAP, MAP and potash have not moved a full percent. China reopened one export queue and extended the curbs on the other.
- Brazil Now Imports as Much Ammonium Sulfate as Urea. It Is Bidding for a Nylon Byproduct, and So Are You.Brazilian amsul imports reached parity with urea in 2025 at about 6.7 million tonnes each and moved ahead of it in early 2026 — roughly a fifth of world output going to one buyer, out of a stream where half the supply is a co-product of caprolactam and does not respond to fertilizer prices at all.
- The Sanctions Came Off Belarusian Potash Nine Months Ago. The Reason None Arrived Is the Price.US restrictions ended 13 December 2025 with immediate effect. Retail potash is still $493/st and still up 2% year over year — because at NOLA barge levels the United States is the worst-paying destination a returning exporter could pick.
- USDA Took 236 Million Bushels Out of Corn Supply. 150 Million of Them Came Out of Feed Demand, Not the Carryout.The September balance sheet cut production 213 million bushels and trimmed beginning stocks 23 million, then lowered feed and residual use by 150 million — so ending stocks fell only 86 million while the season-average price forecast rose 30 cents. The line doing the work is the one USDA cannot directly measure.
- USDA Raised the Soybean Price 60 Cents on a Crop That Got Bigger. Soybean Meal Did Almost All of the Arithmetic.September's soybean balance sheet added 16 million bushels of production and 25 million of exports, cut ending stocks 10 million to 310 million, and lifted the season-average price to $12.00. Held against USDA's own crush yields, a $30 meal price increase adds about 71 cents a bushel of product value — more than the whole bean price revision.
- Two-Thirds of Illinois Farm Managers Expect 2027 Rent to Be Exactly What 2026 Was. Nine Percent Expect It Higher.Rent is the first 2027 cost a grower locks and the only one he negotiates before knowing a single 2027 price — and on Illinois excellent ground it has moved $10 an acre in two years while the nitrogen bill moved several times that.
- The September Report Is Expected to Take 233 Million Bushels Off the Corn Crop and Only 120 Million Off the CarryoutThe missing 113 million bushels are demand the trade already assumes price will ration away. Corn opened September rated 56% good-to-excellent, the worst September opening in three years, and the yield loss that caused is worth about $12 an acre against a rally worth about $160.
- The Largest Soybean Crop in American History Is Bid $13.09. Last Year's Smaller One Was Bid $10.30.A 27% year-over-year price gain on record production, a 290-million-bushel carryout, and a soybean-to-corn ratio of 2.48 — which overstates soybeans for 2027, because the ratio cannot see that corn's nitrogen bill fell 20% over the summer.
- Midwest Diesel Is $2.19 a Gallon Above Last September. A Harvest-and-Fall-Tillage Pass on Corn Ground Burns About 2.9 Gallons an Acre.At $5.95 a gallon, the fuel inside a combine pass, grain haul, chisel and fall anhydrous application costs about $17 an acre against $11 a year ago. The field operation whose cost moved most is the one a grower can still decide not to run: fall tillage.
- A 55-Foot Bar at 5 MPH Empties a 1,450-Gallon Nurse Tank in 57 Minutes. The Toolbar Was Never the Constraint.At 200 pounds of anhydrous per acre, one full nurse tank covers about 32 acres and carries roughly $2,900 of product at the September retail price — so fall nitrogen throughput is a tank-turn problem and a road problem, and widening the bar makes it worse.
- The Combine Will Be Done Early This Year. The Soil Will Not Be Cold Early. An Early Harvest Lengthens the Wait, Not the Ammonia Season.Corn ran six points ahead of average on denting and spring wheat nine points ahead on harvest, but the 50°F gate at four inches still arrives in late October or later — and anhydrous is now both the only nitrogen recommended for fall and the only one carrying a real discount. The constraint that binds is nurse tank turns: about one an hour, per machine.
- A Second Nitrogen Pass Costs the Equivalent of 24 Pounds of N Before Any Nitrogen Is BoughtIowa's 2026 custom rate survey puts anhydrous side-dressing at $13.55 an acre and dry bulk spreading at $8.15. Against anhydrous at $0.56 a pound of N, the machine time alone is the number the split-application argument has to clear.
- The Two-Pass Boron Program Beats the One-Pass Program. Almost All of the Difference Is the Cost of the Second Trip.Multi-year trial work puts foliar boron at R1 and R3 ahead of a single application — but the yield response and the pass count are confounded, and on a field already scheduled for an R3 fungicide the honest question is what the R1 trip is worth on its own.
- The Same 33 Pounds of Displaced Nitrogen Is Worth $18.48 to an Anhydrous Grower and $25.08 to a UAN GrowerA microbial nitrogen product sold on how much synthetic N it replaces is a product whose value is indexed to the nitrogen price — which is why the 2026 lineup was repriced roughly 30% lower, and why the grower most likely to buy it is the one it is worth least to.
- Polyhalite Carries Four Nutrients and Is Rated on One. That Tells You What It Actually Is.The published best-management guidance says to set the rate by sulfur requirement, which makes a 14% K2O product a sulfur product with potassium attached — and puts its US break-even at roughly $423 a ton delivered before any magnesium or calcium credit.
- A Corrective Zinc Broadcast Has to Return 1.4 Bushels of Corn, Once. The Argument Is About the Soil Test.Nebraska's guidance calls 0.4–0.8 ppm DTPA 'medium' and lists corn among the crops with a high probability of response — so for corn the ambiguous band is not ambiguous, and fall is when the pass is already being paid for.
State of the Industry
The week had one scheduled event and one unscheduled one, and the unscheduled one is doing more to fall cost budgets.
The report arrived, and the market sold it. USDA's September 11 reports cut the corn crop 213 million bushels to 15.800 billion on a 178.5-bushel yield, lowered ending stocks 86 million to 1.567 billion, and raised the season-average price forecast to $4.80 (USDA NASS; USDA WASDE-675, Sep 11, 2026). Soybean production rose to 4.535 billion and the price forecast rose 60 cents to $12.00 (WASDE-675). Futures did not follow the forecasts: December corn settled at $5.30¼, down 3½ cents, November soybeans at $12.96½, down 35¾, and December Chicago wheat at $7.25¼, down 16, with soybeans and wheat both sharply lower on profit-taking and technical selling (Brownfield Ag News, Sep 11, 2026). Wheat export sales fell to a marketing-year low of 7.1 million bushels while the trade watched the Black Sea (Brownfield Ag News, Sep 11, 2026).
The unscheduled event is diesel. Midwest on-highway diesel reached $5.946 a gallon in the week of September 7, up $2.19 from a year earlier (EIA), and the national average hit $6.05 on September 11 as the U.S.–Iran war kept Strait of Hormuz tanker traffic disrupted (Associated Press via Transport Topics, Sep 11, 2026). The IEA puts Gulf diesel exports at about a quarter of pre-war levels (IEA Oil Market Report, Sep 11, 2026). That lands on harvest, tillage and fall application simultaneously.
Nitrogen is moving in two directions at once. The September Tampa ammonia contract settled $80 lower at $555 per tonne CFR, the fourth straight decline from May's $825, on reduced offtake from phosphate production (Australian Fertilizer Corporation weekly update, w/e Aug 28, 2026). But urea futures rose 14.8% in the month to $450.75 per tonne on September 11 (Trading Economics). The latest retail survey, from the last week of August, still shows urea and UAN falling (DTN/Progressive Farmer, Sep 2, 2026) — so the retail counter has not yet seen the wholesale turn.
| Benchmark | Level | Basis | Move |
|---|---|---|---|
| Anhydrous | $923/ton | Delivered retail, wk Aug 24–28 | −3.9% MoM; +21% YoY |
| Urea | $655/ton | Delivered retail, wk Aug 24–28 | −5% MoM; +4% YoY |
| Urea futures | $450.75/t | Futures, Sep 11 | +14.8% m/m |
| Tampa ammonia, Sep | $555/t | CFR contract | −$80 m/m |
| DAP | $918/ton | Delivered retail, wk Aug 24–28 | +0.4% MoM; +7% YoY |
| DAP, India | $915–935/t | CFR, w/e Aug 28 | Lower w/w |
| Potash | $493/ton | Delivered retail, wk Aug 24–28 | −0.2% MoM; +2% YoY |
| MOP, Brazil | $385–395/t | CFR, w/e Aug 28 | About −2% w/w |
| Dec corn | $5.30¼ | CBOT settlement, Sep 11 | −3½¢ |
| Nov soybeans | $12.96½ | CBOT settlement, Sep 11 | −35¾¢ |
| Midwest diesel | $5.946/gal | On-highway retail, wk Sep 7 | +$2.19 YoY |
Sources: DTN/Progressive Farmer, Sep 2, 2026 (retail, week of Aug 24–28 — the most recent survey available at writing); Trading Economics, accessed Sep 14, 2026; Australian Fertilizer Corporation, Weekly Update — Global Fertiliser Markets, w/e Aug 28, 2026; Brownfield Ag News, Sep 11, 2026; U.S. Energy Information Administration, accessed Sep 14, 2026.
Phosphate and potash are drifting, not moving. India DAP eased to $915–935/t CFR and Brazil MAP to $840–860/t CFR, its lowest since March, with sulfur costs limiting how far phosphate can correct; Brazilian potash slipped about 2% as the soybean-planting buying season ended (Australian Fertilizer Corporation, w/e Aug 28, 2026).
The week's verdict: USDA made corn smaller and soybeans dearer on paper, the futures market declined both, and the input that actually rose this week — diesel — is the one no fall budget written in July assumed.
Weekly Briefing
Fertilizer
Tampa ammonia falls for a fourth straight month — The September contract settled $80 lower at $555 per tonne CFR, down from May's $825 peak. The drop is attributed to reduced ammonia offtake from phosphate operations rather than a uniform repricing across the Atlantic basin. (Australian Fertilizer Corporation, Weekly Update — Global Fertiliser Markets, w/e Aug 28, 2026)
Urea futures turn up 15% in a month — Urea futures reached $450.75 per tonne on September 11, up 14.8% on the month and 13.7% on the year, after easing to around $400 in August on progress in Strait of Hormuz negotiations and relaxed Chinese export restrictions. (Trading Economics, accessed Sep 14, 2026)
European gas is setting a high floor under Atlantic nitrogen — Dutch TTF gas for September traded above €66.50/MWh, about $22.70/MMBtu, putting indicative European break-evens near $837/t for ammonia and $605/t for urea ex-works, which supports import demand and Atlantic basin prices. (Australian Fertilizer Corporation, w/e Aug 28, 2026)
Potash buyers shift from Brazil to Southeast Asia — Brazilian MOP eased about 2% to $385–395/t CFR as the soybean-planting buying season ended, while first-round offers in an Indonesian tender came in at $440–450/t CFR. (Australian Fertilizer Corporation, w/e Aug 28, 2026)
Crops
USDA trims corn to 15.8 billion bushels — NASS put the national yield at 178.5 bu/acre, down 2.2 from August and 8.0 from 2025, and said the crop would still be the second largest on record. Soybeans were forecast at 4.53 billion bushels, up 6% on 2025. (USDA NASS, Crop Production, Sep 11, 2026)
Futures sold the report — December corn settled at $5.30¼ (−3½¢), November soybeans at $12.96½ (−35¾¢) and December Chicago wheat at $7.25¼ (−16¢), with soybeans and wheat sharply lower on profit-taking and technical selling. (Brownfield Ag News, Sep 11, 2026)
Wheat export sales hit a marketing-year low — Weekly wheat sales fell to 7.1 million bushels, partly on high prices, while new-crop corn sales totalled 75.9 million bushels, mainly to Mexico and Japan, and new-crop soybeans nearly 96.9 million, mainly to China and unknown destinations. (Brownfield Ag News, Sep 11, 2026)
Home & Garden
Heat-wave damage: scrape before you prune, and hold the fertiliser — A horticulture researcher advises scraping bark to find green tissue before writing off woody plants, pruning only dead stems, reseeding bare lawn patches mid-to-late September, and not fertilising hard, dry soil until moisture returns, since the product mostly washes away. Salvia, verbena and lavender came through this summer better than hydrangea and rhododendron. (Ross Cameron, The Conversation, via Phys.org, Sep 10, 2026)
Gardeners in the Netherlands buried their underpants to test their soil — In Leiden University's "Proef je Tuin!" project, 115 community gardeners in Leiden and The Hague buried cotton underwear and grew mangetout peas; the more fabric that disappeared, the more active the soil life. Decomposition varied considerably between plots within weeks. It is a crude assay, but a real one. (Phys.org, Sep 7, 2026)
Micronutrients
Soil plus foliar zinc beats either alone for grain zinc — A systematic review and network meta-analysis of 44 field trials found combined soil and foliar zinc raised grain zinc by 28.7 mg/kg in wheat, 6.8 mg/kg in rice and 7.9 mg/kg in maize. The authors rate the certainty of evidence as low because results varied widely between studies. (Campbell Systematic Reviews, May 2026)
Zinc can cost you iron — A review of agronomic biofortification describes zinc and iron competing at root uptake, xylem transport and phloem remobilisation, with reported grain iron reductions from 4% to over 50% after zinc application, and finds modern wheat cultivars less responsive to external micronutrient fertilisation than older ones. A reason to test for both before correcting one. (Frontiers in Plant Science, Apr 13, 2026)
Organics
Organic wheat out-earned wildflower strips in a German comparison — Across nine landscapes near Göttingen, both organic management and wildflower strips raised biodiversity 20–30% over conventional winter wheat; organic fields returned about 150% more profit despite roughly 50% lower yields. The authors caution that strips were likely placed on less productive field edges, which skews the yield comparison. (Journal of Applied Ecology, via Phys.org, Sep 2026)
Dead microbes as an early read on soil carbon — Researchers at North Carolina State, NC A&T and Emory report that microbial biomass and necromass can indicate soil carbon gains under regenerative practices years before bulk soil-carbon tests detect them. Minimum-till and no-till showed no significant carbon difference in the study. (Journal of Natural Resources and Agricultural Ecosystems, via Phys.org, Sep 3, 2026)
Urine-derived fertiliser moves from curiosity to pilot programmes — Collection and reuse programmes are running in the United States, Switzerland and Australia; an adult produces about 500 litres of urine a year containing almost all of the nitrogen and about half of the phosphorus a person excretes. Separate plumbing, pathogen and pharmaceutical management, and regulation remain the barriers. (The Conversation, via Phys.org, Sep 9, 2026)
Up and Coming
CRISPR-Combo speeds regeneration of hard-to-edit perennial crops — A Texas A&M AgriLife, University of Maryland and USDA team pairs gene editing with activation of a plant's own regeneration genes; citrus regeneration efficiency reached 80% or higher against under 60% in controls, and strawberry regeneration was shortened by more than a month. Laboratory results; commercial varieties still need testing. (Nature Communications, Sep 10, 2026)
A six-species microbial community lifted tomato growth under heat — Kyoto University, Tohoku University and RIKEN researchers designed a defined community of six bacterial species with the tomatine metabolite, using machine-learning models, and validated increased above-ground fresh weight in outdoor trials. Early-stage: one crop, one research programme, and about two years of controlled work behind it. (The ISME Journal, via Phys.org, Sep 8, 2026)
Interesting
Ten thousand years of wheat and barley share a climate playbook — INRAE-led teams reconstructed ancient genomes and analysed 1,420 modern varieties to identify roughly 100 gene variants that helped wheat and barley adapt to changing climates through domestication — a new map for breeders. (Molecular Plant and Nature Plants, via Phys.org, Sep 11, 2026)
Saltwater flooding reorders which crops pay — An analysis of Greater Lincolnshire farmland found every major crop loses money as soil salinity rises, potatoes most steeply, with winter wheat the most resilient. Salt persists in soil for years after a flood, so the ranking outlasts the event. (Phys.org, Sep 13, 2026)
Off the Wall Discovery
Fungicides may be training soil bacteria to resist multiple drugs — Trinity College Dublin researchers found agricultural fungicides accelerated the evolution of multidrug resistance in soil bacteria within 16 weeks, and that fungicide plus warming disrupted microbes and cut plant biomass more than either alone. Controlled laboratory experiments, not field measurements. (Evolutionary Applications and The ISME Journal, via Phys.org, Sep 11, 2026)
Gulf of Mexico corals keep a 270-year record of Corn Belt nitrogen — Nitrogen isotopes in coral skeletons from 1753 to 2023 indicate that more than 60%, and at times up to 80%, of the reefs' nitrogen came from the Mississippi River basin, with bleaching and disease coinciding with the highest-nitrogen, hottest years of 2016 and 2022–2023. The study, co-led by Louisiana State University, links a farm input to a reef ecosystem through a chemical signature rather than a model. (Science Advances, via Phys.org, Sep 11, 2026)
Anhydrous's Discount to Urea Shrank by About a Third in a Year. Record Diesel Took Less Than a Dollar an Acre of It.
Anhydrous is still the cheapest retail nitrogen at $0.56 a pound against $0.71 for urea — a $22.50-an-acre edge at 150 pounds. The extra application fuel for a toolbar pass at $5.95 diesel is $2.38 an acre, and diesel would have to reach about $56 a gallon to erase the gap. What narrowed the discount was anhydrous itself, up 21% on the year while urea rose 4%.
Anhydrous ammonia was the cheapest nitrogen at the retail counter in the fourth week of August at $0.56 per pound of N, against $0.71 for urea, $0.72 for UAN32 and $0.76 for UAN28 (DTN/Progressive Farmer, Sep 2, 2026). What has changed is the size of the gap — and, since July, the price of the diesel that runs the toolbar.
Midwest on-highway diesel averaged $5.946 a gallon in the week of September 7, up $2.19 from the same week of 2025 (U.S. Energy Information Administration, accessed Sep 14, 2026). Anhydrous application burns more fuel per acre than broadcasting dry product, so a fair question for a fall nitrogen buyer is whether record diesel has eaten the anhydrous advantage. It has not. The advantage has narrowed, but for a different reason.
1. The per-pound ranking, and how much of it moved in a month
What's new: All four major nitrogen products were lower than a month earlier in DTN's August 24–28 survey, with the largest declines in UAN28 and urea.
Evidence:
| Product | $/ton, retail | Month ago | MoM | YoY | $/lb N | |
|---|---|---|---|---|---|---|
| Anhydrous (82% N) | 923 | 960 | −3.9% | +21% | 0.56 | ███████ |
| Urea (46% N) | 655 | 686 | −5% | +4% | 0.71 | █████████ |
| UAN32 | 458 | 459 | −0.2% | −5% | 0.72 | █████████ |
| UAN28 | 428 | 464 | −8% | +2% | 0.76 | ██████████ |
Source: DTN/Progressive Farmer, "Fertilizer Prices Fall as UAN28, Urea Lead the Way Lower," Sep 2, 2026 (delivered retail, week of Aug 24–28, 2026). Bars scale price per pound of N.
Ground Truth: The month's biggest declines ran against the anhydrous discount, not in its favour. UAN28 fell 8% and urea 5% while anhydrous fell 3.9%, so the two most widely compared alternatives got closer to anhydrous on a per-pound basis; only UAN32, nearly unchanged, drifted further away. A buyer who priced a fall anhydrous program in late July on a wide spread and waited has watched part of the reason for choosing it disappear without anhydrous getting more expensive.
2. A year ago the discount was wider
What's new: DTN reports each product's year-on-year change. Applying those changes to the current prices gives an approximate year-ago retail level, and with it an approximate year-ago per-pound spread.
Evidence:
| Product | $/ton now | YoY change | Implied $/ton a year ago | $/lb N a year ago | Discount vs anhydrous, then | Discount vs anhydrous, now |
|---|---|---|---|---|---|---|
| Anhydrous | 923 | +21% | 763* | 0.47* | — | — |
| Urea | 655 | +4% | 630* | 0.68* | +0.22* | +0.15 |
| UAN32 | 458 | −5% | 482* | 0.75* | +0.29* | +0.16 |
| UAN28 | 428 | +2% | 420* | 0.75* | +0.28* | +0.20 |
Source: DTN/Progressive Farmer, Sep 2, 2026 (current prices and YoY changes). *Crop Root Zone estimates: year-ago price = current ÷ (1 + YoY change); per-pound values use nominal N content. DTN rounds YoY changes to whole percentages, so these year-ago figures carry roughly ±1% error.
At 150 pounds of N per acre, anhydrous's discount to urea is worth about $22.50 an acre today against roughly $33 a year ago (Crop Root Zone estimate).
Ground Truth: Anhydrous is up 21% on the year and every other nitrogen source is within a few points of flat. That single fact explains most of the narrowing. It also means the anhydrous advantage is now more exposed to anhydrous-specific supply events — terminal outages, pipeline issues, a contract reset — than it was a year ago, because the cushion that absorbed such events has been cut by about a third.
3. The fuel does not close the gap
What's new: Iowa State's February 2026 fuel-requirement tables allow the application pass to be priced alongside the product.
Evidence: Anhydrous application at 30-inch spacing requires about 0.55 gallons of diesel per acre; spreading dry fertilizer with a bulk cart about 0.15; a trailer-type sprayer about 0.10 (Iowa State University Ag Decision Maker A3-27, revised Feb 2026).
| Program, 150 lb N/acre | Nitrogen $/acre | Pass | Gal/acre | Fuel $/acre at $5.946 | Product + fuel $/acre |
|---|---|---|---|---|---|
| Anhydrous | 84.00 | Toolbar | 0.55 | 3.27 | 87.27 |
| Urea | 106.50 | Bulk spreader | 0.15 | 0.89 | 107.39 |
| UAN32 | 108.00 | Sprayer* | 0.10 | 0.59 | 108.59 |
| UAN28 | 114.00 | Sprayer* | 0.10 | 0.59 | 114.59 |
Sources: DTN/Progressive Farmer, Sep 2, 2026 ($/lb N); ISU Ag Decision Maker A3-27, Feb 2026 (fuel per acre); EIA Midwest diesel, week of Sep 7, 2026. *Using the trailer-sprayer fuel figure for a UAN broadcast pass is a Crop Root Zone assumption. Rates and dollar values are illustrative Crop Root Zone calculations and exclude machinery, labor, custom-hire charges and any inhibitor.
The extra fuel for a toolbar pass instead of a spreader pass is 0.40 gallons, or $2.38 an acre at $5.946 diesel — against $1.50 at last September's $3.754 (Crop Root Zone calculation). Record diesel took about $0.88 an acre out of the anhydrous advantage on the year. The product price took roughly $10.50.
≈$56/gal
The diesel price at which the extra toolbar fuel would erase anhydrous's $22.50-an-acre product discount to urea at 150 lb N (22.50 ÷ 0.40 gal). (Crop Root Zone calculation, Sep 2026)
Ground Truth: Diesel is not a nitrogen-source variable at any price the market is likely to see. The toolbar costs more to pull, but the difference is small next to the product spread, and it would take a tenfold rise in diesel to change the ranking. Where the pass cost genuinely matters is custom application, where the per-acre charge — not the fuel inside it — is the comparison, and that charge should be checked against this fall's diesel rather than against a rate sheet written before July.
4. Wholesale urea turned up while retail was still falling
What's new: Urea futures rose to $450.75 per tonne on September 11, up 14.8% in a month and 13.7% on the year, according to Trading Economics — while DTN's retail survey for late August still showed urea down 5% on the month.
Evidence: Trading Economics attributes the August retreat to around $400 per tonne to easing concern over Middle East supply disruptions, progress in Strait of Hormuz negotiations, China relaxing export restrictions, seasonally weaker demand and reduced purchases by Brazil (Trading Economics, accessed Sep 14, 2026).
| Urea price series | Latest | 1-month change | Year-on-year | Basis |
|---|---|---|---|---|
| Urea futures | $450.75/t | +14.8% | +13.7% | Futures, Sep 11, 2026 |
| Retail urea (DTN) | $655/st | −5% | +4% | Delivered retail, wk of Aug 24–28, 2026 |
Sources: Trading Economics, urea, accessed Sep 14, 2026; DTN/Progressive Farmer, Sep 2, 2026. The two series use different units, bases and dates and are shown for direction, not level.
| If retail urea moves by | Urea $/lb N | Discount vs anhydrous at $0.56 | Anhydrous advantage at 150 lb N |
|---|---|---|---|
| −5% | 0.67 | +0.11 | $17.18 |
| 0% | 0.71 | +0.15 | $22.50 |
| +5% | 0.75 | +0.19 | $27.83 |
| +10% | 0.78 | +0.22 | $33.15 |
Crop Root Zone scenarios from DTN's $0.71/lb N urea and $0.56/lb N anhydrous (Sep 2, 2026), holding anhydrous constant. Not a forecast.
Ground Truth: Retail fertilizer follows wholesale with a lag, and in this snapshot the two series point in opposite directions. If the wholesale rebound reaches the retail counter, the anhydrous discount widens back toward last year's level without anhydrous moving at all. That argues against locking urea or UAN on the strength of the August declines, and for a buyer comparing sources to recheck the spread in DTN's September surveys before committing — the late-August snapshot may prove to be the narrowest the gap looks this fall.
5. What to check before booking fall nitrogen
What's new: The inputs to the source decision — retail spreads, wholesale direction and application cost — moved in different directions over the same six weeks.
Evidence:
| Check | Current reading | Direction since late July |
|---|---|---|
| Anhydrous $/lb N | $0.56 (DTN, wk Aug 24–28) | Lower |
| Urea $/lb N | $0.71 (DTN, wk Aug 24–28) | Lower |
| Urea futures | $450.75/t (TE, Sep 11) | Higher in the last month |
| Midwest diesel | $5.946/gal (EIA, wk Sep 7) | Higher |
| Extra toolbar fuel vs spreader | $2.38/acre | Higher |
Sources: DTN/Progressive Farmer, Sep 2, 2026; Trading Economics, accessed Sep 14, 2026; EIA, accessed Sep 14, 2026; ISU A3-27, Feb 2026.
Ground Truth: Book the source on the per-pound spread and the soil conditions, not on the fuel headline. The spread is narrower than a year ago but still about $20 an acre after fuel at 150 pounds, and the only series currently pushing it wider is wholesale urea. The item most likely to change a fall anhydrous decision this month is not diesel — it is whether soils cool on schedule after an early harvest.
References
- DTN/Progressive Farmer, "Fertilizer Prices Fall as UAN28, Urea Lead the Way Lower," Sep 2, 2026 (retail survey week of Aug 24–28, 2026) — https://www.dtnpf.com/agriculture/web/ag/crops/article/2026/09/02/fertilizer-prices-fall-uan28-urea
- U.S. Energy Information Administration, Weekly Midwest (PADD 2) No. 2 Diesel Retail Prices, accessed Sep 14, 2026 — https://www.eia.gov/dnav/pet/hist/LeafHandler.ashx?n=PET&s=EMD_EPD2D_PTE_R20_DPG&f=W
- Iowa State University Extension and Outreach, Ag Decision Maker File A3-27, "Fuel Required for Field Operations," revised February 2026 — https://www.extension.iastate.edu/agdm/crops/pdf/a3-27.pdf
- Trading Economics, Urea — price and commentary, accessed Sep 14, 2026 (futures $450.75/t on Sep 11, 2026) — https://tradingeconomics.com/commodity/urea
Disclosures
Crop Root Zone is an independent publication. Nothing here is investment advice. Market calls, where included, reflect the editors' own read and are not a recommendation to buy or sell any security.
China Is Supplying Two-Thirds of India's Urea Tender at $390. The Same Buyer Paid $935 in April.
Beijing's export allowance reopened at the moment India was short, and the 58% collapse in the tender price is now the reference every northern-hemisphere fall fill program is being written against.
India's Rashtriya Chemicals and Fertilizers went to the market for 1.7 million tonnes of urea and got most of it from one country. China will supply at least 1.2 million metric tonnes under the award, roughly two-thirds of the tender, with cargoes required to leave loading ports by September 24 (Fertilizer Daily, Sep 7, 2026; Bloomberg, Aug 27, 2026). The lowest offers came in at $390.25 per tonne CFR India's east coast and $393.65 on the west coast, submitted by Ameropa. Five months earlier, in an emergency purchase of 2.5 million tonnes made while the Strait of Hormuz risk premium was still in the price, India paid $935–959 per tonne for the same product.
That is a 58% decline in the delivered cost of the world's benchmark nitrogen unit, executed by the same buyer, on the same instrument, inside one crop year. For a North American grower deciding whether to prepay fall urea in the next three weeks, the number matters less as a price than as a statement about who is now willing to sell.
1. What actually changed was the supply side, not the demand side
What's new: The conventional read on a falling fertilizer price in late summer is seasonal — the spring application window has closed, buyers have stepped back, and the market drifts until fall fill. That is not what this is. The decline that began in midsummer has supply-side momentum behind it, and the mechanism is Chinese export policy.
Evidence: China's 2026 export allowance expanded to roughly 5–5.5 million tonnes. The shipment data shows the switch flipping rather than easing: July exports ran at approximately 403,000 tonnes against just 7,000 tonnes in June (Fertilizer Daily, Sep 7, 2026). A 57-fold month-over-month increase in shipments from the world's largest potential swing exporter is not a demand event. It is a policy event, and it arrived in the same window India needed volume.
The tender price ladder across 2026 traces it cleanly:
| India tender | Approx. price, $/t CFR | Change vs. prior | Context |
|---|---|---|---|
| April (emergency, 2.5 Mt) | 935–959 | — | Peak; supply-security purchase |
| June | 444–449 | −52% | Post-peak normalization |
| September (RCF, 1.7 Mt) | 390.25 (east), 393.65 (west) | −12% | China supplies ≥1.2 Mt |
Source: Fertilizer Daily, Sep 7, 2026; Bloomberg, Aug 27, 2026; Profercy market updates, 2026.
$390.25/t
Lowest offer, CFR India east coast, September 2026 RCF urea tender — 58% below the $935/t India paid in its April emergency purchase. (Fertilizer Daily, Sep 7, 2026)
Why the distinction is not academic: A demand-driven price decline reverses when demand returns. A supply-driven one reverses only when the supply is withdrawn. If the floor under urea is a Chinese export quota rather than a soft northern-hemisphere order book, then the relevant question for a fall fill decision is not "when does demand come back" — it is "does Beijing leave the door open through Q4."
Ground Truth: Treat the September tender as a policy print, not a price print. The last three times urea moved this far this fast, the move ended when the supplying jurisdiction changed its mind, not when buyers changed theirs. A grower prepaying fall urea on the strength of $390 CFR India is, whether he frames it that way or not, taking a position on Chinese export administration through December. That is a legitimate position to take. It is not the same thing as buying a market that has found its own level.
2. The gap between the tender and the retail counter
What's new: US retail urea has followed the global move down, but not by as much and not as fast. DTN's retail survey for the week of August 24–28, 2026 put urea at an average $655 per short ton, 5% below the prior month and still 4% above a year earlier.
Evidence: Converted to a common basis, $390.25 per metric tonne CFR India is about $354 per short ton delivered into an Indian port. The US retail counter is at $655 per short ton delivered to a farm. The two numbers are not directly comparable — one is a bulk vessel cargo landed at a discharge port under a state tender, the other is a bagged-or-bulk retail sale with inland freight, storage, handling, blending and a dealer margin inside it — but the spread between them is where the entire North American fall fill conversation lives.
Here is the retail nitrogen book as it stood entering September:
| Product | $/ton | MoM | YoY | $/lb N | Basis |
|---|---|---|---|---|---|
| Urea | 655 | −5% | +4% | 0.71 | Delivered, retail |
| UAN28 | 428 | −8% | +2% | 0.76 | Delivered, retail |
| UAN32 | 458 | −5%* | −5% | 0.72 | Delivered, retail |
| Anhydrous | 923 | slightly lower | +21% | 0.56 | Delivered, retail |
Source: DTN/Progressive Farmer retail fertilizer survey, week of Aug 24–28, 2026. *UAN32's month-over-month move was reported as "slightly lower"; the −5% shown is the year-over-year figure, marked here to avoid implying a monthly print DTN did not give.
On a cost-per-pound-of-nitrogen basis — the only basis on which these four products are actually substitutes — the ranking has not moved at all despite the global repricing:
| Nitrogen source | $/lb N | |
|---|---|---|
| Anhydrous | 0.56 | ████████ |
| Urea | 0.71 | ██████████ |
| UAN32 | 0.72 | ██████████ |
| UAN28 | 0.76 | ███████████ |
Source: DTN/Progressive Farmer retail fertilizer survey, week of Aug 24–28, 2026.
The asymmetry is the story. Urea is the product that trades in tenders, moves in vessels, and reprices when a Chinese export quota opens. Anhydrous is the product that is made in North America, moves in pipelines and pressurized rail, and is sold into a fall application window that does not care what RCF paid. Urea is down 5% on the month. Anhydrous is up 21% on the year.
Ground Truth: The global urea collapse is not reaching the cheapest nitrogen on the retail sheet, and there is no mechanism by which it should. A grower reading headlines about a 58% decline and expecting his fall anhydrous quote to soften is reading the wrong market. If anything, the more urea falls, the more the anhydrous premium per pound of N stands out as a domestic-supply artifact — and the less pressure there is on domestic ammonia producers to discount into a fall book that is already sold.
3. Who this favors, and who absorbs it
What's new: The winners and losers from a supply-side urea reset are not distributed the way a simple "cheaper inputs are good for farmers" reading suggests.
Evidence and the read, product by product:
Importers and river terminals carry the most direct exposure. Anyone who bought cargo forward at the June level — call it $444–449 CFR equivalent — and is holding it into a market now clearing at $390 is carrying an inventory loss of roughly 12% before freight and financing. Re-export offers circulating in NOLA earlier in the summer are the visible symptom of that inventory looking for a home.
Retailers sit between a falling replacement cost and a retail book that reprices weekly rather than daily. The 5% month-over-month decline in retail urea against a much larger decline in the international print is the normal shape of that lag, and it is where the margin is. This is not a criticism of the channel — the retailer is carrying the storage, the handling and the credit — but a grower should understand that the lag is a real cost he is paying, not a delay he is waiting out.
Growers applying urea this fall get a genuine, if partial, benefit: 5% off the month, 4% still above last year. The pass-through is real and it is slow.
Growers applying anhydrous this fall get nothing from any of this. Their nitrogen is 21% above last year and it is the cheapest pound of N on the sheet anyway. The correct response to the urea news, for that grower, is to ignore it.
Growers buying UAN are in the worst position of the three: UAN28 is the most expensive nitrogen per pound on the retail sheet at $0.76/lb N, and it fell the most on the month (−8%) precisely because it had the most room to fall. A product that is both the priciest per unit of nutrient and the fastest-falling is a product to buy late, not early.
Ground Truth: The prepay decision this fall is not one decision, it is four, and they point in different directions. Urea and UAN are exposed to a tender market that just reset 58% lower and may not be finished. Anhydrous is exposed to a domestic ammonia book that has shown no such move. If a grower is going to prepay anything in the next three weeks, the defensible prepay is the product whose price is set by a North American plant, not the product whose price was set last week by a Chinese export quota and an Indian state tender.
4. What to watch between now and the fall application window
What's new: Three observable things will settle whether $390 is a floor or a waypoint, and all three are public.
Evidence:
-
China's Q4 export posture. The 2026 allowance is roughly 5–5.5 million tonnes and July alone consumed about 403,000 tonnes of it. Watch monthly Chinese customs export data. A visible slowdown in shipments before the allowance is exhausted is the tell that the administrative door is closing again, and it is the single event most likely to put a floor under the global price.
-
India's next tender. RCF's September award requires shipment by September 24. India's buying pattern in 2026 has been episodic and large — 2.5 Mt in April, then June, then 1.7 Mt now. The size and timing of the next tender, and whether Chinese suppliers are still competitive in it, is the direct test of whether $390 was the clearing level or the bottom tick.
-
The NOLA barge–to–retail spread. Retail urea at $655/ton against a falling import replacement cost is the spread that decides how much of the international move actually reaches a farm gate this fall. It is worth tracking as a spread rather than as two separate prices, because the spread is what a grower is actually paying for storage, handling and channel credit.
What is not worth watching: the global spot benchmark in isolation. Urea traded around $448/t on September 9, 2026 on the widely-quoted international benchmark (Trading Economics, Sep 9, 2026), above the tender's lowest offers — a reminder that a tender award price and a spot benchmark are different instruments measuring different things, and that quoting one as though it were the other is how a fall fill decision gets made on a number that does not apply.
Ground Truth: The number to write on the whiteboard is not $390. It is the spread between the international replacement cost and the local retail quote, because that spread is the only part of this story a grower can actually negotiate. The tender price is information. The spread is a decision.
5. The structural point underneath the price
Three years of nitrogen markets have now demonstrated the same thing three different ways: the global urea price is a function of who is permitted to export, not of who wants to buy. The 2022 gas-driven European curtailments, the 2025 Chinese restriction, the April 2026 security premium and now the September 2026 Chinese reopening are all the same mechanism with different signs.
For a North American buyer, the practical consequence is that urea is the nitrogen with political beta and anhydrous is the nitrogen without it. That is not an argument for one over the other — anhydrous carries its own constraints, from application windows to nurse-tank logistics to the soil-temperature rule that governs when it can legally and agronomically go in the ground. It is an argument for knowing which one you are buying and pricing the volatility accordingly.
A grower who wants to be long the possibility of further Chinese export volume should stay short urea inventory and buy late. A grower who cannot tolerate the risk that the door closes in October should buy his urea now and accept that he may look wrong in November. Both are coherent. What is not coherent is prepaying urea in September because the headline said prices fell 58%, when the 58% happened in a market he does not buy in, at a price he cannot access, denominated in a tonne he does not use.
References
- Fertilizer Daily, "China to ship 1.2 million tonnes of urea to India as prices plunge 58% from April's $935 peak," Sep 7, 2026 — https://www.fertilizerdaily.com/20260907-china-urea-india-tender-1-2-million-tonnes-2026/
- Bloomberg, "China to Supply Bulk of India's Fertilizer Tender in Major Sale," Aug 27, 2026 — https://www.bloomberg.com/news/articles/2026-08-27/china-to-supply-bulk-of-india-s-fertilizer-tender-in-major-sale
- DTN/Progressive Farmer, "Fertilizer Prices Fall as UAN28, Urea Lead the Way Lower," Sep 2, 2026 (retail survey week of Aug 24–28, 2026) — https://www.dtnpf.com/agriculture/web/ag/crops/article/2026/09/02/fertilizer-prices-fall-uan28-urea
- Profercy, "Market Update: Urea values correct in wake of Indian Potash Limited tender," 2026 — https://www.profercy.com/insights/market-update-urea-values-correct-in-wake-of-indian-potash-limited-tender
- Global Agriculture, "India Floats Tender for 1.7 Million Tonnes of Urea Amid Global Supply Concerns," 2026 — https://www.global-agriculture.com/india-region/india-launches-tender-for-1-7-million-tons-of-urea-locking-in-july-shipment-schedule/
- Trading Economics, Urea price series, accessed Sep 9, 2026 — https://tradingeconomics.com/commodity/urea
Disclosures
Crop Root Zone is an independent publication. Nothing here is investment advice. Market calls, where included, reflect the editors' own read and are not a recommendation to buy or sell any security.
Nitrogen Fell 20% Since May. Phosphate Rose 0.4%. That Is Not a Lag — It Is Two Different Export Policies.
Retail urea, anhydrous, UAN28 and UAN32 are all down 17% to 22% since late May while DAP, MAP and potash have not moved a full percent. China reopened one export queue and extended the curbs on the other.
A grower pricing a fall program this week is looking at nitrogen that costs about a fifth less than it did at the end of May and phosphate that costs marginally more. Retail urea averaged $655 per short ton in the fourth week of August, down from $823 in the last week of May (DTN/Progressive Farmer, Sep 2 and Jun 10, 2026). Over the same three months DAP went from $914 to $918. That is not a small divergence inside a general trend — it is two products moving in opposite directions by two orders of magnitude of percentage, and the reason is not the one most fall-budget conversations are using.
1. What actually moved, and by how much
What's new: All four nitrogen products in the DTN retail survey fell double digits over three months. All four non-nitrogen products stayed inside one percent.
Evidence: The survey is the same panel of retailers in both weeks, so the comparison is like for like — no basis change, no unit change, no shift between wholesale and retail.
| Product | May 25–29 ($/st) | Aug 4th wk ($/st) | Change ($/st) | Change (%) | Basis |
|---|---|---|---|---|---|
| UAN32 | 585 | 458 | −127 | −21.7% | Delivered, retail |
| Urea | 823 | 655 | −168 | −20.4% | Delivered, retail |
| UAN28 | 530 | 428 | −102 | −19.3% | Delivered, retail |
| Anhydrous | 1,118 | 923 | −195 | −17.4% | Delivered, retail |
| 10-34-0 | 723 | 715 | −8 | −1.1% | Delivered, retail |
| Potash | 494 | 493 | −1 | −0.2% | Delivered, retail |
| DAP | 914 | 918 | +4 | +0.4% | Delivered, retail |
| MAP | 953 | 959 | +6 | +0.6% | Delivered, retail |
Source: DTN/Progressive Farmer retail fertilizer survey, published Jun 10, 2026 (week of May 25–29) and Sep 2, 2026 (fourth week of August). Percentages calculated from the published averages.
Set against each other as a single picture, the split is not subtle:
| Product | 3-month change | |
|---|---|---|
| UAN32 | −21.7% | ██████████ |
| Urea | −20.4% | █████████ |
| UAN28 | −19.3% | █████████ |
| Anhydrous | −17.4% | ████████ |
| 10-34-0 | −1.1% | █ |
| Potash | −0.2% | ░ |
| DAP | +0.4% | ░ |
| MAP | +0.6% | ░ |
Source: calculated from the DTN survey averages above. Bars scaled to the largest decline; the three products that rose or held are shown as ░.
On a nutrient basis the nitrogen move is cleaner still, because it strips out the product's own analysis:
| Nitrogen source | May 25–29 ($/lb N) | Aug 4th wk ($/lb N) | Change |
|---|---|---|---|
| Anhydrous | 0.68 | 0.56 | −$0.12 |
| UAN32 | 0.91 | 0.72 | −$0.19 |
| Urea | 0.90 | 0.71 | −$0.19 |
| UAN28 | 0.95 | 0.76 | −$0.19 |
Source: DTN/Progressive Farmer, per-pound-of-nitrogen figures as published, Jun 10 and Sep 2, 2026.
Ground Truth: The three cheapest nitrogen sources now sit within a cent and a half of each other per pound of N — urea at $0.71, UAN32 at $0.72, UAN28 at $0.76 — with anhydrous alone at a genuine discount of $0.15 to $0.20. When the spread between forms collapses like that, the form decision stops being an economic decision and becomes a logistics one. You are no longer choosing the cheapest nitrogen; you are choosing the nitrogen you can get applied in the days you actually have.
2. The explanation that does not work
What's new: The standard account — retail lags wholesale, so the counter is still catching up — cannot carry this, because it predicts the wrong thing about phosphate.
Evidence: If the mechanism were purely a lag, then a decline in world nitrogen would show up at the counter three to six months later, and a decline in world phosphate would do the same. But phosphate did not decline at world level and then wait. The World Bank's global fertilizer price index rose more than 12% quarter on quarter in the first quarter of 2026, reached its highest level since October 2022 in April, and is projected to finish 2026 up nearly 30% on the year (The Economy, Aug 29, 2026). That is an index rising while four of eight US retail products fall 17% to 22%. A lag argument has to explain not just the timing but the direction, and here the directions are opposite.
There is a real lag inside the nitrogen number, and it is worth sizing honestly. India's Indian Potash Limited tender of April 15, 2026 confirmed roughly 2.8 million tonnes at $935 per tonne CFR west coast and $959 CFR east coast (Profercy, Apr 17, 2026). India's August tender drew lowest offers of $390.25 CFR east coast and $393.65 CFR west, with more than 1.3 million tonnes offered below $400 (Ag Bull Trading, Aug 27, 2026). Converted to short tons, that is a delivered-India price falling from about $848 to about $354 — a 58% collapse in four months. US retail urea fell 20% over a comparable window. So retail did follow, and it followed at roughly a third of the amplitude, which is the ordinary behaviour of a price that carries freight, storage, bagging, working capital and a dealer margin on top of a cargo.
Ground Truth: The $354-versus-$655 gap between the August India tender and the US retail counter is not evidence of gouging and should not be read as a forecast that retail has $300 left to give. India CFR is a bulk vessel price at a discharge port; the DTN number is a delivered, spread-ready price at a Midwest retail site. The useful comparison is not the level but the rate of change — and on that comparison nitrogen retail has moved and phosphate retail has not.
3. The explanation that does work: two Chinese export queues
What's new: China reopened urea exports during the summer of 2026 and simultaneously extended its restrictions on phosphate exports. One nutrient got new supply; the other got its supply constraint renewed.
Evidence: China exported roughly 7,000 tonnes of urea in June 2026 and about 403,000 tonnes in July, bringing January–July exports to approximately 907,000 tonnes (Ag Bull Trading, Aug 27, 2026). Export quotas of close to 2 million tonnes were issued at the end of May with a June-to-August implementation window; combined with earlier batches the 2026 quota has been reported at 3.3 million tonnes, and the full-year allowance at roughly 5 to 5.5 million tonnes. Those two figures come from different accounts of the same policy and this publication cannot reconcile them from public sources, so both are given. Either way, cumulative shipments through July of about 0.9 million tonnes leave a large majority of the year's authorised volume still to move.
On the phosphate side the policy went the other way. China extended restrictions on exports of key phosphate fertilizers at least through August 2026, with quota details communicated directly to domestic suppliers rather than published (Fertilizer Daily, Jul 29, 2026). Chinese phosphate is a large enough share of seaborne DAP and MAP that its absence sets a floor under the rest of the market — which is precisely what the flat US retail DAP and MAP lines are showing.
403,000 tonnes
Chinese urea exports in July 2026, against roughly 7,000 tonnes in June — a 57-fold month-on-month increase, and the mechanical cause of the world nitrogen price collapse now reaching the US retail counter. (Ag Bull Trading, Aug 27, 2026)
What this means for the read: the nitrogen decline is a supply event with a name and a policy document behind it, not a seasonal drift. That matters because supply events reverse when the policy does, and seasonal drifts do not.
4. What it does to a fall program, in dollars per acre
What's new: On a 180-bushel corn target, the three-month move is worth $22 to $34 per acre on nitrogen and about twenty cents per acre against you on phosphate and potash.
Evidence: Take 180 pounds of N per acre — one pound per bushel of yield goal, the workaday planning rate — and price it at the published per-pound-of-N figures:
| Nitrogen program (180 lb N/acre) | May 25–29 | Aug 4th wk | Saving |
|---|---|---|---|
| Anhydrous | $122.40 | $100.80 | $21.60 |
| Urea | $162.00 | $127.80 | $34.20 |
| UAN32 | $163.80 | $129.60 | $34.20 |
| UAN28 | $171.00 | $136.80 | $34.20 |
Source: calculated from DTN per-pound-of-N figures (Jun 10 and Sep 2, 2026) at 180 lb N/acre. Application cost, inhibitor and any prepay discount excluded.
Now the other side. A maintenance program of 60 pounds of P₂O₅ and 60 pounds of K₂O needs about 130 pounds of DAP (18-46-0) and 100 pounds of 0-0-60. At the fourth-week-of-August prices that is $59.86 and $24.65 per acre, or $84.51 combined. At the late-May prices it was $84.30. The three-month move on the P and K side of the same program is twenty-one cents per acre against the grower.
Ground Truth: The whole of the 2026 summer fertilizer decline landed on one nutrient. A fall budget that scales last spring's total NPK number down by a blended percentage will underfund P and K and overfund N — the two errors do not cancel, because the P and K decision is a soil-test decision with a multi-year consequence and the N decision is an annual one. The correct response to this price structure is to take the nitrogen saving as a nitrogen saving and leave the removal-based P and K rate exactly where the soil test put it.
5. What would reverse it, and what to watch
What's new: The nitrogen side has an identifiable reversal trigger and the phosphate side has an identifiable release trigger. Neither is a weather event.
Evidence: Three things are worth watching between now and spring, in descending order of how much they would move a US grower's cost.
The remainder of the Chinese urea quota. Whatever the correct 2026 figure is — 3.3 million tonnes or 5.5 million — roughly 0.9 million tonnes had shipped through July. If the balance moves in the fourth quarter, world nitrogen has further to fall and the US spring book will be cheaper than the fall book. If the quota window closes with volume unshipped, the reverse. China has been assessed as holding 10 to 15 million tonnes of latent annual export capacity (Fertilizer Daily, May 23, 2026), so the constraint here is policy, not plant.
Whether the phosphate curbs lapse or extend past August. The published restriction ran "at least through August 2026." A lapse would put the first new seaborne DAP and MAP supply in over a year into a market whose US retail price has not moved in three months. An extension holds the floor.
Brazilian buying into its own planting season. Brazil imports close to 100% of the roughly 8 million tonnes of urea it consumes annually, and its coverage of 2026/27 needs stood at only about 40–45% in late July (Ag Bull Trading, Jul 23, 2026). A Brazilian catch-up in the fourth quarter competes directly with the US spring import program for the same Atlantic cargoes.
Ground Truth: Every one of those three triggers points at the same practical question, which is whether to price the fall pass or the spring pass. The honest answer from this price structure is that the spread has already collapsed — anhydrous is the only nitrogen source still carrying a real discount, and it is a fall-applied product. If a grower is going to act on a 20% nitrogen decline, the form that captures most of it is the one that has to go in the ground before the soil warms up again, which puts the decision on the applicator calendar rather than on the price screen. Prepaying spring urea at $655 to protect against a Chinese quota that has 70-plus percent of its year left to ship is paying for insurance against the less likely direction.
References
- DTN/Progressive Farmer, "Fertilizer Prices Fall as UAN28, Urea Lead the Way Lower" — Sep 2, 2026 (retail averages, fourth week of August 2026). https://www.dtnpf.com/agriculture/web/ag/crops/article/2026/09/02/fertilizer-prices-fall-uan28-urea
- DTN/Progressive Farmer, "Urea Moves Lower; 6 Fertilizers Continue To Be Slightly Higher" — Jun 10, 2026 (retail averages, week of May 25–29, 2026). https://www.dtnpf.com/agriculture/web/ag/crops/article/2026/06/10/urea-moves-lower-6-fertilizers
- Ag Bull Trading, "China's Urea Return Breaks Fertilizer Squeeze with Massive India Sale" — Aug 27, 2026 (Chinese monthly export volumes, India August tender offers, 2026 allowance). https://www.agbull.com/chinas-urea-return-breaks-fertilizer-squeeze-with-massive-india-sale/
- Profercy, "India eyes $2.64bn urea award as tender lifts global fob values to four year highs" — Apr 17, 2026 (April 15 IPL tender volumes and CFR prices). https://www.profercy.com/insights/india-eyes-major-urea-award-as-tender-lifts-global-fob-values
- Fertilizer Daily, "China extends phosphate export curbs through August 2026 as Russia holds fertilizer quotas" — Jul 29, 2026. https://www.fertilizerdaily.com/20260729-china-phosphate-export-restrictions-august-2026-russia-quotas/
- Fertilizer Daily, "Brazil's structural shift to ammonium sulfate is pulling urea prices down; China's return is the year's biggest wildcard" — May 23, 2026 (Chinese latent export capacity). https://www.fertilizerdaily.com/20260523-brazils-structural-shift-to-ammonium-sulfate-is-pulling-urea-prices-down-chinas-return-is-the-years-biggest-wildcard/
- Ag Bull Trading, "The World's Fertilizer Squeeze Closes In on Brazil and Asia's Rice Bowl" — Jul 23, 2026 (Brazilian 2026/27 coverage). https://www.agbull.com/the-worlds-fertilizer-squeeze-closes-in-on-brazil-and-asias-rice-bowl/
- The Economy, "Global Grain Prices Soar as Black Sea Supply Disruptions, European Weather Extremes and Middle East Risks Create a 'Triple Threat'" — Aug 29, 2026 (World Bank fertilizer price index). https://economy.ac/news/2026/08/202608291386
Disclosures
Crop Root Zone is an independent publication. Nothing here is investment advice. Market calls, where included, reflect the editors' own read and are not a recommendation to buy or sell any security.
Brazil Now Imports as Much Ammonium Sulfate as Urea. It Is Bidding for a Nylon Byproduct, and So Are You.
Brazilian amsul imports reached parity with urea in 2025 at about 6.7 million tonnes each and moved ahead of it in early 2026 — roughly a fifth of world output going to one buyer, out of a stream where half the supply is a co-product of caprolactam and does not respond to fertilizer prices at all.
Brazil imported about 6.7 million tonnes of ammonium sulfate over January to November 2025, and about 6.7 million tonnes of urea over the same eleven months (World Fertilizer, Dec 23, 2025). Those two numbers being equal is new. As recently as five years ago urea ran at roughly twice amsul's volume into Brazil, and in the first four months of 2026 the ranking inverted outright: 1.75 million tonnes of ammonium sulfate against 1.4 million tonnes of urea (Fertilizer Daily, May 23, 2026). The largest importer of nitrogen in the Western Hemisphere has changed which molecule it buys, and the molecule it has moved to is one nobody manufactures on purpose in anything like that quantity.
1. The switch, in tonnes
What's new: Brazilian ammonium sulfate imports nearly tripled between 2018 and 2024 to more than 6 million tonnes a year, while urea grew by about 2 million tonnes a year to roughly 8 million. In 2025 the two lines crossed.
Evidence: The trajectory and the crossing point are both documented.
| Period | Amsul (Mt) | Urea (Mt) | Amsul as % of the pair |
|---|---|---|---|
| ~2018 (reference) | ~2.2 | ~6.0 | ~27% |
| 2024 | >6.0 | ~8.0 | ~43% |
| Jan–Nov 2025 | ~6.7 | ~6.7 | ~50% |
| Jan–Apr 2026 | 1.75 | 1.40 | 56% |
Source: World Fertilizer, Dec 23, 2025 (2018–2024 trajectory and Jan–Nov 2025 volumes); Fertilizer Daily, May 23, 2026 (Jan–Apr 2026 volumes). The ~2018 line is this publication's back-calculation from the stated "nearly tripled to over 6 million tonnes" and "increased by approximately 2 million tpy to around 8 million tpy" and is an approximation, not a reported figure.
The reason growers made the switch is an affordability number, not a preference. Brazil's nitrogen affordability index averaged 0.87 across January to November 2025 against 1.05 over the preceding four years (World Fertilizer, Dec 23, 2025) — nitrogen got harder to buy relative to what the crop paid, and the response was to buy the cheaper nitrogen unit. Amsul was assessed at US$178 per tonne CFR across August to November 2025.
Ground Truth: A switch driven by an affordability index is a switch that reverses when the index does, and this one has not reversed. Brazilian coverage of 2026/27 fertilizer needs stood at only about 40–45% in late July 2026, against roughly 30% in early April and a normal pace near 40% (Ag Bull Trading, Jul 23, 2026). A buyer who is behind on volume and short on affordability does not go back to the expensive nutrient unit to catch up. The amsul share should be read as structural until the affordability index recovers, not as a spot substitution that unwinds after one good harvest.
2. Why the supply cannot answer the bid
What's new: About half of global ammonium sulfate production is a co-product of caprolactam manufacture — the nylon feedstock — and the by-product routes together account for roughly 68% of the market.
Evidence: World ammonium sulfate production was about 35.0 million tonnes a year in 2024, expected near 35.8 million in 2025, with Chinese output at a record 20.1 million tonnes a year in 2024 (CRU/BC Insight, Jan 28, 2026; industry capacity surveys). By-product production — caprolactam, coke-oven gas purification, and flue-gas desulfurisation at coal power plants — holds about 68.4% of the market, with the caprolactam route alone at roughly 50% of production. Some 95% of all ammonium sulfate ends up as fertilizer.
Put those two facts against each other and the economics are unusual for a fertilizer:
| Product | What sets its output | Response to a higher fertilizer price |
|---|---|---|
| Urea | Ammonia plant utilisation, gas cost, export policy | Plants run harder; idled capacity restarts |
| Anhydrous ammonia | Gas cost, plant turnarounds | Same |
| Ammonium sulfate | Nylon 6 demand, steel coke-oven throughput, FGD scrubber duty | Largely none — output tracks the primary product |
Source: production-route shares from industry ammonium sulphate capacity analysis (2024–2026 vintage); route descriptions per International Fertiliser Society, "Future of Ammonium Sulphate, Co- and By-Production."
~19%
Brazil's roughly 6.7 million tonnes of annual amsul imports as a share of the world's ~35 million tonnes of annual production. One country, buying about a fifth of global output of a nutrient whose supply is set by nylon and steel. (Calculated from World Fertilizer, Dec 23, 2025 and 2024 global production of 35.0 Mt/a.)
What this means: the ordinary correction mechanism is missing. When urea gets expensive, urea capacity responds — that is exactly what the Chinese export reopening did to world nitrogen prices over the summer of 2026. When amsul gets expensive, the caprolactam plants do not make more of it, because they are making nylon and the ammonium sulfate is what is left over. Price rationing has to do the entire job, and price rationing in a fertilizer market means somebody's acres go short.
3. The North American grower is in the same queue
What's new: Corn Belt and Western growers buying ammonium sulfate as a sulfur source are bidding into the identical fixed stream, and the public distributor reports show what they are paying for the privilege.
Evidence: Two USDA Agricultural Marketing Service production cost reports, published a week apart from two independent regions, both carry an ammonium sulfate line and a urea line at distributor level:
| Region / report date | Amsul avg ($/ton) | Urea avg ($/ton) | Amsul change | Urea change |
|---|---|---|---|---|
| Pacific Northwest — Fri Sep 4, 2026 | 770.20 | 1,085.60 | −15.80 | −14.20 |
| Inter-Mountain West — Mon Aug 31, 2026 | 684.80 | 891.25 | −2.53 | +8.25 |
Source: USDA AMS Livestock, Poultry and Grain Market News — Pacific Northwest Production Cost Report (bi-weekly), Sep 4, 2026; Inter-Mountain West Production Cost Report (monthly), Aug 31, 2026. Distributor, dollars per ton, F.O.B., current delivery period.
Ammonium sulfate is 21-0-0-24S; urea is 46-0-0. Value the nitrogen in a ton of amsul at whatever the same report says urea nitrogen costs, and whatever is left over is what that region is implicitly paying for the sulfur:
| Region | Urea N ($/lb) | Amsul N valued at urea rate | Amsul price residual | Implied S ($/lb) |
|---|---|---|---|---|
| Pacific Northwest | 1.180 | $495.60 | $274.60 | 0.572 |
| Inter-Mountain West | 0.969 | $406.98 | $277.82 | 0.579 |
Source: calculated from the two USDA AMS reports above. A ton of amsul carries 420 lb N and 480 lb S; a ton of urea carries 920 lb N. Method: N credited at the same report's urea $/lb N, residual divided by 480 lb S.
The two regions disagree about the price of ammonium sulfate by 12%, and about the price of urea nitrogen by 22% — and they agree about the implied price of sulfur to within seven-tenths of a cent per pound.
Ground Truth: That agreement is the finding, and it is not a coincidence of arithmetic. Two distributor markets with different freight, different crops and different urea economics arrive at the same implicit sulfur value, which means the amsul price in both places is being set by a sulfur bid rather than by a nitrogen bid. It follows that a grower comparing amsul against urea on nitrogen cost per pound is running the wrong comparison and will always conclude amsul is expensive — $1.83 per pound of N in the Pacific Northwest against urea's $1.18. The right comparison is against the delivered cost of the grower's next-cheapest sulfur unit. If sulfur from another source lands under about 57 cents a pound, amsul is the expensive way to buy it in these two regions this month. If it does not, amsul is the cheap way, and the nitrogen arrives free of charge.
4. What the switch does to the urea market Brazil left
What's new: Every tonne of nitrogen Brazil takes as amsul instead of urea is a tonne of urea demand that leaves the Atlantic basin — and it takes 2.2 tonnes of amsul to replace one tonne of urea's nitrogen.
Evidence: Amsul carries 21% nitrogen against urea's 46%, so roughly twice the physical volume is required for the same nutrient (World Fertilizer, Dec 23, 2025). Brazil's swap is therefore much smaller in nitrogen terms than it looks in tonnes: 6.7 million tonnes of amsul carries about 1.4 million tonnes of N, while 6.7 million tonnes of urea carries about 3.1 million tonnes. The nitrogen Brazil actually removed from its urea book is real but partial.
It is still enough to matter to a market that had been pricing on Brazilian demand. Urea CFR Brazil ran $726 per tonne in March 2026, fell to $542.50 by May 21, and was back at $850–857 by late July (Fertilizer Daily, May 23, 2026; Ag Bull Trading, Jul 23, 2026). Arrivals through Paranaguá fell nearly 45% in January–April 2026 against the prior year. A market that swings $300 a tonne in five months on a demand book that is quietly migrating to a different molecule is a market whose forward curve is worth very little.
Ground Truth: The exposure Brazil has not solved is safrinha corn, planted January to March 2027 and heavily urea-dependent, and soybeans are the least nitrogen-hungry major crop it grows. So the amsul pivot protects the crop going in the ground this month and does almost nothing for the crop that follows it. For a North American reader the practical consequence is a timing one: Brazilian urea buying deferred out of the second half of 2026 does not disappear, it lands in the fourth quarter and the first, which is precisely the window the US spring import program is booking. The cheap world nitrogen of August 2026 has a Brazilian catch-up sitting underneath it.
5. What to watch
What's new: Three observable series will settle whether the amsul share holds, and none of them is a fertilizer price.
Evidence and the reasoning on each:
Chinese ammonium sulfate output. China produced a record 20.1 million tonnes a year in 2024, well over half of world supply, and the caprolactam share of Chinese production is higher than the global average. Chinese nylon operating rates are therefore a fertilizer supply indicator, which is not how anyone budgets sulfur. Watch it anyway.
Brazilian coverage into planting. Coverage at 40–45% in late July against a normal 40% is not alarming on its own; coverage still in the forties in October would be. That is the number that decides whether the fourth quarter brings a Brazilian bid into the same Atlantic cargoes the US spring book needs.
The implied sulfur value in the USDA distributor reports. The 57-cent figure computed above is reproducible every fortnight from two public reports, and it is the cleanest available read on whether North American sulfur is tightening. If the residual widens while urea holds, sulfur is repricing and amsul will follow it up regardless of what nitrogen does.
Ground Truth: The uncomfortable structural point underneath all of this is that sulfur fertility in North America now depends on decisions made in industries that have no interest in agriculture. Half the world's ammonium sulfate exists because somebody wanted nylon; a further chunk exists because coke ovens and coal plants have to scrub their gas. Sulfur deficiency in the Corn Belt has been rising for thirty years as atmospheric deposition fell — the same emissions controls that cleaned the air removed a free fertilizer application. The replacement supply is a byproduct of industries that are themselves decarbonising. That is a long-run tightening with no price signal capable of fixing it, and it argues for treating sulfur as a soil-test-driven, forward-bought input rather than an in-season adjustment.
References
- World Fertilizer, "Ammonium sulfate predicted to steer Brazil's urea imports in 2026" — Dec 23, 2025 (Brazilian amsul and urea import volumes 2018–2025, nitrogen affordability index, amsul CFR assessment, nutrient-volume ratio). https://www.worldfertilizer.com/nitrogen/23122025/ammonium-sulfate-predicted-to-steer-brazils-urea-imports-in-2026/
- Fertilizer Daily, "Brazil's structural shift to ammonium sulfate is pulling urea prices down; China's return is the year's biggest wildcard" — May 23, 2026 (Jan–Apr 2026 import volumes, urea CFR Brazil levels). https://www.fertilizerdaily.com/20260523-brazils-structural-shift-to-ammonium-sulfate-is-pulling-urea-prices-down-chinas-return-is-the-years-biggest-wildcard/
- Ag Bull Trading, "The World's Fertilizer Squeeze Closes In on Brazil and Asia's Rice Bowl" — Jul 23, 2026 (2026/27 coverage percentages, Paranaguá arrivals, urea CFR Brazil late July, safrinha corn exposure). https://www.agbull.com/the-worlds-fertilizer-squeeze-closes-in-on-brazil-and-asias-rice-bowl/
- USDA AMS Livestock, Poultry and Grain Market News, Pacific Northwest Production Cost Report (bi-weekly) — Fri Sep 4, 2026. https://www.ams.usda.gov/mnreports/ams_3657.pdf
- USDA AMS Livestock, Poultry and Grain Market News, Inter-Mountain West Production Cost Report (monthly) — Mon Aug 31, 2026. https://www.ams.usda.gov/mnreports/ams_3883.pdf
- CRU / BC Insight, "China's ammonium sulphate boom" — Jan 28, 2026 (global and Chinese production volumes). https://www.bcinsight.crugroup.com/2026/01/28/chinas-ammonium-sulphate-boom/
- International Fertiliser Society, "Future of Ammonium Sulphate, Co- and By-Production" (production-route shares and descriptions). https://fertiliser-society.org/store/future-of-ammonium-sulphate-co-and-by-production/
Disclosures
Crop Root Zone is an independent publication. Nothing here is investment advice. Market calls, where included, reflect the editors' own read and are not a recommendation to buy or sell any security.
The Sanctions Came Off Belarusian Potash Nine Months Ago. The Reason None Arrived Is the Price.
US restrictions ended 13 December 2025 with immediate effect. Retail potash is still $493/st and still up 2% year over year — because at NOLA barge levels the United States is the worst-paying destination a returning exporter could pick.
The one nutrient that behaved this year is the one whose supply picture changed most. US sanctions on Belarusian potash — in force since 2021 — were lifted on 13 December 2025 with immediate effect (Argus Media, Dec 15, 2025). That reopened access to an exporter on track to ship more than 12 million tonnes in the year the restrictions came off. Nine months later, retail potash in the United States averages $493/st and is 2% higher than it was a year ago (DTN/Progressive Farmer, Sep 2, 2026, covering the week of Aug 24–28). Nothing about the domestic price says a suspended supplier came back.
The usual explanation is friction — contracts, logistics, banks catching up. That explanation has had nine months to work and has not. The better one is arithmetic, and it is the same arithmetic that will govern what happens the next time a potash supply shock runs the other way.
1. What actually changed in December, and what did not
The sanctions relief was real and it was not narrow. What it did not do was make the United States an attractive place to sell a ton.
At the time of the lifting, US prices were assessed at $305–310/st FOB NOLA, and the same reporting noted that alternative markets — Brazil in particular — were "providing a better netback," which could deter a prompt return (Argus Media, Dec 15, 2025). Sanctions on Belarus remain in force in the EU and the UK, so the reopened tonnage is competing for the non-European destinations that were already absorbing it.
| Fact | Figure | Basis |
|---|---|---|
| US sanctions on Belarusian MOP lifted | 13 Dec 2025 | Immediate effect; in place since 2021 |
| Belarus export run-rate at lifting | >12 mn t/yr | All destinations |
| Pre-sanction US intake, 2017–21 | 635,000 t/yr avg | US imports of Belarusian MOP |
| US MOP imports, 2024/25 fertilizer year | 13.5 mn t | ~85% Canada, ~9% Russia |
| NOLA assessment at lifting | $305–310/st | FOB NOLA barge |
Source: Argus Media, "US-Belarus potash trade may soften MOP pricing outlook," Dec 15, 2025.
Set the two volume numbers beside each other and the scale of the reopening is smaller than the headline suggests. The pre-sanction US relationship was 635,000 t/yr against a 13.5 mn t import book — under 5%. Belarus was never the marginal price-setter in this market. It was a supplementary origin whose removal was absorbed by Canadian expansion and whose return is a negotiating chip rather than a supply event.
635,000 t/yr
The average volume of Belarusian MOP the United States actually took in 2017–21, against a 13.5 million tonne annual import book. Under 5% of supply. (Argus Media, Dec 15, 2025)
2. The netback problem, stated plainly
A returning exporter rebuilding share does not sell into the cheapest destination first. It sells where the netback is highest and lets the low-priced markets wait — which is the opposite of how sanctions relief is usually described in the trade press, where the reopened market is assumed to be the one that gets served.
The mechanism is worth spelling out because it inverts the intuition. US potash is cheap relative to the rest of the world's fertilizer complex, and it is cheap relative to its own nitrogen and phosphate. Both of those facts repel supply rather than attract it.
Compare the three macronutrients on the same retail basis, on the same day:
| Product | $/st retail | YoY | Bar |
|---|---|---|---|
| MAP | 959 | +5% | ██████████ |
| Anhydrous | 923 | +21% | ██████████ |
| DAP | 918 | +7% | █████████ |
| 10-34-0 | 715 | +7% | ███████ |
| Urea | 655 | +4% | ███████ |
| Potash | 493 | +2% | █████ |
| UAN32 | 458 | −5% | █████ |
| UAN28 | 428 | +2% | ████ |
Source: DTN/Progressive Farmer retail fertilizer trends, published Sep 2, 2026, covering the week of Aug 24–28, 2026. Delivered retail basis.
Potash sits in the bottom third of that table and has moved 2% in a year while anhydrous moved 21%. For a grower that is the best news on the fertilizer bill. For an exporter deciding where to place a cargo, it is the reason to place it somewhere else.
Ground Truth: Potash's calm is being read as a supply-security achievement. It is closer to the opposite. The US is stable because it is the market a marginal supplier can afford to skip — which is exactly the condition under which returning tons do not show up, and exactly the condition that reverses fastest if Canadian supply is ever genuinely short. A cheap market with 85% of its imports from one origin has not diversified; it has simply not yet been tested.
3. What the 85% concentration is actually measuring
The import book is the number to hold onto: roughly 85% of US MOP came from Canada in the 2024/25 fertilizer year, with about 9% from Russia. That is not a criticism of Canadian supply, which has been reliable and which expanded after 2022. It is a statement about how little the December decision changed the structure.
Three things follow.
The relief has not been tested by a price event. Belarusian tons stayed away while the US was the low-netback destination. Whether they arrive when it is not is unknown, and the December reporting was explicit that some buyers might self-sanction regardless of the legal position. A supply option that has never been exercised is a hypothesis, not a hedge.
The negotiating value is real even at zero volume. The clearest near-term effect of the lifting is that a buyer sitting across from an existing supplier now has a second name to say. That is worth something in a contract negotiation and it is worth nothing in a shortage — those are different goods and they are routinely conflated.
The direction of any price effect is down, not up. Additional volume entering a market that already has adequate inventory pressures prices lower. There is no version of this in which reopened Belarusian supply raises the number a grower pays. The question is only whether it lowers it, and by how much, and in which year.
4. What a buyer does with this before fall application
Potash decisions this autumn are being made against a price that has not moved much and a supply story that has not resolved. Three practical reads.
Do not price a Belarus discount into a fall prepay. Nine months of no arrivals is evidence. The netback logic that kept the tons away has not changed — if anything, a US retail market that has moved 2% in a year is a less attractive destination now than it was in December.
Watch NOLA barge rather than the retail board. Retail potash is a lagging, delivered number that folds in freight and margin. Public barge ranges through mid-2026 have been quoted around $295–355/st, with wider ranges quoted by some aggregators; treat those as an indication of level rather than an assessment, and treat a sustained move at the barge as the leading signal that something changed at origin.
Read potash's YoY against the rest of the bill, not against itself. At +2% while anhydrous is +21%, the relative-price case for a full K program has strengthened for reasons that have nothing to do with agronomy. That is a real and durable input into a fall P&K decision, and it is independent of whether any Belarusian ton ever crosses a US dock.
Ground Truth: The single most useful number in this story is not a price — it is the 5% share Belarus held before 2021. The lifting was reported as a supply event and it was really a basis risk event: the US now has an option it will only exercise when its own prices rise enough to be worth serving. That is a floor-raiser, not a ceiling-cutter, and it means the practical effect of the December decision will first become visible in a tight year, not a loose one.
5. The relative-price case for a full K program this fall
There is a second-order effect of all this that reaches the fall P&K decision directly, and it has nothing to do with Belarus.
Potash is the only one of the three macronutrients whose price has stayed close to its own historical norm. Market commentary through 2026 has consistently placed Corn Belt MOP near its five-year average while nitrogen and phosphate have run well above theirs, and the retail table bears that out at the year-over-year level: potash +2%, anhydrous +21%, DAP +7%, MAP +5%.
That divergence changes which nutrient a constrained fertilizer budget should cut, and it changes it in the opposite direction from habit. Potassium is the nutrient growers most often defer in a tight year, on the reasoning that soil test levels will carry a crop and the deficiency is slow to show. That reasoning is agronomically defensible and it is being applied at the moment potassium is the cheapest it has been relative to the rest of the bill in several seasons.
| Nutrient | YoY move | Position vs own history | Deferral logic |
|---|---|---|---|
| Potash | +2% | near five-year average | Cheapest to buy, most often deferred |
| Nitrogen (anhydrous) | +21% | elevated | Cannot be deferred — the crop needs it this year |
| Phosphate (DAP/MAP) | +7% / +5% | elevated | Partially deferrable, expensive |
Year-over-year moves: DTN/Progressive Farmer, Sep 2, 2026 (week of Aug 24–28). Position against historical norms reflects published market commentary rather than a calculated index, and is characterised rather than quantified here for that reason.
There is a real risk in the deferral habit that the Belarus story makes concrete. A market that is cheap because it is unattractive to suppliers is a market with a thin queue of alternative origins. Deferring potassium in a year when it is cheap builds a soil-test deficit that has to be repaid in some later year — and the later year is, by construction, more likely to be the one in which the 85% concentration matters. Buying K when it is the cheapest line on the invoice is not just a price call; it is the only part of this market a grower can actually pre-position against.
References
[1] Argus Media, "US-Belarus potash trade may soften MOP pricing outlook" — Dec 15, 2025. https://www.argusmedia.com/en/news-and-insights/latest-market-news/2765900-us-belarus-potash-trade-may-soften-mop-pricing-outlook
[2] DTN/Progressive Farmer, "Fertilizer Prices Fall as UAN28, Urea Lead the Way Lower" — Sep 2, 2026 (retail averages for the week of Aug 24–28, 2026). https://www.dtnpf.com/agriculture/web/ag/crops/article/2026/09/02/fertilizer-prices-fall-uan28-urea
[3] StoneX, Farmer Fertilizer Newsletter — potash market commentary on Corn Belt MOP levels and Canpotex order books. https://www.stonex.com/en/insights/july-25-farmer-fertilizer-newsletter---potash/
[4] Public aggregator quotations of NOLA MOP barge ranges through mid-2026, used here as an indication of level only and labelled as such. https://grainbrief.com/prices/potash-price-per-ton
Disclosures
Crop Root Zone is an independent publication. Nothing here is investment advice. Market calls, where included, reflect the editors' own read and are not a recommendation to buy or sell any security.
USDA Took 236 Million Bushels Out of Corn Supply. 150 Million of Them Came Out of Feed Demand, Not the Carryout.
The September balance sheet cut production 213 million bushels and trimmed beginning stocks 23 million, then lowered feed and residual use by 150 million — so ending stocks fell only 86 million while the season-average price forecast rose 30 cents. The line doing the work is the one USDA cannot directly measure.
USDA's September Crop Production report cut the 2026 U.S. corn crop by 213 million bushels, to 15.800 billion, on a 2.2-bushel yield reduction to 178.5 bushels per acre (USDA NASS, Sep 11, 2026). The same morning's World Agricultural Supply and Demand Estimates also lowered 2026/27 beginning stocks by 23 million bushels and then cut feed and residual use by 150 million. Ending stocks fell only 86 million, to 1.567 billion, and the season-average farm price forecast rose 30 cents to $4.80 (USDA WASDE-675, Sep 11, 2026).
That sequence — a large supply cut, most of it offset by a demand cut in the least observable line on the balance sheet — is the story of this report. The headline says corn got smaller. The balance sheet says corn got smaller and USDA expects the country to feed and lose less of it, which leaves the carryout almost where it was.
1. What changed, line by line
What's new: Every change between the August and September corn balance sheets sits in four lines: beginning stocks, production, feed and residual, and ending stocks. Food, seed and industrial use (including ethanol) and exports were left unchanged.
Evidence:
| Corn, 2026/27 (million bu) | August | September | Change |
|---|---|---|---|
| Beginning stocks | 1,945 | 1,922 | −23 |
| Production | 16,013 | 15,800 | −213 |
| Total supply | 17,983 | 17,747 | −236 |
| Feed and residual | 6,100 | 5,950 | −150 |
| Food, seed and industrial | 6,955 | 6,955 | 0 |
| — of which ethanol and by-products | 5,600 | 5,600 | 0 |
| Exports | 3,275 | 3,275 | 0 |
| Total use | 16,330 | 16,180 | −150 |
| Ending stocks | 1,653 | 1,567 | −86 |
| Season-average farm price ($/bu) | 4.50 | 4.80 | +0.30 |
Source: USDA World Agricultural Supply and Demand Estimates, WASDE-675, Sep 11, 2026.
USDA's narrative attributes the beginning-stocks cut primarily to a larger 2025/26 export forecast, and the production cut to the yield reduction plus "a fractional decrease in harvested area to 88.5 million" acres. Exports were held at 3.3 billion bushels "despite lower production, reflecting expectations of steady demand" (WASDE-675, Sep 11, 2026).
64%
Share of the 236-million-bushel supply reduction absorbed by the cut to feed and residual use (150 ÷ 236). (Crop Root Zone calculation from WASDE-675, Sep 11, 2026)
Ground Truth: Read the report as two decisions, not one. NASS measured a smaller crop; the WASDE board then decided how much of that smaller crop the country would not use. The first decision is survey-based and will be revised with more survey data. The second is a forecast of a line that is only ever known as a remainder, and it is the one that kept the carryout from falling by 236 million bushels instead of 86.
2. Why feed and residual moves with the crop
What's new: Feed and residual is not a directly surveyed quantity. It is what remains after the measured uses — ethanol, other industrial and food use, seed, exports — and the change in stocks are accounted for, which means it absorbs both actual livestock feeding and whatever measurement error is left in the other lines.
Evidence: Across the three marketing years on USDA's current table, feed and residual has moved in the same direction as production, and in close proportion to it.
| Marketing year | Production (mil bu) | Feed and residual (mil bu) | F&R as share of production |
|---|---|---|---|
| 2024/25 | 14,892 | 5,438 | 36.5% |
| 2025/26 (est.) | 17,021 | 6,350 | 37.3% |
| 2026/27 (Aug proj.) | 16,013 | 6,100 | 38.1% |
| 2026/27 (Sep proj.) | 15,800 | 5,950 | 37.7% |
Source: USDA WASDE-675, Sep 11, 2026. Share column is a Crop Root Zone calculation.
The mechanism is partly physical and partly accounting. A larger crop means more grain handled, more shrink and more on-farm feeding of lower-quality or unmarketed bushels; it also means more room for the residual to carry the difference between a production estimate and the stocks later counted. Both push feed and residual up in a big year and down in a smaller one. USDA's 150-million cut is consistent with that history: it took the share of production going to feed and residual down only four-tenths of a point.
Ground Truth: The September cut is not a claim that livestock feeders suddenly need 150 million fewer bushels. It is USDA holding the feed-and-residual share of the crop roughly constant as the crop shrinks. That is a reasonable default — and it means the carryout will fall faster than this report shows if later quarterly Grain Stocks counts imply feeding and loss running above that share, or slower if the crop shrinks further and USDA shrinks the residual with it. The line to watch in the next two quarterly stocks reports is implied feed and residual, not production.
3. Where the bushels went missing
What's new: The 2.2-bushel national yield cut was not spread evenly. NASS raised Iowa and cut nearly every other large producing state, with the largest reductions in the western and northern Corn Belt.
Evidence:
| State | 2025 yield | Aug 1 forecast | Sep 1 forecast | Change since Aug | |
|---|---|---|---|---|---|
| North Dakota | 158 | 142 | 130 | −12 | ██████████ |
| Nebraska | 194 | 183 | 177 | −6 | █████ |
| Indiana | 204 | 206 | 200 | −6 | █████ |
| South Dakota | 171 | 151 | 145 | −6 | █████ |
| Kansas | 145 | 126 | 121 | −5 | ████ |
| Wisconsin | 188 | 184 | 180 | −4 | ███ |
| Illinois | 214 | 212 | 209 | −3 | ███ |
| Minnesota | 201 | 197 | 195 | −2 | ██ |
| Ohio | 185 | 195 | 194 | −1 | █ |
| Missouri | 185 | 180 | 181 | +1 | |
| Iowa | 210 | 216 | 219 | +3 | |
| United States | 186.5 | 180.7 | 178.5 | −2.2 |
Source: USDA NASS, Crop Production, Sep 11, 2026 (bushels per acre). Bars scale the size of the cut; states with increases carry no bar.
Iowa's forecast production is 2.803 billion bushels, above its 2025 total of 2.772 billion on 400,000 fewer harvested acres. Nebraska's forecast of 1.701 billion bushels is 326 million below 2025, and Kansas's 793 million is 150 million below (USDA NASS, Sep 11, 2026).
Ground Truth: A national yield cut that raises the largest state and cuts its neighbours is a basis story before it is a futures story. Interior Iowa elevators will be sitting on a crop larger than last year's while Nebraska, Kansas and the Dakotas are short by a combined several hundred million bushels. Expect western feeders and ethanol plants to reach east for bushels this fall, and expect the resulting basis spread between Iowa and the Plains to do more to a grower's realized price than the 30 cents USDA added to the national average.
4. What the 30 cents is worth against the fertilizer bill
What's new: The higher price forecast changes how much nitrogen a bushel of corn buys, at a moment when retail anhydrous is still the cheapest nitrogen source per pound and still 21% above a year ago.
Evidence: DTN's retail survey for the fourth week of August put anhydrous ammonia at $923 per ton, or $0.56 per pound of nitrogen; urea at $0.71; UAN32 at $0.72; and UAN28 at $0.76 (DTN/Progressive Farmer, Sep 2, 2026).
| Corn price basis | $/bu | lb of anhydrous N one bushel buys | N:corn price ratio |
|---|---|---|---|
| 2025/26 season-average estimate | 4.15 | 7.4 | 0.135 |
| August 2026/27 forecast | 4.50 | 8.0 | 0.124 |
| September 2026/27 forecast | 4.80 | 8.6 | 0.117 |
Sources: USDA WASDE-675, Sep 11, 2026 (corn prices); DTN/Progressive Farmer, Sep 2, 2026 (anhydrous at $0.56/lb N, week of Aug 24–28). Bushel and ratio columns are Crop Root Zone calculations and hold the fertilizer price constant.
A lower nitrogen-to-corn price ratio moves economically optimal nitrogen rates up slightly, all else equal. The move here is modest: from 0.124 to 0.117 is a 6% improvement in the ratio, driven entirely by a price forecast, not by any change in the fertilizer market.
Ground Truth: Do not re-plan a fall nitrogen rate on a season-average price forecast. The $4.80 is a marketing-year average that will be realized only on bushels sold across the year, and the local basis described in section 3 will move the price a western grower actually receives by more than 30 cents in either direction. The more durable read is that the ratio has improved on both sides since August, with nitrogen lower and the corn forecast higher, which argues for holding rates at agronomic recommendations rather than trimming them — not for adding pounds.
5. What would change the read
What's new: The October report will fold in more objective yield measurements, and USDA's quarterly Grain Stocks report at the end of September will set the actual 2025/26 carryout that becomes 2026/27 beginning stocks.
Evidence: September's 23-million-bushel beginning-stocks revision came from an export estimate, not a stocks count. The next WASDE is scheduled for October 9, followed by November 10 and December 10 (USDA WASDE-675, Sep 11, 2026).
| Report | Date | Line it tests |
|---|---|---|
| Grain Stocks (quarterly) | End of September 2026 | 2025/26 ending stocks → 2026/27 beginning stocks |
| WASDE / Crop Production | Oct 9, 2026 | Yield, harvested area, feed and residual |
| WASDE / Crop Production | Nov 10, 2026 | Yield; export pace |
| Grain Stocks (quarterly) | Early 2027 | First implied 2026/27 feed and residual |
Sources: USDA WASDE-675, Sep 11, 2026 (WASDE dates). Grain Stocks timing is USDA's usual quarterly cadence; check NASS's calendar for exact release dates.
Ground Truth: Two numbers, not one, will decide whether this carryout holds. If the end-of-September stocks count comes in below 1.922 billion, the beginning-stocks line falls and the carryout falls with it one-for-one. If later yield cuts arrive, USDA's September pattern implies roughly 60–65% of each lost bushel will be written off feed and residual rather than carryout. A grower pricing old-crop bushels before October should watch the first; one pricing new-crop should watch whether USDA keeps applying the second.
References
- USDA National Agricultural Statistics Service, Crop Production, released Sep 11, 2026 (conditions as of Sep 1, 2026) — https://esmis.nal.usda.gov/sites/default/release-files/796056/crop0926.pdf
- USDA World Agricultural Outlook Board, World Agricultural Supply and Demand Estimates, WASDE-675, Sep 11, 2026 — https://www.usda.gov/oce/commodity/wasde/wasde0926.pdf
- DTN/Progressive Farmer, "Fertilizer Prices Fall as UAN28, Urea Lead the Way Lower," Sep 2, 2026 (retail survey week of Aug 24–28, 2026) — https://www.dtnpf.com/agriculture/web/ag/crops/article/2026/09/02/fertilizer-prices-fall-uan28-urea
Disclosures
Crop Root Zone is an independent publication. Nothing here is investment advice. Market calls, where included, reflect the editors' own read and are not a recommendation to buy or sell any security.
USDA Raised the Soybean Price 60 Cents on a Crop That Got Bigger. Soybean Meal Did Almost All of the Arithmetic.
September's soybean balance sheet added 16 million bushels of production and 25 million of exports, cut ending stocks 10 million to 310 million, and lifted the season-average price to $12.00. Held against USDA's own crush yields, a $30 meal price increase adds about 71 cents a bushel of product value — more than the whole bean price revision.
USDA raised its 2026/27 season-average soybean price forecast by 60 cents, to $12.00 a bushel, in a report that also raised production (USDA WASDE-675, Sep 11, 2026). Ending stocks fell 10 million bushels to 310 million — a 3% change in the carryout paired with a 5% change in the price. On the stocks line alone, that is a large reaction to a small number.
The number that explains it sits one table down. USDA left crush unchanged and soybean oil unchanged at 70 cents per pound, and raised the soybean meal price forecast $30 to $340 per short ton. Run through the product yields implied by USDA's own balance sheets, that meal change is worth more per bushel of soybeans crushed than the entire bean price increase.
1. The balance sheet moved less than the price
What's new: Production rose on a 0.1-bushel yield increase to 52.8 bu/acre and 0.1 million more harvested acres; exports rose 25 million bushels; crush, seed and imports did not change.
Evidence:
| Soybeans, 2026/27 (million bu) | August | September | Change |
|---|---|---|---|
| Beginning stocks | 325 | 325 | 0 |
| Production | 4,519 | 4,535 | +16 |
| Total supply | 4,869 | 4,885 | +16 |
| Crushings | 2,780 | 2,780 | 0 |
| Exports | 1,660 | 1,685 | +25 |
| Seed and residual | 110 | 111 | +1 |
| Total use | 4,549 | 4,575 | +26 |
| Ending stocks | 320 | 310 | −10 |
| Stocks-to-use | 7.0% | 6.8% | −0.3 pt |
| Season-average farm price ($/bu) | 11.40 | 12.00 | +0.60 |
Source: USDA WASDE-675, Sep 11, 2026. Stocks-to-use is a Crop Root Zone calculation.
+5.3% price on −3.1% stocks
September's soybean revision: season-average price up 60 cents while ending stocks fell 10 million bushels. (Crop Root Zone calculation from WASDE-675, Sep 11, 2026)
Ground Truth: A 10-million-bushel carryout cut does not justify 60 cents by itself, and USDA did not claim it does. The price forecast is a season-average number built from futures, basis and product values, and the product side moved. A grower reading this report as "tighter beans, higher price" will overestimate how much a further small stocks cut is worth next month. The live variable is meal.
2. What $30 on meal is worth per bushel
What's new: USDA raised the soybean meal price to $340 per short ton from $310 and held soybean oil at 70 cents per pound, with no change to crush volume.
Evidence: USDA's 2026/27 tables project 32,945 million pounds of soybean oil and 65,800 thousand short tons of meal from a 2,780-million-bushel crush. That implies about 11.85 pounds of oil and 47.3 pounds of meal per bushel crushed.
| Product value per bushel at USDA prices | August | September | Change |
|---|---|---|---|
| Oil: 11.85 lb × price | $8.30 (70¢/lb) | $8.30 (70¢/lb) | $0.00 |
| Meal: 47.3 lb × price | $7.34 ($310/st) | $8.05 ($340/st) | +$0.71 |
| Combined product value | $15.64 | $16.35 | +$0.71 |
| Season-average bean price | $11.40 | $12.00 | +$0.60 |
| Product value less bean price | $4.24 | $4.35 | +$0.11 |
Source: USDA WASDE-675, Sep 11, 2026 (quantities and prices). Per-bushel yields and values are Crop Root Zone calculations. Oil and meal prices are Decatur averages and the bean price is a farm-level season average, so the last line is a consistency check, not a processor margin.
Ground Truth: USDA raised the bean price by slightly less than the meal revision alone adds to product value, which keeps its implied crush spread essentially where it was in August. That is the internal logic of the revision: beans are priced off what the crush earns, and the crush earns more because of meal. The practical consequence is that the $12.00 depends on a meal price forecast in a year USDA also projects meal output of 65.8 million short tons, the largest on its current three-year table. If meal gives back the $30, the bean forecast has no stocks cushion to fall back on.
3. Crush is now the larger customer by a widening margin
What's new: The 2.780-billion-bushel crush projection is unchanged from August but sits well above the two prior years, while exports — raised this month — remain below their 2024/25 level.
Evidence:
| Marketing year | Crush (mil bu) | Exports (mil bu) | Crush share of total use | Soybean oil to biofuel (mil lb) |
|---|---|---|---|---|
| 2024/25 | 2,445 | 1,892 | 55% | 11,758 |
| 2025/26 (est.) | 2,655 | 1,520 | 62% | 14,800 |
| 2026/27 (Sep proj.) | 2,780 | 1,685 | 61% | 17,800 |
Source: USDA WASDE-675, Sep 11, 2026 (biofuel use as reported by the U.S. Energy Information Administration and carried in WASDE). Share column is a Crop Root Zone calculation.
| Use | 2026/27, mil bu | |
|---|---|---|
| Crush | 2,780 | ██████████ |
| Exports | 1,685 | ██████ |
| Seed and residual | 111 | ░ |
Source: USDA WASDE-675, Sep 11, 2026.
Soybean oil used for biofuel is projected at 17.8 billion pounds, up 3.0 billion from 2025/26 and 6.0 billion from 2024/25 — while oil exports fall to 400 million pounds from 975 million (USDA WASDE-675, Sep 11, 2026).
Ground Truth: The crush is being built to make oil and the oil is spoken for, which leaves meal as the by-product that has to find a home. That is exactly why meal is the price USDA had to move: a larger crush produces more meal whether or not meal demand grows. The 25-million-bushel export raise matters, but the bigger structural fact is that six of every ten bushels now go through a domestic plant whose output price is set by two very different markets. A soybean price forecast in this environment is a forecast of meal clearing, not just of Chinese buying.
4. Where the crop got bigger and where it got smaller
What's new: The national yield rose 0.1 bushel, but the state changes ran from +3 in Nebraska to −4 in North Dakota.
Evidence:
| State | 2025 yield | Aug 1 forecast | Sep 1 forecast | Change since Aug |
|---|---|---|---|---|
| Nebraska | 65.5 | 57.0 | 60.0 | +3 |
| Iowa | 63.5 | 62.0 | 64.0 | +2 |
| Indiana | 59.5 | 62.0 | 63.0 | +1 |
| Ohio | 53.0 | 58.0 | 59.0 | +1 |
| Minnesota | 52.5 | 48.0 | 49.0 | +1 |
| South Dakota | 47.0 | 41.0 | 42.0 | +1 |
| Missouri | 50.0 | 50.0 | 50.0 | 0 |
| Arkansas | 55.0 | 57.0 | 57.0 | 0 |
| Illinois | 62.5 | 67.0 | 66.0 | −1 |
| Kansas | 48.5 | 38.0 | 35.0 | −3 |
| North Dakota | 34.5 | 34.0 | 30.0 | −4 |
| United States | 53.0 | 52.7 | 52.8 | +0.1 |
Source: USDA NASS, Crop Production, Sep 11, 2026 (bushels per acre).
National production is forecast 6% above 2025 because harvested area rose to 85.9 million acres from 80.4 million, not because yields improved: the U.S. yield is 0.2 bushel below 2025 (USDA NASS, Sep 11, 2026).
Ground Truth: This is an acreage crop, not a yield crop. The 273-million-bushel increase over 2025 comes from 5.5 million more harvested acres at a slightly lower yield. Kansas, which added 640,000 harvested acres, and North Dakota, which added 300,000, took the two largest September yield cuts. Growers on that expanded western and northern ground are carrying the downside of a national crop whose headline size was set in the spring planting decision.
5. What to watch before October
What's new: With crush and oil unchanged, the next revisions most likely to move the soybean price forecast are the export line and the meal price.
Evidence: The export forecast of 1.685 billion bushels is 165 million above 2025/26 and 207 million below 2024/25. The next WASDE is scheduled for October 9 (USDA WASDE-675, Sep 11, 2026).
| Line | September value | Change vs August | What would move it |
|---|---|---|---|
| Exports (mil bu) | 1,685 | +25 | Early-season sales pace against an 11% year-on-year increase |
| Meal price ($/st) | 340 | +30 | Whether record meal output clears domestically and abroad |
| Oil price (¢/lb) | 70 | 0 | Biofuel demand already at 17.8 billion lb |
| Yield (bu/acre) | 52.8 | +0.1 | Objective yield data in October |
Source: USDA WASDE-675, Sep 11, 2026; year-on-year comparison is a Crop Root Zone calculation.
Ground Truth: For a grower deciding how much of this crop to price at harvest, the September report argues for watching meal and export sales, not the yield line. A 0.1-bushel yield revision on 85.9 million acres is 8.6 million bushels; a $30 meal move is worth about 71 cents on every bushel that goes to a crusher. The price forecast is far more sensitive to the second, and it can reverse without a single change to the crop.
References
- USDA World Agricultural Outlook Board, World Agricultural Supply and Demand Estimates, WASDE-675, Sep 11, 2026 — https://www.usda.gov/oce/commodity/wasde/wasde0926.pdf
- USDA National Agricultural Statistics Service, Crop Production, released Sep 11, 2026 (conditions as of Sep 1, 2026) — https://esmis.nal.usda.gov/sites/default/release-files/796056/crop0926.pdf
Disclosures
Crop Root Zone is an independent publication. Nothing here is investment advice. Market calls, where included, reflect the editors' own read and are not a recommendation to buy or sell any security.
Two-Thirds of Illinois Farm Managers Expect 2027 Rent to Be Exactly What 2026 Was. Nine Percent Expect It Higher.
Rent is the first 2027 cost a grower locks and the only one he negotiates before knowing a single 2027 price — and on Illinois excellent ground it has moved $10 an acre in two years while the nitrogen bill moved several times that.
Sixty-seven percent of Illinois professional farm managers expect 2027 cash rental rates to be unchanged from 2026. Twenty-four percent expect softening. Nine percent expect further increases (Tsay and Schnitkey, farmdoc daily, Apr 13, 2026). That distribution is the single most useful number a grower can carry into an October lease conversation, and it is not the one most growers are carrying.
Rent is the first 2027 cost that gets locked. It is negotiated in the fall, before the December 2027 board has any depth, before a single 2027 fertilizer prepay is priced, before crop insurance projected prices are set in February, and before anyone knows what the 2027 acreage mix will be. Every other major input decision gets to react to information. Rent gets decided first and then everything else has to fit inside it.
1. The rate has barely moved, and that is the finding
What's new: Illinois mid-one-third cash rents by soil productivity, as compiled from the professional farm-management survey, have been close to flat for three years running on every land class.
Evidence:
| Land quality | 2024 | 2025 | 2026 | 2-yr change |
|---|---|---|---|---|
| Excellent | 365 | 370 | 375 | +$10 (+2.7%) |
| Good | 290 | 300 | 325 | +$35 (+12.1%) |
| Average | 247 | 260 | 273 | +$26 (+10.5%) |
| Fair | 210 | 205 | 200 | −$10 (−4.8%) |
Source: Tsay and Schnitkey, "Illinois Cash Rents and Leasing Expectations Through 2027," farmdoc daily, Apr 13, 2026. Figures are mid-one-third leases on professionally managed ground, $/acre.
The 2026 excellent-quality distribution is wider than the midpoint suggests: the upper third of leases reaches $400 per acre and the lower third averages $320, around a $375 midpoint. Good quality sits at $325, average at $273, fair at $200, and pastureland at $43.
Iowa tells a compatible story with a different shape. The statewide average for 2026 came in at $270 per crop acre, down $1 from 2025 and $9 below the $279 peak marked in both 2023 and 2024 (Iowa State University Extension, Cash Rental Rates for Iowa annual survey, 2026). At the county level the movement was almost exactly balanced: 47 counties posted increases, 49 posted declines, and 3 were unchanged.
47 up, 49 down
County-level direction of Iowa's 2026 cash rent survey. The statewide average moved $1. Half the state moved the other way. (Iowa State University Extension, Cash Rental Rates for Iowa, 2026)
Ground Truth: A statewide average that moves $1 while 96 of 99 counties move is not a stable market — it is a market with no direction, which is a different and more negotiable condition. "Rents are flat" is what the aggregate says. "Rents went whichever way the individual conversation went" is what the county data says, and the second statement is the one that should shape how a grower prepares for the conversation.
2. Flat rent is not flat cost, and the comparison is the argument
What's new: The three-year stability in rent has coincided with input movements several times larger in percentage terms, in both directions — which means the share of a grower's cost structure that is rent has been moving even though rent has not.
Evidence: Take excellent Illinois ground at the $375 midpoint and put it beside the nitrogen bill. At the retail anhydrous price entering September — $923 per ton, $0.56 per pound of nitrogen (DTN/Progressive Farmer retail survey, week of Aug 24–28, 2026) — a 180 lb N per acre corn program costs about $101 per acre in nitrogen alone. That is roughly 27% of the rent number.
The direction of travel over the past year is what matters here. Anhydrous is 21% above where it was a year ago. Urea is 4% above. UAN28 is 2% above. Rent on excellent Illinois ground is 1.4% above. A grower whose rent is flat and whose nitrogen is up 21% has not held his cost structure steady; he has held one line of it steady while another moved.
| Cost line, YoY | Change |
|---|---|
| Anhydrous ammonia, retail | +21% |
| Urea, retail | +4% |
| UAN28, retail | +2% |
| Illinois excellent cash rent | +1.4% |
Sources: DTN/Progressive Farmer retail fertilizer survey, week of Aug 24–28, 2026; farmdoc daily, Apr 13, 2026.
This cuts both ways and the honest version says so. A landowner looking at the same table sees a tenant whose largest fixed cost has been held essentially unchanged for three years through a period of real inflation, and concludes the rent is overdue for an increase. A tenant sees a cost structure where the line he cannot control went up 21% and the line he can negotiate is the only place to recover it. Both readings are defensible from the same numbers, which is precisely why the 67/24/9 expectation split is the more useful input than any argument about fairness.
Ground Truth: Do not walk into a rent negotiation with an input-inflation argument unless the specific inputs on the specific farm actually inflated. On an anhydrous-based corn program in 2026 they did — 21% is a real number and it is documented. On a urea or UAN program they largely did not; those are up 2–4% and falling month over month. The argument that works on one farm is the argument that gets rebutted with public data on the next one.
3. What 67 / 24 / 9 means when you are the one at the table
What's new: The expectation distribution is not a forecast. It is a description of the counterparty's opening position, and it is published.
Evidence: Of Illinois professional farm managers surveyed, 67% expect 2027 rates unchanged, 24% expect a softening, 9% expect escalation.
| 2027 expectation | Share of farm managers | |
|---|---|---|
| Unchanged from 2026 | 67% | ██████████ |
| Softening | 24% | ████ |
| Further increase | 9% | █ |
Source: Tsay and Schnitkey, farmdoc daily, Apr 13, 2026.
Three practical readings follow, and they are different for different parties:
For a tenant on professionally managed ground: the base case your counterparty is working from is "same as last year." An ask for a reduction is not outside the range of what the profession expects — a quarter of managers already anticipate softening — but it is a minority position and it will need farm-specific evidence rather than market commentary.
For a tenant on ground rented directly from an individual owner: this survey does not describe your counterparty. Professionally managed ground is a distinct and more institutional segment. Iowa's near-even county split is closer to the texture of individually negotiated leases, where the outcome depends on the relationship and the alternative tenant more than on a published rate.
For a landowner: 9% is a small number. A push for a material increase in 2027 puts you in the top decile of the profession's expectations, on ground where the tenant can read the same survey.
Ground Truth: The asymmetry worth exploiting is that this survey is public and most individual-owner negotiations are not informed by it. A tenant who opens by acknowledging that 67% of the profession expects flat — and then argues for flat rather than for a cut — is making a concession that costs nothing and buys credibility for the second ask, which should be about structure rather than rate.
4. When the rate will not move, move the structure
What's new: The spread between lease structures on the same ground is larger than the year-over-year movement in the rate, and it is the lever that is actually available in a flat market.
Evidence: On Illinois excellent soil in 2025, landlord income by lease type ran $375 per acre under custom farming, $300 under cash rent, and $250 under crop share (farmdoc daily, Apr 13, 2026).
| Lease structure | 2025 landlord income, excellent soil | |
|---|---|---|
| Custom farming | $375 | ██████████ |
| Cash rent | $300 | ████████ |
| Crop share | $250 | ███████ |
Source: Tsay and Schnitkey, farmdoc daily, Apr 13, 2026. Illinois excellent-quality soil, $/acre.
The $125 per acre spread between custom farming and crop share on identical ground is twelve times the $10 move in excellent-quality cash rent over two years. The structure carries more economics than the rate does, and it is the variable most often left untouched because the rate is what gets argued about.
What the spread actually prices is risk transfer. Under custom farming the landowner takes the full yield and price risk and pays a fee for the work; under crop share he takes a portion of both and receives less; under cash rent he takes essentially none and receives a middle number. The $125 is the market's price for that risk over a single year on good ground. In a year where the tenant believes 2027 revenue is more uncertain than the rent number implies, shifting toward a share arrangement transfers that uncertainty back to the party being paid a fixed sum to avoid it.
The practical form this takes in most negotiations is not a wholesale structure change but a flexible-cash provision: a base rent at or slightly below the flat number, with a bonus tied to a realized revenue threshold. The base protects the tenant in a poor year; the bonus gives the landowner participation in a good one, which is what makes the lower base acceptable. This is an unremarkable, widely used instrument and it is available now, in the eight weeks when the conversation is actually happening.
Ground Truth: In a market where 67% of the professional counterparty expects no change in the rate, arguing about the rate is arguing about the variable your counterparty has already decided not to move. The structure has not been decided and it carries more money. A tenant who spends the negotiation on flex provisions rather than on a $10 rate reduction is negotiating the larger number.
5. The timing constraint nobody negotiates around
Iowa's statutory lease termination date has passed for the 2027 crop year — September 1 is the deadline by which written notice must be served to terminate a farm tenancy, and a lease not terminated by then continues on the same terms into the next year. Illinois and most other Corn Belt states have their own notice conventions, commonly four months before the lease-year end.
The practical consequence is that the window for a structural change to a 2027 lease is narrower than the window for a rate change, and in some cases it has already closed. A tenant who wanted to convert a cash lease to a flexible arrangement for 2027 and has not opened that conversation is, in Iowa, negotiating an amendment to a lease that has already renewed rather than the terms of a new one. That is a materially weaker position and it is a self-inflicted one.
For the 2028 cycle, the item to put on the calendar is not October. It is July — far enough ahead of the notice deadline that structure is genuinely on the table, and far enough ahead of harvest that neither party is negotiating around a combine.
References
- Juo-Han Tsay and Gary Schnitkey, "Illinois Cash Rents and Leasing Expectations Through 2027," farmdoc daily, Department of Agricultural and Consumer Economics, University of Illinois, Apr 13, 2026 — https://farmdocdaily.illinois.edu/2026/04/illinois-cash-rents-and-leasing-expectations-through-2027.html
- Iowa State University Extension and Outreach, Cash Rental Rates for Iowa annual survey, 2026 — https://www.extension.iastate.edu/agdm/
- Farm Progress, "Why Iowa cropland cash rents barely budged in 2026," 2026 — https://www.farmprogress.com/farm-business/why-iowa-cropland-cash-rents-barely-budged-in-2026
- Morning Ag Clips, "Iowa Cropland Cash Rents Show Little Change for 2026," 2026 — https://www.morningagclips.com/iowa-cropland-cash-rents-show-little-change-for-2026/
- DTN/Progressive Farmer, "Fertilizer Prices Fall as UAN28, Urea Lead the Way Lower," Sep 2, 2026 (retail survey week of Aug 24–28, 2026) — https://www.dtnpf.com/agriculture/web/ag/crops/article/2026/09/02/fertilizer-prices-fall-uan28-urea
- Pro Farmer, "High Farmland Rents Force Early 2027 Budget Decisions for Farmers," 2026 — https://www.profarmer.com/news/high-farmland-rents-force-early-2027-budget-decisions-farmers
Disclosures
Crop Root Zone is an independent publication. Nothing here is investment advice. Market calls, where included, reflect the editors' own read and are not a recommendation to buy or sell any security.
The September Report Is Expected to Take 233 Million Bushels Off the Corn Crop and Only 120 Million Off the Carryout
The missing 113 million bushels are demand the trade already assumes price will ration away. Corn opened September rated 56% good-to-excellent, the worst September opening in three years, and the yield loss that caused is worth about $12 an acre against a rally worth about $160.
USDA releases the September World Agricultural Supply and Demand Estimates tomorrow, and the pre-report consensus is unusual in a specific way. Analysts expect corn yield at 178.1 bushels per acre and production at 15.780 billion bushels, against the August figure of 16.013 billion — a cut of 233 million bushels. They expect 2026/27 ending stocks at 1.533 billion, down 120 million from August (DTN/Progressive Farmer, Sep 9, 2026). Those two expectations do not reconcile by subtraction. A 233-million-bushel production cut that produces a 120-million-bushel carryout cut requires 113 million bushels of demand to disappear, and nobody has yet said which demand.
1. The condition series has been telling this story since late July
What's new: Corn opened September rated 56% good-to-excellent, described as the lowest September opening reading in three years (DTN/Progressive Farmer, Sep 9, 2026). The rating has fallen in six of the last seven weekly reports.
Evidence: The weekly series, as published:
| Week ending | Corn G/E | Change | |
|---|---|---|---|
| Jul 26, 2026 | 63% | — | ██████████ |
| Aug 2, 2026 | 61% | −2 | ██████████ |
| Aug 9, 2026 | 61% | 0 | ██████████ |
| Aug 16, 2026 | 60% | −1 | █████████ |
| Aug 23, 2026 | 57% | −3 | █████████ |
| Aug 30, 2026 | 57% | 0 | █████████ |
| Sep 8, 2026 | 56% | −1 | █████████ |
Source: USDA NASS Crop Progress as reported by DTN/Progressive Farmer, Jul 27 through Sep 9, 2026. Bars scaled to the July 26 reading.
The detail underneath the headline number matters more than the number. As of August 30 the crop was 17% very poor to poor, 26% fair, 44% good and 13% excellent — a good-to-excellent total of 57% against 69% a year earlier, a twelve-point year-over-year deterioration (DTN/Progressive Farmer, Aug 31, 2026). Iowa carried 77% good-to-excellent. The spread between a 77% state and a 56% national average is where the production loss lives.
Ground Truth: Seven points of national good-to-excellent lost between late July and early September is a grain-fill event, not a stand-establishment event, and grain-fill damage shows up in test weight and kernel depth rather than in acres. That distinction decides which USDA number moves. Acreage revisions are survey artifacts and get reversed; yield losses banked during grain fill do not get given back in October. The September figure is more likely to be the floor than the whipsaw.
2. The crop is early, and that is not good news
What's new: Development ran ahead of the five-year average through August at the same time as condition fell.
Evidence: As of August 30, corn was 92% in the dough stage against an 89% average, 62% dented against 56%, and 13% mature against a 13% average (DTN/Progressive Farmer, Aug 31, 2026). Soybeans were 95% setting pods against 93% and 13% dropping leaves against 9%. Spring wheat harvest stood at 77% complete against a 68% average and a 69% year-ago pace.
| Stage (Aug 30, 2026) | 2026 | 5-yr avg | Ahead by |
|---|---|---|---|
| Corn — dough | 92% | 89% | +3 |
| Corn — dented | 62% | 56% | +6 |
| Corn — mature | 13% | 13% | 0 |
| Soybeans — setting pods | 95% | 93% | +2 |
| Soybeans — dropping leaves | 13% | 9% | +4 |
| Spring wheat — harvested | 77% | 68% | +9 |
Source: USDA NASS Crop Progress as of Aug 30, 2026, reported by DTN/Progressive Farmer, Aug 31, 2026.
A crop that is six points ahead on denting while losing condition is a crop shutting down early. Corn that dents ahead of schedule in a deteriorating rating has stopped filling, not finished filling. The soybean leaf-drop number carries the same signal — four points ahead of average is early senescence, and the equivalent reading a week later was 26% against a 20% average.
Ground Truth: This is why the trade is comfortable cutting yield 2.3 bushels and is not talking about cutting it further in October. Early maturity closes the loss. There is no scenario in which September weather adds bushels back to a crop that was 62% dented on August 30 — the crop is already made, and the only thing still in play is harvest loss and test weight discovery at the elevator. Growers who normally hold a portion of new crop unpriced waiting for the October report should note that the yield uncertainty they are waiting on has mostly already resolved; what remains open is demand, and that is not a number USDA discovers in a field.
3. The 113 million bushels nobody has named
What's new: The consensus expects the production cut to be absorbed roughly half by carryout and half by demand.
Evidence: Working the numbers in the order the balance sheet works them:
| Line | August 2026 | September consensus | Change |
|---|---|---|---|
| Corn yield (bu/ac) | ~180.4 | 178.1 | −2.3 |
| Corn production (bn bu) | 16.013 | 15.780 | −0.233 |
| 2026/27 ending stocks (bn bu) | ~1.653 | 1.533 | −0.120 |
| Implied change in total use | — | — | −0.113 |
Source: August production and the September consensus for yield, production and ending stocks per DTN/Progressive Farmer, Sep 9, 2026. The August yield and August ending-stocks figures are back-calculated from the reported September consensus and the stated changes, and are approximations rather than published numbers.
So the trade is not simply marking down the crop. It is marking down the crop and simultaneously assuming that 113 million bushels of demand — feed, ethanol, or export — will not be there at the price required to clear the smaller crop. That is an economic judgment dressed as a supply forecast, and it is the part of the consensus most likely to be wrong in either direction.
113 million bushels
The demand the September consensus assumes will be rationed away by price. For scale, it is about 0.7% of the August production estimate, and about three days of total US corn use. (Calculated from the DTN/Progressive Farmer pre-report consensus, Sep 9, 2026.)
Why it could be too small: December corn closed at $5.2775 on September 9 after rallying nearly 90 cents from August 12 (Brownfield Ag News, Sep 9, 2026; DTN/Progressive Farmer, Sep 9, 2026). A 90-cent rally into a livestock sector already working on tight margins rations more than three days of use.
Why it could be too large: the same period saw corn ship substantially more than the prior year, and the ethanol grind is not price-elastic in the short run when the blend is mandated. Export demand has a competitive floor set by the Black Sea, where more than 90% of Russia's Azov-Black Sea grain export capacity has been taken offline and terminal throughput has fallen to an estimated 2 to 2.5 million tonnes a month against a 4-million-tonne ceiling (Kpler, Aug 21, 2026). Demand that has nowhere else to go does not ration easily.
4. What the whole move is actually worth per acre
What's new: The yield loss the September report is expected to confirm is worth about $12 an acre. The price move it caused is worth about $160.
Evidence: Take the consensus yield and the September 9 close and run both sides.
| Item | Calculation | $/acre |
|---|---|---|
| Gross revenue at August yield | 180.4 bu × $5.2775 | 952.06 |
| Gross revenue at September consensus yield | 178.1 bu × $5.2775 | 939.73 |
| Yield loss | difference | −12.33 |
| Value of the 90¢ rally at consensus yield | 178.1 bu × $0.90 | +160.29 |
Source: yields per the DTN/Progressive Farmer consensus, Sep 9, 2026; December corn settlement $5.27¾, Brownfield Ag News, Sep 9, 2026; the 90-cent rally measured Aug 12 to the early-September peak per DTN/Progressive Farmer, Sep 9, 2026. Gross revenue only — no basis, no storage, no cost of production.
And the input side moved the same direction. Retail anhydrous averaged $923 per ton in the fourth week of August at $0.56 per pound of nitrogen, down from $1,118 and $0.68 in late May (DTN/Progressive Farmer, Sep 2 and Jun 10, 2026). At 180 pounds of N per acre that is $100.80, or 19.1 bushels of December corn at Wednesday's close, against 23.2 bushels at the late-May combination of a higher nitrogen price and a lower corn price.
Ground Truth: A grower whose crop tracks the national average has lost about twelve dollars an acre of bushels and gained about a hundred and sixty dollars an acre of price, while the nitrogen bill for next year's crop fell by four bushels an acre of purchasing power. That is the least sympathetic possible reading of a bad crop year, and it is arithmetically correct for the average — which is exactly why it is dangerous. The average does not exist. Iowa at 77% good-to-excellent captured the price without the loss; a grower in the 17% very-poor-to-poor tail took a yield cut several times the national 2.3 bushels and is selling fewer bushels into the rally than his revenue guarantee assumed. The wider the state-level dispersion, the less a national balance sheet tells any individual operation about its own year. Run the revenue math on your own yield monitor, not on the consensus.
5. What to watch after the report
What's new: Three of the report's lines matter more than the headline yield, and one of them is not about corn.
Evidence and reasoning:
The demand side of the corn balance sheet, line by line. The consensus has 113 million bushels of use disappearing without saying where. If USDA cuts feed and residual, that is a livestock-margin story with a long tail. If it cuts exports, that is a competitiveness story that the Black Sea outage argues against. If it cuts neither and takes the whole production loss out of carryout, the resulting sub-1.45-billion carryout is a materially more bullish balance sheet than the consensus is priced for.
Soybeans, where the consensus is a 30-million-bushel stocks cut to 290 million on a yield of 52.5 bushels and production just over 4.5 billion. A 290-million-bushel carryout on the largest soybean crop in US history is a tight number, and November beans closed at $13.09½ on September 9 (Brownfield Ag News, Sep 9, 2026) against the $10.30s a year earlier.
Wheat, where the consensus is essentially unchanged at 720 million bushels against 717 million in August — and December Kansas City wheat has moved above $8 to three-year highs while December Chicago closed at $7.28¾. A flat wheat balance sheet against a three-year price high says the wheat move is entirely a Black Sea story, not a North American one, and Black Sea stories reverse faster than balance sheets do.
Ground Truth: The single most actionable thing in tomorrow's report will not be the yield. It will be whether USDA validates the trade's assumption that demand rations. If it does, the market has already priced the crop and the rally stalls. If it refuses — taking the full production cut out of carryout — then a market that just rallied 90 cents is looking at a balance sheet tighter than the one it rallied on. For a grower with unpriced new crop, that asymmetry is the argument for putting a floor under a portion of it before the number prints rather than after: the downside case has already been paid for by the rally, and the upside case is a report USDA has not yet written.
References
- DTN/Progressive Farmer, "After Historic Late-August Price Rallies, USDA Returns With New Forecasts" — Sep 9, 2026 (September 11 WASDE pre-report consensus for corn, soybeans and wheat; corn 56% good-to-excellent as of Sep 8; the 90-cent December corn rally from Aug 12). https://www.dtnpf.com/agriculture/web/ag/news/article/2026/09/09/historic-late-august-price-rallies
- DTN/Progressive Farmer, "USDA Crop Progress: Corn Rated 57% Good to Excellent; Soybeans 58% Good to Excellent as of Aug. 30" — Aug 31, 2026 (condition breakdowns, development stages against five-year averages, state detail). https://www.dtnpf.com/agriculture/web/ag/news/article/2026/08/31/usda-crop-progress-corn-rated-57-58
- DTN/Progressive Farmer, "USDA Releases August Crop Production" — Aug 12, 2026 (August acreage and production estimates: 96.7 million corn acres, 16.013 billion bushels, soybeans 4.519 billion bushels at 52.7 bu/ac). https://www.dtnpf.com/agriculture/web/ag/news/article/2026/08/12/usda-releases-august-crop-production-4
- Brownfield Ag News, "Closing Grain and Livestock Futures: September 9, 2026" — Sep 9, 2026 (December corn $5.27¾, November soybeans $13.09½, December Chicago wheat $7.28¾). https://www.brownfieldagnews.com/market-news/closing-grain-and-livestock-futures-september-9-2026/
- DTN/Progressive Farmer, "Fertilizer Prices Fall as UAN28, Urea Lead the Way Lower" — Sep 2, 2026 (retail anhydrous $923/ton, $0.56/lb N, fourth week of August). https://www.dtnpf.com/agriculture/web/ag/crops/article/2026/09/02/fertilizer-prices-fall-uan28-urea
- DTN/Progressive Farmer, "Urea Moves Lower; 6 Fertilizers Continue To Be Slightly Higher" — Jun 10, 2026 (retail anhydrous $1,118/ton, $0.68/lb N, week of May 25–29). https://www.dtnpf.com/agriculture/web/ag/crops/article/2026/06/10/urea-moves-lower-6-fertilizers
- Kpler, "Black Sea gridlock, a building El Niño and the US-China soybean gamble" — Aug 21, 2026 (Russian Black Sea terminal throughput and capacity). https://www.kpler.com/blog/black-sea-gridlock-a-building-el-nino-and-the-us-china-soybean-gamble
Disclosures
Crop Root Zone is an independent publication. Nothing here is investment advice. Market calls, where included, reflect the editors' own read and are not a recommendation to buy or sell any security.
The Largest Soybean Crop in American History Is Bid $13.09. Last Year's Smaller One Was Bid $10.30.
A 27% year-over-year price gain on record production, a 290-million-bushel carryout, and a soybean-to-corn ratio of 2.48 — which overstates soybeans for 2027, because the ratio cannot see that corn's nitrogen bill fell 20% over the summer.
November soybeans closed at $13.09½ on Wednesday, down 6¾ cents on the day (Brownfield Ag News, Sep 9, 2026). A year earlier the same contract month was trading in the low $10.30s (DTN/Progressive Farmer, Sep 9, 2026). Between those two prices, US farmers grew what the August WASDE estimated at 4.519 billion bushels on 86.8 million planted acres — the largest soybean crop the country has ever produced (DTN/Progressive Farmer, Aug 12, 2026). Record supply and a 27% price gain are not supposed to arrive together, and the reason they did is worth more attention than the headline.
1. Record production, tight carryout
What's new: The September consensus puts 2026/27 soybean ending stocks at 290 million bushels, down 30 million from August, on production just over 4.5 billion (DTN/Progressive Farmer, Sep 9, 2026).
Evidence: A carryout of 290 million against production of 4.5 billion is a stocks-to-production ratio of 6.4%. Put beside the corn balance sheet the same consensus describes, the difference in tightness is the whole story:
| Crop | Production (bn bu) | Ending stocks (bn bu) | Stocks / production |
|---|---|---|---|
| Corn 2026/27 | 15.780 | 1.533 | 9.7% |
| Soybeans 2026/27 | ~4.50 | 0.290 | 6.4% |
Source: September 11 WASDE pre-report consensus as reported by DTN/Progressive Farmer, Sep 9, 2026. Ratios calculated. Stocks-to-production is used here rather than the conventional stocks-to-use because the consensus does not publish a total-use figure.
The record crop is real and so is the tightness. Both can be true because demand grew faster than the acreage did. Condition supports a crop near but not above trend: soybeans rated 58% good-to-excellent as of August 30 — 13% very poor to poor, 29% fair, 46% good, 12% excellent — down from 60% the prior week and 65% a year earlier, with North Dakota at just 30% (DTN/Progressive Farmer, Aug 31, 2026).
Ground Truth: A 6.4% carryout ratio is why a record crop did not break the price. At that level the balance sheet has no absorptive capacity — every bushel of demand surprise and every bushel of yield surprise goes straight into price, in either direction. That is a market that pays for storage and punishes anyone who assumes a record crop means a seasonal harvest low. The traditional advice to sell into harvest because the crop is big is advice about a balance sheet with slack in it, and this one has none.
2. Where the demand came from
What's new: Two independent demand legs — Chinese purchasing and a domestic crush margin above two dollars a bushel — are carrying a record crop.
Evidence: On the export side, Kpler expects China to purchase 25 million tonnes of US soybeans under current relations, with a Xi–Trump meeting on September 24, 2026 as the near-term event that shapes whether the non-soybean half of the trade commitment gets filled. Non-soybean agricultural sales stood at just under $0.6 billion in the latest customs data against a pro-rated target of $1.4 billion a month needed to meet a $17 billion annual pledge — a shortfall of roughly $0.8 billion a month (Kpler, Aug 21, 2026). Soybeans are, in other words, the part of the arrangement that is working.
On the domestic side, the board crush is paying processors to bid for beans:
| Component | Sep 9, 2026 settlement | Per bushel of soybeans |
|---|---|---|
| October soybean meal | $345.10/short ton | 44 lb → $7.59 |
| October soybean oil | 70.08 ¢/lb | 11 lb → $7.71 |
| Combined product value | $15.30 | |
| November soybeans | $13.09½ | −$13.10 |
| Gross board crush margin | $2.21 |
Source: settlements per Brownfield Ag News, Sep 9, 2026. Yields of 44 lb meal and 11 lb oil per bushel are the standard industry conversion. This is an approximate board crush using the October product months against the November bean month, not a same-month crush, and it excludes processing cost — treat it as an indicator of direction and magnitude, not as a processor's actual margin.
$2.21/bu
Approximate gross board crush margin at Wednesday's settlements. A crush margin at this level means the domestic processor, not the export elevator, is the marginal bidder for a large share of this crop — which puts a floor under basis that does not depend on a river or a vessel. (Calculated from Brownfield Ag News settlements, Sep 9, 2026.)
Why this matters for a grower's marketing plan: an export-driven soybean rally and a crush-driven soybean rally behave differently at the local elevator. Export demand pays the Gulf and works back up the river, so it rewards farms with barge access and punishes the interior when freight tightens. Crush demand pays wherever the plant is, and the plant does not care about river stage.
3. The ratio, and why it is lying to you about 2027
What's new: At Wednesday's settlements the soybean-to-corn price ratio is 2.48 — historically a signal to shift acres toward soybeans. Adjusted for the nitrogen price move, the effective ratio is nearer 2.43.
Evidence: Start with the raw ratio and the gross revenue at consensus yields.
| Item | Corn | Soybeans |
|---|---|---|
| Sep 9, 2026 settlement ($/bu) | 5.2775 | 13.0950 |
| September consensus yield (bu/ac) | 178.1 | 52.5 |
| Gross revenue ($/ac) | 939.73 | 687.49 |
| Nitrogen at 180 lb N/ac, anhydrous $0.56/lb N | −100.80 | 0.00 |
| Gross revenue less nitrogen ($/ac) | 838.93 | 687.49 |
Source: settlements per Brownfield Ag News, Sep 9, 2026; consensus yields per DTN/Progressive Farmer, Sep 9, 2026; anhydrous at $0.56/lb N, fourth week of August, per DTN/Progressive Farmer, Sep 2, 2026. Gross revenue only — no basis, no seed, no drying, no machinery, no land.
Now the part the price ratio cannot see. Retail anhydrous fell from $0.68 to $0.56 per pound of nitrogen between the last week of May and the last week of August 2026, and urea, UAN28 and UAN32 all fell about 20% over the same three months (DTN/Progressive Farmer, Jun 10 and Sep 2, 2026). At 180 pounds of N per acre, the anhydrous move alone is worth $21.60 an acre. Spread over a 178.1-bushel crop, that is 12.1 cents per bushel of corn the ratio never sees, because it is a cost change and the ratio is built from prices.
| Ratio basis | Corn ($/bu) | Soybeans ($/bu) | Ratio |
|---|---|---|---|
| Raw price ratio, Sep 9, 2026 | 5.2775 | 13.0950 | 2.481 |
| Corn credited with the nitrogen decline | 5.3985 | 13.0950 | 2.426 |
Source: calculated. The nitrogen credit is the $21.60/acre saving from the anhydrous move divided by the 178.1-bushel consensus yield, added to the corn price as a like-for-like adjustment.
Ground Truth: Rotation rules of thumb built on the 2.4-to-2.5 ratio band were calibrated in an era when nitrogen moved a few percent a year. Nitrogen moved 17% to 22% in one quarter in 2026. A ratio of 2.48 sits at the top of the band and reads "plant beans"; the same market with corn's actual input cost applied sits at 2.43, in the middle of the band, and reads "nothing has changed." The 2027 acreage decision should be made on revenue less nitrogen per acre, not on a price ratio — and on that basis corn is ahead by roughly $151 an acre gross, which the additional seed, drying and machinery cost of a corn acre erodes but, on most operations, does not erase. Growers should run that gap against their own numbers rather than accept an estimate here, because the seed-and-drying differential varies more between farms than the price ratio varies between years.
4. The caveat on the contract months, stated plainly
What's new: The 2.48 ratio is computed from the crop currently being harvested, not from the crop that will be planted in 2027.
Evidence: November 2026 soybeans and December 2026 corn are harvest-delivery contracts for the crop in the ground now. The acreage decision for 2027 is properly made against the November 2027 and December 2027 contracts, which is where new-crop insurance guarantees and forward cash contracts will be written. Those deferred settlements are not reported in the daily grain summaries used here and this publication has not verified them, so no 2027 ratio is offered.
What can be said without them: the 2026 ratio and the 2026 nitrogen price are the information a grower has in September, and the deferred contracts historically track the nearby with a carry rather than inverting the relationship outright. The direction of the adjustment — that a nitrogen decline flatters corn in a way the price ratio conceals — holds at any pair of contract months, because it is arithmetic about cost rather than a claim about the forward curve.
Ground Truth: The honest position in September is that the rotation decision does not need to be made yet, and the two inputs that will decide it are both still moving. Corn's nitrogen cost depends on how much of China's remaining 2026 urea export quota ships in the fourth quarter. Soybeans' price depends on whether the 25-million-tonne Chinese purchase expectation survives the September 24 meeting. Neither of those resolves before the deferred contracts have to be traded, which is an argument for waiting rather than for deciding on the September ratio. What is worth doing now is pricing the nitrogen, not the acres — the nitrogen decision has a known cost basis and a closing window, and the acreage decision has neither.
5. What to watch
What's new: Four observable items, in descending order of what they would move.
Evidence and reasoning:
The September 11 soybean carryout. A 290-million-bushel figure is consensus; anything under 270 million on a record crop is a materially tighter balance sheet than the price reflects, and anything over 320 million says the demand assumptions are being marked down.
September 24. The Xi–Trump meeting is the single scheduled event most likely to move the export leg. Note the asymmetry: soybean purchasing is already the part of the commitment being met, so the meeting's upside for beans is smaller than its downside.
The board crush. A $2.21 gross margin is what is currently making the domestic processor the marginal bidder. Watch the meal side in particular — soybean meal at $345.10 with a livestock sector absorbing 90-cent corn appreciation is the leg most exposed to feed-demand rationing.
Early yield reports against the 52.5 consensus. Soybeans were 26% dropping leaves by September 6 against a 20% average, so combines will be in beans early and the first real yield data will arrive before the October report. Early senescence in a 58%-rated crop argues the risk to 52.5 is to the downside.
Ground Truth: The uncomfortable feature of this market is that both crops are being priced off the same two foreign events — a Black Sea outage and a Chinese negotiation — while the domestic balance sheets do most of the talking in the reports. That means the September 11 report is unlikely to settle either price, and a grower waiting for USDA to provide clarity will be waiting for the wrong institution. The clarity, when it comes, will come from a shipping lane and a summit.
References
- Brownfield Ag News, "Closing Grain and Livestock Futures: September 9, 2026" — Sep 9, 2026 (November soybeans $13.09½, December corn $5.27¾, October soybean meal $345.10, October soybean oil 70.08, December Chicago wheat $7.28¾). https://www.brownfieldagnews.com/market-news/closing-grain-and-livestock-futures-september-9-2026/
- DTN/Progressive Farmer, "After Historic Late-August Price Rallies, USDA Returns With New Forecasts" — Sep 9, 2026 (September 11 WASDE consensus: soybean yield 52.5, production just over 4.5 billion, ending stocks 290 million; corn 178.1 and 15.780 billion with 1.533 billion carryout; the year-earlier $10.30s soybean reference). https://www.dtnpf.com/agriculture/web/ag/news/article/2026/09/09/historic-late-august-price-rallies
- DTN/Progressive Farmer, "USDA Raises Corn, Soybean Production With More Planted Acres for Both Crops" — Aug 12, 2026 (soybeans 4.519 billion bushels, 52.7 bu/ac, 86.8 million planted and 85.8 million harvested acres — largest US crop on record). https://www.dtnpf.com/agriculture/web/ag/news/article/2026/08/12/usda-releases-august-crop-production-4
- DTN/Progressive Farmer, "USDA Crop Progress: Corn Rated 57% Good to Excellent; Soybeans 58% Good to Excellent as of Aug. 30" — Aug 31, 2026 (soybean condition breakdown, dropping leaves, North Dakota detail). https://www.dtnpf.com/agriculture/web/ag/news/article/2026/08/31/usda-crop-progress-corn-rated-57-58
- Kpler, "Black Sea gridlock, a building El Niño and the US-China soybean gamble" — Aug 21, 2026 (25-million-tonne Chinese purchase expectation, non-soybean commitment shortfall, September 24 meeting). https://www.kpler.com/blog/black-sea-gridlock-a-building-el-nino-and-the-us-china-soybean-gamble
- DTN/Progressive Farmer, "Fertilizer Prices Fall as UAN28, Urea Lead the Way Lower" — Sep 2, 2026 (anhydrous $923/ton and $0.56/lb N, fourth week of August). https://www.dtnpf.com/agriculture/web/ag/crops/article/2026/09/02/fertilizer-prices-fall-uan28-urea
- DTN/Progressive Farmer, "Urea Moves Lower; 6 Fertilizers Continue To Be Slightly Higher" — Jun 10, 2026 (anhydrous $1,118/ton and $0.68/lb N, week of May 25–29). https://www.dtnpf.com/agriculture/web/ag/crops/article/2026/06/10/urea-moves-lower-6-fertilizers
Disclosures
Crop Root Zone is an independent publication. Nothing here is investment advice. Market calls, where included, reflect the editors' own read and are not a recommendation to buy or sell any security.
Midwest Diesel Is $2.19 a Gallon Above Last September. A Harvest-and-Fall-Tillage Pass on Corn Ground Burns About 2.9 Gallons an Acre.
At $5.95 a gallon, the fuel inside a combine pass, grain haul, chisel and fall anhydrous application costs about $17 an acre against $11 a year ago. The field operation whose cost moved most is the one a grower can still decide not to run: fall tillage.
Diesel in the Midwest averaged $5.946 a gallon in the week of September 7, 2026, according to the U.S. Energy Information Administration — up from $4.458 in the week of July 6 and $3.754 in the same week of 2025 (EIA, weekly retail diesel prices, accessed Sep 14, 2026). The national average set a record of $5.85 on September 4 and reached $6.05 on September 11, roughly 60% above late February, as the U.S.–Iran war that began that month disrupted tanker traffic through the Strait of Hormuz (Associated Press via Transport Topics, Sep 11, 2026).
That price lands on the heaviest fuel weeks of the farm year. Combines, grain carts, trucks, tillage tractors and anhydrous toolbars all run between mid-September and freeze-up. Iowa State University's updated fuel-requirement tables make it possible to price each of those operations per acre, and to separate the fuel a grower has to burn from the fuel a grower chooses to burn.
1. What the price did, and how fast
What's new: The Midwest diesel price rose in seven of the nine weekly changes from early July to early September, erasing a June decline and finishing at the highest weekly level in the series shown here.
Evidence:
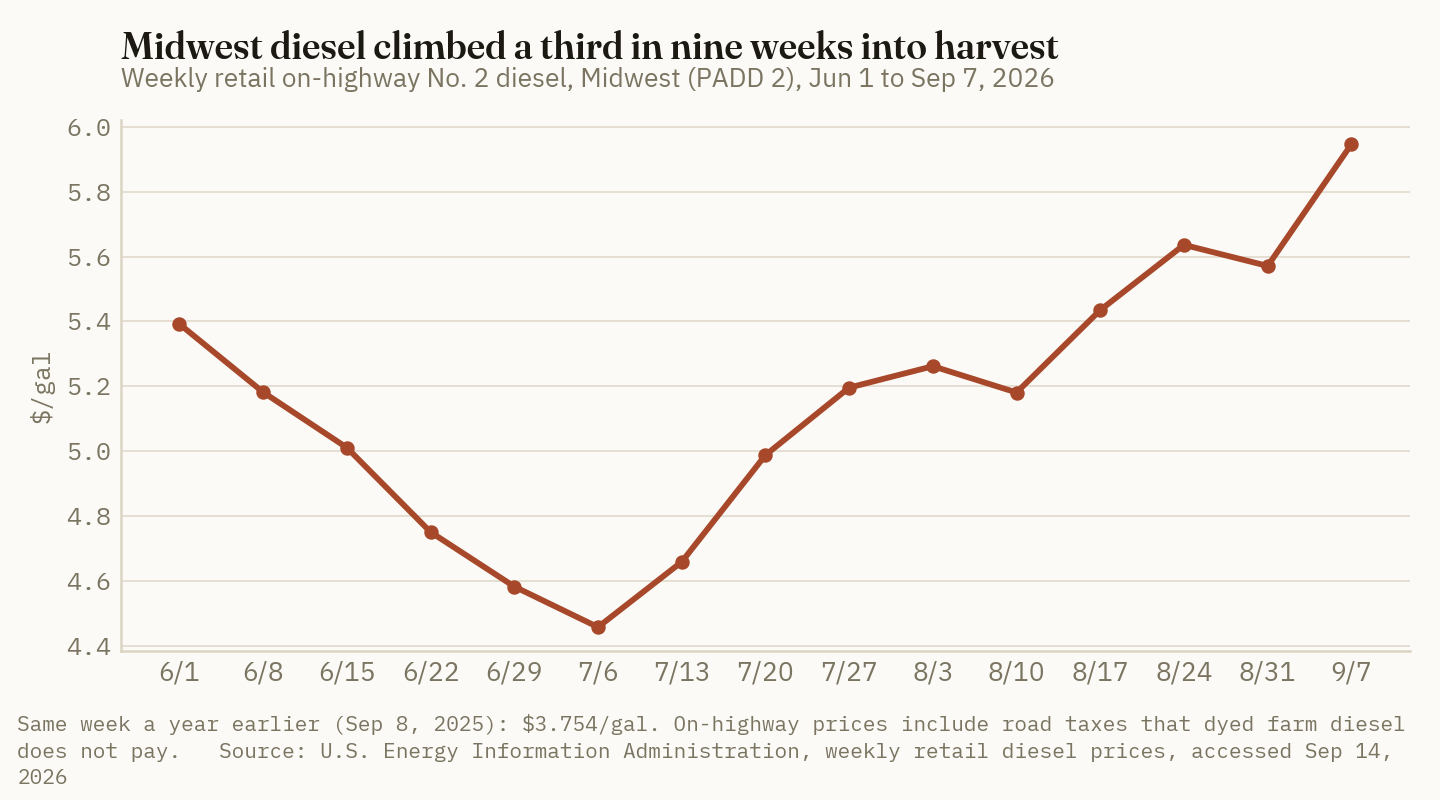
| Week of | Midwest diesel ($/gal) | Change vs Sep 8, 2025 |
|---|---|---|
| Sep 8, 2025 | 3.754 | — |
| Jun 1, 2026 | 5.392 | +43.6% |
| Jul 6, 2026 | 4.458 | +18.8% |
| Aug 3, 2026 | 5.262 | +40.2% |
| Aug 31, 2026 | 5.571 | +48.4% |
| Sep 7, 2026 | 5.946 | +58.4% |
Source: U.S. Energy Information Administration, Midwest (PADD 2) weekly retail on-highway No. 2 diesel, accessed Sep 14, 2026. Percent changes are Crop Root Zone calculations.
On-highway prices include road taxes that dyed off-road farm diesel does not pay, so the price at the farm tank is lower than these figures. Where those taxes are levied per gallon rather than as a percentage, the dollar increase per gallon — $2.19 year on year — carries through to farm diesel largely intact, and the percentage increase at the farm tank is larger than 58%.
Ground Truth: The number to budget with is the dollar change per gallon, not the percentage. A grower comparing this fall's delivered farm-diesel quote with last fall's should expect the gap to look like $2 a gallon give or take, whatever the absolute price on the ticket — and should treat a supplier quote showing a much smaller gap as a prompt to ask when the load was priced.
2. What each operation burns
What's new: Iowa State's Ag Decision Maker revised its fuel-requirement table in February 2026, adding updated medians for 2015–2025 equipment classes drawn from ASABE machinery management data.
Evidence:
| Operation | Gal/acre | Fuel $/acre at $3.754 | Fuel $/acre at $5.946 | Change | |
|---|---|---|---|---|---|
| Subsoiler/ripper | 1.70 | 6.38 | 10.11 | +3.73 | ██████████ |
| Disk-chisel | 1.30 | 4.88 | 7.73 | +2.85 | ████████ |
| Combine, corn | 1.25 | 4.69 | 7.43 | +2.74 | ███████ |
| Combine, soybeans | 1.00 | 3.75 | 5.95 | +2.19 | ██████ |
| Chisel plow | 0.90 | 3.38 | 5.35 | +1.97 | █████ |
| Anhydrous application | 0.55 | 2.06 | 3.27 | +1.21 | ███ |
| Shredding cornstalks | 0.45 | 1.69 | 2.68 | +0.99 | ███ |
| Hauling corn, field + 0.5 mi | 0.18 | 0.68 | 1.07 | +0.39 | █ |
| Spreading dry fertilizer | 0.15 | 0.56 | 0.89 | +0.33 | █ |
Sources: Iowa State University Extension, Ag Decision Maker File A3-27, "Fuel Required for Field Operations," revised February 2026 (updated 2015–2025 medians used for combine corn, chisel plow and grain hauling; table values otherwise); EIA Midwest diesel prices for the weeks of Sep 8, 2025 and Sep 7, 2026. Dollar columns are Crop Root Zone calculations.
Iowa State cautions that actual requirements "may be as much as 35% higher or lower" than the table depending on tractor and soil, that the values include only field work and not travel to and from the field, and that tillage figures were calculated for a central Iowa loam (ISU Ag Decision Maker A3-27, Feb 2026).
Ground Truth: The operations at the top of this table are tillage, not harvest. A ripper pass now costs about $10 an acre in fuel alone, and a disk-chisel nearly $8 — both more than the combine. That ordering is not new, but at $5.95 the gap has widened to the point where the tillage decision is worth making field by field this fall rather than by habit.
3. A fall program, priced per acre
What's new: Stacking the operations into realistic fall sequences shows how the fuel bill scales with tillage intensity on corn ground.
Evidence:
| Fall program, corn ground | Gal/acre | $/acre at $3.754 | $/acre at $5.946 | Change |
|---|---|---|---|---|
| Harvest only (combine + haul) | 1.43 | 5.37 | 8.50 | +3.13 |
| Harvest + chisel | 2.33 | 8.75 | 13.85 | +5.11 |
| Harvest + chisel + anhydrous | 2.88 | 10.81 | 17.12 | +6.31 |
| Harvest + shred + disk-chisel + anhydrous | 3.73 | 14.00 | 22.18 | +8.18 |
| Soybean harvest (combine + haul) | 1.08 | 4.05 | 6.42 | +2.37 |
Sources: ISU Ag Decision Maker A3-27, Feb 2026; EIA, Midwest diesel. Programs and dollar values are Crop Root Zone calculations and exclude travel between fields, grain drying fuel and all non-fuel machinery costs.
$17.12/acre
Fuel for combining, hauling, chiseling and applying anhydrous on an acre of corn at Midwest diesel of $5.946 — up $6.31 from a year ago. (Crop Root Zone calculation from ISU A3-27 and EIA, Sep 2026)
For a single operator, the harvest line alone is large. One Missouri corn and soybean grower told the Associated Press his combine uses about 200 gallons a day over an expected 30-day harvest (Associated Press via Transport Topics, Sep 11, 2026). At the Midwest year-on-year increase of $2.19 a gallon, 6,000 gallons of combine fuel costs about $13,150 more than it would have last September (Crop Root Zone calculation).
Ground Truth: Of the $6.31-an-acre increase on a harvest-chisel-anhydrous program, about half is harvest and hauling that must happen regardless. The other half is split between a chisel pass the grower can skip and an anhydrous pass the grower can move to spring. At current prices the chisel pass alone carries about $5.35 an acre of fuel — equal to roughly 9.5 pounds of anhydrous nitrogen at DTN's late-August retail price of $0.56 per pound (DTN/Progressive Farmer, Sep 2, 2026). That is the unit of comparison a no-till or strip-till argument should use this fall.
4. What the fuel price does not change
What's new: Fuel is only one input to the cost of a field operation, and for the fertilizer passes it remains small relative to the product applied.
Evidence: Applying 150 pounds of nitrogen as anhydrous costs about $84 an acre in product at $0.56 per pound of N (DTN/Progressive Farmer, Sep 2, 2026), against $3.27 an acre of application fuel at 0.55 gallons and $5.946 diesel (Crop Root Zone calculation from ISU A3-27 and EIA). A dry broadcast pass at 0.15 gallons carries under $1 an acre of fuel.
| Cost line on a fall anhydrous acre | $/acre | Share |
|---|---|---|
| Nitrogen, 150 lb N at $0.56/lb | 84.00 | 96% |
| Application fuel, 0.55 gal at $5.946 | 3.27 | 4% |
| Total, product plus fuel | 87.27 | 100% |
Sources: DTN/Progressive Farmer, Sep 2, 2026; ISU A3-27, Feb 2026; EIA, Sep 2026. The 150 lb N rate is an illustrative assumption, and machinery ownership, labor and custom-hire margins are excluded.
Ground Truth: Do not let a $6 diesel headline push a fall nitrogen decision. Even at record fuel, application diesel is about 4% of the cost of a fall anhydrous acre, and moving that pass to spring saves nothing on fuel — it simply moves the gallons to a season when the diesel price is unknown. Where diesel does change the math is tillage, where there is no product in the pass and fuel is a far larger share of the direct cost.
5. What to watch through freeze-up
What's new: The weekly EIA series will show whether the September increase holds through the peak fuel weeks of harvest and fall application.
Evidence: The national average rose from a record $5.85 on September 4 to $6.05 on September 11 (Associated Press via Transport Topics, Sep 11, 2026), while the Midwest weekly series rose $0.375 from the week of August 31 to the week of September 7 (EIA).
| Indicator | Latest | Why it matters for fall field work |
|---|---|---|
| EIA Midwest weekly diesel | $5.946 (wk of Sep 7) | Sets the delivered farm-diesel quote with a short lag |
| National average (AP report) | $6.05 (Sep 11) | Signals whether the Midwest series has another week of increases to absorb |
| Strait of Hormuz tanker traffic | Disrupted (AP, Sep 11) | The cause cited for the move since late February |
Sources: EIA, accessed Sep 14, 2026; Associated Press via Transport Topics, Sep 11, 2026.
Ground Truth: Prices this volatile argue for filling farm tanks against firm harvest needs rather than against the whole fall program. Harvest gallons are certain and near; tillage gallons are optional and can be priced later — or not burned at all if the price is still here in November. A grower who contracts fuel for a tillage program he may not run is taking a price position on diesel, not managing a field operation.
References
- U.S. Energy Information Administration, Weekly Midwest (PADD 2) No. 2 Diesel Retail Prices, accessed Sep 14, 2026 — https://www.eia.gov/dnav/pet/hist/LeafHandler.ashx?n=PET&s=EMD_EPD2D_PTE_R20_DPG&f=W
- Iowa State University Extension and Outreach, Ag Decision Maker File A3-27, "Fuel Required for Field Operations," revised February 2026 (K. A. Rosentrater; original author M. Hanna) — https://www.extension.iastate.edu/agdm/crops/pdf/a3-27.pdf
- Associated Press via Transport Topics, "Diesel Prices Hit Record Highs at a Bad Time for Farmers," Sep 11, 2026 — https://www.ttnews.com/articles/diesel-prices-record-farmers
- DTN/Progressive Farmer, "Fertilizer Prices Fall as UAN28, Urea Lead the Way Lower," Sep 2, 2026 (retail survey week of Aug 24–28, 2026) — https://www.dtnpf.com/agriculture/web/ag/crops/article/2026/09/02/fertilizer-prices-fall-uan28-urea
Disclosures
Crop Root Zone is an independent publication. Nothing here is investment advice. Market calls, where included, reflect the editors' own read and are not a recommendation to buy or sell any security.
A 55-Foot Bar at 5 MPH Empties a 1,450-Gallon Nurse Tank in 57 Minutes. The Toolbar Was Never the Constraint.
At 200 pounds of anhydrous per acre, one full nurse tank covers about 32 acres and carries roughly $2,900 of product at the September retail price — so fall nitrogen throughput is a tank-turn problem and a road problem, and widening the bar makes it worse.
Take the standard worked example the equipment trade uses for sizing an anhydrous plumbing system: 200 pounds of NH3 per acre, 5 miles per hour, a 55-foot toolbar. The flow requirement is about 27 gallons per minute, or roughly 1,620 gallons per hour, which is what determines the valve and hose specification (Dultmeier Sales, liquid withdrawal nurse tank valve flow rate reference).
Run the same geometry through the acreage side rather than the plumbing side and a different number appears. Fifty-five feet at 5 mph is 33.3 acres per hour. At 200 pounds per acre and a liquid anhydrous density of about 5.15 pounds per gallon at 60°F, that is 38.8 gallons per acre and 1,293 gallons per hour of actual product going in the ground.
A 1,450-gallon nurse tank, filled to the 85% regulatory limit, holds about 1,232 usable gallons. At 1,293 gallons per hour, it is empty in 57 minutes.
That single fact reorganizes the whole fall nitrogen logistics question, and it is not the fact most fall programs are planned around.
1. The tank is the unit of work, not the acre
What's new: The binding constraint on a fall anhydrous program is the number of full nurse tanks that reach the field per day. Everything else — bar width, ground speed, tractor horsepower — determines how fast a tank is consumed, not how many arrive.
Evidence: Acres covered per full nurse tank, at the 85% fill limit and 5.15 lb/gal:
| Tank size (gal) | Usable @ 85% | @ 150 lb/ac | @ 180 lb/ac | @ 200 lb/ac | @ 250 lb/ac |
|---|---|---|---|---|---|
| 1,000 | 850 | 29.2 | 24.3 | 21.9 | 17.5 |
| 1,200 | 1,020 | 35.0 | 29.2 | 26.3 | 21.0 |
| 1,450 | 1,232 | 42.3 | 35.3 | 31.7 | 25.4 |
| 1,500 | 1,275 | 43.8 | 36.5 | 32.8 | 26.3 |
Acres per tank calculated by Crop Root Zone as (usable gallons × 5.15 lb/gal) ÷ lb per acre. Tank sizes from commercially available nurse tank specifications (Cactus Tanks; Arcosa 1,000-gallon NH3 nurse tank, Stutsmans). The 85% fill limit is the standard maximum for anhydrous ammonia service. Density of 5.15 lb/gal is the conventional figure at 60°F and varies with temperature.
Read across the 200 lb/acre column: the entire commercially available nurse tank range covers between 22 and 33 acres. That is the unit of work. A 640-acre section at that rate is 20 tank fills. A 2,000-acre fall program is about 63.
| Tank size @ 200 lb/ac | Acres per fill | |
|---|---|---|
| 1,500 gal | 32.8 | ██████████ |
| 1,450 gal | 31.7 | ██████████ |
| 1,200 gal | 26.3 | ████████ |
| 1,000 gal | 21.9 | ███████ |
Calculated by Crop Root Zone; see table above for method.
$2,929
Retail value of the anhydrous in one 1,450-gallon nurse tank filled to 85%, at the $923/ton retail price for the week of Aug 24–28, 2026. (1,232 gal × 5.15 lb/gal = 6,347 lb = 3.174 short tons × $923/ton. Tonnage calculated by Crop Root Zone; price from DTN/Progressive Farmer retail fertilizer survey.)
Ground Truth: Plan a fall ammonia program in tanks, not acres. "We have 2,000 acres to cover" is a statement nobody can act on. "We need 63 tank fills delivered across an 18-working-day window, which is 3.5 fills per day" is a statement a retailer can be held to and a grower can verify against on a Tuesday afternoon. The conversion is arithmetic and almost nobody does it before the season starts.
2. Widening the bar shortens the interval between stops
What's new: Increasing application capacity — a wider toolbar, a faster ground speed, a bigger tractor — does not increase daily acres once tank supply is the constraint. It increases the rate at which tanks are consumed, which converts capital into more frequent stops.
Evidence: Time to empty a tank at three bar widths, holding rate and speed constant at 200 lb/acre and 5 mph:
| Toolbar width | Acres/hr | Gal/hr | Minutes to empty 1,450-gal tank (85%) |
|---|---|---|---|
| 40 ft | 24.2 | 941 | 79 |
| 47 ft | 28.5 | 1,105 | 67 |
| 55 ft | 33.3 | 1,293 | 57 |
| 60 ft | 36.4 | 1,410 | 52 |
Acres/hr = width (ft) × speed (mph) × 5,280 ÷ 43,560. Gal/hr = acres/hr × 38.8 gal/acre. Calculated by Crop Root Zone at 100% field efficiency, which no field achieves; real intervals run longer in proportion to turning, point rows and idle time.
Going from a 40-foot bar to a 60-foot bar raises theoretical hourly capacity by 50% and cuts the time between tank changes from 79 minutes to 52. If the retailer can land four tanks a day at the field, the wider bar covers exactly the same acres as the narrow one — it simply spends more of the day parked.
The change-over cost is real and it compounds. A tank swap is not instantaneous: disconnect, bleed the line, move the empty, position the full, reconnect, purge, pressurize. Ten to twenty minutes is a fair working range with a competent operator and no equipment trouble. Nine swaps in a twelve-hour day at fifteen minutes each is 2 hours 15 minutes — 19% of the day — before any consideration of whether a full tank was sitting there waiting.
Ground Truth: If the fall program is running short of window, the capital that fixes it is another nurse tank and another truck to move it, not another foot of toolbar. A second tank staged at the field edge converts a 15-minute swap into a 4-minute swap and removes the road trip from the critical path entirely. At roughly $2,900 of product sitting in each one, the carrying cost of staging an extra tank is trivial against the cost of losing a day of a three-week window.
3. The retailer's side of the same arithmetic
What's new: The same conversion run at the terminal shows why retailer lots empty out during the peak, and why the constraint is frequently the transport fleet rather than storage.
Evidence: Retailer bulk storage for anhydrous is typically held in mid-to-large pressurized tanks at the dealership, which functions as a regional distribution point transferring product into farmer nurse tanks or directly into applicator equipment. Take a 30,000-gallon bulk tank at the 85% limit: 25,500 usable gallons, which is 131,325 pounds, or about 657 acres of coverage at 200 lb/acre.
| Retailer asset | Usable @ 85% | Acres covered @ 200 lb/ac |
|---|---|---|
| 30,000-gal bulk storage tank | 25,500 | 657 |
| 11,000-gal transport trailer | 9,350 | 241 |
| 1,450-gal nurse tank | 1,232 | 32 |
Calculated by Crop Root Zone at 5.15 lb/gal and the 85% fill limit. Asset sizes are representative commercial capacities, not any specific facility's.
A dealership serving 30,000 acres of fall anhydrous needs to move roughly 1.16 million gallons through that plant in three to four weeks. On a 30,000-gallon tank, that is about 46 complete refills of bulk storage — more than two full turns of the entire plant on every one of eighteen working days, delivered by transport trailer at 241 acres apiece.
This is why, during peak, retailer lots stand empty and every working piece of equipment is pressed into service. It is not poor planning. It is the physical consequence of concentrating a season's nitrogen into a window defined by soil temperature.
Ground Truth: The question to ask a retailer in September is not "will you have product." He will have product; the North American ammonia supply is not the issue and anhydrous prices have not moved the way urea has. The question is "how many transport turns can you run per day into my area, and where am I in the sequence." Delivery sequence inside the window is a scheduling decision made at the plant, it is negotiable in September and not in November, and almost no grower asks about it until the second week of the window when it is already fixed.
4. The window is the multiplier on every number above
What's new: All of the throughput arithmetic is bounded by an agronomic gate that does not negotiate: anhydrous should go down when soil temperature at the four-inch depth is below 50°F and trending downward, to slow nitrification and hold the nitrogen in the ammonium form through the winter.
Evidence and the consequence: In the northern Corn Belt that condition typically opens in late October and closes at freeze-up, giving something in the range of three to four calendar weeks — of which rain, wind and equipment downtime will take a meaningful share. Eighteen usable working days inside a four-week window is a reasonable planning assumption, and an optimistic one in a wet fall.
Putting the pieces together for a 2,000-acre program at 200 lb/acre:
| Quantity | Value |
|---|---|
| Total anhydrous required | 400,000 lb (200 tons) |
| Total gallons | 77,670 |
| 1,450-gal nurse tank fills required | 63 |
| Fills per day across 18 working days | 3.5 |
| Retail product value at $923/ton | $184,600 |
| Application hours at 33.3 ac/hr, 100% efficiency | 60 |
| Application hours at 70% field efficiency | 86 |
Calculated by Crop Root Zone. Anhydrous price: DTN/Progressive Farmer retail fertilizer survey, week of Aug 24–28, 2026.
Eighty-six hours of machine time inside eighteen working days is under five hours a day — comfortable. Sixty-three tank fills inside eighteen working days is 3.5 per day, every day, without a miss. The machine is not the problem. The logistics are, and they are the part of the program that is not under the grower's own control.
Ground Truth: The fall ammonia program fails on the days when no tank shows up, and those days are not distributed randomly — they cluster at exactly the moment soil temperatures drop across a whole region at once and every customer of the same plant wants product on the same Tuesday. The hedge against that is not more horsepower. It is a larger on-farm nurse tank fleet, a standing delivery schedule agreed in September, and a written second-best plan for the acres that will not get covered. Decide in advance which 300 acres go to spring UAN if the window closes early, because deciding that in the second week of November means deciding it badly.
5. Where the capital actually belongs
For a grower whose fall program is window-constrained rather than machine-constrained — which, on the arithmetic above, is most of them — the ranking of capital options is close to the reverse of the usual order:
- Additional nurse tanks. Cheapest per hour of window recovered. Two staged tanks at a field turn a road trip into a hose swap. At $2,900 of product per tank, the inventory carry over a three-week window is negligible.
- A second tank-moving vehicle. Removes the road segment from the critical path entirely and lets tank delivery happen while the applicator is running.
- A second applicator. Doubles the rate at which tanks are consumed. Only helps if tank supply has already been solved, and actively hurts if it has not, because it converts a supply shortage into two idle machines instead of one.
- A wider toolbar on the existing applicator. Increases theoretical capacity that the tank schedule will not let you use, and increases the frequency of stops.
The general principle is the ordinary one from any constrained system: capacity added anywhere except the constraint produces no additional output and usually produces additional idle time. In a fall anhydrous program the constraint is almost never the bar. It is the number of times a full tank arrives at the headland.
References
- Dultmeier Sales, "Anhydrous Ammonia: Liquid Withdrawal Nurse Tank Valve Flow Rates," accessed Sep 2026 — https://www.dultmeier.com/liquid-withdrawal-nurse-tank-valve-flow-rates
- DTN/Progressive Farmer, "Fertilizer Prices Fall as UAN28, Urea Lead the Way Lower," Sep 2, 2026 (retail survey week of Aug 24–28, 2026) — https://www.dtnpf.com/agriculture/web/ag/crops/article/2026/09/02/fertilizer-prices-fall-uan28-urea
- Purdue University Extension, "Anhydrous Ammonia," PPP-1401 — https://ag.purdue.edu/department/extension/ppp/resources/ppp-publications/mobile/ppp-1401.html
- Bayer Crop Science US, "Anhydrous Ammonia Fall and Spring Applications," accessed Sep 2026 — https://www.cropscience.bayer.us/articles/channel/anhydrous-ammonia-fall-and-spring-applications
- Verdesian Life Sciences, "Anhydrous Ammonia — Fertilizer Application, Uses, & Tips," accessed Sep 2026 — https://vlsci.com/blog/application-tips-for-efficient-fall-anhydrous/
- Asmark Institute, "Compliance Assistance — Anhydrous Ammonia," accessed Sep 2026 — https://www.asmark.org/compliance-assistance/anhydrous-ammonia.php
- Cactus Tanks, "National Provider For Anhydrous Nurse Tanks," capacity specifications, accessed Sep 2026 — https://www.cactustanks.com/tanks/anhydrous-nurse-tanks/
- Stutsmans, "New Arcosa 1,000 Gallon Anhydrous Ammonia Tanks," accessed Sep 2026 — https://stutsmans.com/product/new-arcosa-1000-gallon-anhydrous-ammonia-tank/
Disclosures
Crop Root Zone is an independent publication. Nothing here is investment advice. Market calls, where included, reflect the editors' own read and are not a recommendation to buy or sell any security.
The Combine Will Be Done Early This Year. The Soil Will Not Be Cold Early. An Early Harvest Lengthens the Wait, Not the Ammonia Season.
Corn ran six points ahead of average on denting and spring wheat nine points ahead on harvest, but the 50°F gate at four inches still arrives in late October or later — and anhydrous is now both the only nitrogen recommended for fall and the only one carrying a real discount. The constraint that binds is nurse tank turns: about one an hour, per machine.
Two things are true about fall 2026 and they pull in opposite directions. The crop is early: corn was 62% dented on August 30 against a five-year average of 56%, and spring wheat harvest stood at 77% complete against a 68% average (DTN/Progressive Farmer, Aug 31, 2026). And anhydrous ammonia is cheap: $923 per ton, $0.56 per pound of nitrogen in the fourth week of August, against $0.71 for urea, $0.72 for UAN32 and $0.76 for UAN28 (DTN/Progressive Farmer, Sep 2, 2026). An early harvest and a discounted fall product together will push more acres at the fall ammonia pass than usual. The window they are pushing at is the same length it always was, because it is set by soil temperature and soil temperature does not care when the combine finished.
1. Field access moves. The agronomic gate does not.
What's new: The 2026 crop's calendar advantage is real but it applies to the wrong constraint.
Evidence: Development as of August 30, against the five-year average:
| Stage | 2026 | 5-yr avg | Ahead by |
|---|---|---|---|
| Corn — dented | 62% | 56% | +6 |
| Corn — dough | 92% | 89% | +3 |
| Spring wheat — harvested | 77% | 68% | +9 |
| Soybeans — dropping leaves | 13% | 9% | +4 |
Source: USDA NASS Crop Progress as of Aug 30, 2026, reported by DTN/Progressive Farmer, Aug 31, 2026. Soybean leaf drop reached 26% against a 20% average by Sep 6, 2026.
Against that, the gate. Extension guidance across the Corn Belt is consistent and has not changed: apply anhydrous — and only anhydrous, which is the sole nitrogen fertilizer recommended for fall application — after soils cool to 50°F at the four-inch depth and are trending cooler, the colder the better (Iowa State University Integrated Crop Management; North Dakota State University Extension; University of Illinois farmdoc). Iowa State's own framing is that the decision point is not the first day the reading touches 50°F but the point at which the trend is for sustained temperatures below it. In most years Iowa soils cool below 50°F in late October and early November, and the date varies from late October to late November.
Ground Truth: The fall ammonia season has two ends and the crop only moves one of them. The back end is set by freeze-up and by soils getting too wet to knife; the front end is set by soil temperature. An early harvest does not open the season earlier — it opens the field earlier, and then the operation waits. So the practical effect of a 2026-style calendar is a longer idle gap between the last combine pass and the first legitimate ammonia pass, and a strong temptation to fill it. That temptation is the actual risk this year, and it is not an agronomic risk that arrives in November; it is a decision that gets made in mid-October when the fields are open, the tanks are available and the soil is 58°F.
2. What going early actually costs
What's new: Nitrification does not switch on at 50°F. It runs at five times the 50°F rate at 60°F.
Evidence: The temperature response of nitrification is well characterised: rates are maximal in the upper 70s°F, fall to about 50% of maximum at 60°F, to about 10% of maximum at 50°F, and to about 5% at 40°F (extension nitrification guidance, Iowa State University ICM and North Dakota State University Extension).
| 4-inch soil temp | Nitrification rate (% of max) | |
|---|---|---|
| Upper 70s°F | 100% | ██████████ |
| 60°F | 50% | █████ |
| 50°F | 10% | █ |
| 40°F | 5% | ░ |
Source: nitrification temperature response per extension guidance summarised above. Bars scaled to the maximum rate.
The arithmetic of that curve is the whole argument. Applying at 60°F rather than 50°F does not cost a little more nitrification — it costs five times the rate, on nitrogen that then sits through whatever winter and spring drainage the season delivers. The nitrate that forms is the fraction exposed to leaching and denitrification; the ammonium that has not yet converted is held on the exchange complex and is not going anywhere.
5×
The nitrification rate at 60°F relative to 50°F. Ten degrees of impatience is not a 20% penalty on the conversion rate; it is a fivefold one. (Calculated from the extension nitrification temperature response: 50% of maximum at 60°F against 10% at 50°F.)
The inhibitor's place in this. Extension guidance recommends an effective nitrification inhibitor to further slow conversion even when the temperature condition is met, and separately recommends avoiding fall application altogether on soils prone to wetness or leaching. Note the order of operations: the inhibitor is an addition to correct timing, not a substitute for it. An inhibitor applied at 60°F is being asked to hold back five times the rate it was tested against.
3. The constraint is nurse tanks, not toolbars
What's new: Working the capacity arithmetic, a single applicator empties a nurse tank about once an hour. The fleet that cycles those tanks, not the machine in the field, sets how many acres get covered in a fit day.
Evidence: Take a 16-row, 40-foot toolbar on 30-inch spacing at 5.5 mph. Theoretical field capacity is 40 ft × 5.5 mph × 5,280 ÷ 43,560 = 26.7 acres per hour; at 75% field efficiency — a reasonable working assumption for a knife rig with headlands and tank changes, and stated here as an assumption rather than a measured figure — that is about 20 acres per hour, or roughly 240 acres in a twelve-hour fit day.
Now the supply side of the same machine:
| Item | Value | Note |
|---|---|---|
| Nurse tank nominal capacity | 1,000 gal | Common size |
| Standard fill limit | 85% | Vapour space for expansion |
| Ammonia carried | 850 gal | |
| Ammonia weight at ~5.15 lb/gal | ~4,378 lb | Liquid NH₃ at 60°F |
| Nitrogen carried at 82% N | ~3,590 lb | |
| Acres covered at 180 lb N/acre | ~20 acres |
Source: calculated from standard industry constants — anhydrous ammonia liquid density of approximately 5.15 lb/gal at 60°F, the 85% maximum fill practice, and 82% nitrogen by weight. The 180 lb N/acre rate is a planning rate, not a recommendation; use your own soil-test and yield-goal rate.
Set those two results beside each other. The machine covers about 20 acres an hour. A tank carries about 20 acres. The applicator empties a nurse tank roughly every hour it runs.
| Capacity element | Rate | What limits it |
|---|---|---|
| Toolbar in the field | ~20 ac/hr | Speed, width, field efficiency |
| Nurse tank endurance | ~1 hr | Tank size × fill limit × rate |
| Tanks needed per machine per 12-hr day | ~12 | Delivery truck cycle time |
Source: calculated as above. Tank count assumes continuous operation and no wait for a tank.
Ground Truth: This is why fall ammonia is a logistics problem wearing an agronomy costume. Twelve nurse tank turns per machine per day, multiplied across a retailer's applicator fleet, is a delivery-truck and bulk-storage problem measured in truck cycles per day against a plant's pump rate — and it has to happen inside a window whose opening date is set by weather and whose closing date is set by weather. A grower who plans a fall ammonia program around field readiness is planning around the one constraint that is not binding. The questions worth asking the retailer in September are how many toolbars are in the fleet, how many nurse tanks per toolbar, and what the plant's daily loadout rate is — because those three numbers, not soil temperature, determine whether you are first or fourteenth in a fifteen-day window.
4. Why 2026 concentrates demand on exactly this operation
What's new: The nitrogen price structure has collapsed the spread between every form except anhydrous — and anhydrous is the only form eligible for the fall pass.
Evidence: In the fourth week of August, urea sat at $0.71 per pound of N, UAN32 at $0.72 and UAN28 at $0.76 — a range of five cents. Anhydrous sat at $0.56, fifteen to twenty cents below all three (DTN/Progressive Farmer, Sep 2, 2026). Over the three months from late May, all four fell 17% to 22%, so the decline was broad; what was not broad is where the discount ended up.
| Nitrogen source | $/lb N (Aug 4th wk) | Premium over anhydrous | Fall application? |
|---|---|---|---|
| Anhydrous | 0.56 | — | Yes — the only one recommended |
| Urea | 0.71 | +$0.15 | No |
| UAN32 | 0.72 | +$0.16 | No |
| UAN28 | 0.76 | +$0.20 | No |
Source: DTN/Progressive Farmer, Sep 2, 2026 (per-pound-of-nitrogen figures as published); fall-application eligibility per extension guidance that anhydrous ammonia is the only nitrogen fertilizer recommended for fall application.
At 180 pounds of N per acre, the anhydrous discount against urea is $27 an acre and against UAN28 is $36 an acre. That is a real number, and it is the number that will pull acres into the fall window this year.
Ground Truth: Three factors are stacking on the same fifteen-to-thirty-day window: an early harvest opening more ground sooner, a fifteen-to-twenty-cent discount available only on the fall-applied product, and a nitrogen market that just fell 20% and has growers newly willing to commit. Every one of them increases demand for fall ammonia and none of them increases the capacity to apply it. The correct response is not to go earlier — that costs five times the nitrification rate and forfeits most of what the discount was worth. It is to get in the queue earlier: book the acres, book the tanks, and take a delivery slot in the first week the soil qualifies rather than the third.
5. What to watch, and in what order
What's new: Four things, and the first two are free to monitor.
Evidence and reasoning:
Your own four-inch soil temperature, not the regional average. Public networks publish four-inch readings under bare soil for Iowa and Illinois sites. Bare-soil readings run warmer than residue-covered ground, and a no-till field with heavy corn residue will qualify days before its neighbouring conventional field. Use the reading closest to the field and the tillage system, and watch the trend rather than the single day.
The retailer's tank-to-toolbar ratio. Ask now, in September, while it is a conversation and not a queue. Twelve tanks per machine per twelve-hour day is the arithmetic above; a retailer running four toolbars needs to cycle roughly fifty tank loads a day to keep them all fed.
Soil moisture, which is the veto no discount overrides. Extension guidance is explicit that fall application should be avoided on soils prone to wetness or leaching, and separately that knifing ammonia into soil that is too wet gives poor sealing and into soil that is too dry gives vapour loss. The moisture condition can disqualify a field that has already met the temperature condition, and it is the failure mode that produces a visibly striped field the following June.
Whether the nitrogen discount survives to spring. China exported about 403,000 tonnes of urea in July 2026 against roughly 7,000 in June, with a large majority of the year's authorised quota still unshipped (Ag Bull Trading, Aug 27, 2026). If that volume moves in the fourth quarter, spring nitrogen gets cheaper still and the fall discount narrows retrospectively. That is a genuine argument for splitting the program rather than committing the whole nitrogen budget to the fall pass.
Ground Truth: The framing that serves a grower best here is that fall ammonia in 2026 is a capacity purchase, not a nitrogen purchase. The nitrogen is cheap and will still be reasonably cheap in April; what is scarce is a knife in the ground on a day when the soil is under 50°F, trending colder, and fit to seal. That scarcity is not priced into the ton of ammonia — it is priced into the calendar, and the growers who capture the fifteen-cent discount will be the ones who treated the application slot as the constrained resource in September rather than the fertilizer.
References
- DTN/Progressive Farmer, "USDA Crop Progress: Corn Rated 57% Good to Excellent; Soybeans 58% Good to Excellent as of Aug. 30" — Aug 31, 2026 (corn denting and dough progress, spring wheat harvest, soybean leaf drop against five-year averages). https://www.dtnpf.com/agriculture/web/ag/news/article/2026/08/31/usda-crop-progress-corn-rated-57-58
- DTN/Progressive Farmer, "Fertilizer Prices Fall as UAN28, Urea Lead the Way Lower" — Sep 2, 2026 (retail anhydrous $923/ton at $0.56/lb N; urea, UAN28 and UAN32 per-pound-of-nitrogen figures, fourth week of August). https://www.dtnpf.com/agriculture/web/ag/crops/article/2026/09/02/fertilizer-prices-fall-uan28-urea
- DTN/Progressive Farmer, "Urea Moves Lower; 6 Fertilizers Continue To Be Slightly Higher" — Jun 10, 2026 (late-May retail nitrogen prices used for the three-month comparison). https://www.dtnpf.com/agriculture/web/ag/crops/article/2026/06/10/urea-moves-lower-6-fertilizers
- Iowa State University Extension, Integrated Crop Management, "Remember 50 degrees" (the 4-inch 50°F condition and the sustained-trend requirement). https://crops.extension.iastate.edu/encyclopedia/remember-50-degrees
- Iowa State University Extension, Integrated Crop Management, "Fall Nitrogen Applications and Soil Temperature" (typical late-October to early-November cooling dates in Iowa and the range to late November). https://crops.extension.iastate.edu/cropnews/2014/10/fall-nitrogen-applications-and-soil-temperature
- Iowa State University Extension, Integrated Crop Management, "Fall Anhydrous Ammonia Applications: What to know about soil moisture" (soil-moisture conditions for sealing and vapour loss). https://crops.extension.iastate.edu/post/fall-anhydrous-ammonia-applications-what-know-about-soil-moisture
- North Dakota State University Extension and Ag Research News, "Farmers should monitor soil temperature when planning fall nitrogen application" — Oct 2024 (nitrification temperature response; anhydrous as the only nitrogen fertilizer recommended for fall). https://www.ag.ndsu.edu/news/newsreleases/2024/october/farmers-should-monitor-soil-temperature-when-planning-fall-nitrogen-application
- University of Illinois, farmdoc, "Soil temperatures and fall ammonia application." https://farmdoc.illinois.edu/field-crop-production/soil-temperatures-and-fall-ammonia-application-2.html
- Purdue University Extension, Pest & Crop Newsletter, "Fall-applied Anhydrous Ammonia Best Practices" (inhibitor use and site selection). https://extension.entm.purdue.edu/newsletters/pestandcrop/article/fall-applied-anhydrous-ammonia-best-practices
- Ag Bull Trading, "China's Urea Return Breaks Fertilizer Squeeze with Massive India Sale" — Aug 27, 2026 (Chinese monthly urea export volumes and remaining 2026 quota). https://www.agbull.com/chinas-urea-return-breaks-fertilizer-squeeze-with-massive-india-sale/
Disclosures
Crop Root Zone is an independent publication. Nothing here is investment advice. Market calls, where included, reflect the editors' own read and are not a recommendation to buy or sell any security.
A Second Nitrogen Pass Costs the Equivalent of 24 Pounds of N Before Any Nitrogen Is Bought
Iowa's 2026 custom rate survey puts anhydrous side-dressing at $13.55 an acre and dry bulk spreading at $8.15. Against anhydrous at $0.56 a pound of N, the machine time alone is the number the split-application argument has to clear.
Every extension recommendation on nitrogen timing ends the same way: split the application, move some of it closer to uptake, cut the exposure. The agronomy is sound and it is not in dispute here. What is almost never priced in the same paragraph is the pass itself — the machine, the operator and the hours that put the second application in the ground.
Iowa State's 2026 Iowa Farm Custom Rate Survey prices it. Anhydrous side-dressing averages $13.55/acre, with a median of $12.00 and a range of $8.00 to $18.00. Anhydrous injection with a tool bar averages $15.55/acre; without a tool bar, $13.45. Dry bulk spreading averages $8.15. All of those are materials not included — they are the cost of moving iron across the field and nothing else (Iowa State University Extension, Ag Decision Maker A3-10, 2026 survey, published March 2026; 205 respondents, 4,698 individual rates).
1. The rates, with their sample sizes attached
Sample size belongs in this table, because two of these operations are thinly answered and a mean drawn from fifteen responses is a different object from one drawn from seventy-nine.
| Operation | Average $/ac | Median | Range | Responses |
|---|---|---|---|---|
| Anhydrous injecting, with tool bar | 15.55 | 15.00 | 7.00–28.00 | 79 |
| Anhydrous side-dressing | 13.55 | 12.00 | 8.00–18.00 | 15 |
| Anhydrous injecting, no tool bar | 13.45 | 13.00 | 8.00–20.00 | 42 |
| Dry fertilizer, bulk applied | 8.15 | 8.00 | 4.00–13.50 | 59 |
Source: Iowa State University Extension, 2026 Iowa Farm Custom Rate Survey (Ag Decision Maker A3-10), published March 2026. Iowa basis. Materials not included. The survey reports what operators and farm managers said they charged or expected to charge; it is a guide, not a rate schedule.
| Operation | $/ac | Bar |
|---|---|---|
| Anhydrous, tool bar | 15.55 | ██████████ |
| Anhydrous, side-dress | 13.55 | █████████ |
| Anhydrous, no tool bar | 13.45 | █████████ |
| Dry bulk spread | 8.15 | █████ |
Two things stand out before any conversion. The side-dress figure rests on fifteen responses and its median ($12.00) sits $1.55 below its mean, which is the signature of a small sample with a high tail. And dry spreading is roughly half the cost of any anhydrous operation — a fact that matters more than it looks, and that section 3 returns to.
2. Converting a pass into pounds of nitrogen
The useful unit here is not dollars per acre. It is pounds of N per acre, because that is the currency in which the split-application decision is actually argued.
Retail nitrogen, on the delivered basis, is currently $0.56/lb.N as anhydrous, $0.71 as urea, $0.72 as UAN32 and $0.76 as UAN28 (DTN/Progressive Farmer, Sep 2, 2026, week of Aug 24–28). Divide the pass cost by the nutrient cost and the pass has a nitrogen price:
| Pass | $/ac | ÷ anhydrous $0.56 | ÷ urea $0.71 | ÷ UAN32 $0.72 | ÷ UAN28 $0.76 |
|---|---|---|---|---|---|
| Anhydrous side-dress | 13.55 | 24.2 lb N | 19.1 lb N | 18.8 lb N | 17.8 lb N |
| Anhydrous, tool bar | 15.55 | 27.8 lb N | 21.9 lb N | 21.6 lb N | 20.5 lb N |
| Dry bulk spread | 8.15 | 14.6 lb N | 11.5 lb N | 11.3 lb N | 10.7 lb N |
Custom rates: Iowa State 2026 survey. Nitrogen prices: DTN retail averages, week of Aug 24–28, 2026, delivered retail. Division is Crop Root Zone arithmetic and assumes the grower is buying the pass, not supplying the machine.
24 pounds of N
What a $13.55/acre anhydrous side-dress pass costs, expressed in the anhydrous it could have bought instead at $0.56/lb.N. (Iowa State 2026 custom rate survey; DTN retail averages, week of Aug 24–28, 2026)
That is the number the split has to clear. A split application that reduces loss by fifteen pounds of N per acre has not paid for a $13.55 pass at anhydrous prices — it has paid for about 60% of it. It may still be the right call for reasons that have nothing to do with the nutrient budget: risk of a wet spring, a stand-establishment concern, a landlord's requirement, a nutrient-management plan. But it is not free, and the point at which it turns positive is higher than most break-even conversations start.
Ground Truth: The split-N debate is usually conducted in agronomy and settled in logistics. At current relative prices, the second pass is worth 18 to 24 pounds of nitrogen depending on the product — and notably, the pass is most expensive in N-equivalent terms exactly when nitrogen is cheapest. Anhydrous at $0.56/lb makes the machine look dear; UAN28 at $0.76 makes the same machine look 6 pounds cheaper. A grower comparing programs must convert the pass at the product's own price, not at a single blended nitrogen cost, or the comparison is rigged before it starts.
3. The dispersion is larger than the argument
Look again at the ranges rather than the averages. Anhydrous side-dressing runs $8.00 to $18.00 in the same survey, in the same state, in the same year. Injection with a tool bar runs $7.00 to $28.00.
Convert the side-dress range at anhydrous prices: the low quote is 14.3 lb N of cost, the high quote is 32.1 lb N. The spread between what two Iowa growers are quoted for the identical operation is about 18 pounds of nitrogen per acre — which is the same order of magnitude as the entire loss reduction a split is usually credited with delivering.
That is an uncomfortable finding and it is the most actionable one here. It means that for a grower at the top of the quoted range, shopping the pass is worth more than winning the agronomic argument about whether to make it. The dispersion is real work sitting on the table, and unlike a weather outcome it is entirely under the grower's control.
Three caveats, stated rather than buried. The range includes genuine differences in field size, shape, travel distance and whether the operator is supplying a tool bar. The side-dress mean rests on fifteen responses. And these are Iowa figures — a grower outside that geography should treat the structure of this analysis as portable and the levels as indicative until checked against a local survey.
4. Where the cheap pass changes the answer
The dry-spreading number is the one to build a fall plan around. At $8.15/acre it is roughly half an anhydrous pass, and it is a pass most operations are already making for P and K.
That has a specific consequence: anything that can ride along on a dry blend is close to free at the margin. A micronutrient that would cost $13.55 to apply on its own costs the price of the material if it goes out with the fall P&K. The application decision and the product decision, which are usually made together, should be separated — the question is not "is this product worth applying" but "is this product worth applying on a pass I am already paying for," and those two questions have different answers.
The same logic runs against splitting. A fall anhydrous program that is already committed to one pass adds a second one at full price, not marginal price, because there is nothing to ride along with.
| Decision | Marginal application cost | Read |
|---|---|---|
| Add a nutrient to an existing dry fall pass | ≈ $0 | Material cost governs |
| Add a standalone dry pass | $8.15/ac | 15 lb N-equivalent |
| Add a second N pass (side-dress) | $13.55/ac | 24 lb N-equivalent |
| Add a standalone anhydrous pass, tool bar | $15.55/ac | 28 lb N-equivalent |
Source: Iowa State 2026 custom rate survey; N-equivalents at anhydrous $0.56/lb.N, DTN week of Aug 24–28, 2026. Marginal cost of a ride-along is Crop Root Zone's characterisation, not a surveyed figure — a blender may charge for the additional handling.
Ground Truth: The custom rate survey is published as a budgeting document and it is really a pricing document for optionality. Every agronomic recommendation that begins "consider applying later" or "consider a second application" is quoting a price of $13 to $16 an acre without saying so. Growers should start asking for that number at the same time they ask for the agronomy — and should notice that the single cheapest way to act on almost any input recommendation this autumn is to put it on a pass that is already going to happen.
5. What the survey does not price, and why it matters
Three limits on this analysis, stated rather than buried, because each one changes the answer for a specific kind of operation.
It prices hiring, not owning. Every figure here is a custom rate — what one party charges another. An operation running its own applicator faces a different cost structure: fuel, labour, repairs and depreciation on iron it already owns. For that grower the marginal cost of a second pass is well below $13.55, and the conversion in section 2 overstates the barrier. The relevant comparison there is marginal operating cost against the value of the timing, and the custom rate is the ceiling on it, not the number.
The survey is nonetheless the right anchor for the owner-operator too, for an unobvious reason: it is the price at which they could sell the capacity instead of using it. An operation with spare application capacity in a compressed fall window is choosing between running its own second pass and charging a neighbour $13.55 an acre for the same hours. That opportunity cost is real and is almost never entered on the budget.
It does not price the window. A custom rate is a price per acre, not a price per acre on the right day. The value of a fall application is concentrated in a soil-temperature window that may be short, and an operator with more acres booked than the window holds will serve them in some order. Being late in that queue is a cost the survey cannot show, and it is the reason the cheapest quote is not always the cheapest outcome.
It is a survey of intentions and recollections. Iowa State collects what respondents charged or expected to charge; it is published as planning guidance, not as a market assessment. With 205 respondents across 4,698 rates, the well-answered operations are robust and the thin ones — side-dressing at fifteen responses — are indicative.
| Limitation | Who it affects | Direction of the error |
|---|---|---|
| Prices hiring, not owning | Owner-operators | Overstates the cost of a second pass |
| Ignores queue position in the window | Anyone hiring in a short fall | Understates the cost of the cheapest quote |
| Survey, not assessment | All users | Widens the uncertainty, no consistent direction |
| Iowa basis | Growers outside Iowa | Unknown; structure portable, levels are not |
Source: Crop Root Zone assessment of the 2026 Iowa Farm Custom Rate Survey's stated methodology.
None of these overturn the central conversion. A pass costs real money, that money is best expressed in pounds of nitrogen, and at current prices it is 18 to 24 of them. What the limits do is tell a grower which version of the question they are actually answering — and the owner-operator asking "should I make a second pass" is answering a different one from the grower asking "should I buy a second pass," even though the agronomic advice they receive will be identical.
References
[1] Iowa State University Extension and Outreach, 2026 Iowa Farm Custom Rate Survey, Ag Decision Maker File A3-10 — published March 2026; 205 respondents, 4,698 rates. https://www.extension.iastate.edu/agdm/crops/pdf/a3-10.pdf
[2] Iowa State University Extension, "2026 Iowa Farm Custom Rate Survey Offers Planning Guidance for Iowa Producers" — Mar 2026. https://www.extension.iastate.edu/news/2026-iowa-farm-custom-rate-survey-offers-planning-guidance-iowa-producers
[3] DTN/Progressive Farmer, "Fertilizer Prices Fall as UAN28, Urea Lead the Way Lower" — Sep 2, 2026 (retail averages and price per pound of nitrogen, week of Aug 24–28, 2026). https://www.dtnpf.com/agriculture/web/ag/crops/article/2026/09/02/fertilizer-prices-fall-uan28-urea
[4] Agweek, "Farm custom rates expected to increase for 2026" — context on survey methodology and year-over-year direction. https://www.agweek.com/opinion/farm-custom-rates-expected-to-increase-for-2026
Disclosures
Crop Root Zone is an independent publication. Nothing here is investment advice. Market calls, where included, reflect the editors' own read and are not a recommendation to buy or sell any security.
The Two-Pass Boron Program Beats the One-Pass Program. Almost All of the Difference Is the Cost of the Second Trip.
Multi-year trial work puts foliar boron at R1 and R3 ahead of a single application — but the yield response and the pass count are confounded, and on a field already scheduled for an R3 fungicide the honest question is what the R1 trip is worth on its own.
Soybeans across most of the Corn Belt are at R6 or past it this week, which puts both of the timings in this piece behind us for 2026. That is the correct time to look at the question, because a foliar micronutrient program is a program decision — it goes into the 2027 budget in the next two months, alongside seed and the fungicide plan, and it is decided long before anyone can see whether this particular field needs it.
The finding worth budgeting against is this: multi-year Practical Farm Research work evaluating a 10% boron product at one pint per acre per application found that splitting it across R1 (beginning bloom) and R3 (beginning pod) returned significantly better than applying it once. Broader trial work across a range of foliar nutrition products applied at R1–R3 or V3–V4 showed yield advantages in a 1 to 5 bushel per acre range. Boron is the nutrient most consistently named as the one to include when a reproductive-stage foliar application is being made at all.
That is a real result. It is also a result that compares two passes against one pass, which means the trial priced the nutrient and the trip as a single unit. Separating them is where the economics actually live.
1. What the trial found, and what it measured
What's new: The two-timing structure — R1 and R3 rather than a single reproductive application — is the specific recommendation, and it has three years of replicated work behind it.
Evidence: The program evaluated a 10% boron product at a rate of one pint per acre per pass. Both timings are reproductive: R1 is beginning bloom, the point at which the plant starts setting flowers; R3 is beginning pod, when pods at one of the four uppermost nodes reach 3/16 inch. The agronomic rationale given is that boron supports pollination and pod fill and improves nodulation effectiveness, all of which are reproductive-phase functions — which is why the V3–V4 vegetative timing in the same body of work is the weaker of the two windows for this particular nutrient.
Converting the rate to an actual nutrient load: at a typical liquid micronutrient density of roughly 10.5 pounds per gallon, one pint of a 10% boron product delivers about 0.13 pounds of actual boron per acre. Two passes put approximately 0.26 lb B/acre on the crop. (The density figure is an assumption used to convert a volume rate to a nutrient rate; check the specific product's label, because formulation densities vary and the conversion moves with them.)
That load sits inside the conventional foliar range and well below typical soil-applied rates. It is worth knowing the number rather than the pint, because the pint is a product measure and the yield response is a nutrient response.
| Boron source | Analysis | Typical use |
|---|---|---|
| Sodium borate (granular) | 14.3–14.5% B | Soil-applied, blended |
| Boric acid | soluble, ~17% B | Foliar or fertigation |
| Potash + boron blend (e.g. 0-0-58 + 0.5% B) | 0.5% B | Soil-applied with K |
| Liquid foliar B concentrate | ~10% B | Reproductive foliar pass |
Source: Mosaic Crop Nutrition, micronutrient reference; University of Minnesota Extension, "Boron for Minnesota soils," accessed Sep 2026.
Ground Truth: The rate that matters is 0.13 lb of actual B per pass, not one pint. Two different 10% products at two different densities deliver measurably different nutrient loads at the same volume rate, and boron is the one micronutrient where that gap is large enough to matter — for reasons covered in section 4.
2. The break-even is about one bushel, and that is the easy part
What's new: At any soybean price in the range the market has traded this year, a two-pass foliar boron program pays for itself on roughly a bushel per acre. The trial range starts at 1 bushel.
Evidence: Published 2026 micronutrient program costs give the outer bounds. A complete micronutrient program — zinc plus boron plus manganese — for corn on deficient soils runs $25 to $45 per acre. Bundled micronutrient additions to a starter fertilizer system run $8 to $15 per acre. Full micronutrient programs across the suite of nutrients run $15 to $60 per acre depending on what is included (GrainBrief micronutrient fertilizer cost reference, 2026). A single-nutrient boron foliar program sits at the low end of that: the product cost per pass is a small fraction of a full micro package, and the meaningful cost is the application.
Break-even in bushels per acre, at a range of program costs and soybean prices:
| Program cost, $/acre | @ $10.00 | @ $11.00 | @ $12.00 | @ $13.00 |
|---|---|---|---|---|
| $8 | 0.80 | 0.73 | 0.67 | 0.62 |
| $12 | 1.20 | 1.09 | 1.00 | 0.92 |
| $16 | 1.60 | 1.45 | 1.33 | 1.23 |
| $22 | 2.20 | 2.00 | 1.83 | 1.69 |
Break-even bushels = program cost ÷ price. Calculated by Crop Root Zone; program cost ranges informed by GrainBrief 2026 micronutrient cost reference. Prices shown are a sensitivity range, not a forecast.
Set the trial's 1–5 bushel foliar-nutrition response against that grid and the arithmetic is not close. Even the bottom of the response range clears a $12 program at $12 beans exactly, and anything above 1.2 bushels clears it with margin.
~1 bu/acre
Approximate break-even for a $12/acre two-pass foliar boron program at $12 soybeans. The trial response range for reproductive foliar nutrition starts at 1 bu/acre. (Break-even calculated by Crop Root Zone; response range from multi-year Practical Farm Research foliar nutrition trials.)
The break-even is not where this decision gets made. It is cheap enough that almost any real response pays. The decision gets made on whether the response is real on your field, and on what the second trip actually costs you.
3. The pass count is doing work the nutrient is getting credit for
What's new: The comparison that produced the recommendation was two applications versus one. Every cost and every benefit of the additional trip across the field is inside that comparison.
Evidence and the argument:
Consider two growers with identical fields and identical boron need.
Grower A already has an R3 fungicide pass scheduled. Adding boron to that tank is a product cost and effectively nothing else — no additional equipment hours, no additional aerial booking, no additional compaction, no additional window risk. His marginal cost of boron at R3 is the jug. To adopt the two-pass program he must add a standalone R1 trip: product, plus application, plus a pass across the field at a growth stage where nothing else needs doing.
Grower B has no reproductive pass scheduled at all. For him, both timings are new trips, and the two-pass program is twice the application cost of the one-pass program on top of twice the product.
The trial result — two passes beat one — is true for both growers. The economics are not remotely the same. Grower A is deciding whether a marginal R1 trip is worth it. Grower B is deciding whether a foliar program is worth it at all.
| Scenario | R1 pass | R3 pass | Incremental cost of going two-pass |
|---|---|---|---|
| R3 fungicide already planned | new trip | product only | full R1 application + product |
| No reproductive pass planned | new trip | new trip | one full application + product |
| Both already planned (rare) | product only | product only | product only |
Analysis by Crop Root Zone.
Aerial application in the Corn Belt commonly runs in the high single digits to low teens per acre; ground application over a canopied soybean crop carries its own cost in wheel-track loss as well as the pass itself. Either way, the trip is the larger half of a low-cost foliar program, and the trial's two-versus-one structure does not isolate it.
Ground Truth: Read the recommendation as "boron at R3 is nearly free if you are already going over the field, and the R1 trip is a separate purchase you should price separately." A grower with an R3 fungicide pass on the calendar should almost certainly put boron in that tank — the marginal cost is a jug and the trial says the nutrient is the right one. Whether he should add a dedicated R1 trip is a different question with a different answer on different farms, and the published result does not answer it because it never separated the two.
4. Boron has the narrowest safe range of any micronutrient, and soybeans are not the tolerant crop
What's new: Of all the micronutrients, boron has the smallest gap between the rate that corrects a deficiency and the rate that causes injury. This is the reason foliar boron programs are built around fractions of a pound per acre rather than the several-pound rates common for zinc or manganese.
Evidence: Boron is the second most widespread micronutrient deficiency worldwide, behind zinc — which is why it is the first nutrient named for a reproductive foliar pass. But it is also the micronutrient extension services most consistently hedge on. University of Minnesota Extension's guidance on boron notes that response is confined to specific soil conditions rather than being general, and the classic risk profile is sandy, low-organic-matter, high-pH ground where boron leaches readily, with the offsetting hazard that the corrective rate and the toxic rate are close together.
The practical rules that follow are narrow and worth stating plainly:
- Do not band or in-furrow boron with soybean seed. Germinating soybeans are sensitive to boron salt injury at rates that would be unremarkable broadcast.
- Do not stack sources. A grower applying a potash-plus-boron blend in the fall and then running two foliar boron passes in-season is adding two programs that were each designed to be the whole program.
- Foliar rates are per-pass, not per-season, in most label language. Read the seasonal maximum, not just the single-application rate.
- Soil test and tissue test do different jobs here. A soil test tells you about supply on a soil where boron is mobile and the number moves with leaching; a tissue test at R1 tells you what the plant actually has at the stage that matters. For a nutrient with this safety margin, the tissue test is the one that should authorize a second season of the program.
Ground Truth: Boron is the micronutrient where "if a little helps, more must help" is actively wrong, and where a grower running multiple products from multiple suppliers can stack himself into injury without any single product being misapplied. Before adopting a two-pass foliar program, total the boron already arriving from every other source on that acre — dry blend, starter, and any bundled micro package. That addition is the safety check, and almost nobody does it.
5. What to put in the 2027 budget
The defensible 2027 position, given what the trial work supports and what it does not:
Adopt without much hesitation: boron in the tank of a reproductive pass you were already making. The product cost is small, the trial support is direct, and the marginal application cost is zero. This is the highest-confidence item in the whole foliar micronutrient category.
Adopt on tested acres only: a dedicated R1 trip. The two-pass advantage is documented, but the published comparison bundles the nutrient with the trip, so the incremental value of the trip itself has not been isolated in the data available. On fields with a history of boron-responsive soil type — sandy, low organic matter, higher pH — the prior is favorable. On heavy, high-organic-matter ground with no deficiency history, it is not, and the $8–15 per acre is better spent elsewhere.
Test rather than adopt: run it as a split-field comparison on your own ground for one season before it becomes a whole-farm program line. A 1–5 bushel response range is wide enough that the difference between the bottom and the top of it is the difference between a marginal program and a good one, and only your own field answers where in that range you sit.
Do not stack: confirm total boron per acre across every source before adding any of it.
References
- AgWeb, "The Overlooked Micronutrient Delivering $20 Per Acre In Soybeans," 2026 — https://www.agweb.com/news/crops/soybeans/overlooked-micronutrient-delivering-20-acre-soybeans
- AgriNews, "Get more out of soybean post-applications," Jun 16, 2026 — https://www.agrinews-pubs.com/news/science/2026/06/16/get-more-out-of-soybean-post-applications/
- AgriNews, "Success strategies from Beck's Hybrids Practical Farm Research," Jan 6, 2026 — https://www.agrinews-pubs.com/news/science/2026/01/06/success-strategies-from-becks-hybrids-practical-farm-research/
- University of Minnesota Extension, "Boron for Minnesota soils," accessed Sep 2026 — https://extension.umn.edu/agriculture/crop-production/nutrient-management-for-minnesota-crops/boron-for-minnesota-soils
- Mosaic Crop Nutrition, "Micronutrients," nutrient management reference, accessed Sep 2026 — https://www.cropnutrition.com/nutrient-management/micronutrients/
- GrainBrief, "Micronutrient Fertilizer Cost — 2026 Rates," 2026 — https://grainbrief.com/prices/micronutrient-fertilizer-cost
- Farm Progress, "Boron deficiency impacts corn, soybean yields," accessed Sep 2026 — https://www.farmprogress.com/crops/boron-deficiency-the-hidden-yield-robber-in-corn-and-soybeans
- Mallarino, A., "Micronutrients Fertilization for Corn and Soybean," Iowa State University Agronomy Extension — https://www.agronext.iastate.edu/soilfertility/info/Mallarino%20Micros%20article_NCSFC%202015_31-44-57.pdf
Disclosures
Crop Root Zone is an independent publication. Nothing here is investment advice. Market calls, where included, reflect the editors' own read and are not a recommendation to buy or sell any security.
The Same 33 Pounds of Displaced Nitrogen Is Worth $18.48 to an Anhydrous Grower and $25.08 to a UAN Grower
A microbial nitrogen product sold on how much synthetic N it replaces is a product whose value is indexed to the nitrogen price — which is why the 2026 lineup was repriced roughly 30% lower, and why the grower most likely to buy it is the one it is worth least to.
A microbial nitrogen product is sold on two claims: it replaces some quantity of synthetic nitrogen, and it adds some quantity of yield. The reported field performance behind the current generation puts numbers on both. Across 134 field trials with 129 growers nationwide, corn producers using the PROVEN G3 product replaced an average of 33 pounds of traditional nitrogen per acre and gained a 2.1 bushel per acre yield advantage relative to their own standard practice, with overall win rates above 90% (Pivot Bio 2025 field performance data, released 2026).
Half of that value proposition is denominated in nitrogen. And nitrogen just repriced.
At the retail book entering September 2026, anhydrous ammonia carried the cheapest nitrogen on the sheet at $0.56 per pound of N, while UAN28 carried the most expensive at $0.76 (DTN/Progressive Farmer retail survey, week of Aug 24–28, 2026). The identical 33 pounds of displacement is therefore worth $18.48 per acre on one farm and $25.08 on another, for reasons that have nothing to do with the biology and everything to do with which tank the grower was going to fill anyway.
1. The displacement value, priced four ways
What's new: The N-replacement half of the value proposition can be priced exactly, because the retail nitrogen book is published weekly and the displacement figure is a published average.
Evidence: Thirty-three pounds of nitrogen per acre, valued at each of the four major retail nitrogen sources:
| Base nitrogen program | $/ton | $/lb N | Value of 33 lb N displaced | |
|---|---|---|---|---|
| Anhydrous ammonia | 923 | 0.56 | $18.48 | ████████ |
| Urea | 655 | 0.71 | $23.43 | ██████████ |
| UAN32 | 458 | 0.72 | $23.76 | ██████████ |
| UAN28 | 428 | 0.76 | $25.08 | ███████████ |
Nitrogen prices: DTN/Progressive Farmer retail fertilizer survey, week of Aug 24–28, 2026. Displacement value calculated by Crop Root Zone as 33 lb × $/lb N.
$6.60/acre
The spread in displacement value between an anhydrous-based and a UAN28-based program, for the identical 33 pounds of nitrogen and the identical product. (Calculated by Crop Root Zone from DTN retail prices, week of Aug 24–28, 2026.)
The inversion is the point. Anhydrous is the nitrogen form most associated with high-management, high-nitrogen-rate corn — corn-on-corn, fall or spring applied, the program a grower runs when he is serious about nitrogen. It is also the cheapest per pound, by a wide margin, and has been all year. So the grower whose operation looks most like the target customer for a nitrogen-displacement product is the grower for whom each displaced pound is worth the least.
Ground Truth: Every marketing figure for a nitrogen-displacement product should be read with the question "at what nitrogen price?" attached. A $25/acre displacement value quoted off UAN economics does not survive translation to an anhydrous farm — it falls to $18.48, a 26% haircut, with no change in the product, the rate, or the biology. That is not a criticism of the product. It is a statement about what the product is: a hedge whose payout is denominated in a commodity the buyer already has a position in.
2. The yield half is denominated in corn, not nitrogen
What's new: The 2.1 bushel per acre advantage is the part of the value that does not move with the fertilizer market, and it is the more durable half of the case.
Evidence: At a range of corn prices, the yield component and the total:
| Corn price | Yield value (2.1 bu) | + anhydrous displacement | + UAN28 displacement |
|---|---|---|---|
| $4.00 | $8.40 | $26.88 | $33.48 |
| $4.50 | $9.45 | $27.93 | $34.53 |
| $5.00 | $10.50 | $28.98 | $35.58 |
| $5.50 | $11.55 | $30.03 | $36.63 |
Yield response: 2.1 bu/acre average across 134 trials, Pivot Bio 2025 field performance data. Nitrogen values as above. Totals calculated by Crop Root Zone. Corn prices are a sensitivity range, not a forecast.
Two things follow.
First, the total gross value is meaningfully above zero across the whole grid — from $26.88 per acre at the pessimistic corner to $36.63 at the optimistic one. Against a product priced in the mid-teens to low twenties per acre, that is a program with real headroom, which is what a >90% win rate would imply.
Second, the composition of that value shifts. At $4 corn and anhydrous nitrogen, 69% of the gross value is nitrogen displacement. At $5.50 corn and anhydrous, it is 62%. Across every cell in the grid, the majority of the value is the nitrogen, not the bushels. A product whose majority value line is indexed to a commodity that just fell 58% in the international tender market is a product with commodity exposure its buyer should name out loud.
Ground Truth: The yield response is the part of this that a grower should underwrite, because it does not depend on anyone's view of the nitrogen market. If the 2.1 bushels are real on your acres, the product clears its price on yield plus a partial N credit at almost any nitrogen price. If they are not, you are buying a nitrogen hedge at a fixed premium, and there are cheaper ways to hedge nitrogen.
3. The seller repriced, and the repricing is informative
What's new: The product lineup was repriced roughly 30% lower for the 2026 growing season, alongside an announced production increase (Farm Progress, 2026; Businesswire, Mar 4, 2026).
Evidence and the read: A 30% price reduction on a product line is normally read as competitive pressure or as a volume play. In this category it should also be read as an index adjustment. A product whose dominant value line is "pounds of synthetic N you did not have to buy" has a gross value that falls mechanically when the price of synthetic N falls. Holding the product price flat through a nitrogen decline would compress the grower's margin on the purchase without any change in performance. Cutting price roughly in proportion restores it.
That is the correct commercial response, and it is worth noting that it happened, because it is evidence about how the seller understands its own value proposition. A company that believed it was selling yield would have less reason to reprice into a nitrogen decline.
The corollary is uncomfortable and should be stated: the same logic runs the other way. If nitrogen reprices higher — if the Chinese export allowance closes, if a supply disruption returns the risk premium that was in the April tender at $935 per tonne — then the displacement value rises, and a product priced off the 2026 nitrogen market becomes a better deal without changing at all. A grower buying a multi-year program is buying that optionality too.
| Nitrogen price scenario | Value of 33 lb N, anhydrous basis |
|---|---|
| $0.40/lb N (deep decline) | $13.20 |
| $0.56/lb N (Sep 2026 actual) | $18.48 |
| $0.75/lb N (moderate rally) | $24.75 |
| $1.00/lb N (2022-type spike) | $33.00 |
Scenario analysis by Crop Root Zone. $0.56/lb N is the actual retail anhydrous figure for the week of Aug 24–28, 2026 (DTN/Progressive Farmer); the other rows are illustrative and are not forecasts.
Ground Truth: This is a nitrogen-price-linked instrument that happens to be delivered as biology. Price it that way. A grower who is bearish nitrogen into 2027 should buy less of it and buy it later; a grower who thinks the Chinese export window closes in Q4 should regard the current price as the cheap end of a range. Either position is coherent. What is not coherent is evaluating the purchase without a nitrogen view, because the majority of the value is a nitrogen view whether the buyer forms one or not.
4. What the displacement number is and is not
What's new: "Replaced an average of 33 pounds" is a statement about what growers chose to do, not a statement from a nitrogen rate-response curve.
Evidence and the distinction: The trial structure compares the product against the grower's own standard practice across 134 sites. In that design, the 33-pound figure describes the reduction growers made to their synthetic program while using the product. It is a real, large-sample, on-farm number and it is the right number for estimating what adoption looks like in practice. It is not the same thing as a controlled nitrogen-rate study establishing that 33 pounds is the agronomically equivalent substitution, holding everything else constant.
Both facts are worth holding at once:
- In favor: on-farm, grower-standard comparisons at 134 sites with >90% win rates are a stronger real-world signal than a small-plot trial, precisely because they include the messiness of actual management. Independent university work — including a University of Illinois evaluation of the PROVEN products and a peer-reviewed study validating gene-edited microbial nitrogen delivery — exists and should be read alongside the company's own data rather than instead of it.
- Against: a grower-choice figure is subject to the grower's own confidence, and adoption-year N cuts tend to be conservative. The number could understate or overstate the agronomic substitution rate, and the trial design does not resolve which.
The cotton analogue reported in the same data set makes the structure visible: growers replacing up to 20% of synthetic nitrogen with CERT-N recorded average lint yield increases above 50 pounds per acre, quoted as returns exceeding $30 per acre. Note that the return figure there is again a blend of a displacement credit and a yield credit, priced at that crop's input and output markets.
Ground Truth: The right on-farm test is not whether the product works — the trial base is large enough that it plainly does something on most acres. The right test is how far you are willing to cut synthetic N while running it. That single decision determines whether you capture $18.48 of displacement value or $0, and it is the one variable entirely under the grower's control. Run it as a strip with a deliberately reduced N rate and a full-rate check, not as a blanket addition on top of an unchanged nitrogen program — which is the way most first-year adoption actually happens, and the way that guarantees you pay for the product and capture none of its main value.
5. The 2027 decision, stated plainly
Buy it if: your base nitrogen is urea or UAN, where displacement is worth $23–25 per acre rather than $18; you are prepared to actually reduce your synthetic rate rather than layer the product on top; and you will run a check strip to measure the response on your own ground.
Be more cautious if: your base nitrogen is anhydrous. The cheapest nitrogen on the retail sheet is the hardest to displace profitably, and $18.48 of displacement plus $10.50 of yield at $5 corn is a thinner margin over the product price than the headline economics suggest.
Do not buy it as a yield additive on an unchanged nitrogen program. That converts a $28–36 per acre gross value into a $9–12 per acre gross value by discarding the majority component, and it is the most common way this category disappoints a first-year buyer.
Watch the nitrogen market, not the product. The single largest determinant of whether this purchase looks good in November 2027 is the price of anhydrous, and nothing about the microbes will tell you anything about it.
References
- Pivot Bio, "Pivot Bio Releases 2025 Field Performance Data Demonstrating Consistent Yield Gains and Synthetic Nitrogen Displacement While Lowering Fertilizer Costs," 2026 — https://www.pivotbio.com/press-releases/pivot-bio-releases-2025-field-performance-data-demonstrating-consistent-yield-gains-and-synthetic-nitrogen-displacement-while-lowering-fertilizer-costs
- Farm Progress, "Pivot Bio rolls out new products, slashes prices by 30% for 2026 growing season lineup," 2026 — https://www.farmprogress.com/corn/pivot-bio-rolls-out-new-products-slashes-prices-by-30-for-2026-growing-season-lineup
- Businesswire, "Pivot Bio to Increase Production and Lower Price to Meet Historic Nitrogen Demand," Mar 4, 2026 — https://www.businesswire.com/news/home/20260304661652/en/Pivot-Bio-to-Increase-Production-and-Lower-Price-to-Meet-Historic-Nitrogen-Demand
- DTN/Progressive Farmer, "Fertilizer Prices Fall as UAN28, Urea Lead the Way Lower," Sep 2, 2026 (retail survey week of Aug 24–28, 2026) — https://www.dtnpf.com/agriculture/web/ag/crops/article/2026/09/02/fertilizer-prices-fall-uan28-urea
- Michigan Farm News, "Univ. of Illinois releases research results of Pivot Bio's PROVEN, PROVEN 40" — https://www.michiganfarmnews.com/univ-of-illinois-releases-research-results-of-pivot-bio-s-proven-proven-40
- Pivot Bio, "Peer-Reviewed Study Validates Pivot Bio's Gene-Edited Microbes as a Third Source of Nitrogen Delivery" — https://www.pivotbio.com/press-releases/peer-reviewed-study-validates-pivot-bios-gene-edited-microbes-as-a-third-source-of-nitrogen-delivery
- AgFunderNews, "Can microbes supply half a crop's nitrogen? Pivot Bio thinks so" — https://agfundernews.com/can-microbes-supply-half-a-crops-nitrogen-pivot-bio-thinks-so
- Fertilizer Daily, "China to ship 1.2 million tonnes of urea to India as prices plunge 58% from April's $935 peak," Sep 7, 2026 — https://www.fertilizerdaily.com/20260907-china-urea-india-tender-1-2-million-tonnes-2026/
Disclosures
Crop Root Zone is an independent publication. Nothing here is investment advice. Market calls, where included, reflect the editors' own read and are not a recommendation to buy or sell any security.
Polyhalite Carries Four Nutrients and Is Rated on One. That Tells You What It Actually Is.
The published best-management guidance says to set the rate by sulfur requirement, which makes a 14% K2O product a sulfur product with potassium attached — and puts its US break-even at roughly $423 a ton delivered before any magnesium or calcium credit.
This desk has now looked at three sulfur products in eight days, and each one has turned out to be a story about basis rather than about sulfur. Elemental versus sulfate came down to how much of the season's requirement had to be plant-available early (TRZ-0154). Gypsum turned out to be the one sulfur source not priced off the Tampa molten contract (TRZ-0168). Polyhalite is the third, and it is the most interesting of them, because the product carries four nutrients and the published guidance says to rate it on exactly one.
1. What is in the granule
Polyhalite is a naturally occurring evaporite mineral, K₂Ca₂Mg(SO₄)₄·2H₂O, mined and granulated rather than manufactured. It is sold commercially as Polysulphate by ICL, which mines it at Boulby in North Yorkshire, and is the same mineral Anglo American intends to produce as POLY4 from its Woodsmith project.
The published analysis is 14% K₂O, 19% S, 6% MgO and 17% CaO, low in chloride with a low salt index (POLY4 product literature).
At the two ends of the recommended rate band, that delivers:
| Nutrient | % of product | @ 100 lb/ac | @ 200 lb/ac |
|---|---|---|---|
| K₂O | 14% | 14 lb | 28 lb |
| Sulfur (S) | 19% | 19 lb | 38 lb |
| CaO | 17% | 17 lb | 34 lb |
| MgO | 6% | 6 lb | 12 lb |
Source: POLY4 published product analysis. Rate band from Foster & Haegele, "Polyhalite best management practices," Crops & Soils Magazine vol. 59 no. 4, April 2026. Per-acre figures are arithmetic.
Two features matter commercially rather than agronomically. It is low-chloride, which is the whole argument for it on chloride-sensitive crops where muriate of potash is a compromise. And the sulfur is already in the sulfate form, so it does not need to oxidise in the soil before a crop can use it — the distinction this desk priced at roughly $0.81/lb of plant-available S last week (TRZ-0154).
2. The rate recommendation gives the game away
The published best-management guidance recommends 100–200 lb/acre, and it is explicit that the rate should be set by the sulfur requirement rather than by the individual nutrient needs (Foster & Haegele, April 2026). The blending guidance follows from that: at soil-test K above 100 ppm, apply 100–150 lb/ac of polyhalite; below 100 ppm, pair 100 lb/ac with 50–75% of the recommended MOP rate.
Read that carefully. A product is not a potassium source if the recommendation is to keep buying potassium alongside it. At 200 lb/acre the granule delivers 28 lb of K₂O — a fraction of a Corn Belt maintenance rate — while delivering 38 lb of sulfate sulfur, which is a full-season requirement for most row crops. The guidance is internally consistent and it describes a sulfur product that happens to carry useful quantities of three other things.
The same source reports trial work in which polyhalite delivered equivalent yields at up to 65% less applied K₂O in specific systems. That is a real and interesting result and it should be read narrowly: it is a statement about potassium use efficiency in particular soils, not a general claim that a grower can cut the K rate by two-thirds.
Ground Truth: The most thorough agronomic guidance published on this mineral this year was written by two scientists at ICL Growing Solutions — the company that mines the only commercial supply. That does not make the work wrong, and nothing in it is obviously overstated; the rate advice is conservative and the blending guidance actively tells growers to keep buying a competitor's product. But it is the entire evidence base a buyer is likely to encounter, and a category whose best documentation is vendor-authored is a category where independent replication is the missing input, not more marketing. Ask for university trial data from your own soil type before you rate this on anything but sulfur.
3. The break-even, and the number this desk cannot supply
The useful question is not "is polyhalite good." It is "at what delivered price does it beat buying the same nutrients separately." That can be computed from the nutrient side even without a quoted product price.
Value the two nutrients that carry the load, using prices this publication can stand behind:
| Nutrient delivered @ 200 lb/ac | Quantity | Unit value used | Value |
|---|---|---|---|
| Sulfate sulfur | 38 lb S | $0.81/lb S | $30.78 |
| Potassium | 28 lb K₂O | $0.411/lb K₂O | $11.51 |
| Subtotal, S + K only | $42.29/ac | ||
| Magnesium (12 lb MgO) | not valued | — | |
| Calcium (34 lb CaO) | not valued | — |
Sulfur unit value is Crop Root Zone's own prior estimate of net plant-available sulfate-S cost (TRZ-0154, Sep 2, 2026). Potassium unit value is derived from retail potash at $493/st at 60% K₂O (DTN/Progressive Farmer, Sep 2, 2026, week of Aug 24–28) — $493 ÷ 2,000 lb ÷ 0.60 = $0.411/lb K₂O. Mg and Ca are deliberately left unvalued; see below.
Divide $42.29 per acre by the 200 lb rate and the delivered break-even is $0.2115/lb, or about $423/st — on sulfur and potassium alone.
$423/st
The delivered price at which 200 lb/acre of polyhalite matches the cost of buying its sulfur and potassium separately. Magnesium, calcium and any saved application pass are upside on top. (Crop Root Zone calculation; inputs and their sources stated above)
Two adjustments push that break-even up, and both are real:
A saved pass is worth $8.15/acre. If polyhalite replaces a separate sulfur application rather than riding along on a blend already going out, Iowa's 2026 custom rate survey prices a standalone dry bulk pass at $8.15/acre (TRZ-0176). Adding that to the nutrient value lifts the break-even to roughly $504/st.
Magnesium and calcium have value that is real but not general. On a soil already adequate in both, they are worth zero. On a low-Mg sand, 12 lb of MgO has a defensible replacement cost. This desk is not going to assign a single number to a nutrient whose value swings between nothing and something entirely on soil test, and doing so is how multi-nutrient products get oversold.
And here is the number this desk does not have: a verified US delivered price for granular polyhalite. Public retail series do not carry it, and the quotes that circulate are distributor-specific and rarely stated on a comparable delivered basis. So this analysis produces a threshold, not a verdict. Take the $423 and $504 figures to a retailer, ask for a delivered quote on the tons you would actually buy, and the arithmetic answers itself.
4. The supply constraint nobody prices
The reason this category is worth understanding now rather than later is that its economics improved for a reason outside its control — the Tampa molten sulfur contract set a record at the Q3 settlement, which repriced every sulfate-bearing product upward — while its supply did not.
Today the commercial supply is one mine: ICL's Boulby operation. Anglo American's Woodsmith project is the second, and it is not close.
| Milestone | Status |
|---|---|
| Woodsmith design capacity | 13 mn t/yr, subject to studies and a final investment decision |
| Capital investment, 2025 | $200 mn |
| Capital investment, 2026 | $0 — reduced to support balance-sheet deleveraging |
| Ramp-up | expected from 2027 |
| Project completion | targeted 2030 |
Source: Anglo American project disclosures and Mining Weekly, "Woodsmith polyhalite project, UK – update," Aug 7, 2026. Mitsubishi Corporation announced participation in the project on Feb 20, 2026.
A zero-capex year in 2026 against a 2030 completion target is not a schedule that responds to a favourable sulfur market. Whatever polyhalite is worth at today's sulfur prices, the tonnage available to act on it is essentially fixed for the rest of this decade.
Ground Truth: This is the inverse of the usual new-input problem. Most emerging materials have supply and lack evidence of value; polyhalite has a defensible value case at record sulfur prices and a supply base that cannot scale until 2030. That has a practical consequence a grower can act on: if the delivered quote clears $423/st, the constraint on using it is allocation, not economics — and allocation is settled by who asks early. It also means nobody should build a fertility program around it that cannot revert to MOP plus a separate sulfur source, because for the next several seasons the product's availability depends on a single mine in North Yorkshire.
5. The one place it is not competing with MOP at all
Everything above treats polyhalite as an alternative route to sulfur and potassium, which is how it is usually sold and how the break-even should be run on most row-crop acres. There is one setting where that framing is wrong, and it is where the product's actual niche lives.
Muriate of potash is potassium chloride. On chloride-sensitive crops — tobacco, some vegetables, certain fruit and tree crops, and soils already carrying a chloride or salinity load — the chloride is not a neutral carrier, it is the constraint. The conventional low-chloride alternative is sulfate of potash, which is a manufactured product and priced accordingly.
Against SOP rather than against MOP, polyhalite's arithmetic is a different problem entirely, and the break-even computed in section 3 understates it, because that calculation valued the potassium at muriate prices. A grower who genuinely cannot use MOP is not choosing between $423/st of polyhalite and a cheaper blend; they are choosing between polyhalite and a specialty potassium source. The low salt index compounds the same point on seedling-sensitive placements.
| Setting | Realistic alternative | Does the section 3 break-even apply? |
|---|---|---|
| Corn / soybean, no chloride issue | MOP + a separate sulfate-S source | Yes — $423/st is the test |
| Chloride-sensitive crop or soil | Sulfate of potash + a S source | No — understates polyhalite's case |
| Low-Mg soil needing S and Mg | MOP + AMS + a Mg source, three products | No — understates it, and adds handling |
Crop Root Zone framing. The chloride sensitivity of specific crops is standard agronomic guidance; the pricing conclusion follows from valuing potassium at MOP versus SOP levels and is not a quoted spread.
This is worth stating because it cuts both ways, and the honest version of the second-order read is the uncomfortable one. Most Corn Belt acres are not chloride-sensitive, which means most Corn Belt acres should run the section 3 test and hold the product to it. The specialty case is real and it is narrow, and a product marketed on its best application being sold into its most generic one is how multi-nutrient minerals have historically disappointed the buyers who tried them on commodity acres.
References
[1] POLY4 / polyhalite published product analysis (14% K₂O, 19% S, 6% MgO, 17% CaO; low chloride, low salt index). https://www.poly4.com/what-is-polyhalite
[2] A.J. Foster and J. Haegele, ICL Growing Solutions, "Polyhalite best management practices," Crops & Soils Magazine, vol. 59 no. 4 — April 2026 (published online Mar 26, 2026). https://www.sciencesocieties.org/publications/crops-soils/2026/april/polyhalite-best-management-practices
[3] Mining Weekly, "Woodsmith polyhalite project, UK – update" — Aug 7, 2026. https://www.miningweekly.com/article/woodsmith-polyhalite-project-uk-update-2026-08-07
[4] Mitsubishi Corporation, "Participation in Anglo American's Woodsmith Fertiliser Resource Project in the UK" — Feb 20, 2026. https://www.mitsubishicorp.com/jp/en/news/release/2026/20260220001.html
[5] DTN/Progressive Farmer, "Fertilizer Prices Fall as UAN28, Urea Lead the Way Lower" — Sep 2, 2026 (retail potash $493/st, week of Aug 24–28, 2026). https://www.dtnpf.com/agriculture/web/ag/crops/article/2026/09/02/fertilizer-prices-fall-uan28-urea
[6] Iowa State University Extension, 2026 Iowa Farm Custom Rate Survey, Ag Decision Maker A3-10 — dry bulk application $8.15/acre. https://www.extension.iastate.edu/agdm/crops/pdf/a3-10.pdf
[7] Crop Root Zone, TRZ-0154 (net sulfate-sulfur cost) and TRZ-0168 (gypsum and the Tampa contract), Sep 2 and Sep 7, 2026.
Disclosures
Crop Root Zone is an independent publication. Nothing here is investment advice. Market calls, where included, reflect the editors' own read and are not a recommendation to buy or sell any security.
A Corrective Zinc Broadcast Has to Return 1.4 Bushels of Corn, Once. The Argument Is About the Soil Test.
Nebraska's guidance calls 0.4–0.8 ppm DTPA 'medium' and lists corn among the crops with a high probability of response — so for corn the ambiguous band is not ambiguous, and fall is when the pass is already being paid for.
Most micronutrient arguments are about whether the product works. Zinc on corn is not one of them. The response is well documented, the soil test that predicts it has been the standard method since 1978, and the material is a commodity salt. The interesting question is arithmetic: what does correcting a zinc deficiency cost per acre, how many bushels does it have to return, and why does anyone with a marginal soil test skip it.
1. Where the line actually is
The University of Nebraska's micronutrient guidance (G1830, Micronutrient Management in Nebraska) gives the interpretation in three bands:
| DTPA zinc soil test | Category | Guidance |
|---|---|---|
| 0.8 ppm or greater | Adequate | No application indicated |
| 0.4 – 0.8 ppm | Medium | Zinc application needed for sensitive crops |
| Less than 0.4 ppm | Low | Application required |
Source: University of Nebraska–Lincoln Extension, G1830, "Micronutrient Management in Nebraska."
The same publication lists the crops with a high probability of response: corn, grain sorghum, forage sorghum and Sudan grass.
Put the two together and the middle row is not the grey zone it looks like. For a grower planting corn, "medium" reads as apply — the qualifier "for sensitive crops" is satisfied by the crop most Corn Belt acres are going into. A soil test at 0.6 ppm is not a coin flip; it is an application call under the guidance as written.
That distinction is worth labouring because the thresholds quoted around this decision vary. Different sources put the critical level at 0.5, 0.6, 0.75 or 0.8 ppm depending on crop, extraction and calibration dataset. A grower who has seen three of those numbers and picks the lowest one has quietly converted a documented recommendation into a judgement call.
Ground Truth: The spread in published DTPA critical levels — roughly 0.5 to 0.8 ppm — is not evidence that the science is unsettled. It is evidence that the calibrations were built on different crops and soils. The operative question is not "what is the critical level" but "what is the critical level for this crop on this soil," and for corn the guidance resolves the entire ambiguous band in one direction. A test result between 0.4 and 0.8 ppm ahead of corn is an application, not a discussion.
2. What the correction costs
The rates are the part that gets misquoted most often, because maintenance rates and corrective rates get conflated. G1830's broadcast recommendation is 5 pounds of zinc per acre on non-calcareous soils and 10 pounds per acre on calcareous soils — several times the 1–2 lb "maintenance" figures that circulate in product literature.
Price them. Zinc sulfate monohydrate runs about 35.5% Zn. US zinc sulphate was assessed at $971/MT in Q4 2025 (ChemAnalyst; China $739/MT, Russia $1,035/MT over the same period). That converts to $881/st of product, or $1.24 per pound of contained zinc.
| Soil type | Rate | Product cost/ac | Bar |
|---|---|---|---|
| Non-calcareous | 5 lb Zn/ac | $6.20 | █████ |
| Calcareous | 10 lb Zn/ac | $12.41 | ██████████ |
Zinc unit cost derived from ChemAnalyst US zinc sulphate assessment, Q4 2025, at 35.5% Zn: $971/MT = $881/st ÷ 2,000 lb ÷ 0.355 = $1.24/lb Zn. This is a chemical price series, not a delivered agricultural retail quote — treat it as an indication of level and get a delivered number from your retailer. Rates from UNL G1830. Application cost excluded; see section 3.
Now the bushels. USDA's August WASDE carries a $4.50/bu corn season-average farm price for 2026/27.
| Rate | Cost/ac | Break-even corn @ $4.50 |
|---|---|---|
| 5 lb Zn/ac | $6.20 | 1.38 bu/ac |
| 10 lb Zn/ac | $12.41 | 2.76 bu/ac |
Source: USDA WASDE, Aug 12, 2026 (season-average price); cost basis above. Crop Root Zone arithmetic.
1.4 bushels
The one-time corn yield response that pays for a full corrective zinc broadcast on a non-calcareous soil — before crediting any residual benefit in later years. (UNL G1830 rate; ChemAnalyst Q4 2025 zinc sulphate; USDA August 2026 WASDE corn price)
3. The residual is the part that changes the answer
A one-time break-even of 1.4 bushels would be attractive on its own. G1830 makes it materially better by noting that the practical approach is to raise the zinc level of the soil, "thus assuring an adequate supply for several years." The publication does not put a number of years on it, and neither will this desk — but a multi-year benefit against a single-year cost changes the shape of the decision, not just its size.
Spread the corrective cost over three years, with no assumption about the size of the response:
| Rate | Cost/ac | Annualised over 3 yr | Break-even bu/ac/yr |
|---|---|---|---|
| 5 lb Zn/ac | $6.20 | $2.07 | 0.46 bu |
| 10 lb Zn/ac | $12.41 | $4.14 | 0.92 bu |
Three-year amortisation is an illustrative assumption by Crop Root Zone, chosen because G1830 says "several years" without specifying. It is not a sourced residual estimate.
Under half a bushel a year is below the resolution of most yield monitors. That is the real character of this decision: the cost is small enough that it cannot be measured against, which is precisely why it gets deferred. There is never a year in which skipping it visibly hurts.
4. Why fall, and why this fall in particular
Two arguments for putting a corrective broadcast on this autumn rather than next spring, one agronomic and one this desk priced last week.
The agronomic one: granular zinc sulfate is soil-applied and needs incorporation and time; it is not a rescue treatment. A deficiency caught in-season is corrected with a chelated foliar product at several times the cost per pound of zinc, on a separate pass, under weather pressure, after some of the yield is already gone. This desk made the same point about manganese timing eight days ago (TRZ-0158) and the structure is identical — the expensive version of a micronutrient decision is the emergency version.
The economic one: a fall dry P&K pass is already happening on most acres, and Iowa's 2026 custom rate survey prices a standalone dry bulk application at $8.15/acre (TRZ-0176). A zinc broadcast that rides along on a blend already going out carries essentially no incremental application cost; the same zinc applied on its own carries $8.15 — which is more than the material costs on a non-calcareous soil.
| Route | Material | Application | Total |
|---|---|---|---|
| Zn blended into an existing fall P&K pass | $6.20 | ≈ $0 | $6.20 |
| Zn as a standalone dry pass | $6.20 | $8.15 | $14.35 |
| In-season chelated foliar rescue | higher $/lb Zn | separate pass | not comparable |
Material from the cost basis above (5 lb Zn/ac, non-calcareous); application from Iowa State 2026 custom rate survey. The blended route assumes no additional handling charge — confirm with your blender, some apply one.
Ground Truth: The decision that actually matters this autumn is not zinc. It is the soil test. A grower who does not have a current DTPA zinc number cannot make any of the calls above, and the analysis collapses into guessing. The test is the cheapest line item in this entire piece and it is the one that is routinely a year or three old. Everything else here — a 1.4 bushel break-even, a several-year residual, a near-zero marginal application cost on a pass already committed — only pays for the grower who knows which side of 0.8 ppm the field is on. Pull the samples before the pass is scheduled, not after.
5. Broadcast, band, and the calcareous complication
The rate table in section 2 hides a decision that changes both the cost and the agronomy: broadcast versus band.
G1830 notes that zinc sulfate or zinc oxide is effective applied in a band with nitrogen and/or phosphorus fertilizer. Banding places a smaller quantity of zinc in a concentrated zone near the developing root, which is agronomically efficient — the fraction of applied zinc a young plant can actually reach is far higher in a band than broadcast across the full soil volume.
That efficiency is precisely why banding does not substitute for correction. A band feeds this year's crop; it does not raise the soil's zinc level, so it does not buy the "several years" of adequacy the same publication describes as the practical objective. The two operations answer different questions:
| Route | What it does | Cost profile | What it does not do |
|---|---|---|---|
| Broadcast, 5–10 lb Zn/ac | Raises soil zinc level | One-time, amortises over years | Nothing for a crop already in the ground |
| Band / starter with N or P | Feeds the current crop efficiently | Per-year, lower Zn quantity | Does not correct the soil test |
| Foliar chelate, in-season | Rescue | Highest $/lb Zn, separate pass | Recovers only part of the lost yield |
Source: application routes and effectiveness from UNL G1830; cost characterisation is Crop Root Zone's.
The calcareous soils are where this gets expensive and where it matters most. G1830 doubles the broadcast rate on calcareous soils, from 5 to 10 lb Zn/acre, and the reason is chemistry rather than caution: at high pH, zinc availability falls sharply as it is tied up in forms plants struggle to take up. So the fields most likely to test deficient are the fields that cost twice as much to correct — and they are also the fields on which a marginal soil test is least likely to be a false alarm.
That is an unhelpful combination and it argues for a specific discipline. On a calcareous field, the $12.41/acre corrective rate needs 2.8 bushels once, which is still a low bar; the mistake to avoid is applying the non-calcareous rate on a calcareous soil because it is what the price list quoted. Half the required rate on a high-pH field is not half a correction — it is a cost with a materially reduced chance of moving the soil test at all.
A grower who does not know whether their field is calcareous has the same problem as the grower without a current zinc test: the analysis is unavailable to them. Both facts come off the same soil report.
References
[1] University of Nebraska–Lincoln Extension, G1830, "Micronutrient Management in Nebraska" — DTPA zinc interpretation bands, broadcast rates, responsive crops, residual guidance. https://extensionpubs.unl.edu/publication/g1830/na/html/view
[2] W.L. Lindsay and W.A. Norvell, "Development of a DTPA Soil Test for Zinc, Iron, Manganese, and Copper," Soil Science Society of America Journal 42:421 — 1978. The method underlying every threshold quoted here. https://acsess.onlinelibrary.wiley.com/doi/pdfdirect/10.2136/sssaj1978.03615995004200030009x
[3] University of Minnesota Extension, "Zinc for crop production" — corroborating Corn Belt guidance on zinc-responsive crops and soil test interpretation. https://extension.umn.edu/micro-and-secondary-macronutrients/zinc-crop-production
[4] ChemAnalyst, zinc sulphate pricing series — Q4 2025 assessments (USA $971/MT, China $739/MT, Russia $1,035/MT). Chemical price series, not an agricultural delivered retail quote. https://www.chemanalyst.com/Pricing-data/zinc-sulphate-1469
[5] USDA, World Agricultural Supply and Demand Estimates — Aug 12, 2026 (2026/27 corn season-average farm price $4.50/bu). https://www.usda.gov/about-usda/general-information/staff-offices/office-chief-economist/commodity-markets/wasde-report
[6] Iowa State University Extension, 2026 Iowa Farm Custom Rate Survey, Ag Decision Maker A3-10 — dry bulk application $8.15/acre. https://www.extension.iastate.edu/agdm/crops/pdf/a3-10.pdf
[7] Crop Root Zone, TRZ-0158 (manganese timing) and TRZ-0176 (custom application rates), Sep 3 and Sep 9, 2026.
Disclosures
Crop Root Zone is an independent publication. Nothing here is investment advice. Market calls, where included, reflect the editors' own read and are not a recommendation to buy or sell any security.
Discussion
Midwest on-highway diesel was $5.946 a gallon in the week of September 7, and this issue's field-infrastructure feature puts the fuel inside a fall chisel pass at about $5.35 an acre against $3.38 a year ago. So: are you running your fall tillage pass this year, cutting it back, or dropping it — and what are you actually paying per gallon for delivered dyed diesel against last September? We are especially interested in whether your supplier's quote shows the roughly $2-a-gallon year-on-year gap the on-highway series implies, or something smaller, and when that load was priced.
Corrections are as welcome as answers. If you check our arithmetic against a primary source and we have it wrong, tell us. The sharpest replies get answered in next week's Letters & Responses.