Issue 08 · 2026-09-07
Almost everything in this issue turns on the same awkward fact: the number you are quoted and the number actually setting it have come apart, and the gap is running in weeks rather than days.
Retail DAP is up 7% on the year while the sulfur contract that makes it has more than doubled — and the largest US phosphate producer has filed a WARN notice for 206 people rather than absorb the difference. Retail urea fell 5% last month while the barge it comes from rose 5.4% in the same month. The retail board says UAN32 is the cheaper solution; the Illinois distributor book, reading the same week, says it isn't. The crop insurance guarantee everybody bought in February is tracking 16% higher on a December contract nobody has to consult to know their coverage. And Midwest propane turned direction in the last week of August, five weeks before anyone will need it.
We are not arguing that posted averages are wrong. They are surveys of transactions that already cleared, which is exactly what makes them late. The decisions in this issue — book fall phosphate now or wait, apply anhydrous or budget spring UAN, buy sulfate sulfur or gypsum — are all cases where the leading variable is a contract settlement, a barge print or a soil thermometer, and the retail average is the last thing to move.
— Crop Root Zone, Editorial Desk.
No reader correspondence reached us this week. We ran two independent sweeps of the inbox covering the eight and nine days since RZ-007 — roughly thirty threads — and found nothing on the issue: no questions, no corrections, no pushback. Everything in the window was newsletters, school and hockey correspondence, real-estate alerts and private business mail. With no comment channel on the site, email is the only inbound route, so an empty week here is an empty week in fact rather than a filtering decision. We would rather say that plainly than manufacture a letter.
Three things are worth putting on the record while the space is otherwise idle.
Last week's correction stands, and nobody caught it before we did. RZ-007 opened with a dated correction to TRZ-0137: we had reported corn dented at 41% against a 45% average when the USDA table reads 45% against 41%, and the two columns had been transposed. That error was live for three days, it was found in-house while sourcing a column, and it was not reported to us by any reader. We say so again because the point of running a correction at the front rather than the back is that it should be uncomfortable. A reader who checks our arithmetic against a primary source and tells us is worth more to this publication than any other kind of mail.
RZ-007's closing question is still open, and this issue makes it sharper. We asked whether you apply sulfur on a soil test, a texture rule of thumb, or a strip trial you ran yourself, and specifically for cases where the strip disagreed with the test. Nobody answered. This week's new-inputs work puts sulfate sulfur from gypsum at roughly $0.44–0.61 a pound before freight, against sulfur-indexed products carrying a Tampa contract that has run 127% since the start of the year — so the cost of getting the sulfur decision wrong in either direction is larger this autumn than it was last week when we asked.
The standing question on nitrogen hedging remains open. A reader wrote to RZ-004 pointing out that a grower has no practical instrument to hedge a nitrogen bill the way grain can be hedged. We keep it open because nothing has changed, and this issue's fall-nitrogen feature restates the exposure in plain terms: anhydrous at $0.56 a pound of N against UAN28 at $0.76 is a $36-an-acre decision at 180 units, taken months before the crop that pays for it exists. The correspondent asked to remain anonymous and we have kept them so.
Corrections, disagreements and quotes from your own operation are all welcome. The sharpest get answered here next week.
In This Issue
This week's features, by department.
- The Biggest US Phosphate Producer Is Cutting 206 Jobs Over a Sulfur ContractMosaic is idling Louisiana phosphate capacity because sulfur costs more than the finished product can carry — and the contract that caused it reprices again around October 1, in the middle of fall application.
- UAN28 Fell 8% and Urea 5%. The Gap Between Nitrogen Forms Did Not Move a Cent.Anhydrous still costs $0.56 a pound of N against UAN28's $0.76 — exactly the 20-cent spread it carried a month ago. The decision that has actually changed is the one measured against last fall, where the gap was 28 cents.
- The Retail Book Says UAN32 Is the Cheaper Solution. The Illinois Distributor Book Says It Isn't. Both Are Reading the Same Week.UAN32 is cheaper per pound of nitrogen than UAN28 only when its per-ton premium stays under 14.29%. At retail that premium is 5%; at the Illinois distributor gate it is 18%. The entire disagreement is one ratio, and one of the two lines behind it is a single quote.
- Retail Urea Fell 5% Last Month. The Barge It Comes From Rose 5.4% in the Same Month.Six of eight retail nutrients are lower, but the wholesale leg turned up three weeks ago — the fall prepay decision is being made on a price that is already stale.
- Ammonium Sulfate Fell and Urea Rose in the Same Report, on the Same Day, From the Same DistributorsUSDA's Inter-Mountain West panel marked AMS down $2.53 and urea up $8.25 on Aug 31. Back the nitrogen out at urea's own rate and the sulfur inside that ton prices at $0.58/lb — and the Pacific Northwest, quoting AMS $101 higher, lands within two cents of the same number.
- The Revenue Guarantee You Bought in February Is Tracking 16% Higher Than the Price It Was Written OnDecember corn settled at $5.36¾ against a $4.62 projected price, so October — not February — will set the corn revenue guarantee, and the growers who dropped the harvest price option to save premium gave that away.
- Corn's Old-Crop Book Lost 32.7 Million Bushels in a Week. It Also Shipped 659 Million More Than Last Year.The net-reduction headline is a marketing-year-end artifact — 2025/26 closed August 31. The number that governs harvest basis is the 3.422 billion bushels already shipped, up 24%, against a soybean program that shipped 328 million fewer.
- A Mandate Is Bidding for 131 Million Bushels a Month. The Export Elevator Is Bidding for What's Left.Meeting the 2026 RVO takes about 685,000 tonnes of soybean oil a month — roughly 57% of a record-rate crush, before anyone eats or feeds any of it. That is who the river terminal is competing against for the bushel coming off your combine.
- Corn Held Its Rating and Soybeans Lost Two. The Market Paid Soybeans 3.6 Times More.Both crops are at season-low condition and both rallied on September 1 — which means the board is trading demand, not the crop, and the acre math should be read the same way.
- Winter Wheat Goes in the Ground This Month Against an Export Book 41% Smaller Than Last YearChicago wheat closed $7.82½ and barged wheat volumes are running at 42% of last year's pace — the fall fertility bill is 14 bushels an acre, and the price that has to pay it is not the one on the screen.
- Midwest Propane Drew Down in the Last Week of August, After Five Straight Weeks of BuildingStocks are still comfortable going into grain drying, but the direction turned about a month early — and in drying season the binding constraint has never been the stock level, it is the rate at which barrels can reach a dryer.
- October Shuttle Cars on the UP Went From $400 to $750 in One Week. On the CPKC They Went Nowhere.Three railroads, one harvest, and two opposite forward curves — BNSF and UP price October at a premium to August while CPKC prices it at a discount. At roughly 3,900 bushels a car that divergence is about 13 cents a bushel of basis.
- Barge Freight Is Falling Everywhere on the River. It Is Falling Three Times Faster at the Northern End Than at the Southern End.The gap between what it costs to barge grain from the Twin Cities and from Cairo-Memphis narrowed by $38 a ton in three weeks — not because the south got dearer, but because it stopped falling as fast as the north.
- September 4 Is the Day Grain Shippers Have to Show Up in Writing, or Lose Standing in a Merger That Won't Be Decided Until 2027The Surface Transportation Board's UP-Norfolk Southern timeline runs past the 2026 harvest, past spring planting, into the second half of 2027 — but the deadline to formally join the case as a party of record falls this week.
- Fall Anhydrous Is 26% Cheaper Nitrogen Than Spring UAN28. The Inhibitor Has About $20 an Acre to Play With.At $0.56 against $0.76 a pound of N, the form spread is worth $36 an acre at 180 units — and the independent nitrapyrin work puts the average corn response on ammonia at just over 2%, which sets a hard ceiling on what a stabilizer is worth paying for.
- Every Sulfur Fertilizer Is Priced Off One Tampa Contract. Gypsum Is the Exception, and That Is Getting Less True.Calcium sulfate is priced by drywall demand, coal scrubbers and phosphate waste rather than by the sulfur market that just set a second consecutive record — which is the entire argument for it, and also where its own supply problem is hiding.
- The Cover Crop That Actually Makes Nitrogen Has About Three Weeks Left to Get Planted. The One Most People Seed Never Made Any.Cereal rye scavenges 25–50 lb of N it did not create and can immobilize it into next spring. A legume fixes it — but only if it establishes before frost, and its credit is worth 36% more if it replaces sidedress UAN28 instead of fall anhydrous.
- A Week of Delay on a Manganese Deficiency Costs 5% of the Soybean Crop. Tank-Mixing It With Glyphosate Wrong Can Cost 30% of the Weed Control.Both numbers come from the same body of research and point the same direction: manganese correction on soybeans has to happen fast, and it has to happen with the right source, or the fix and the herbicide pass start working against each other.
Two markets moved this week and they moved on different clocks. The crop side traded on a report that has not been published yet; the fertilizer side traded on a contract settled in July.
The crop side is pricing a smaller crop before USDA says so. December corn settled at $5.36¾ on September 4, down 4 cents, with November soybeans at $13.09¾, down 6½, and December Chicago wheat at $7.34, down 20¼ (Brownfield Ag News, Sep 4, 2026). The declines were profit-taking into a long weekend, not a change of view: the trade broadly expects the September WASDE, due September 12, to cut the August crop on excess moisture and disease in the east and heat and drought in parts of the west (Brownfield Ag News, Sep 4, 2026). Underneath that, soybean demand is doing something unusual — China bought on nearly every business day of the week, six consecutive days of announced sales to China or unknown destinations totalling 1,347,600 tonnes, all for 2026/27 delivery, with new-crop US sales running at more than double last year's pace (Brownfield Ag News, Sep 2026). Globally the FAO cut its 2026 world grain production estimate by 61.1 million tonnes to 2.98 billion, which would be the largest year-on-year decline since 2018 (FAO, via Brownfield Ag News, Sep 2026).
The fertilizer side is still absorbing a July settlement. The Q3 Tampa molten sulfur contract settled at a record $705 per long ton in July, up 8% on the quarter and up 127% from the $310/lt base at the start of the year (Argus Media, Jul 13, 2026). That number has now done something visible: the largest US phosphate producer has idled Louisiana phosphate capacity and filed a WARN notice covering 206 workers, explicitly on sulfur cost and availability (The Advocate, Aug 2026; World Fertilizer, Jul 9, 2026). Retail phosphate has barely registered it. The World Bank has separately warned that fertilizer prices could rise more than 30% in 2026, attributing the pressure to Strait of Hormuz disruption (World Bank, 2026).
| Benchmark | Level | Basis | Direction |
|---|---|---|---|
| DAP | $918/ton | Delivered, retail average | +7% YoY |
| MAP | $959/ton | Delivered, retail average | +5% YoY |
| Potash | $493/ton | Delivered, retail average | +2% YoY |
| Urea | $655/ton | Delivered, retail average | −5% MoM, +4% YoY |
| Anhydrous | $923/ton | Delivered, retail average | +21% YoY |
| UAN28 | $428/ton | Delivered, retail average | −8% MoM |
| Tampa sulfur, Q3 | $705/lt | Delivered contract, quarterly | +8% on Q2; +127% on Q1 base |
| Dec corn | $5.36¾ | CBOT settlement, Sep 4 | −4¢ |
| Nov soybeans | $13.09¾ | CBOT settlement, Sep 4 | −6½¢ |
| Dec Chicago wheat | $7.34 | CBOT settlement, Sep 4 | −20¼¢ |
Sources: DTN/Progressive Farmer retail fertilizer trends, week of Aug 24–28, 2026, published Sep 2, 2026; Argus Media, Jul 13, 2026; Brownfield Ag News closing futures, Sep 4, 2026.
Potash is the one benchmark behaving normally. MOP is quoted around $310–380/ton in Corn Belt markets and $295–355/ton on NOLA barge, roughly flat year over year, and is the only major nutrient sitting near its five-year average while nitrogen and phosphate run 15–30% above theirs (industry price trackers, 2026). Canadian expansion after the Belarus disruption filled the gap and has kept it there.
The week's verdict: the crop side is trading nine days ahead of a report and the fertilizer side is trading two months behind a contract, which means the two halves of your margin are currently being set by information arriving at completely different speeds — and only one of them is on a published calendar.
Fertilizer
Phosphate producer idles Louisiana capacity on sulfur cost — Mosaic filed a WARN notice in late August covering 206 workers at its Uncle Sam and Faustina plants, having curtailed phosphate output at four US sites over sulfur availability and price. Ammonia production at Faustina continues; it is the phosphate side that stopped. (The Advocate, Aug 2026; World Fertilizer, Jul 9, 2026)
Tampa sulfur contract sets a second consecutive record — The Q3 settlement came in at $705/lt delivered, up $50 from $655/lt, extending a run that had already passed the 2008 peak. Argus assessed concurrent US Gulf refinery spot at $1,100–1,150/mt FOB on July 9, roughly 60% above the contract. (Argus Media, Jul 13, 2026)
World Bank flags a possible 30%+ fertilizer price rise for 2026 — The warning attributes the pressure to Strait of Hormuz disruption tightening supplies across the nutrient complex. Treat the headline number as a scenario rather than a forecast; the mechanism it names is the same one already visible in the sulfur contract. (World Bank, 2026)
Potash remains the outlier — MOP is quoted around $310–380/ton in Corn Belt markets and $295–355/ton NOLA barge, roughly flat year over year and near its five-year average while nitrogen and phosphate sit 15–30% above theirs. Canadian expansion after the Belarus disruption is the reason. (Industry price trackers, 2026)
Crops
September WASDE lands Friday the 12th — The trade broadly expects a cut to the August crop on excess moisture and disease in the eastern belt and heat and drought in parts of the west. Markets took profits into the long weekend rather than adding position ahead of it. (Brownfield Ag News, Sep 4, 2026)
China bought soybeans on nearly every business day of the week — Six consecutive business days of announced sales to China or unknown destinations totalled 1,347,600 tonnes, all for 2026/27 delivery, with new-crop US sales running at more than double last year's pace. (Brownfield Ag News, Sep 2026)
FAO cuts world grain production by 61.1 million tonnes — The revised 2026 estimate of 2.98 billion tonnes would be the largest year-on-year decline since 2018. (FAO, via Brownfield Ag News, Sep 2026)
Corn condition has been flat at a three-year low for the date — NASS had corn at 57% good-to-excellent as of August 30, unchanged on the week and twelve points below last year, while maturity ran on its normal schedule at 13%. Development on time with condition off is the combination that puts the remaining uncertainty in kernel weight rather than in the calendar. (USDA NASS, week ending Aug 30, 2026, via DTN)
Home & Garden
The cheapest fall nitrogen application is the one you were going to rake up — University of Connecticut work puts a 2-inch layer of mulched leaves at roughly 150 pounds of nitrogen per acre returned to the soil each autumn, and Michigan State estimates mulch-mowing delivers about ¼ lb N per 1,000 sq ft annually. The catch is depth: past about two inches, a mulching mower cannot keep up and the layer starts smothering the grass instead of feeding it. (University of Connecticut; Michigan State University Extension)
Autumn is the right time to lime, and the reason is chemistry rather than convenience — Lime needs months of soil reaction time before the pH change is realised, so a fall application is working through winter while a spring one is still dissolving when the crop needs it. Extension guidance is a soil test at least every three years. (Extension guidance, 2026)
Leaf litter is quietly being reclassified from waste to habitat — Extension services and native-plant groups have spent the last several seasons reframing autumn leaf drop as overwintering habitat and free fertiliser rather than a curbside chore. The practical version for a lawn owner is unchanged: mulch thin layers weekly during peak drop rather than letting it pile. (Xerces Society and state extension services, 2026)
Micronutrients
Zinc deficiency showed in 35% of tested soils in 2024, up from 28% four years earlier — Laboratory reporting associates deficient corn fields with 15–20% yield losses. Read the deficiency figure carefully: it is a share of samples below a sufficiency threshold, which is a statement about the test, not a measured yield response on those acres. (US micronutrient industry research, 2024–2026)
The US micronutrient fertiliser market is growing modestly, not explosively — Estimates put it at roughly $800 million in 2025 rising to about $848.6 million in 2026, about 6%. Multi-micronutrient blends are gaining share against single-nutrient products. (Mordor Intelligence, 2026)
Boron products are reaching the organic input lists — Boron formulations have been registered for organic use, with deficiency documented by testing as a condition. Boron has the narrowest margin between deficiency and toxicity of any common micronutrient, so a registration is not an invitation to apply speculatively. (Washington State Department of Agriculture organic input material list)
Organics
USDA's organic acreage survey results are due October 30 — Forms went to approximately 26,000 producers nationwide, with responses due in early February. It remains the only comprehensive national count of certified organic acres and the basis for most organic market sizing. (USDA NASS, Organic Production survey)
The autumn NOSB meeting packet is out — The National Organic Standards Board's fall 2026 materials are published, which is where substance sunset reviews and new petitions are set out ahead of the meeting. Anyone whose input list depends on a listed substance should read the packet rather than wait for the outcome. (USDA AMS, NOSB Fall 2026 meeting packet)
Fertilizer Production Expansion Program grants continue to flow into nutrient alternatives — The USDA programme, begun in 2022, funds expansion of fertiliser and nutrient-alternative manufacturing, and organic and biological inputs have been among the recipient categories. (USDA, Fertilizer Production Expansion Program)
Up and Coming
Engineered soil microbiomes get a collected evidence base — A set of studies published in Frontiers in Microbiology in August surveys evidence that engineered microbial communities can improve soil health, boost nutrient cycling and reduce synthetic fertiliser requirements. Among them, plant growth-promoting bacteria isolated from nutrient-poor sandstone in China's Yellow River Basin demonstrated phosphate solubilisation, nitrogen fixation and siderophore production. This is laboratory and glasshouse evidence, not field performance — the same category of claim whose field results have been repeatedly inconsistent or null, and the trials are the test rather than the confirmation. (Frontiers in Microbiology, Aug 2026; Fertilizer Daily, Aug 27, 2026)
Rainfall, not soil type, appears to shape nitrogen-fixer diversity globally — An analysis of the nifH gene across 1,257 soil metagenomes from 318 terrestrial ecosystems identifies precipitation as a primary driver of nitrogen-fixing microorganism diversity. Early-stage and observational: it describes where diazotroph diversity is, not what an inoculant will do in a field. (Peer-reviewed, 2026, via PubMed Central)
AI is being pointed at nitrogenase sequence mining — Reviews describe machine learning accelerating regulatory-element prediction and nitrogenase sequence discovery as a route toward engineering symbiotic nitrogen fixation in non-legume crops. Speculative and long-dated: engineered nitrogen fixation in cereals has been an active goal for decades and nothing here changes the timeline, only the search rate. (Trends in Plant Science, 2026)
Interesting
Genome editing turned red lettuce green, and something else went up — Researchers blocked red pigment production in lettuce and found other beneficial plant compounds accumulating instead, which is a useful reminder that a plant's metabolic budget is finite and knocking out one sink moves carbon somewhere else. (ScienceDaily, 2026)
Plants appear to have borrowed their chemistry from microbes — University of York work published in February suggests plants reuse molecular tools more commonly seen in microbes to build defensive compounds, an unusual evolutionary route to a large part of plant secondary chemistry. (University of York, Feb 2026, via ScienceDaily)
Two poisonous plants gave up their synthesis pathway — Researchers identified six enzymes required to build a complex compound in wolfsbane and larkspur, with potential medical application. Of interest agronomically because both are pasture-toxic species whose chemistry has been poorly characterised. (ScienceDaily, 2026)
Off the Wall Discovery
Crops irrigated with treated wastewater are collecting trace pharmaceuticals in their leaves — Research on tomatoes, carrots and lettuce found medications absorbed and concentrating in leaf tissue. The finding is real and the quantities are trace; the reason to run it here is that it inverts the usual assumption about which part of a plant accumulates what, and leaf tissue is exactly what a tissue test samples. (ScienceDaily, 2026)
A hornwort's carbon-concentrating trick is being examined for crops — Hornworts carry a modified Rubisco that clusters into CO₂-concentrating compartments resembling algal structures, which is why they keep appearing in yield-improvement literature. Speculative: no crop carries this and none is close to doing so. (ScienceDaily/phys.org, 2026)
The Biggest US Phosphate Producer Is Cutting 206 Jobs Over a Sulfur Contract
Mosaic is idling Louisiana phosphate capacity because sulfur costs more than the finished product can carry — and the contract that caused it reprices again around October 1, in the middle of fall application.
The largest phosphate producer in the United States is taking capacity out of the market in the weeks before fall application, and the reason is not phosphate rock, natural gas, freight or demand. It is sulfur. Mosaic filed a WARN notice in late August covering 206 workers at its Uncle Sam plant in Convent, Louisiana and its Faustina plant in St. James, with separations effective in October (The Advocate, Aug 2026). Faustina's phosphate line is fully idle; Bartow, Florida has been running at roughly 40% of its target annual rate. Ammonia production at Faustina continues — it is the phosphate side, the side that eats sulfuric acid, that has stopped.
This is the clearest signal the phosphate market has produced this year, and it is not a price signal. It is a producer stating, by shutting down, that at current sulfur costs the finished product does not clear.
1. What actually broke: the acid, not the rock
What's new: Mosaic curtailed US and Brazilian phosphate output through 2026 and withdrew its 2026 phosphate production guidance of at least 7 million tonnes back in May. The affected US sites are Bartow and Riverview in Florida and Faustina and Uncle Sam in Louisiana (World Fertilizer, Jul 9, 2026). The company's stated cause is the availability and cost of sulfur, following the disruption of Middle East sulfur exports through the Strait of Hormuz.
Evidence: The financial shape of the problem was visible two quarters ago. Mosaic's phosphate segment posted a $48 million operating loss in Q1 2026 on 1.9 million tonnes of sales, with raw material costs up $280 million (RFD-TV, May 14, 2026). A $280 million input increase against a segment that then lost $48 million is not a margin compression story. It is an arithmetic one: the input line moved by more than the segment's entire earnings capacity.
Phosphate production is unusually exposed here. Making DAP or MAP requires phosphate rock, ammonia and sulfuric acid, and the acid is made from elemental sulfur. There is no substitution available inside the plant. A urea producer facing expensive gas can slow down; a phosphate producer facing expensive sulfur has no second recipe.
| Mosaic phosphate, what changed | Figure | Source date |
|---|---|---|
| Q1 2026 phosphate sales volume | 1.9 Mt | May 14, 2026 |
| Q1 2026 phosphate operating result | −$48 M | May 14, 2026 |
| Q1 2026 raw material cost increase | +$280 M | May 14, 2026 |
| 2026 production guidance, withdrawn | ≥7.0 Mt | May 2026 |
| Louisiana workers in the WARN notice | 206 | Aug 2026 |
| Bartow run rate vs target | ~40% | Jul 2026 |
Source: RFD-TV, May 14, 2026; World Fertilizer, Jul 9, 2026; The Advocate, Aug 2026.
Ground Truth: A curtailment announced in a quarterly earnings call is a forecast. A WARN notice is a decision — it carries a statutory notice period, a legal filing, and a cost to reverse. The move from "reviewing our production plan" in May to a 206-person WARN filing in late August is the point at which Mosaic stopped treating this as a cycle to be waited out. Read the filing, not the guidance.
2. The input price, and how far it has run
What's new: The third-quarter Tampa contract for molten sulfur delivered settled at a record $705 per long ton, up $50/lt from the $655/lt second-quarter settlement — an 8% rise that extended a run which had already taken the Q2 number past the previous peak set in 2008 (Argus Media, Jul 13, 2026).
Evidence: The contract is the low number. Argus assessed spot export shipments from US Gulf refineries at $1,100–$1,150 per metric tonne FOB on Jul 9, 2026, roughly 60% above the delivered contract level. The gap is a direct consequence of Middle East export flows through the Strait of Hormuz collapsing and US Gulf cargoes being redirected into destinations they do not normally serve.
| Tampa molten sulfur contract | $/lt delivered | Change | |
|---|---|---|---|
| Q1 2026 (base) | 310 | ████ |
— |
| Q2 2026 | 655 | █████████ |
+$345 |
| Q3 2026 | 705 | ██████████ |
+$50 |
Source: Argus Media, Jul 13, 2026; Argus Media (Q1 2026 viewpoint), for the $310/lt base.
$705/lt
Q3 2026 Tampa molten sulfur contract — a record, up 8% on the quarter, and roughly 40% below where concurrent US Gulf spot sulfur was trading. (Argus Media, Jul 13, 2026)
The relationship between those two numbers is the operative fact for anyone buying phosphate this autumn. A contract settlement 40% below spot is not a stable arrangement. It resolves one of two ways: spot falls back toward the contract, or the next contract settles higher. Sulfur's supply problem is geopolitical rather than cyclical, which makes the second path the one to plan around.
3. What the retail phosphate print is and is not telling you
What's new: US retail phosphate has moved very little against all of this. DAP averaged $918/ton and MAP $959/ton in the week of Aug 24–28, 2026, both described as slightly higher on the month and up 7% and 5% respectively against a year earlier (DTN, Sep 2, 2026).
Evidence: Set that against the input. Sulfur's contract price more than doubled from the Q1 base to the Q3 settlement. Retail phosphate is up single digits year over year. Those two series have decoupled, and the decoupling is being financed by producer margin — which is precisely what the $48 million segment loss and the curtailment are.
| Product | $/ton | MoM | YoY | Basis |
|---|---|---|---|---|
| DAP | 918 | Slightly higher | +7% | Delivered, retail average |
| MAP | 959 | Slightly higher | +5% | Delivered, retail average |
| 10-34-0 | 715 | Slightly lower | +7% | Delivered, retail average |
| Potash | 493 | Slightly lower | +2% | Delivered, retail average |
| Urea | 655 | −5% | +4% | Delivered, retail average |
| Anhydrous | 923 | Slightly lower | +21% | Delivered, retail average |
Source: DTN/Progressive Farmer retail fertilizer trends, week of Aug 24–28, 2026, published Sep 2, 2026.
Two things stand out in that table beyond the phosphate lines. Anhydrous is up 21% year over year while urea is up 4% — the nitrogen complex is not moving as one block. And potash, up 2%, is the only major nutrient behaving like a normal market. Phosphate's flatness is not calm; it is a queue.
Ground Truth: The retail phosphate price is currently the lagging variable in this market, not the leading one. The leading variable is the Q4 Tampa sulfur settlement, expected around the start of October. If it settles anywhere near the concurrent spot level, US phosphate producers face a second step-change in input cost in the same crop year, having already shown — with a WARN notice — that their response is to withdraw volume rather than absorb it. A buyer treating today's $918 DAP as the market's considered view of 2027 supply is reading a number that was set before the decision that matters.
4. What a curtailment does to a fall application season
What's new: The timing is the aggravating factor. Fall is when a large share of North American phosphate goes to ground, applied ahead of the next corn crop rather than in-season. Capacity coming out in October removes tonnes from the exact window in which they are consumed.
Evidence: Mosaic's own framing is that the actions are "a temporary response to extraordinary market conditions" and do not change its long-term strategy (World Fertilizer, Jul 9, 2026). That is a reasonable statement about intent and a weak one about timing. Restarting an idled phosphate train is not a switch: sulfuric acid plants, cooling and materials handling all have to come back in sequence, and the 206 people covered by the WARN notice are the ones who do it.
The domestic-supply politics are worth noting plainly, because they cut against the usual assumption that policy support tightens or loosens a market. The curtailment is a setback for efforts to raise domestic phosphate production volumes; it is happening anyway, because the economics inside the plant gate do not depend on whether more domestic output is wanted.
| Fall phosphate decision, the variables | Status as of Sep 7, 2026 |
|---|---|
| Retail DAP/MAP | $918 / $959, roughly flat MoM |
| Domestic supply | Two Louisiana plants idle/curtailed; Bartow ~40% |
| Input cost, current quarter | $705/lt, fixed through Sep 30 |
| Input cost, next quarter | Unsettled; spot ~60% above the Q3 contract in July |
| Producer's demonstrated response | Withdraw volume |
Source: DTN, Sep 2, 2026; Argus Media, Jul 13, 2026; World Fertilizer, Jul 9, 2026; The Advocate, Aug 2026.
Ground Truth: The decision this creates for a fall phosphate buyer is not "is $918 a good price" — it is "is $918 a price I can still get." Those are different questions and they have different answers. Supply withdrawal shows up in availability and lead time before it shows up in a posted average, because the posted average is a survey of transactions that cleared. The tell to watch over the next six weeks is not the DTN number; it is whether a full order gets filled on the original date.
5. What would change this read
Three things would, and they are worth naming so the argument can be tested rather than assumed.
The first is the Q4 Tampa settlement. If it comes in flat or lower, the entire premise weakens: the curtailment becomes a one-quarter event and phosphate producers restart into a fall market. The second is Middle East export flow. Sulfur is a byproduct of oil and gas processing, so the supply response is not price-elastic in the usual way — it is elastic to refinery and gas-plant throughput, and to whether cargoes can transit. Restored flow through Hormuz would move spot faster than any producer decision. The third is demand: if phosphate application is deferred on a thin corn margin, the withdrawn tonnes are not missed, and the market clears at a lower volume rather than a higher price.
None of those three is visible in a retail price print, which is the broader point. This is a market in which the informative series are the quarterly input contract, a shipping lane, and a WARN filing.
References
- Argus Media, "Tampa 3Q liquid sulphur price hits record $705/lt," Jul 13, 2026 — https://www.argusmedia.com/en/news-and-insights/latest-market-news/2851577-tampa-3q-liquid-sulphur-price-hits-record-705-lt
- Argus Media, "Viewpoint: Sulfur costs to support amsul prices in 2026" — https://www.argusmedia.com/en/news-and-insights/latest-market-news/2770651-viewpoint-sulfur-costs-to-support-amsul-prices-in-2026
- World Fertilizer, "Mosaic reveals plans to reduce Brazil and US output," Jul 9, 2026 — https://www.worldfertilizer.com/phosphates/09072026/mosaic-reveals-plans-to-reduce-brazil-and-us-output/
- RFD-TV, "Fertilizer Policy In-Focus: Mosaic Curtails Phosphate Output as Sulfur Costs Surge," May 14, 2026 — https://www.rfdtv.com/fertilizer-policy-in-focus-mosaic-curtails-phosphate-output-as-sulfur-costs-surge
- The Advocate (Baton Rouge), "Mosaic to lay off 206 at St. James fertilizer plants," Aug 2026 — https://www.theadvocate.com/baton_rouge/news/business/louisiana-fertilizer-plants-lay-off-200-as-war-with-iran-drives-up-cost-of-key/article_c550aee7-016d-4af5-ae2b-497f7e1c2fda.html
- WBRZ, "Over 200 Mosaic employees laid off at two facilities amid sulfur supply shortage," Aug 2026 — https://www.wbrz.com/news/over-200-mosaic-employees-laid-off-at-two-facilities-amid-sulfur-supply-shortage
- DTN/Progressive Farmer, "Fertilizer Prices Fall as UAN28, Urea Lead the Way Lower," Sep 2, 2026 (prices for the week of Aug 24–28, 2026) — https://www.dtnpf.com/agriculture/web/ag/crops/article/2026/09/02/fertilizer-prices-fall-uan28-urea
Disclosures
Crop Root Zone is an independent publication. Nothing here is investment advice. Market calls, where included, reflect the editors' own read and are not a recommendation to buy or sell any security.
UAN28 Fell 8% and Urea 5%. The Gap Between Nitrogen Forms Did Not Move a Cent.
Anhydrous still costs $0.56 a pound of N against UAN28's $0.76 — exactly the 20-cent spread it carried a month ago. The decision that has actually changed is the one measured against last fall, where the gap was 28 cents.
Six of the eight fertilizers DTN tracks were cheaper in the fourth week of August than a month earlier, and the two that led the decline were both nitrogen: UAN28 at $428/ton, 8% lower, and urea at $655/ton, 5% lower (DTN/Progressive Farmer, Sep 2, 2026). That is the fifth consecutive week of a softening retail nitrogen board and it reads, in headline form, like a buying opportunity opening up ahead of fall application. It is not, or at least not in the way the headline implies. On the only basis that governs a form decision — dollars per pound of actual nitrogen — the products fell together and in near-identical proportion. Anhydrous costs $0.56/lb N. UAN28 costs $0.76. The gap is 20 cents. A month ago anhydrous was $0.58 and UAN28 was $0.78, and the gap was 20 cents.
1. What the board actually did
What's new: DTN's retail survey for the week of August 24–28 puts six of eight nutrients below their prior-month level, with the two solution nitrogens and urea carrying the move and the phosphates edging up.
Evidence:
| Product | $/ton | vs. last month | vs. year ago | Basis |
|---|---|---|---|---|
| Anhydrous | 923 | Slightly lower | +21% | Delivered, retail |
| MAP | 959 | Slightly higher | +5% | Delivered, retail |
| DAP | 918 | Slightly higher | +7% | Delivered, retail |
| 10-34-0 | 715 | Slightly lower | +7% | Delivered, retail |
| Urea | 655 | −5% | +4% | Delivered, retail |
| Potash | 493 | Slightly lower | +2% | Delivered, retail |
| UAN32 | 458 | Slightly lower | −5% | Delivered, retail |
| UAN28 | 428 | −8% | +2% | Delivered, retail |
Source: DTN/Progressive Farmer retail fertilizer survey, week of Aug 24–28, 2026, published Sep 2, 2026.
Two things in that table matter more than the direction arrows. The first is that anhydrous is the only nitrogen product with a double-digit year-over-year increase, at +21%, and it is simultaneously the cheapest source of nitrogen on the board. The second is that UAN32 is the only nutrient of the eight that is cheaper than it was a year ago, at −5%, and it is not the cheapest solution nitrogen — UAN28 is, by $30/ton, though not by pound of N.
Price per ton is the wrong denominator for a fertilizer buyer and it always has been. UAN28 looks like the bargain of the group at $428/ton until the 28% is applied. A ton of UAN28 carries 560 lb of nitrogen; a ton of anhydrous carries 1,640 lb.
Ground Truth: The 8% headline on UAN28 is not a signal to switch forms, because it did not change any relative price. It is a signal about the level of the whole nitrogen complex, and the level is what a prepay decision keys off — not the ranking, which has been stable for two months.
2. The spread that did not move
What's new: DTN publishes the per-pound-of-nitrogen conversion alongside the per-ton prices. Comparing the last two published weeks shows the entire nitrogen board shifting down roughly in parallel.
Evidence:
| Form | $/lb N, wk of Aug 24–28 | $/lb N, wk of Aug 17–21 | Change | Premium to anhydrous, now |
|---|---|---|---|---|
| Anhydrous | 0.56 | 0.58 | −0.02 | — |
| Urea | 0.71 | 0.72 | −0.01 | +0.15 |
| UAN32 | 0.72 | 0.72 | 0.00 | +0.16 |
| UAN28 | 0.76 | 0.78 | −0.02 | +0.20 |
Source: DTN/Progressive Farmer retail fertilizer surveys published Aug 26 and Sep 2, 2026.
The anhydrous-to-UAN28 spread was $0.20/lb N in the third week of August and $0.20/lb N in the fourth. On a 180 lb N/acre corn program that is a $36.00/acre difference in both weeks — the same figure to the cent, despite an 8% headline decline on one of the two products.
| Form, at 180 lb N/acre | $/acre | |
|---|---|---|
| UAN28 | 136.80 | ██████████ |
| UAN32 | 129.60 | █████████ |
| Urea | 127.80 | █████████ |
| Anhydrous | 100.80 | ███████ |
Source: derived from DTN per-pound-N figures, week of Aug 24–28, 2026, at an assumed 180 lb N/acre rate. Rate is illustrative, not a recommendation.
One relative price did move, and it moved against the solution the retail lag usually favors. UAN32 held flat at $0.72/lb N while anhydrous dropped two cents, so anhydrous's advantage over UAN32 widened from $0.14 to $0.16/lb — about $3.60/acre at 180 lb. The advantage over UAN28 stayed put; the advantage over UAN32 grew.
Ground Truth: A parallel shift in a price complex is information about a common input, not about the products. All four nitrogen forms are downstream of the same ammonia molecule, and when the whole board moves together by roughly the same amount per pound of N, what moved was upstream. That is consistent with a wholesale ammonia benchmark that has been carried flat for weeks while the retail book works off inventory bought higher — the pass-through is arriving as a level change, not as a change in relative product economics.
3. The comparison that has actually changed
What's new: The month-over-month spread is static. The year-over-year spread is not, and it has moved decisively against anhydrous.
Evidence: DTN's stated year-over-year percentages can be run backwards from the current per-pound-N figures to approximate where each form sat a year ago. These are derived values, not published prints, and are marked as such.
| Form | $/lb N now | Implied $/lb N, year ago* | Premium to anhydrous, now | Premium to anhydrous, year ago* |
|---|---|---|---|---|
| Anhydrous | 0.56 | 0.46 | — | — |
| Urea | 0.71 | 0.68 | +0.15 | +0.22 |
| UAN32 | 0.72 | 0.76 | +0.16 | +0.30 |
| UAN28 | 0.76 | 0.75 | +0.20 | +0.28 |
*Derived by deflating the current per-pound-N figure by DTN's stated year-over-year percentage change (+21% anhydrous, +4% urea, −5% UAN32, +2% UAN28). Estimates, not published values.
Source: derived from DTN/Progressive Farmer, Sep 2, 2026.
Anhydrous inflated 21% over twelve months while every other nitrogen form moved between −5% and +4%. The mechanical consequence is that the cheapest pound of nitrogen got substantially less cheap relative to the alternatives, even as it stayed the cheapest in absolute terms. The anhydrous-to-UAN28 gap has gone from roughly $0.28/lb N to $0.20 — about $14.40/acre of eroded advantage at 180 lb N. Against UAN32 the erosion is larger still, from roughly $0.30 to $0.16, or about $25/acre.
$36.00/acre
The anhydrous-to-UAN28 nitrogen cost gap at 180 lb N/acre, unchanged across the last two DTN survey weeks — and down from roughly $50 an acre a year ago. (Derived from DTN/Progressive Farmer per-pound-N figures, Aug 26 and Sep 2, 2026)
Ground Truth: The case for anhydrous has always rested on a wide, stable per-pound discount that pays for the handling, the equipment, the nurse-tank logistics and the application risk that go with it. That discount is still real and still the largest on the board, but it has shrunk by roughly 29% in a year. For an operation whose custom-application or equipment cost sits in the $15–25/acre range, the arithmetic that was comfortable at a 28-cent spread is merely adequate at 20 cents. This is not an argument to switch — it is an argument to re-run the number rather than assume last year's answer, because the input to it has moved by a fifth while the headline said prices were falling.
4. What this means for fall
What's new: Fall anhydrous application in the northern Corn Belt is governed by soil temperature, not by the calendar, and the 50°F-and-falling threshold typically arrives in late October in the I-states and earlier north of that. The prepay decision, however, is being made now.
Evidence: The decision splits into two independent questions that the current price picture answers differently.
The form question — anhydrous versus a solution — is settled by the $0.20/lb N spread, and that spread has not moved in a month. Nothing in the last four weeks of price action should change a form decision that was correct in early August.
The timing question — buy now or wait — is the live one. Five consecutive weeks of decline on a retail board that is still 21% above year-ago on the product in question is an uncomfortable combination: the trend says wait, the level says the trend has a long way to run before it returns anything like last fall's cost. Anhydrous at $923/ton is roughly $160/ton above where the same +21% implies it sat last year.
| Question | What the data says | Confidence |
|---|---|---|
| Which form is cheapest per lb N? | Anhydrous, by $0.20 over UAN28 | High — published, two consecutive weeks |
| Has that ranking changed this month? | No, not by a cent | High — published |
| Has the size of the advantage changed? | Yes, down ~29% year over year | Medium — derived from stated YoY percentages |
| Will the retail decline continue? | Unknowable from this data | — |
Source: DTN/Progressive Farmer, Sep 2, 2026; derivations as footnoted above.
Ground Truth: The most useful thing in this month's numbers is a negative result. A reader who spent the week watching UAN28 fall 8% and wondering whether the nitrogen plan needed revisiting can stop: on relative economics, nothing happened. The revision that is genuinely warranted is the twelve-month one, and it points the other way from the headlines — the fall-application premium is being paid down by anhydrous inflation, quietly, in a period when the weekly reports have said "lower" five times running.
References
- DTN/Progressive Farmer, "Fertilizer Prices Fall as UAN28, Urea Lead the Way Lower," Sep 2, 2026 — retail survey week of Aug 24–28, 2026. https://www.dtnpf.com/agriculture/web/ag/crops/article/2026/09/02/fertilizer-prices-fall-uan28-urea
- DTN/Progressive Farmer, "UAN28 Leads Fertilizer Price Declines for Fifth Consecutive Week," Aug 26, 2026 — retail survey week of Aug 17–21, 2026. https://www.dtnpf.com/agriculture/web/ag/crops/article/2026/08/26/uan28-leads-fertilizer-price-fifth
- DTN/Progressive Farmer, "Fertilizer Prices Fall as UAN32 Leads Significant Drops Heading Into August," Aug 5, 2026. https://www.dtnpf.com/agriculture/web/ag/crops/article/2026/08/05/fertilizer-prices-fall-uan32-leads
Disclosures
Crop Root Zone is an independent publication. Nothing here is investment advice. Market calls, where included, reflect the editors' own read and are not a recommendation to buy or sell any security.
The Retail Book Says UAN32 Is the Cheaper Solution. The Illinois Distributor Book Says It Isn't. Both Are Reading the Same Week.
UAN32 is cheaper per pound of nitrogen than UAN28 only when its per-ton premium stays under 14.29%. At retail that premium is 5%; at the Illinois distributor gate it is 18%. The entire disagreement is one ratio, and one of the two lines behind it is a single quote.
Two public fertilizer price books covered the same week of August 2026 and reached opposite conclusions about the same decision. DTN's national retail series, priced the week of August 17–21, has UAN32 at $0.72 per pound of nitrogen and UAN28 at $0.78 — a clear win for the 32 (DTN/Progressive Farmer, Aug 26, 2026). USDA's Illinois Production Cost Report, dated Friday, August 21 of that same week, has UAN32 at $605 per ton and UAN28 at an average of $511.67 — which works out to $0.945 and $0.914 per pound of nitrogen respectively, a clear win for the 28 (USDA AMS, Aug 21, 2026). Same chemistry, same week, opposite answer. The gap is not a data error and it is not a basis argument about delivered versus FOB. It is one ratio, and it is worth knowing where that ratio sits before the fall solution order goes in.
1. The two books, converted to the only unit that matters
What's new: UAN28 and UAN32 are the same salt in different water. Comparing them by the ton compares the water. The only honest basis is dollars per pound of actual nitrogen, and both books can be put on it exactly, because the analysis is arithmetic rather than judgement: a ton of UAN28 carries 560 pounds of N (0.28 × 2,000) and a ton of UAN32 carries 640 (0.32 × 2,000).
Evidence: Converted, the two books look like this.
| Product | DTN retail, $/ton | DTN, $/lb N | AMS Illinois, $/ton | AMS Illinois, $/lb N |
|---|---|---|---|---|
| Anhydrous ammonia (82-0-0) | 943 | 0.575 | 890.00 | 0.543 |
| Urea (46-0-0) | 664 | 0.722 | 722.00 | 0.785 |
| UAN28 (28-0-0) | 436 | 0.779 | 511.67 | 0.914 |
| UAN32 (32-0-0) | 458 | 0.716 | 605.00 | 0.945 |
Sources: DTN/Progressive Farmer retail fertilizer survey, week of Aug 17–21, 2026, published Aug 26, 2026 — national average, delivered to farm. USDA AMS Illinois Production Cost Report (bi-weekly), Fri Aug 21, 2026 — Illinois distributor ask, F.O.B., per ton. Per-pound-of-N columns are this publication's arithmetic on the published per-ton figures; DTN's own rounded per-pound figures for the same week are urea $0.72, anhydrous $0.58, UAN28 $0.78 and UAN32 $0.72, which agree to the cent.
Read down the last two columns and the disagreement is confined to one row pair. Both books agree that anhydrous is much the cheapest nitrogen on offer, and by a similar margin. Both agree that the solutions are the expensive end. They part company only on which solution is the expensive end — and, secondarily, on where urea sits relative to them, which is a consequence of the same arithmetic.
Ground Truth: Nothing about this is a disagreement over the level of nitrogen prices. The two books are $0.14 to $0.23 per pound of N apart on every line, which is ordinary for a national delivered average against a single state's FOB distributor ask. The disagreement is about the ranking, and a ranking flip is a decision-grade event in a way that a level difference is not. You cannot buy the national average. You can only buy from whoever answers the phone, and the ranking is what tells you what to ask for.
2. The whole thing is one number: 14.29%
What's new: UAN32 is cheaper than UAN28 per pound of nitrogen if and only if its per-ton price premium is smaller than its nitrogen advantage. That nitrogen advantage is fixed by the grades themselves and never moves: 640 pounds against 560 is 640 ÷ 560 = 1.142857, or 14.29%.
Evidence: Set the break-even out explicitly. UAN32 wins whenever
P32 < P28 × 1.1429
and loses whenever it doesn't. Applying that to the two books for the same week:
| Book | UAN28 $/ton | UAN32 $/ton | Actual premium | Break-even | Cheaper per lb N |
|---|---|---|---|---|---|
| DTN retail, national | 436 | 458 | +5.05% | 14.29% | UAN32 |
| AMS Illinois, distributor | 511.67 | 605.00 | +18.24% | 14.29% | UAN28 |
Sources: DTN/Progressive Farmer, Aug 26, 2026 (prices for the week of Aug 17–21); USDA AMS Illinois Production Cost Report, Aug 21, 2026. Premium and break-even columns are this publication's calculation.
Plotted against the threshold, the two books sit on opposite sides of it and not by a small margin:
| Book | UAN32 per-ton premium over UAN28 | |
|---|---|---|
| Break-even (fixed by grade) | 14.29% | ████████ |
| DTN retail, national | 5.05% | ███ |
| AMS Illinois, distributor | 18.24% | ██████████ |
Bars scaled so the largest value is ten blocks. Sources as above.
14.29%
The per-ton premium at which UAN32 and UAN28 cost exactly the same per pound of nitrogen. It is set by the grades and never moves. Every argument about which solution is cheaper is an argument about which side of this line today's quotes fall on. (Crop Root Zone calculation: 640 lb N/ton ÷ 560 lb N/ton.)
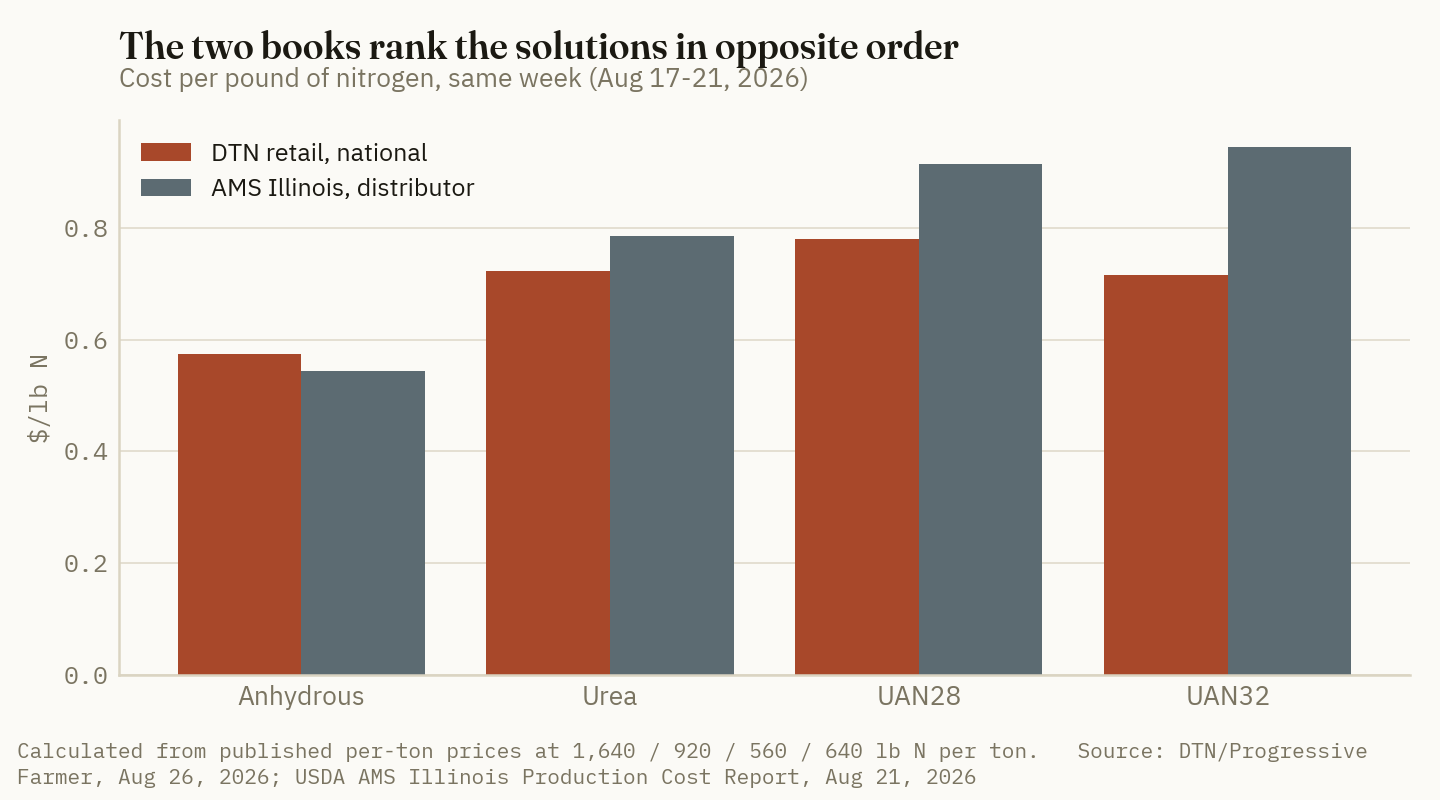
Ground Truth: This is the useful part, and it survives whatever happens to nitrogen prices between now and the fall order. You do not need to track two series and two per-pound conversions. You need one division: divide the UAN32 ask by the UAN28 ask from the same seller on the same day. Under 1.143, take the 32. Over it, take the 28. Any comparison drawn from two different sellers, two different bases, or two different weeks is not answering your question — as the table above demonstrates, using two perfectly legitimate books.
3. One of the two lines is a single quote, and it is the one that flips the answer
What's new: The AMS Illinois report publishes a low, a high and a weighted average for each product. For UAN28 on August 21 it published a range of $425.00 to $585.00 with an average of $511.67 — a $160 spread across reporting distributors. For UAN32 it published $605.00 flat: no range, average equal to the single figure, and a change of 0.00 from the prior report.
Evidence: A flat line with no spread in a report that otherwise carries ranges of $120 to $295 is a thin line, not a stable one. Compare the dispersion the same report shows on its other synthetic products that week.
| Product | Low | High | Average | Spread ($) | Spread as % of low |
|---|---|---|---|---|---|
| Anhydrous ammonia | 820.00 | 1,050.00 | 890.00 | 230.00 | 28.0% |
| DAP (18-46-0) | 840.00 | 960.00 | 917.22 | 120.00 | 14.3% |
| MAP (11-52-0) | 840.00 | 985.00 | 935.00 | 145.00 | 17.3% |
| Potash (0-0-62) | 460.00 | 550.00 | 499.58 | 90.00 | 19.6% |
| Urea (46-0-0) | 595.00 | 890.00 | 722.00 | 295.00 | 49.6% |
| UAN28 (28-0-0) | 425.00 | 585.00 | 511.67 | 160.00 | 37.6% |
| UAN32 (32-0-0) | 605.00 | 605.00 | 605.00 | 0.00 | 0.0% |
Source: USDA AMS Illinois Production Cost Report (bi-weekly), Fri Aug 21, 2026. Distributor ask, F.O.B., dollars per ton. Spread columns calculated.
Now run the break-even test against the ends of the UAN28 range rather than its average, holding the single UAN32 quote fixed:
- Against the low UAN28 ask of $425/ton — $0.759/lb N — the $605 UAN32 quote is 24.6% dearer per pound of nitrogen. UAN28 wins decisively.
- Against the high UAN28 ask of $585/ton — $1.045/lb N — the same UAN32 quote is 9.5% cheaper per pound. UAN32 wins decisively.
Both answers are available inside one state, on one day, from the same published report. The average produced one of them; the range contains both.
Ground Truth: The Illinois "inversion" is real as published and should not be dismissed, but it rests on a line with a sample of one. Treat it as evidence that the answer is local, not as evidence that UAN32 has become the expensive solution in the Corn Belt. The defensible reading is narrower and more useful than either headline: at a 5% per-ton premium the 32 is clearly the better buy, at an 18% premium it clearly is not, and both premiums were being quoted somewhere in the third week of August.
4. What this does to the fall solution order
What's new: Neither solution is competitive with anhydrous on either book, and that gap is the larger fact sitting behind this whole comparison. On the Illinois distributor book anhydrous costs $0.543/lb N against $0.945 for UAN32 — the solution costs 74% more per pound of nitrogen. On the national retail book the same comparison is $0.575 against $0.716, a 24% premium. The solutions are bought for application flexibility, in-season timing, and the ability to run them through equipment that will not handle anhydrous. They are not bought on nitrogen cost, and at these spreads no arithmetic makes them look like they are.
Evidence: At a 180 lb N/acre program, the two books price the four products this way:
| Product | DTN retail $/acre at 180 lb N | AMS Illinois $/acre at 180 lb N |
|---|---|---|
| Anhydrous ammonia | 103.46 | 97.68 |
| Urea | 129.91 | 141.26 |
| UAN28 | 140.14 | 164.47 |
| UAN32 | 128.81 | 170.16 |
Calculated from the per-pound figures in Section 1 at a flat 180 lb N/acre. Product cost only — no application, no stabilizer, no in-season split, and no allowance for the differing loss risk between fall anhydrous and spring solution. Sources as in Section 1.
The spread between the cheapest and dearest nitrogen at that rate is $36.68/acre on the retail book and $72.48/acre on the Illinois distributor book. Both are larger than the $22-per-ton retail gap between UAN28 and UAN32 that this article has spent three sections on — which is the correct proportion to leave with.
Ground Truth: The 28-versus-32 question is worth about $6 to $11 an acre on these numbers. The solution-versus-anhydrous question is worth $25 to $72. If the fall plan is already committed to solutions for equipment or timing reasons, run the 1.143 test on your own two quotes and take the winner. If it is not committed, the ratio in this article is the second-order decision, and the first-order one is on the table above.
References
- DTN/Progressive Farmer, "UAN28 Leads Fertilizer Price Declines for Fifth Consecutive Week," Aug 26, 2026 — retail fertilizer survey, week of Aug 17–21, 2026. https://www.dtnpf.com/agriculture/web/ag/crops/article/2026/08/26/uan28-leads-fertilizer-price-fifth
- USDA Agricultural Marketing Service, Livestock, Poultry, and Grain Market News, Illinois Production Cost Report (Bi-weekly), Fri Aug 21, 2026 — AMS_3195. https://www.ams.usda.gov/mnreports/ams_3195.pdf
- DTN/Progressive Farmer, "5 Fertilizer Prices Slightly Lower Than Last Month; 3 Higher," Aug 19, 2026 — prior-week retail survey, used for the month-over-month context. https://www.dtnpf.com/agriculture/web/ag/crops/article/2026/08/19/5-fertilizer-prices-slightly-lower-3
Disclosures
Crop Root Zone is an independent publication. Nothing here is investment advice. Market calls, where included, reflect the editors' own read and are not a recommendation to buy or sell any security.
Retail Urea Fell 5% Last Month. The Barge It Comes From Rose 5.4% in the Same Month.
Six of eight retail nutrients are lower, but the wholesale leg turned up three weeks ago — the fall prepay decision is being made on a price that is already stale.
Six of the eight fertilizers DTN tracks came in lower this week than a month ago, with UAN28 down 8 percent to $428/ton and urea down 5 percent to $655/ton (DTN/Progressive Farmer, Sep 2, 2026). Over the same four weeks the wholesale urea benchmark moved the other way, closing at $440/T on September 1 — up 5.39 percent on the month and 9.73 percent on the year (Trading Economics, Sep 1, 2026). Both numbers are real, both are current, and they point in opposite directions. The gap is not a contradiction; it is the retail lag, and it is arriving at exactly the moment growers are being quoted fall prepay.
1. What the September 2 print actually says
What's new: DTN's retail survey, covering the fourth week of August (Aug 24–28), shows nitrogen leading the decline and phosphate as the only category higher. UAN28 fell 8 percent and urea 5 percent — the two DTN singles out as leading the move lower. Anhydrous, UAN32, potash and 10-34-0 were each "slightly" lower, DTN's label for a month-over-month move under 5 percent. DAP and MAP were slightly higher.
Evidence: The full board, with the year-over-year column, which is where the picture changes:
| Nutrient | $/ton | MoM | YoY | Basis |
|---|---|---|---|---|
| MAP | 959 | +slight | +5% | Delivered, retail |
| Anhydrous | 923 | −slight | +21% | Delivered, retail |
| DAP | 918 | +slight | +7% | Delivered, retail |
| 10-34-0 | 715 | −slight | +7% | Delivered, retail |
| Urea | 655 | −5% | +4% | Delivered, retail |
| Potash | 493 | −slight | +2% | Delivered, retail |
| UAN32 | 458 | −slight | −5% | Delivered, retail |
| UAN28 | 428 | −8% | +2% | Delivered, retail |
Source: DTN/Progressive Farmer retail fertilizer survey, Sep 2, 2026, covering Aug 24–28, 2026.
Note what the two columns disagree about. Every nitrogen form except UAN32 is cheaper than last month and more expensive than last year. Anhydrous is the extreme case: down on the month, still 21 percent above where it sat in late August 2025. A grower reading only the monthly column sees a falling market. A grower reading only the annual column sees an expensive one. Both columns are describing the same $923.
Ground Truth: The month-over-month column is the one that gets quoted in the coffee shop and it is the one with the shortest memory. On a nutrient that has moved 21 percent in a year, a 4-percent monthly decline is noise inside the trend, not a reversal of it. Price the fall program against the annual column and treat the monthly column as timing information only.
2. The wholesale leg turned three weeks ago
What's new: The benchmark urea price closed at $440/T on September 1, up 0.23 percent on the day, 5.39 percent on the month and 9.73 percent on the year (Trading Economics, Sep 1, 2026). The provider's own twelve-month forward view is $493.44/T — 12 percent above spot.
Evidence: Put the two series side by side over the same window and the direction of each is unambiguous.
| Series | Level | Monthly change | Yearly change | What it measures |
|---|---|---|---|---|
| Retail urea (DTN) | $655/ton | −5% | +4% | Delivered to the farm gate |
| Benchmark urea | $440/T | +5.4% | +9.7% | Wholesale, traded |
Sources: DTN/Progressive Farmer, Sep 2, 2026; Trading Economics urea benchmark, Sep 1, 2026. Units differ — $/short ton delivered against $/metric tonne wholesale — so read the direction and the percentage, not the spread.
The two are not the same instrument and the levels are not comparable: one is a delivered retail average in short tons, the other a traded wholesale quote in metric tonnes. What is comparable is the sign. Retail spent August passing along a wholesale decline. Wholesale spent August going up.
+5.4% / −5%
The wholesale urea benchmark's one-month change against retail urea's one-month change, measured over the same four weeks and reported one day apart. (Trading Economics, Sep 1, 2026; DTN/Progressive Farmer, Sep 2, 2026)
3. Why retail is always the last to know, and how long it usually takes
What's new: The mechanism is inventory, not conspiracy. A retailer's fall offer reflects the barges and rail cars already in the tank and the shed — product bought weeks ago at weeks-ago prices — plus a margin. When wholesale falls, retail follows down as old inventory is sold through. When wholesale rises, retail holds until the cheap inventory is gone.
Evidence: The asymmetry is visible in this year's own numbers. World urea fell far harder and far faster than US retail did through the spring and early summer, and only a fraction of that decline reached the farm gate. The same friction now runs in reverse: the retail urea print is $655 and falling while the barge is $440 and rising, and the retail number will keep falling for as long as the pre-turn inventory lasts.
The three nitrogen forms do not lag equally, because they do not sit in the same kind of storage:
| Form | Retail $/ton | $/lb N | How it reaches the farm |
|---|---|---|---|
| Anhydrous | 923 | 0.56 | Pressurized retail tanks, long dwell |
| Urea | 655 | 0.71 | Dry shed, moderate dwell |
| UAN32 | 458 | 0.72 | Liquid tank, moderate dwell |
| UAN28 | 428 | 0.76 | Liquid tank, moderate dwell |
Source: DTN/Progressive Farmer, Sep 2, 2026. $/lb N as published by DTN.
Anhydrous carries the longest physical dwell of the three and the largest year-over-year premium still intact. That is the form most likely to be quoted off a stale wholesale basis in either direction.
Ground Truth: The retail lag is not a reason to wait. It is a reason to know which side of the turn you are on. Right now the lag is working for the buyer — retail is still marking down against a wholesale market that stopped falling — and that window closes when the cheap inventory clears, not on a date anyone publishes. If a retailer will fix a fall anhydrous or urea price for delivery, the falling-retail/rising-wholesale configuration is the one in which fixing pays. Ask for the fixed price in writing with the delivery window named; a quote that floats to invoice gives you none of the benefit of the lag and all of the exposure to its ending.
4. What this costs on the acre, and what to watch next
What's new: Translating the board into a nitrogen program makes the size of the decision concrete. A 180 lb N/acre corn program costs what the form costs, and the spread between the cheapest and dearest form on today's board is $0.20/lb N.
Evidence: Nitrogen cost per acre at 180 lb N, using DTN's own $/lb N figures:
| Form | $/lb N | $/acre at 180 lb N | |
|---|---|---|---|
| UAN28 | 0.76 | 136.80 | ██████████ |
| UAN32 | 0.72 | 129.60 | █████████ |
| Urea | 0.71 | 127.80 | █████████ |
| Anhydrous | 0.56 | 100.80 | ███████ |
Source: Crop Root Zone calculation from DTN/Progressive Farmer $/lb N figures, Sep 2, 2026. Nutrient cost only — excludes application, equipment, inhibitor and any loss differential between forms.
That is a $36/acre span across four ways of buying the same element, before a single agronomic difference is counted. On 1,000 acres it is $36,000. The form decision is larger than the month's price move in every one of these products.
Three things decide where retail goes from here, and all three are watchable:
- Whether the wholesale rise holds. One month of +5.4 percent after a long decline is a turn, not a trend. A second month confirms it.
- How fast retail inventory clears. Fall ammonia demand is the clearing mechanism. A wet fall that shortens the application window leaves inventory in the tank and keeps retail soft into spring; a dry, long fall empties it and lets the wholesale rise through.
- Phosphate, which is already through. DAP and MAP were the only two nutrients higher this month and are 7 and 5 percent above last year. The P side of the fall program is not lagging — it has already repriced.
Ground Truth: Split the fall decision by nutrient rather than making one call on "fertilizer." Nitrogen is on the favourable side of a lag that is closing. Phosphate is on the far side of a rise that has already happened, which means waiting on P is a bet on the Chinese export picture rather than on the lag. Those are two different bets and there is no reason to place them together just because they arrive on one invoice.
References
- DTN/Progressive Farmer, "Fertilizer Prices Fall as UAN28, Urea Lead the Way Lower," Sep 2, 2026 — retail survey for Aug 24–28, 2026. https://www.dtnpf.com/agriculture/web/ag/news/crops
- Trading Economics, urea benchmark price, quote dated Sep 1, 2026. https://tradingeconomics.com/commodity/urea
- DTN/Progressive Farmer, "UAN28 Leads Fertilizer Price Declines for Fifth Consecutive Week," Aug 26, 2026. https://www.dtnpf.com/agriculture/web/ag/crops/article/2026/08/26/uan28-leads-fertilizer-price-fifth
- DTN/Progressive Farmer, "5 Fertilizer Prices Slightly Lower Than Last Month; 3 Higher," Aug 19, 2026. https://www.dtnpf.com/agriculture/web/ag/crops/article/2026/08/19/5-fertilizer-prices-slightly-lower-3
Disclosures
Crop Root Zone is an independent publication. Nothing here is investment advice. Market calls, where included, reflect the editors' own read and are not a recommendation to buy or sell any security.
Ammonium Sulfate Fell and Urea Rose in the Same Report, on the Same Day, From the Same Distributors
USDA's Inter-Mountain West panel marked AMS down $2.53 and urea up $8.25 on Aug 31. Back the nitrogen out at urea's own rate and the sulfur inside that ton prices at $0.58/lb — and the Pacific Northwest, quoting AMS $101 higher, lands within two cents of the same number.
USDA's Agricultural Marketing Service published the Inter-Mountain West Production Cost Report on Monday, Aug 31, covering the week ending Sep 4. On the same page, from the same distributor panel, quoted on the same F.O.B. basis and in the same dollars per short ton, ammonium sulfate was marked down $2.53 and urea up $8.25. Two nitrogen products, one report, opposite signs. That is the whole event, and it is smaller than it sounds — but what it exposes underneath is not.
1. What the report actually says
What's new: The Inter-Mountain West panel is a monthly distributor "ask" survey, so its change column is a month-over-month move, not a weekly one. Five synthetic fertilizer lines carried a price this issue. Three moved; two did not.
Evidence: The full synthetic fertilizer panel, verbatim from the report:
| Product | Range, $/ton | Average | Change | Basis |
|---|---|---|---|---|
| Ammonium Sulfate | 625.00 – 780.00 | 684.80 | (2.53) | Distributor ask, F.O.B. |
| Urea (46-0-0) | 765.00 – 1,000.00 | 891.25 | 8.25 | Distributor ask, F.O.B. |
| MAP (11-52-0) | 1,000.00 – 1,250.00 | 1,089.80 | 6.63 | Distributor ask, F.O.B. |
| Potash (Red 0-0-60) | 600.00 – 750.00 | 662.50 | (1.50) | Distributor ask, F.O.B. |
| Liquid Nitrogen (32-0-0) | 710.00 – 900.00 | 776.67 | 0.00 | Distributor ask, F.O.B. |
Source: USDA AMS, Inter-Mountain West Production Cost Report (Monthly), report 3883, issued Mon Aug 31, 2026, week ending 09/04/2026.
The two phosphate-and-nitrogen lines rose, potash slipped, UAN32 held, and ammonium sulfate was the only nitrogen product marked lower. In percentage terms the moves are small: AMS −0.37% against a prior average of $687.33, urea +0.93% against $883.00.
The honest caveat first, because it governs how much weight the sign can carry. This is one regional distributor-ask panel, F.O.B., in the inland West. It is not a benchmark, it is not a wholesale print, and it is not a barge or terminal assessment. A reader who takes a $2.53 move in a monthly ask survey as a market signal has over-read it. What makes the issue worth writing about is not the size of the move — it is that the move had a direction, and that the direction was opposite to the nitrogen line quoted three rows down from it.
Ground Truth: Treat the sign, not the size. A 0.37% decline in a monthly ask survey tells you nothing about where ammonium sulfate trades. It tells you that at least one distributor in this panel re-quoted the product downward in a month when the same distributors re-quoted urea upward — which is a statement about the spread, and the spread is the only part of this report that is worth a decision.
2. The move is small against the report's own dispersion — and that matters more than the move
What's new: The change column and the range column in this report are on wildly different scales, and reading the first without the second is the standard way to misuse a USDA production cost report.
Evidence: The ammonium sulfate line is quoted at $625.00 to $780.00. That is a $155 spread on a $684.80 average — 22.6% of the mean. The month's move was $2.53.
| Line | Range width, $/ton | Range as % of average | This month's change | Change as % of range |
|---|---|---|---|---|
| Ammonium Sulfate | 155.00 | 22.6% | (2.53) | 1.6% |
| Urea (46-0-0) | 235.00 | 26.4% | 8.25 | 3.5% |
| MAP (11-52-0) | 250.00 | 22.9% | 6.63 | 2.7% |
| Potash (Red 0-0-60) | 150.00 | 22.6% | (1.50) | 1.0% |
| Liquid Nitrogen (32-0-0) | 190.00 | 24.5% | 0.00 | 0.0% |
Source: USDA AMS report 3883, Aug 31, 2026; range-width and percentage columns calculated by Crop Root Zone from the report's own figures.
Every line in this panel carries a quoted range between 22% and 27% of its own average. The month's largest move — urea's $8.25 — is 3.5% of urea's range. The smallest, potash's $1.50, is 1.0% of potash's.
The Pacific Northwest panel is worse, and it is worth showing because it is the only other USDA production cost report that carries an ammonium sulfate line at all:
| Region | AMS range, $/ton | AMS average | Range as % of average |
|---|---|---|---|
| Inter-Mountain West (Aug 31) | 625.00 – 780.00 | 684.80 | 22.6% |
| Pacific Northwest (Aug 21) | 600.00 – 1,110.00 | 786.00 | 64.9% |
Source: USDA AMS reports 3883 (Mon Aug 31, 2026) and 3657, Pacific Northwest Production Cost Report (Bi-Weekly), Fri Aug 21, 2026.
In the Pacific Northwest, the highest ammonium sulfate ask is 85% above the lowest one, from distributors surveyed in the same region in the same fortnight.
Ground Truth: In a panel where the quoted range is 23% of the mean and the monthly move is 0.4%, "the price changed" and "a different set of distributors answered the phone" produce the same number. You cannot separate them from the report, and nobody should pretend otherwise. What you can do is stop treating the change column as the interesting part of the document. The range column is where the information is, and the range column says that in the inland West you are negotiating a $155 band on ammonium sulfate — which is sixty-one times the size of the move that made this issue notable.
3. Back the nitrogen out and the sulfur appears
What's new: Ammonium sulfate is 21-0-0-24S. It sells nitrogen and it sells sulfur, and the price of the ton conflates them. If you value the nitrogen at the rate the same report implies for straight nitrogen, the residual is what that panel is charging for sulfur in a spreadable, sulfate, immediately plant-available granule.
Evidence: The arithmetic is simple enough to check by hand. One short ton of AMS at 21-0-0-24S contains 420 lb of N and 480 lb of S. One short ton of urea at 46-0-0 contains 920 lb of N.
| Step | Inter-Mountain West (Aug 31) | Pacific Northwest (Aug 21) |
|---|---|---|
| Urea, $/ton | 891.25 | 1,099.80 |
| Implied nitrogen, $/lb N | 0.96875 | 1.19543 |
| × 420 lb N in a ton of AMS | 406.88 | 502.08 |
| Ammonium sulfate, $/ton | 684.80 | 786.00 |
| Residual attributable to sulfur | 277.92 | 283.92 |
| ÷ 480 lb S per ton | — | — |
| Implied sulfur, $/lb S | 0.5790 | 0.5915 |
| Implied sulfur, $/short ton S | 1,158.02 | 1,182.99 |
Source: Nutrient decomposition calculated by Crop Root Zone from USDA AMS reports 3883 (Aug 31, 2026) and 3657 (Aug 21, 2026). Grades per standard product analysis: AMS 21-0-0-24S, urea 46-0-0.
Now put the two regions next to each other on the headline numbers, and then on the derived one:
| Comparison | Inter-Mountain West | Pacific Northwest | Gap |
|---|---|---|---|
| Ammonium sulfate, $/ton | 684.80 | 786.00 | +14.8% |
| Urea, $/ton | 891.25 | 1,099.80 | +23.4% |
| Implied sulfur, $/lb S | 0.5790 | 0.5915 | +2.2% |
Source: Calculated by Crop Root Zone from USDA AMS reports 3883 and 3657.
Two regions, two survey dates eleven days apart, quoting ammonium sulfate 14.8% apart and urea 23.4% apart — and pricing the sulfur inside the AMS ton within two cents a pound of each other.
$0.58/lb
The sulfur inside a ton of Inter-Mountain West ammonium sulfate, after the nitrogen is valued at that same report's urea price. The Pacific Northwest, quoting AMS $101.20/ton higher, implies $0.59. (Calculated from USDA AMS reports 3883, Aug 31, 2026 and 3657, Aug 21, 2026)
This is the finding, and it is worth stating carefully. Two survey panels that disagree violently about the level of nitrogen agree almost exactly about the value of sulfur. That is not what you would expect if the AMS price gap were a sulfur-supply story. It is exactly what you would expect if the AMS price gap were a nitrogen story that ammonium sulfate is carrying along for the ride.
Ground Truth: The 14.8% regional spread in ammonium sulfate is a nitrogen spread wearing a sulfur label. If you buy AMS in the Pacific Northwest and it costs $101 a ton more than it does in the inland West, $95 of that is the nitrogen and about $6 is the sulfur. So the buying decision is not "where is sulfur cheap" — it is "does my nitrogen source of record already cost me $1.20 a pound, and if so, is AMS the cheapest sulfur I can get given that." Those are different questions with different answers, and the ton price cannot tell them apart.
4. What that implied sulfur number is, and is not, worth comparing to
What's new: Molten sulfur into Tampa — the feedstock, not the fertilizer — settled its third-quarter 2026 contract at a record $705 per long ton delivered, up $50/lt from the second quarter's $655/lt, an 8% rise (Argus Media, Jul 13, 2026). That contract is the raw material at the front of the chain. The $0.58/lb above is the finished, granulated, spreadable, distributor-margined product at the back of it.
Evidence: Converted to a common basis:
| Sulfur, delivered how | $/short ton of contained S | |
|---|---|---|
| Molten sulfur, Tampa 3Q-2026 contract | 629.46 | ██████ |
| Implied inside AMS, Inter-Mountain West | 1,158.02 | ██████████ |
| Implied inside AMS, Pacific Northwest | 1,182.99 | ██████████ |
Source: Tampa contract per Argus Media, Jul 13, 2026 ($705/long ton delivered, converted at 2,240 lb/lt). AMS-implied values calculated by Crop Root Zone from USDA AMS reports 3883 and 3657.
The inland-West AMS ton implies sulfur at 1.84 times the Tampa molten contract; the Pacific Northwest at 1.88 times.
Do not read that ratio as a margin. It is not. Between molten sulfur at a Gulf terminal and a granule in a spreader box sits oxidation or acid manufacture, ammonia, granulation, bagging or bulk handling, rail or truck freight of one to two thousand miles, storage, and two layers of distribution. A finished-product multiple of 1.8× on a bulk feedstock is unremarkable. What is useful is the stability of the multiple across two regions that agree on nothing else — which is the same result as section 3, arrived at from the other end.
The forward-looking caution is real and cuts against the headline. Argus's own 2026 viewpoint argued that sulfur costs would support ammonium sulfate prices through the year (Argus Media, Dec 2025). The Q3 Tampa contract then set a record, and it is fixed through Sep 30 regardless of where spot sulfur trades. So the feedstock leg of the AMS cost stack is locked, at a record, for another four weeks — while one regional distributor panel just marked the finished product down $2.53.
Ground Truth: A locked, record feedstock contract and a softening finished-product ask cannot both persist. One of them is going to give, and the Tampa contract is the one that cannot move until Oct 1. That makes the next Tampa settlement — not the next production cost report — the number that decides whether the inland-West mark was noise or the leading edge of something. If Q4 Tampa settles down, the $2.53 was early. If Q4 settles up again, the $2.53 was a distributor rotating out of the panel, and the AMS-to-urea spread compresses from the nitrogen side instead.
5. What a buyer should actually take from this
What's new: Nothing in this report changes a fall program. What it changes is which number you should be negotiating against.
Evidence: Three things are simultaneously true in the Aug 31 panel, and they point at the same practical conclusion:
- The range is the negotiation. $625 to $780 on ammonium sulfate. A buyer paying the average is paying $59.80 more than a buyer at the bottom of the band, which dwarfs every month-over-month move in the report by a factor of more than twenty.
- The sulfur is priced consistently and the nitrogen is not. Across the only two USDA panels that quote AMS, sulfur implies within 2.2% and nitrogen diverges by 23.4%. So the leverage in an AMS negotiation is on the nitrogen leg.
- Ammonium sulfate is only quoted in the West. Neither the Illinois nor the Alabama production cost report carries an ammonium sulfate line at all (USDA AMS reports 3195, Aug 21, 2026 and 3051, Aug 28, 2026). Corn Belt and Southeast buyers have no USDA reference price for this product, which is a real gap and not a small one.
Point three deserves saying plainly, because it is the most actionable fact in this piece for the largest number of readers. If you farm in Illinois or Alabama and you buy ammonium sulfate for sulfur, there is no public USDA price series for what you are buying. The nearest ones are an inland-West monthly ask and a Pacific Northwest bi-weekly ask, both at the wrong freight, both with ranges over 22% of their own means.
Ground Truth: The absence is the story for most readers. A Corn Belt buyer benchmarking ammonium sulfate against the Inter-Mountain West number is benchmarking against a Rocky Mountain distributor ask carried across a thousand miles of freight that is not in the quote. The defensible move is to stop benchmarking the product and start benchmarking the sulfur — take your local urea or UAN quote, value your nitrogen off it, and back into what your AMS supplier is charging you per pound of S. If that lands materially above $0.58–0.59/lb, you are paying a freight and distribution premium that two USDA panels a thousand miles apart both decline to charge.
References
- USDA Agricultural Marketing Service, Inter-Mountain West Production Cost Report (Monthly), report 3883, issued Mon Aug 31, 2026, report for week ending 09/04/2026 — https://mymarketnews.ams.usda.gov/viewReport/3883
- USDA Agricultural Marketing Service, Pacific Northwest Production Cost Report (Bi-Weekly), report 3657, issued Fri Aug 21, 2026 — https://mymarketnews.ams.usda.gov/viewReport/3657
- USDA Agricultural Marketing Service, Illinois Production Cost Report (Bi-weekly), report 3195, issued Fri Aug 21, 2026 — https://mymarketnews.ams.usda.gov/viewReport/3195
- USDA Agricultural Marketing Service, Alabama Production Cost Report (Weekly), report 3051, issued Fri Aug 28, 2026 — https://mymarketnews.ams.usda.gov/viewReport/3051
- Argus Media, "Tampa 3Q liquid sulphur price hits record $705/lt," Jul 13, 2026 — https://www.argusmedia.com/en/news-and-insights/latest-market-news/2851577-tampa-3q-liquid-sulphur-price-hits-record-705-lt
- Argus Media, "Viewpoint: Sulfur costs to support amsul prices in 2026," Dec 2025 — https://www.argusmedia.com/en/news-and-insights/latest-market-news/2770651-viewpoint-sulfur-costs-to-support-amsul-prices-in-2026
Disclosures
Crop Root Zone is an independent publication. Nothing here is investment advice. Market calls, where included, reflect the editors' own read and are not a recommendation to buy or sell any security.
The Revenue Guarantee You Bought in February Is Tracking 16% Higher Than the Price It Was Written On
December corn settled at $5.36¾ against a $4.62 projected price, so October — not February — will set the corn revenue guarantee, and the growers who dropped the harvest price option to save premium gave that away.
Corn's December 2026 contract settled at 536¾ cents on Sep 4, 2026 (Brownfield Ag News, Sep 4, 2026). The projected price on which every 2026 corn revenue policy was written is $4.62 (American Farm Bureau Federation, Mar 3, 2026). That is a gap of 74¾ cents, or 16.2%, and it is pointed in the direction that most growers, most years, do not plan for.
The consequence is mechanical and it arrives in about three weeks. Revenue Protection guarantees are set on the higher of the projected price or the harvest price. The harvest price for corn is the October average of December-contract settlements. If October averages anything close to where the contract is now, the guarantee that has been sitting on the books since spring gets rewritten upward before a single bushel is settled.
1. The two prices, and which one is about to govern
What's new: The 2026 spring prices were finalized in March at $4.62 for corn, $11.09 for soybeans and $6.19 for wheat — corn down 1.7% from the prior year's $4.70, soybeans up 5.2% from $10.54, wheat down 5.5% from $6.55 (AFBF, Mar 3, 2026). Those numbers came out of February's average of the December corn and November soybean CBOT settlements.
Evidence: The same contract that produced the February average is now trading substantially above it. Corn futures reached 2026 highs during the late-August and early-September run, with December settling at 536¾ on Sep 4 before easing as traders took profits; the market has been supported by reported Chinese interest in US agricultural purchases and by expectations of large new-crop sales (Brownfield Ag News, Sep 4, 2026; Trading Economics, Sep 2026).
| Crop | 2026 projected price | Prior year projected | Current contract | Gap to projected |
|---|---|---|---|---|
| Corn | $4.62 | $4.70 | $5.36¾ (Dec 26, Sep 4) | +$0.74¾ (+16.2%) |
| Soybeans | $11.09 | $10.54 | — | — |
| Wheat | $6.19 | $6.55 | — | — |
Source: American Farm Bureau Federation Market Intel, Mar 3, 2026; Brownfield Ag News closing futures, Sep 4, 2026. Gap is derived.
The mechanism is worth stating precisely because it is routinely described backwards. The harvest price option does not pay a grower more money for a better price. It raises the revenue guarantee, which only matters if production comes in short. A full crop at a high price collects nothing from it. A short crop at a high price collects considerably more than it would have.
Ground Truth: The harvest price option is sold, and bought, as insurance against a price collapse between spring and fall — protection for the grower who forward-contracted bushels they then failed to grow. That framing is exactly upside-down this year. In 2026 the option's value is coming from the guarantee side: it converts a yield shortfall into a materially larger indemnity because the market went up, not down. Growers who dropped to a harvest-price-exclusion policy to save premium made a rational bet on a flat market and are on the wrong side of it.
2. What it is worth per acre
What's new: The arithmetic is straightforward and worth running rather than gesturing at. The revenue guarantee is APH yield × coverage level × price.
Evidence: Take a 180-bushel APH, which is close to a mainstream Corn Belt number, and run it at each coverage level against both prices. The right-hand column is what the harvest price option is currently worth per acre — not as a payment, but as additional guarantee standing behind the crop.
| Coverage | Guarantee at $4.62 | Guarantee at $5.36¾ | Difference |
|---|---|---|---|
| 70% | $582.12 | $676.31 | +$94.19 |
| 75% | $623.70 | $724.61 | +$100.91 |
| 80% | $665.28 | $772.92 | +$107.64 |
| 85% | $706.86 | $821.23 | +$114.37 |
Derived from a 180 bu/acre APH at the AFBF-reported $4.62 projected price and the Sep 4, 2026 December corn settlement of $5.36¾. Not a quote of either agency figures or a specific policy; run your own APH.
+$107.64/acre
Additional revenue guarantee at 80% coverage on a 180-bushel APH if October's harvest price lands where December corn settled on Sep 4. Derived figure. (Derived from AFBF, Mar 3, 2026 and Brownfield Ag News, Sep 4, 2026)
Scale that mentally rather than on the page. On a thousand corn acres at 80% coverage, the difference between the February price and the current futures level is roughly $107,000 of guarantee. That is not money in hand — most of it is only reachable through a yield shortfall — but it is the size of the position that gets settled in October by an average nobody controls.
| Where the guarantee comes from | 80% cov., 180 APH | |
|---|---|---|
| Guarantee at projected price | $665.28 | ████████ |
| Guarantee at Sep 4 futures | $772.92 | ██████████ |
Derived; see basis note above.
3. Why it lands on this crop in particular
What's new: The corn crop it lands on is not a good one. NASS rated corn 57% good-to-excellent as of Aug 30, 2026, unchanged on the week and twelve points below last year's 69% (USDA/DTN, Aug 31, 2026).
Evidence: Development, by contrast, is running slightly ahead of normal. Corn dough was 92% against an 89% five-year average, dented 62% against 56%, and mature 13% against a steady five-year average and one point behind last year (USDA, week ending Aug 30, 2026).
| Corn, week ending Aug 30, 2026 | 2026 | Last year | 5-yr avg |
|---|---|---|---|
| Good-to-excellent | 57% | 69% | — |
| Dough | 92% | 89% | 89% |
| Dented | 62% | 56% | 56% |
| Mature | 13% | 14% | 13% |
Source: USDA NASS Crop Progress, week ending Aug 30, 2026, via DTN, Aug 31, 2026.
That combination — development on schedule, condition twelve points off — is the specific shape that makes a harvest-price year matter. A crop that is late has a weather risk still ahead of it and a market that is still pricing that risk. A crop that is on time but rated poorly has already taken its damage; what remains is the count. The yield shortfall, if there is one, is largely determined and will be revealed rather than avoided.
Ground Truth: A high harvest price and a below-average crop is the one combination in which revenue insurance does its most expensive work, and it is also the combination in which a grower's own marketing decisions interact with it worst. Bushels sold forward at spring prices against a crop that will not fill the contract have to be bought back into a market up 16%. The insurance guarantee rises in the same direction, which is the design working — but only for a policy that still carries the harvest price provision, and only up to the coverage level actually purchased.
4. What to do with the next three weeks
The October discovery period is not something to be managed; it is an average of settlements. But three things around it are decisions, and they are live now.
Know which policy you actually hold. Revenue Protection and Revenue Protection with Harvest Price Exclusion look nearly identical on a summary page and differ by exactly the provision that matters this year. The distinction is worth confirming in writing rather than from memory, because the premium saving that motivated it was small and the gap it opens in a year like this is not.
Recount unpriced bushels against a realistic yield, not the APH. The relevant number is not what the guarantee will be; it is the difference between bushels already committed and bushels the field will actually produce. That gap is what gets bought back, and it gets bought back at a price the October average is currently tracking.
Treat the guarantee as a floor rather than a forecast. A rising harvest price is not a prediction that cash corn will be strong at delivery; basis, storage and local logistics do their own work, and the December contract is not the bid at the elevator. The guarantee is a revenue floor set by a futures average. It should not be read as a marketing signal.
There is a broader observation buried in this year's numbers. The AFBF's March assessment was that 2026 projected prices sat below estimated break-even levels, implying continued margin pressure (AFBF, Mar 3, 2026). A 16% futures rally has not made 2026 a good year — it has partially repaired a guarantee that was written below cost of production in the first place. That is worth keeping in view when the October number is announced and reads as good news.
5. What would change this read
The harvest price is an October average, and it is roughly three-quarters unwritten. Two paths would move it materially.
A resolution of the demand story that has driven the rally — reported Chinese purchase discussions and expectations of large new-crop sales — would take out the support that carried December corn above $5.30. Traders were already positioned for old-crop sales of up to 200,000 tonnes and new-crop sales of as much as 1.6 million tonnes (Trading Economics, Sep 2026). Sales that arrive at the low end remove a bid the market has partly priced.
The other path is the crop itself. Condition at 57% has been steady for two weeks; a September that turns the count better than the ratings implied would pressure price and shrink the shortfall at the same time, which is the one combination in which none of this matters.
References
- American Farm Bureau Federation Market Intel, "Risk Management Options for 2026: Corn, Soybeans and Wheat," Mar 3, 2026 — https://www.fb.org/market-intel/risk-management-options-for-2026-corn-soybeans-and-wheat
- Brownfield Ag News, "Closing Grain and Livestock Futures: September 4, 2026" — https://www.brownfieldagnews.com/market-news/closing-grain-and-livestock-futures-september-4-2026/
- USDA NASS Crop Progress, week ending Aug 30, 2026, reported via DTN/Progressive Farmer, "USDA Crop Progress: Corn Rated 57% Good to Excellent; Soybeans 58% Good to Excellent as of Aug. 30," Aug 31, 2026 — https://www.dtnpf.com/agriculture/web/ag/news/article/2026/08/31/usda-crop-progress-corn-rated-57-58
- USDA Risk Management Agency, price discovery and Revenue Protection provisions — https://www.rma.usda.gov/
- Trading Economics, corn commodity page, September 2026 — https://tradingeconomics.com/commodity/corn
Disclosures
Crop Root Zone is an independent publication. Nothing here is investment advice. Market calls, where included, reflect the editors' own read and are not a recommendation to buy or sell any security.
Corn's Old-Crop Book Lost 32.7 Million Bushels in a Week. It Also Shipped 659 Million More Than Last Year.
The net-reduction headline is a marketing-year-end artifact — 2025/26 closed August 31. The number that governs harvest basis is the 3.422 billion bushels already shipped, up 24%, against a soybean program that shipped 328 million fewer.
USDA's Foreign Agricultural Service reported a net reduction of 829,600 tonnes in 2025/26 corn export sales for the week ending August 27 — minus 32.7 million bushels, driven by cancellations that ran from 32,600 up to 721,400 tonnes against new sales of only 26,700 to 138,400 (USDA FAS, Sep 3, 2026). Read cold, that is the worst single weekly corn sales figure of the year. Read against the calendar, it is close to meaningless: the 2025/26 corn marketing year ended on August 31, four days after the week in question. Unshipped sales sitting on the books at a year boundary either roll into the new year or come off, and both show up in the same negative line. The number that actually describes the year is underneath it, and it is the largest corn export program in recent memory.
1. What the report said, and what part of it is real
What's new: The final full reporting weeks of a marketing year systematically produce negative net-sales prints. The mechanism is administrative, not commercial.
Evidence:
| Commodity | Week's net sales, 2025/26 | Bushel equivalent | Cumulative exports, 2025/26 | Prior year | Change |
|---|---|---|---|---|---|
| Corn | −829,600 t | −32.7 mbu | 3.422 bbu | 2.763 bbu | +23.9% |
| Soybeans | −94,200 t | −3.5 mbu | 1.538 bbu | 1.866 bbu | −17.6% |
| Soybean meal | +29,400 t | — | 18.002 mmt | 15.640 mmt | +15.1% |
| Wheat | +313,500 t | +11.5 mbu | 315.4 mbu | 456.3 mbu | −30.9% |
| Sorghum | −2,600 t | −0.1 mbu | 200.6 mbu | 70.3 mbu | +185.3% |
Source: USDA Foreign Agricultural Service, Weekly Export Sales, released Sep 3, 2026, for the week ending Aug 27, 2026. Wheat and soybean meal are on their own marketing years, which do not close August 31.
The corn cancellation is the largest line in the report and the least informative one. A sale that was booked in, say, March for shipment that never happened has to leave the 2025/26 ledger at the year boundary. Whether the physical business was lost or simply moved into 2026/27 is not visible in a net-sales number, and the report does not distinguish them.
The structure of the cancellation is worth reading closely, because it is unusually informative. USDA reported individual cancellations ranging from 32,600 up to 721,400 tonnes. The top of that range is 87% of the week's entire gross cancellation total. This was not a broad trimming across many buyers, which is what genuine demand deterioration looks like; it was one very large entry plus a tail.
| Cancellation profile, old-crop corn, week ending Aug 27 | Tonnes | Share of gross cancellations |
|---|---|---|
| Largest single cancellation reported | 721,400 | ~87% |
| Remaining cancellations, range | 32,600 and up | ~13% |
| Offsetting new sales, range | 26,700–138,400 | — |
| Net | −829,600 | — |
Source: USDA FAS, Weekly Export Sales, Sep 3, 2026. Share figures derived.
A single 721,400-tonne entry — 28.4 million bushels — arriving four days before a marketing year closes has a much higher prior probability of being a roll into 2026/27 than of being a buyer abandoning a corn program. Rolls and walk-aways are recorded identically, which is the limitation of the dataset rather than of the interpretation.
Ground Truth: A net-reduction print in the last two weeks of a marketing year should be read as a reconciliation, not a demand signal. The test of whether business was genuinely lost is whether it reappears in the new-crop column — and this week it did, at scale. The concentration of the cancellation in one large entry strengthens that read rather than weakening it: diffuse cancellations across many buyers would be the worrying shape, and this is the opposite shape.
2. The new-crop book took the handoff in the same week
What's new: 2026/27 corn sales for the week ending August 27 came in at 1,986,400 tonnes — 78.2 million bushels — with the destination list dominated by the two buyers that anchor US corn's structural demand.
Evidence:
| New-crop (2026/27) sales, week ending Aug 27 | Tonnes | Bushels | Lead destinations |
|---|---|---|---|
| Corn | 1,986,400 | 78.2 mbu | Mexico 665,000 t; Japan 371,800 t |
| Soybeans | 1,948,900 | 71.6 mbu | China 972,000 t; unknown 669,000 t |
| Soybean meal | 701,900 | — | Unknown 108,000 t; Germany 100,000 t; Netherlands 100,000 t |
| Sorghum | 600 | — | Japan |
Source: USDA FAS, Weekly Export Sales, Sep 3, 2026.
A 78.2 million bushel new-crop corn week against a 32.7 million bushel old-crop reduction is a net addition of 45.5 million bushels of forward commitment across the two years. The rotation went the right way, and it went there on feed demand — Mexico and Japan are livestock-feed destinations, not processing or reserve buyers.
| Crop year handoff, corn, week ending Aug 27 | Million bu | |
|---|---|---|
| 2026/27 new sales | 78.2 | ██████████ |
| 2025/26 net reduction | −32.7 | ████ |
| Net across both years | +45.5 | ██████ |
Source: derived from USDA FAS, Sep 3, 2026. Bar lengths scale absolute magnitude.
Ground Truth: The composition of that new-crop week matters more than its size. Mexico and Japan buying together, in the same week, in size, is the profile of buyers covering a feeding program rather than speculating on a price. Feed coverage bought this early tends to ship — it is not the kind of commitment that shows up as a cancellation eleven months later, which is exactly what the old-crop line was full of.
3. Two crops, one harvest, opposite export years
What's new: Corn finished its marketing year up 659 million bushels of shipments; soybeans finished down 328 million. Both crops are harvested by the same machines, into the same bins, over the same six weeks.
Evidence:
3.422 billion bu
2025/26 US corn exports — up 659 million bushels, or 24%, on the prior marketing year. (USDA FAS, Weekly Export Sales, Sep 3, 2026)
| Crop | 2025/26 exports | 2024/25 exports | Difference | |
|---|---|---|---|---|
| Corn | 3.422 bbu | 2.763 bbu | +659 mbu | ██████████ |
| Soybeans | 1.538 bbu | 1.866 bbu | −328 mbu | █████ |
Source: USDA FAS, Weekly Export Sales, Sep 3, 2026. Bar lengths scale absolute magnitude of change.
The soybean number carries an offset that the corn number does not: soybean meal exports ran 18.0 million tonnes against 15.6 million, up 15.1%. Beans that did not leave the country as beans left as meal. That is a substitution within the same crop, and it changes where the demand shows up — at a domestic processor rather than at an export elevator.
The sorghum line is the outlier of the report and deserves a sentence on its own. Cumulative sorghum exports of 200.6 million bushels against 70.3 million a year earlier is a 185% increase off a collapsed base, and sorghum competes with corn for both acres and feed demand.
Ground Truth: Going into harvest, corn and soybeans are not in the same position and should not be marketed as though they were. Corn ends its year with a drained pipeline and a new-crop book already loading feed destinations — conditions that historically support harvest basis at rail-served and Gulf-facing positions. Soybeans end their year having shipped 328 million fewer bushels while domestic crush took the difference, which concentrates the demand geographically rather than spreading it along the export chain. For a grower with both crops, the practical implication is that the location premium is likely to be worth more on beans this fall and the timing premium more on corn.
4. What to watch, and what would falsify this read
What's new: The next hard test of the read above arrives September 11, when USDA publishes its next World Agricultural Supply and Demand Estimates.
Evidence: Three specific things would change the interpretation:
| Watch item | Date | What would contradict the read above |
|---|---|---|
| WASDE export line, 2026/27 corn | Sep 11, 2026 | A cut to the forward export forecast despite the strong new-crop pace |
| First weeks of 2026/27 net sales | Weekly, from Sep 10 | New-crop corn weeks falling below ~40 mbu with Mexico absent |
| Soybean meal pace | Weekly | Meal exports rolling over, removing the crush offset for the bean shortfall |
Source: USDA FAS release schedule; USDA WASDE calendar.
The old-crop corn cancellations also leave one genuinely open question that this report cannot answer: how much of the 829,600 tonnes reappeared as 2026/27 business, and how much was a buyer walking away. The destination detail on the cancellations — 32,600 to 721,400 tonnes across multiple origins — implies at least one large single cancellation rather than a broad trimming, and a single large cancellation is more likely to be a roll than a loss.
Ground Truth: The most expensive mistake available in the next two weeks is treating the −32.7 million bushel print as evidence that corn demand broke. It closed a marketing year that shipped 24% more corn than the one before it. If the forward book keeps clearing 40 million bushels a week with feed destinations named, the correct posture into harvest is that corn has a demand base and a storage decision, not a demand problem.
References
- USDA Foreign Agricultural Service, Weekly Export Sales, released Sep 3, 2026 (week ending Aug 27, 2026). https://www.fas.usda.gov/data/weekly-export-sales
- Brownfield Ag News, "Feed demand fuels 26/27 corn, soybean meal export sales," Sep 3, 2026. https://www.brownfieldagnews.com/news/feed-demand-fuels-26-27-corn-soybean-meal-export-sales/
- USDA World Agricultural Outlook Board, World Agricultural Supply and Demand Estimates release schedule — next report Sep 11, 2026. https://www.usda.gov/oce/commodity/wasde
Disclosures
Crop Root Zone is an independent publication. Nothing here is investment advice. Market calls, where included, reflect the editors' own read and are not a recommendation to buy or sell any security.
A Mandate Is Bidding for 131 Million Bushels a Month. The Export Elevator Is Bidding for What's Left.
Meeting the 2026 RVO takes about 685,000 tonnes of soybean oil a month — roughly 57% of a record-rate crush, before anyone eats or feeds any of it. That is who the river terminal is competing against for the bushel coming off your combine.
Two buyers will bid for the soybeans coming out of the field over the next eight weeks, and for the first time in several seasons they are not in comparable condition. The export program has just closed a marketing year in which it shipped 1.538 billion bushels against 1.866 billion the year before — 328 million bushels fewer (USDA FAS, Sep 3, 2026). The domestic crush is running against an EPA renewable volume obligation, finalized at the end of March for 2026 and 2027, that is large enough to require US biodiesel and renewable diesel producers to run effectively at capacity, and it needs roughly 685,000 tonnes of soybean oil a month to be satisfied for the rest of the year (Argus Media, 2026). Those are not two versions of the same demand. One is a commercial book that shrank; the other is a volume written into a rule.
1. Converting the obligation into bushels
What's new: The RVO is stated in gallons and the soybean oil requirement in tonnes. Neither is the unit a grower delivers in. The conversion is straightforward and the result is large.
Evidence:
| Step | Value | Basis |
|---|---|---|
| Soybean oil to biofuels required, monthly | 685,000 t | Argus estimate to meet 2026 RVO |
| Same, in pounds | 1.510 billion lb | ×2,204.62 lb/t |
| Standard oil yield per bushel | 11.5 lb/bu | Industry-typical crush yield |
| Beans crushed to produce it, monthly | ~131 million bu | Derived |
| Record daily US crush rate | 7.65 million bu/day | February 2026 record |
| Implied monthly crush at that rate | ~230 million bu | ×30 days, derived |
| Obligation as a share of a record-rate crush | ~57% | Derived |
Sources: Argus Media, "US soy crush margins soar, set to remain high," 2026, for the 685,000 t/month figure; USDA ERS Oil Crops Outlook for the February 2026 record daily crush rate of 7.65 million bushels. Rows marked "Derived" are this publication's arithmetic at a standard 11.5 lb/bu oil yield, not published values.
Annualized, that is on the order of 1.58 billion bushels of soybeans whose oil is spoken for by a blending mandate before any of it competes on price with food, feed or export demand. The meal is a co-product of that crushing, which is why soybean meal exports ran 18.0 million tonnes in 2025/26 against 15.6 million the year before, up 15.1% — the meal has to go somewhere, and it went abroad.
685,000 t/month
Soybean oil required by the biofuels sector to meet the 2026 renewable volume obligation — about 131 million bushels of beans a month at a standard 11.5 lb/bu yield. (Argus Media, 2026; bushel conversion derived)
Ground Truth: A demand that comes from a rule behaves differently from a demand that comes from a customer. It does not shop for a cheaper origin, it does not defer a purchase because basis looks rich, and it does not disappear because the board rallied. What it does do is change on a policy date. The practical consequence for a fall delivery decision is that the processor bid is currently the less price-elastic of the two, which is exactly backwards from the historical assumption that the exporter sets the floor and the crush pays up when it needs to.
2. The capacity that arrives this year
What's new: The crush side is not merely running harder; it is physically larger. The American Soybean Association's tracking of announced and completed plant expansions puts 75 million bushels of annual capacity online in 2025 and a further 114 million bushels in 2026.
Evidence:
| Crush capacity coming online | Million bu/yr | |
|---|---|---|
| 2026 | 114 | ██████████ |
| 2025 | 75 | ███████ |
Source: American Soybean Association, Soybean Crush Expansion Update. New capacity must bid competitively for beans in its own draw area, which is the mechanism by which plant construction shows up as local basis.
New capacity does not improve basis everywhere. It improves basis inside the draw radius of the plant and, by pulling bushels out of the countryside, can leave positions outside that radius competing with a thinner local supply for the same rail or barge slot. A grower 40 miles from a new plant and a grower 200 miles from one are not in the same market this fall even if they are in the same county group on a state average.
Set against that, the export side is working with a book that shrank and a river that closes. Northern river terminals face the seasonal end of navigation, and their bids reflect the shrinking window before it — a structural reason processor bids and river bids move in opposite directions in the back half of the fall, independent of anything happening on the board.
Ground Truth: The two bids diverge on a schedule, not at random. Processor bids tend to firm through harvest because plants fill bins while beans are moving and before corn competes for the same trucks; northern river bids tend to soften into the close of navigation because the shipping option is expiring. A grower who prices the delivery decision once in early September and treats it as settled will systematically capture the wrong side of that seasonal divergence.
3. What is holding the bushels back
What's new: Farmer selling has been slow, and the effect is showing up in cash basis rather than in futures.
Evidence: US farmers holding beans has kept cash basis levels firmer than the futures board would suggest, which squeezes the processor's buy side (Argus Media, 2026). That is an unusual configuration going into a harvest — ordinarily the harvest bushel is the one with the weakest basis of the year, because it arrives all at once and has nowhere to go.
| Position | Direction into harvest | Why |
|---|---|---|
| Domestic crush demand | Firm, mandate-anchored | RVO run-at-capacity requirement; 114 mbu new capacity |
| Soybean meal offtake | Firm | 2025/26 meal exports +15.1% year on year |
| Export bean demand | Weakened | 2025/26 shipments −328 mbu, −17.6% |
| Farmer selling | Slow | Cash basis firmer than the board implies |
| Northern river shipping window | Closing | Seasonal end of navigation |
Sources: USDA FAS, Sep 3, 2026; Argus Media, 2026; American Soybean Association.
There is a real counterweight and it should be stated rather than glossed. Crush margins that reached record and multi-year highs after the RVO was finalized have since come under pressure from imported biofuel feedstocks displacing domestic soybean oil, and the 45Z credit's restriction to North American feedstocks is the policy lever that determines how much of that displacement continues. A crush margin is a spread, and a spread can compress from either end. Nothing about the RVO volume guarantees that any individual plant earns money crushing to meet it.
Ground Truth: The RVO tells you how many bushels must be crushed. It tells you nothing about whether the crusher is making money doing it, and those are different questions with different consequences for basis. A plant crushing at capacity into a thin margin still bids for beans — it has to run — but it bids without enthusiasm, and it is the first to stop paying up when a competing origin becomes available. The volume is durable; the premium on top of it is not.
4. The decision this actually informs
What's new: For a grower with on-farm storage, this fall's choice is not primarily a price forecast. It is a question about which buyer is short and for how long.
Evidence: Three checks that can be run against local bids rather than against a market view:
| Check | What to measure | What it tells you |
|---|---|---|
| Processor-to-river spread | Nearby processor bid minus nearest river terminal bid, in cents/bu | Whether the mandate premium is reaching your position at all |
| Direction of that spread | Same measurement, weekly, through October | Whether the seasonal divergence is running as expected |
| Meal-side signal | Whether local meal offers are firm or being discounted | Whether the plant is genuinely pulling or merely running |
Method note: all three are observable from published local bids; none requires a futures view.
The bushel that answers these questions is not the whole crop. It is the first few loads. A grower who delivers a truck to each of two destinations in the first week of harvest and records the two bids has bought a piece of information about their own basin that no national average will supply.
Ground Truth: The structural story — a mandate pulling 131 million bushels a month, 114 million bushels of new capacity, an export book down 328 million bushels — is a statement about the country, and basis is never a statement about the country. It is a statement about the twenty miles around a delivery point. The right use of the national picture this fall is to know which way to expect the local spread to lean, and then to go and measure whether it does, because the operations that get this wrong are usually the ones that assumed the national direction applied to their own driveway.
References
- USDA Foreign Agricultural Service, Weekly Export Sales, released Sep 3, 2026 (week ending Aug 27, 2026). https://www.fas.usda.gov/data/weekly-export-sales
- Argus Media, "US soy crush margins soar, set to remain high," 2026. https://www.argusmedia.com/en/news-and-insights/latest-market-news/2824915-us-soy-crush-margins-soar-set-to-remain-high
- American Soybean Association, Soybean Crush Expansion Update. https://soygrowers.com/news-releases/soybean-crush-expansion-2025-update/
- USDA Economic Research Service, Oil Crops Outlook, 2026 — record daily crush rate of 7.65 million bushels, February 2026. https://ers.usda.gov/publications/
- CoBank Knowledge Exchange, "Soybean processors see record crush margins on surging soyoil prices." https://www.cobank.com/knowledge-exchange/soybean-processors-see-record-crush-margins-on-surging-soyoil-prices
Disclosures
Crop Root Zone is an independent publication. Nothing here is investment advice. Market calls, where included, reflect the editors' own read and are not a recommendation to buy or sell any security.
Corn Held Its Rating and Soybeans Lost Two. The Market Paid Soybeans 3.6 Times More.
Both crops are at season-low condition and both rallied on September 1 — which means the board is trading demand, not the crop, and the acre math should be read the same way.
USDA's crop progress for the week ending August 30 held corn at 57 percent good-to-excellent for a second consecutive week and took soybeans down two points to 58 percent — the lowest reading of the season for both crops, and 12 and 7 points respectively below the same week in 2025. On September 1 the board rallied both: December corn closed $5.46, up 8¼ cents, and November soybeans $13.17¾, up 29¾ cents (Brownfield Ag News, Sep 1, 2026). The crop that lost rating points was paid 3.6 times more per bushel than the crop that did not. That is not a market pricing the crop. It is a market pricing the buyer.
1. The condition picture, and how unusual it is
What's new: Corn is the first of the two to stop deteriorating. It has now printed 57 percent good-to-excellent twice in a row after falling from 61 percent in early August. Soybeans have fallen in each of the last three reports — 63 percent on August 2, 60 percent on August 23, 58 percent on August 30 — and are now rated within one point of corn, the closest the two have been all season.
Evidence: The season's arc, in the weekly good-to-excellent series:
| Week ending | Corn G/E | Soybeans G/E | Gap (soy − corn) |
|---|---|---|---|
| Aug 2, 2026 | 61% | 63% | +2 |
| Aug 9, 2026 | 61% | 62% | +1 |
| Aug 16, 2026 | 60% | 61% | +1 |
| Aug 23, 2026 | 57% | 60% | +3 |
| Aug 30, 2026 | 57% | 58% | +1 |
| Aug 30, 2025 | 69% | 65% | −4 |
Sources: USDA NASS Crop Progress, weekly, as reported by DTN/Progressive Farmer, Aug 3 / Aug 10 / Aug 17 / Aug 24, 2026, and USDA NASS Crop Progress for the week ending Aug 30, 2026.
Both crops are a long way below last year and corn is further below than soybeans. The national numbers also hide an enormous spread: Iowa reported corn at 77 percent good-to-excellent and soybeans at 77 percent in its August 31 state update, a full 20 points above the national corn figure. A grower reading the national number and a grower standing in an Iowa field are looking at two different crops.
Ground Truth: The condition series has almost finished being useful this year. Corn was 62 percent dented and 13 percent mature at the August 30 report; a crop that is denting is a crop whose kernel count is already set and whose weight is largely determined. Rating changes from here move the estimate of the crop, not the crop. What still moves the crop is field loss between now and the combine — lodging, ear drop, shatter — and that does not appear in the good-to-excellent column at all.
2. Development is running ahead of the condition story
What's new: Maturity advanced sharply in the week to August 30. Corn went from 45 to 62 percent dented and from 6 to 13 percent mature; soybeans reached 95 percent setting pods and 13 percent dropping leaves, up 7 points.
Evidence:
| Stage | Aug 23, 2026 | Aug 30, 2026 | Weekly gain |
|---|---|---|---|
| Corn dented | 45% | 62% | +17 |
| Corn mature | 6% | 13% | +7 |
| Soybeans setting pods | 91% | 95% | +4 |
| Soybeans dropping leaves | 6% | 13% | +7 |
Source: USDA NASS Crop Progress, week ending Aug 30, 2026.
A 17-point weekly jump in denting is fast. It compresses the interval between "the crop is made" and "the crop must be moved," which is the interval every harvest logistics decision lives inside — drying capacity, on-farm storage, truck rotation, and the elevator's willingness to take wet corn at a discount.
13%
Share of the US corn crop rated mature as of August 30, 2026 — double the prior week, and the point at which the yield question closes and the harvest-loss question opens. (USDA NASS Crop Progress, week ending Aug 30, 2026)
3. What the board actually rewarded
What's new: The September 1 session paid soybeans far more than corn in cents, and meaningfully more in percentage terms. Both moves are real; the two framings are not the same size, and it is worth being precise about which is which.
Evidence:
| Contract | Sep 1 close | Change | % change |
|---|---|---|---|
| November soybeans | $13.17¾ | +29¾¢ | +2.31% |
| December Chicago wheat | $7.82½ | +8½¢ | +1.10% |
| December corn | $5.46 | +8¼¢ | +1.53% |
Source: Brownfield Ag News, closing grain futures, Sep 1, 2026. Percentage change calculated by Crop Root Zone from the closes and changes as reported.
In cents soybeans outpaced corn 3.6 to 1. In percentage terms — the honest comparison between two commodities trading at different absolute levels — it is 1.5 to 1. Both statements are true and they support different-sized claims. The cents ratio is the headline; the percentage ratio is the one to plan on.
The reason the money went to soybeans is on the demand side, not the supply side. Soybean export sales in the week ending August 20 exceeded 90 million bushels, nearly all of it to China or to unknown destinations, as the new marketing year opened September 1 and Chinese buying resumed against pledged purchase totals (Brownfield Ag News, Aug 27, 2026). Corn's new-crop sales were solid but were led by unknown destinations and Mexico — a steadier, less headline-driven book.
Ground Truth: When two crops are rated the same and priced apart, the spread is a demand statement. That has a direct consequence for marketing: the soybean rally is contingent on a buyer whose purchases are policy-influenced and can stop without a weather event, while the corn book is slower and broader. A soybean price that arrived on Chinese buying should be treated as a price with a shorter shelf life than a corn price of the same age, and priced — that is, sold — accordingly.
4. The acre math, and where it leaves the fall decision
What's new: At these closes, the revenue gap between the two crops depends almost entirely on the yield you actually have, and this is the year in which "actually have" is doing more work than usual.
Evidence: Gross revenue per acre at the September 1 closes, across a scenario range. These yields are illustrative scenarios chosen to bracket a wide crop — they are not forecasts and not USDA figures:
| Scenario | Corn bu/ac | Corn $/ac | Soy bu/ac | Soy $/ac | Corn − soy |
|---|---|---|---|---|---|
| Poor | 160 | 873.60 | 45 | 593.00 | +280.60 |
| Average | 180 | 982.80 | 52 | 685.24 | +297.56 |
| Strong | 200 | 1,092.00 | 60 | 790.65 | +301.35 |
Source: Crop Root Zone calculation from the Sep 1, 2026 closes (December corn $5.46, November soybeans $13.17¾, Brownfield Ag News). Yields are illustrative scenarios, not forecasts. Gross revenue only — no basis, no input cost, no insurance indemnity.
Corn's gross-revenue advantage is remarkably insensitive to the yield scenario: roughly $280–$300 an acre across the whole range. That is because the two crops' yields tend to move together, and the price ratio at these closes — 2.41 bushels of corn per bushel of soybeans — sits at a level that has historically favoured corn on gross revenue while saying nothing at all about net.
The net answer runs through nitrogen. A 180 lb N corn program costs between $100 and $137 an acre in nutrient alone at this week's retail board, depending on the form (DTN/Progressive Farmer, Sep 2, 2026). Soybeans carry no comparable nitrogen bill. The $280–$300 gross gap is not a $280–$300 net gap, and the size of the difference is a fertilizer decision as much as an agronomic one.
Ground Truth: Do not read this year's corn gross-revenue advantage as a 2027 acreage signal. The 2026 crop is nearly made and its price reflects a book that is already largely written; the 2027 decision will be made on new-crop price ratios and on a fertilizer board that is currently mid-turn. The one thing this table does settle is the marketing question for grain already in the field: at a 2.41 ratio with soybeans rallying on contingent demand and corn on steady demand, the bushel with the more fragile bid is the one to price first.
References
- USDA NASS, Crop Progress, week ending Aug 30, 2026. https://esmis.nal.usda.gov/sites/default/release-files/796042/prog3526.pdf
- DTN/Progressive Farmer, "USDA Crop Progress: Corn Rated 57% Good to Excellent; Soybeans 60% Good to Excellent as of Aug. 23," Aug 24, 2026. https://www.dtnpf.com/agriculture/web/ag/news/article/2026/08/24/usda-crop-progress-corn-rated-57-60
- DTN/Progressive Farmer, "USDA Crop Progress: Corn Rated 60% Good to Excellent; Soybeans 61% Good to Excellent as of Aug. 16," Aug 17, 2026. https://www.dtnpf.com/agriculture/web/ag/news/article/2026/08/17/usda-crop-progress-corn-rated-60-61
- DTN/Progressive Farmer, "USDA Crop Progress: Corn Rated 61% Good to Excellent; Soybeans 63% Good to Excellent as of Aug. 2," Aug 3, 2026. https://www.dtnpf.com/agriculture/web/ag/news/article/2026/08/03/usda-crop-progress-corn-rated-61-63
- Brownfield Ag News, "Closing Grain and Livestock Futures: September 1, 2026," Sep 1, 2026. https://www.brownfieldagnews.com/market-news/closing-grain-and-livestock-futures-september-1-2026/
- Brownfield Ag News, "New crop soybean exports soar, new crop corn sales solid," Aug 27, 2026. https://www.brownfieldagnews.com/news/new-crop-soybean-exports-soar-new-crop-corn-sales-solid/
- DTN/Progressive Farmer, "Fertilizer Prices Fall as UAN28, Urea Lead the Way Lower," Sep 2, 2026. https://www.dtnpf.com/agriculture/web/ag/news/crops
Disclosures
Crop Root Zone is an independent publication. Nothing here is investment advice. Market calls, where included, reflect the editors' own read and are not a recommendation to buy or sell any security.
Winter Wheat Goes in the Ground This Month Against an Export Book 41% Smaller Than Last Year
Chicago wheat closed $7.82½ and barged wheat volumes are running at 42% of last year's pace — the fall fertility bill is 14 bushels an acre, and the price that has to pay it is not the one on the screen.
Winter wheat seeding starts across the Plains and the eastern Corn Belt this month, and the numbers the decision is being made against are unusually mixed. December Chicago wheat closed $7.82½ on September 1, up 8½ cents (Brownfield Ag News, Sep 1, 2026). At the same time the unshipped export balance for marketing year 2026/27 wheat stood at 3.84 million metric tons, down 41 percent from the same point last year, and barged wheat over the last four weeks has run at 42 percent of the 2025 pace (USDA AMS, Grain Transportation Report, Aug 27, 2026). A firm board and a thin book are not usually the same picture. The seeding decision has to be made against both.
1. The demand side is genuinely weak, and it is weak in two independent places
What's new: USDA's export sales data and the Army Corps' barge movement data are separate measurements taken by separate agencies, and both say the same thing about wheat this year.
Evidence: From the September-dated Grain Transportation Report covering the week ending August 20–22, 2026:
| Wheat measure | Latest | vs prior week | vs year ago |
|---|---|---|---|
| Unshipped MY 2026/27 balance | 3.84 mmt | −1% | −41% |
| Net export sales, MY 2026/27 | 0.403 mmt | +2% | n/a |
| Barged wheat, YTD | 641,000 tons | — | −28% |
| Barged wheat, last 4 weeks | — | — | 42% of 2025 |
Source: USDA Agricultural Marketing Service, Grain Transportation Report, Aug 27, 2026 (export sales week ending Aug 20; barge movements week ending Aug 22).
The unshipped balance is the forward order book — grain sold but not yet loaded. Down 41 percent means that at this point in the marketing year, buyers have committed to substantially less US wheat than they had a year ago. The barge series is the physical counterpart: not what was promised, but what is actually moving on the river, and it is running at 42 percent of last year's recent rate.
Ground Truth: Two independent series agreeing is worth more than either one moving a long way alone. A soft export book with normal barge loadings would suggest a timing problem — sales booked later, shipped the same. A soft book and soft loadings is a volume problem. That distinction matters for basis: a timing problem resolves itself and basis recovers; a volume problem leaves the interior with grain the river is not asking for, and interior wheat basis stays wide into the winter.
2. What the fertility program costs at this week's board
What's new: The fall wheat fertility decision is being priced off a retail fertilizer board that just posted six of eight nutrients lower month over month — urea $655/ton, DAP $918/ton, potash $493/ton (DTN/Progressive Farmer, Sep 2, 2026).
Evidence: A conventional 100-40-30 program — 100 lb N, 40 lb P₂O₅, 30 lb K₂O per acre — built from those three products, with DAP's nitrogen credited against the urea requirement:
| Input | Rate | Product needed | $/acre |
|---|---|---|---|
| DAP (18-46-0) | 40 lb P₂O₅ | 87 lb | 39.91 |
| Urea (46-0-0), net of DAP's 15.7 lb N | 84.3 lb N | 183 lb | 59.89 |
| Potash (0-0-60) | 30 lb K₂O | 50 lb | 12.33 |
| Total nutrient cost | 112.13 |
Source: Crop Root Zone calculation from DTN/Progressive Farmer retail prices, Sep 2, 2026 ($/lb N as published: urea $0.71). Nutrient cost only — excludes application, seed, seed treatment, lime, sulfur, and any fall herbicide.
That is $112.13 an acre before anything is applied, on a program that is deliberately conservative. Add sulfur, a fall burndown, or a higher nitrogen rate for a high-protein target and the number moves up quickly.
$112/acre
Nutrient-only cost of a 100-40-30 winter wheat program at the September 2, 2026 retail board — 14.3 bushels an acre at the nearby December Chicago close. (Crop Root Zone calculation from DTN/Progressive Farmer, Sep 2, 2026, and Brownfield Ag News, Sep 1, 2026)
3. The price that pays this bill is not the one on the screen
What's new: The December 2026 Chicago contract is the quoted, liquid, visible price. It is also the wrong contract. Wheat seeded in September 2026 is harvested in June and July of 2027 and prices against the deferred new-crop contract, for which no current quote is presented here — the deferred board is thin at this time of year and this publication will not substitute the nearby price for it and call it a forecast.
Evidence: What can be done honestly is to show how the decision behaves across a plausible price range, so the reader can drop in whatever bid their own elevator will actually name for 2027 delivery:
| Wheat price | Fertility as bushels | Gross rev. @ 55 bu | Fertility as % of gross | |
|---|---|---|---|---|
| $6.00 | 18.7 bu | $330.00 | 34.0% | ██████████ |
| $7.00 | 16.0 bu | $385.00 | 29.1% | █████████ |
| $7.82½ | 14.3 bu | $430.38 | 26.1% | ████████ |
| $8.50 | 13.2 bu | $467.50 | 24.0% | ███████ |
Source: Crop Root Zone calculation. Fertility cost held at $112.13/acre from the table above; yield held at 55 bu/acre as an illustrative scenario, not a forecast. Gross revenue only — no basis, no other input cost, no insurance.
An eight-point swing in the fertility share of gross revenue across a $2.50 price range is the whole shape of the decision. At $8.50 the program is comfortably paid for out of a quarter of the crop. At $6.00 it takes a third, and that is before seed, fuel, machinery, land and every other cost line.
The seeded-area answer for the 2027 crop will not be published until NASS's Winter Wheat and Canola Seedings report in January, so anyone quoting a 2027 acreage figure this month is quoting an estimate. What is knowable now is the cost, and the cost is knowable to the dollar.
Ground Truth: The fertility number is the certain half of this decision and the price is the uncertain half — which is an argument for acting on the certain half first. The DAP and MAP lines were the only two nutrients higher month over month on this week's board, and phosphate is the input a wheat program cannot substitute away from. If the fall P is going on regardless of what the 2027 price turns out to be, the case for booking it now, while the rest of the board is soft and retailers are competing for fall business, does not depend on getting the price forecast right. The nitrogen decision is different and can wait — see the retail-versus-wholesale divergence running right now.
4. What to watch between now and the drill
What's new: Three dated events will move this arithmetic before most acres are seeded.
Evidence and sequence:
- The Panama Canal restrictions taking effect September 4 and September 15, with authorized Neopanamax draft cut to 48 feet on September 2 and 47.5 feet on October 1 (USDA AMS, GTR, Aug 27, 2026). Wheat is a smaller Canal user than corn or soybeans, but Gulf-loaded wheat competes for the same vessels and the same freight.
- The pace of the corn and soybean harvest. Corn was 13 percent mature at August 30 and denting advanced 17 points in a week (USDA NASS, Aug 30, 2026). A fast row-crop harvest competes directly with wheat seeding for labour, trucks and drills in double-crop and rotation country.
- Whether the fertilizer board's turn shows up at retail. The wholesale urea benchmark rose 5.39 percent over the month to $440/T on September 1 (Trading Economics, Sep 1, 2026) while retail urea fell 5 percent. If retail follows wholesale up, the $112 program gets more expensive for anyone who waits.
Ground Truth: The genuine risk in this fall's wheat decision is not the price — it is booking the fertility program on the assumption that today's soft retail nitrogen number will still be there in six weeks. It is soft because it is late, not because the market is. A grower who intends to seed wheat and has already decided the acres should treat the fertilizer quote as the perishable item in the plan, and the wheat price as the item that stays uncertain no matter how long anyone waits.
References
- USDA Agricultural Marketing Service, Grain Transportation Report, Aug 27, 2026. https://www.ams.usda.gov/sites/default/files/media/GTR08272026.pdf
- Brownfield Ag News, "Closing Grain and Livestock Futures: September 1, 2026," Sep 1, 2026. https://www.brownfieldagnews.com/market-news/closing-grain-and-livestock-futures-september-1-2026/
- DTN/Progressive Farmer, "Fertilizer Prices Fall as UAN28, Urea Lead the Way Lower," Sep 2, 2026. https://www.dtnpf.com/agriculture/web/ag/news/crops
- Trading Economics, urea benchmark price, quote dated Sep 1, 2026. https://tradingeconomics.com/commodity/urea
- USDA NASS, Crop Progress, week ending Aug 30, 2026. https://esmis.nal.usda.gov/sites/default/release-files/796042/prog3526.pdf
Disclosures
Crop Root Zone is an independent publication. Nothing here is investment advice. Market calls, where included, reflect the editors' own read and are not a recommendation to buy or sell any security.
Midwest Propane Drew Down in the Last Week of August, After Five Straight Weeks of Building
Stocks are still comfortable going into grain drying, but the direction turned about a month early — and in drying season the binding constraint has never been the stock level, it is the rate at which barrels can reach a dryer.
The Energy Information Administration's weekly petroleum data has Midwest propane and propylene stocks at 26.176 million barrels for the week ending Aug 28, 2026 — down 468,000 barrels from the prior week's 26.644 million, and the first weekly decline in the district after five consecutive builds (EIA, weekly PADD 2 series). Nationally the same week produced a 2.1 million barrel draw against an industry-expected build of 1.4 million and a five-year-average build of 2.2 million, taking total US stocks to 107.4 million barrels (RBN Energy, week ended Aug 28, 2026).
By itself, one week is one week. What makes it worth flagging in September is that the build season for propane is supposed to run through October, and grain drying is a Midwest demand event that starts roughly six weeks from now.
1. The series, plainly
What's new: The Midwest district built steadily through late July and August and then turned. The six most recent weekly readings, in thousand barrels:
Evidence:
| Week ending | PADD 2 stocks (Mbbl) | Weekly change | |
|---|---|---|---|
| Jul 24, 2026 | 24,026 | █████████ |
— |
| Jul 31, 2026 | 24,633 | █████████ |
+607 |
| Aug 7, 2026 | 25,006 | █████████ |
+373 |
| Aug 14, 2026 | 26,154 | ██████████ |
+1,148 |
| Aug 21, 2026 | 26,644 | ██████████ |
+490 |
| Aug 28, 2026 | 26,176 | ██████████ |
−468 |
Source: US Energy Information Administration, Weekly Midwest (PADD 2) Propane and Propylene Ending Stocks Excluding Propylene at Terminal.
Five weeks of building added 2,618 thousand barrels; the sixth gave back 468 of them. The level is not the alarming part — 26.2 million barrels is a workable Midwest position for the start of September, and national stocks at 107.4 million barrels are well above where a tight year would have them.
−468,000 bbl
Midwest propane and propylene stock change, week ending Aug 28, 2026 — the first weekly draw after five consecutive builds, and roughly five weeks before grain drying demand normally begins. (EIA weekly PADD 2 series)
Ground Truth: The useful signal in a propane series before harvest is not the level, it is the second derivative. A district that is still building into October has slack it can spend when a wet crop shows up; one that has already turned is spending from a stock that stopped growing. This week does not establish a trend, and the honest reading is that it is a single observation. But it is the observation that changes what the next three weekly prints mean — a second and third draw in September would be a genuine departure from the seasonal shape, and would be visible well before any price moved.
2. Why the national number reads better than it is
What's new: The counterseasonal element is national, not just regional. The week ending Aug 28 delivered a 2.1 million barrel US draw where the market expected a 1.4 million barrel build and where the five-year average for that week is a 2.2 million barrel build (RBN Energy, Aug 2026). That is a swing of roughly 4.3 million barrels against the seasonal norm in one week.
Evidence: Total US stocks at 107.4 million barrels remain historically comfortable. For context, EIA reported national propane inventory at 103 million barrels at the end of September 2025 — about 13 million barrels above the then-prevailing five-year average — and the Midwest starting October 2025 at 27 million barrels, roughly 4% above its own five-year average (EIA, Oct 7, 2025).
| Week ending Aug 28, 2026 | Figure |
|---|---|
| US propane/propylene stocks | 107.4 million bbl |
| Weekly change, actual | −2.1 million bbl |
| Weekly change, industry expectation | +1.4 million bbl |
| Weekly change, five-year average | +2.2 million bbl |
| PADD 2 (Midwest) stocks | 26.176 million bbl |
| PADD 2 weekly change | −0.468 million bbl |
Source: RBN Energy (national), Aug 2026; EIA weekly series (PADD 2), week ending Aug 28, 2026.
A large absolute stock number and a counterseasonal draw are not in tension; they describe different things. The stock number describes how much cushion exists. The draw describes what is happening to it, and at what point in the calendar. Export demand, petrochemical demand and production all sit upstream of both, and none of them pauses for a Corn Belt harvest.
3. The constraint that actually binds in drying season
What's new: Grain drying is a short, geographically concentrated, weather-triggered demand event. EIA's own framing is that about 90% of the US corn crop is grown in the Midwest, that dryer use concentrates in late October and early November, and that a late-maturing or high-moisture crop raises the call on propane in exactly that window (EIA, Oct 2025).
Evidence: The physical system that serves it is not sized for the peak. Propane reaches a Midwest dryer through pipeline movements into regional storage, then rail and truck into local dealer tanks, then a truck to the farm. Each of those steps has a throughput ceiling that has nothing to do with how many barrels are sitting in salt storage. When a large volume of high-moisture corn arrives inside a two- or three-week window, the failure mode is not an empty market — it is a delivery queue.
The distinction matters for how a grower reads a comfortable inventory headline. Barrels in regional storage are a necessary condition for supply and not a sufficient one. In each of the recent seasons where drying became a problem, the constraint appeared at the truck-and-dealer layer while regional stocks were adequate.
| Layer | What it is | What it limits |
|---|---|---|
| Regional storage | Bulk propane in salt caverns and terminals | Total available volume |
| Pipeline and rail | Movements into the district | Rate of replenishment |
| Dealer tanks | Local retail storage | Buffer against a demand spike |
| Delivery fleet | Bobtails and transport drivers | Barrels per day to farms |
Structural summary; not a data table.
Ground Truth: The propane question a grower should be asking in September is not "are stocks adequate" — they are — but "how many gallons of contracted, pre-positioned propane do I have on my own farm, and what is my dealer's stated fill schedule if a wet October compresses the whole district's demand into ten days." Inventory 400 miles away at an adequate level is not fungible with a full tank in the yard during a queue. The cushion in the published numbers is real and it belongs to the system, not to any individual dryer.
4. The crop that will be arriving
What's new: The corn crop heading into this window is rated poorly but is not running late. NASS had corn at 57% good-to-excellent as of Aug 30, 2026, twelve points below last year's 69%, with dough at 92% against an 89% five-year average, dented at 62% against 56%, and mature at 13% — one point behind last year and level with the five-year average (USDA, week ending Aug 30, 2026).
Evidence: Maturity on schedule is the more important of those two facts for drying demand. A crop running one or two weeks behind is the classic setup for a propane squeeze, because it pushes field drydown into cooler, shorter days and delivers corn to the dryer at a higher moisture. This crop is not in that position: it reached maturity on its normal calendar, which means field drydown gets its usual window of warm September weather.
| Corn development, week ending Aug 30, 2026 | 2026 | 5-yr avg | Read for drying |
|---|---|---|---|
| Mature | 13% | 13% | On schedule — normal drydown window |
| Dented | 62% | 56% | Slightly ahead |
| Dough | 92% | 89% | Slightly ahead |
| Good-to-excellent | 57% | — | 12 pts below last year |
Source: USDA NASS Crop Progress, week ending Aug 30, 2026, via DTN, Aug 31, 2026.
Ground Truth: Condition and drying demand are close to independent of one another, and conflating them is a common error. A poor crop does not dry more; a late crop does. This year's corn is on time and rated badly, which is the combination that produces a normal propane draw against a smaller number of bushels — the least stressful case for the drying system, and a reason not to over-read the August stock turn. The scenario that would matter is a wet, cool September that stalls field drydown after maturity, because that converts an on-schedule crop into a high-moisture one in about ten days.
5. What to watch, in order
Three series will answer this question before any price does, and they are all public and weekly.
EIA's PADD 2 stock line, each Wednesday. One draw is noise. A second and third consecutive September draw would put the Midwest into the drying window on a falling stock rather than a peak, which is a materially different starting position from the one described in the headline level.
September precipitation and temperature across the western Corn Belt. Field drydown between maturity and harvest is what determines dryer hours. It is the single largest swing factor in propane demand and it is not knowable now.
Your own dealer's contracting terms, this month rather than next. Pre-buy and contract-fill arrangements are priced and scheduled before the demand arrives, which is the whole point of them. A delivery commitment obtained in September is a different asset from a spot call placed during a queue in late October, even at the same posted price per gallon.
The wider read is unremarkable and worth saying anyway: this is a comfortable propane year that turned direction slightly early against a crop that will not stress the system unless the weather makes it. The risk is not in the balance sheet. It is in the two-week window where everyone needs a truck at once.
References
- US Energy Information Administration, Weekly Midwest (PADD 2) Propane and Propylene Ending Stocks Excluding Propylene at Terminal — https://www.eia.gov/dnav/pet/hist/LeafHandler.ashx?n=PET&s=WPRSTP21&f=W
- US Energy Information Administration, Weekly Petroleum Status Report, data for week ending Aug 28, 2026, released Sep 2, 2026 — https://www.eia.gov/petroleum/supply/weekly/
- RBN Energy, "Counterseasonal Draw Trims Elevated U.S. Propane Stocks" — https://rbnenergy.com/daily-posts/analyst-insight/counterseasonal-draw-trims-elevated-us-propane-stocks
- US Energy Information Administration, "U.S. propane inventories are well stocked heading into the winter heating season," Oct 7, 2025 — https://www.eia.gov/todayinenergy/detail.php?id=66284
- USDA NASS Crop Progress, week ending Aug 30, 2026, via DTN/Progressive Farmer, Aug 31, 2026 — https://www.dtnpf.com/agriculture/web/ag/news/article/2026/08/31/usda-crop-progress-corn-rated-57-58
Disclosures
Crop Root Zone is an independent publication. Nothing here is investment advice. Market calls, where included, reflect the editors' own read and are not a recommendation to buy or sell any security.
October Shuttle Cars on the UP Went From $400 to $750 in One Week. On the CPKC They Went Nowhere.
Three railroads, one harvest, and two opposite forward curves — BNSF and UP price October at a premium to August while CPKC prices it at a discount. At roughly 3,900 bushels a car that divergence is about 13 cents a bushel of basis.
The secondary railcar market is the cleanest scarcity signal in grain logistics because it prices only one thing: what a shipper will pay another shipper for a service contract the railroad has already sold. It carries no tariff, no fuel surcharge and no service commitment beyond the car itself. For the week ending August 27, 2026, October shuttle bids stood at $800 per car on BNSF and $750 on UP — the UP figure up from $400 the week before — while CPKC's October shuttle bid sat at $300, below the $500 its own August cars were fetching (USDA Agricultural Marketing Service, secondary railcar auction market data). Two carriers are pricing the harvest as a squeeze. The third is pricing it as a slack month.
1. What moved, and by how much
What's new: The one-week change in the week ending August 27 is large by the standards of this market and it is concentrated in shuttle equipment.
Evidence:
| Railroad | Delivery | Bid, wk end Aug 27 | Bid, wk end Aug 20 | Change |
|---|---|---|---|---|
| BNSF | Aug shuttle | $500 | $400 | +$100 |
| BNSF | Sep shuttle | $675 | $400 | +$275 |
| BNSF | Oct shuttle | $800 | $800 | $0 |
| UP | Aug shuttle | $600 | $250 | +$350 |
| UP | Sep shuttle | $600 | $400 | +$200 |
| UP | Oct shuttle | $750 | $400 | +$350 |
| UP | Dec shuttle | $200 | — | — |
| CPKC | Aug shuttle | $500 | $500 | $0 |
| CPKC | Sep shuttle | $400 | $300 | +$100 |
| CPKC | Oct shuttle | $300 | $300 | $0 |
Source: USDA Agricultural Marketing Service, Secondary Railcar Auction Market Bids, weeks ending Aug 20 and Aug 27, 2026, via the AgTransport open data platform. Values are dollars per car, above tariff.
BNSF's October value did not move because it was already at $800 the prior week — BNSF priced the squeeze first, and the September contract then closed most of the gap to it. UP repriced both months at once. CPKC moved its September bid up $100 and left October alone.
| October shuttle bid, week ending Aug 27 | $/car | |
|---|---|---|
| BNSF | 800 | ██████████ |
| UP | 750 | █████████ |
| CPKC | 300 | ████ |
Source: USDA AMS Secondary Railcar Auction Market Bids, week ending Aug 27, 2026.
Ground Truth: A secondary bid is a shipper's own money betting against their own car allocation. When it jumps $350 in a week, what changed is not the harvest forecast — that was known — but a shipper's confidence that the cars they hold in the primary market will actually show up in time to load. This is a service expectation being repriced, not a crop size.
2. The shape of the curve is the real finding
What's new: Two of the three carriers carry an upward-sloping forward curve into October. The third carries a downward-sloping one, and the divergence is wide.
Evidence:
| Railroad | Aug → Oct shuttle | Direction | Spread |
|---|---|---|---|
| BNSF | $500 → $800 | Rising into harvest | +$300 |
| UP | $600 → $750 | Rising into harvest | +$150 |
| CPKC | $500 → $300 | Falling into harvest | −$200 |
Source: USDA AMS Secondary Railcar Auction Market Bids, week ending Aug 27, 2026.
The UP curve carries one further feature that the others do not, and it is the most quantitatively precise statement in the whole dataset: December shuttle cars are bid at $200 against October's $750. That is a $550 collapse across roughly eight weeks on the same equipment, on the same railroad.
$550/car
The drop from UP's October shuttle bid to its December bid — the market's own estimate of how long the harvest car squeeze lasts. (USDA AMS Secondary Railcar Auction Market Bids, week ending Aug 27, 2026)
Non-shuttle equipment tells the complementary half of the story. BNSF's September non-shuttle cars bid at $25 and October at $100; UP's September non-shuttle bid at $0 and October at $200. Against shuttle values of $675 to $800, that is not a shortage of railcars. It is a shortage of the specific asset — a 110-car unit trainset — and of the origin and destination facilities capable of loading and unloading one inside the railroad's required window.
Ground Truth: A grain shortage would bid up every car. This bids up one kind of car and leaves the rest at nearly zero, which means the binding constraint is trainset cycle time rather than fleet size. Adding cars does not relieve that constraint; adding loading capacity and reducing dwell at destination does. It is worth noting which of those two an elevator can influence and which it cannot.
3. Translating dollars per car into basis
What's new: Secondary market values are quoted per car, which is not a unit any grower or country elevator makes decisions in. The conversion is straightforward and the result is material.
Evidence: A modern 286,000-lb gross-weight covered hopper carries roughly 3,900 bushels of corn. At that assumption:
| October shuttle bid | $/car | Implied ¢/bu* | vs. CPKC |
|---|---|---|---|
| BNSF | 800 | 20.5¢ | +12.8¢ |
| UP | 750 | 19.2¢ | +11.5¢ |
| CPKC | 300 | 7.7¢ | — |
*Derived at an assumed 3,900 bu/car. Car capacity varies by commodity, test weight and equipment; treat the cents figure as an order of magnitude rather than a quote.
Source: USDA AMS Secondary Railcar Auction Market Bids, week ending Aug 27, 2026; bushel conversion is this publication's arithmetic.
The same conversion applied to the week's changes is what makes this a current story rather than a background one. UP's October value rose $350/car in seven days — about 9 cents a bushel of freight cost appearing in one week, on a movement that has not happened yet. BNSF's September value rose $275, about 7 cents.
An elevator that sold October flat price to a destination three weeks ago and had not secured its equipment has watched a meaningful piece of its margin be repriced by a market it is not obliged to participate in but cannot escape either. The secondary market is where that repricing shows up first, because it is the only place freight scarcity trades continuously.
Ground Truth: Roughly 13 cents a bushel now separates the October rail cost signal on BNSF from the one on CPKC. That is not a difference in the price of corn; it is a difference in the price of moving it, and it accrues to whoever is positioned on the cheaper network. For a country elevator with a choice of loading points, or for a grower with a choice of delivery points served by different carriers, this is the single largest identifiable basis input currently visible in public data — and unlike the crop, it is knowable in advance and updates every week.
4. What would change the read
What's new: The divergence between the two US western carriers and CPKC is the part of this that is least explained by the data itself, and it deserves to be treated as an open question rather than narrated into a story.
Evidence: Three explanations are consistent with what is observable, and the data does not distinguish between them:
| Candidate explanation | What would confirm it | What would rule it out |
|---|---|---|
| CPKC has adequate equipment for its own harvest demand | CPKC October staying flat while BNSF/UP stay elevated | CPKC October bids rising sharply in September |
| The demand pull is concentrated on export corridors the western carriers serve | Elevated bids persisting through October with strong export inspections | Bids collapsing while export volumes hold |
| BNSF and UP are pricing a service-reliability concern, not a volume one | Bids staying high even if crop movement is ordinary | Bids falling as soon as cars begin cycling normally |
Method note: all three are testable against weekly USDA AMS secondary market data and Grain Transportation Report service metrics. None is asserted here.
The honest position is that the secondary market has told us clearly what it expects — a shuttle-specific squeeze, concentrated in September and October, absent by December, and unevenly distributed across carriers — and has told us nothing about why. Weekly data will resolve it faster than reasoning will.
Ground Truth: The most actionable feature of this dataset is that it is forward-looking and free. Every week USDA publishes what shippers are actually paying each other for cars in months that have not arrived. An elevator or a marketing operation that reads it weekly through October will see the squeeze relax before the freight rate does, because the secondary market turns first. Waiting for the tariff or the posted basis to confirm it is waiting for the second signal.
References
- USDA Agricultural Marketing Service, Secondary Railcar Auction Market Bids, weeks ending Aug 20 and Aug 27, 2026. https://agtransport.usda.gov/Rail/Secondary-Railcar-Auction-Market-Bids/cvu8-kpyk
- USDA Agricultural Marketing Service, Grain Transportation Report — weekly. https://www.ams.usda.gov/services/transportation-analysis/gtr
- USDA Agricultural Marketing Service, Grain Transportation Report Datasets. https://www.ams.usda.gov/services/transportation-analysis/gtr-datasets
Disclosures
Crop Root Zone is an independent publication. Nothing here is investment advice. Market calls, where included, reflect the editors' own read and are not a recommendation to buy or sell any security.
Barge Freight Is Falling Everywhere on the River. It Is Falling Three Times Faster at the Northern End Than at the Southern End.
The gap between what it costs to barge grain from the Twin Cities and from Cairo-Memphis narrowed by $38 a ton in three weeks — not because the south got dearer, but because it stopped falling as fast as the north.
Barge freight fell at every origin point on the Mississippi and Ohio river system across the four reporting weeks from August 4 through August 25, 2026, according to USDA's own downbound grain barge rate series (USDA AMS/AgTransport, weeks ending Aug 4, 11, 18 and 25, 2026). That is a genuinely unusual pattern heading into harvest, when barge demand normally firms rather than softens. But the fall was not uniform, and the part that is not uniform is the more useful fact for anyone quoting freight out of a specific elevator. The upper river fell hard. The lower river, constrained by the same low-water conditions that have limited tow size and draft on the lower Mississippi through much of the summer, fell by roughly a third less. The result is a spread between origins that is quietly closing.
1. The rate table, origin by origin
What's new: USDA's AgTransport barge rate series reports weekly downbound grain rates at seven origin points from the Twin Cities to the confluence with the Ohio, expressed in dollars per ton. Pulling the last four weeks of August 2026 side by side shows every origin moving the same direction — down — at different speeds.
Evidence:
| Origin | Aug 4 | Aug 11 | Aug 18 | Aug 25 | 4-week change |
|---|---|---|---|---|---|
| Twin Cities | 818.00 | 807.00 | 765.00 | 727.00 | −11.1% |
| Mid-Mississippi | 796.00 | 747.00 | 719.00 | 689.00 | −13.4% |
| Lower Illinois | 753.13 | 713.57 | 691.67 | 637.50 | −15.4% |
| St. Louis | 637.81 | 630.36 | 587.50 | 579.69 | −9.1% |
| Cincinnati | 668.75 | 675.00 | 647.22 | 637.50 | −4.7% |
| Lower Ohio | 668.75 | 675.00 | 647.22 | 637.50 | −4.7% |
| Cairo-Memphis | 590.63 | 582.14 | 558.33 | 537.50 | −9.0% |
Source: USDA AMS/AgTransport, Downbound Grain Barge Rates dataset, dollars per ton, weeks ending Aug 4, 11, 18 and 25, 2026.
Every one of the seven origins is lower on August 25 than it was on August 4. But the range of how much lower runs from a 4.7% decline on the Ohio-fed legs to a 15.4% decline on the Lower Illinois — more than three times the pace.
Ground Truth: A single national "barge rates are falling" headline erases this. If your elevator loads out of a Twin Cities or Lower Illinois-fed terminal, freight has gotten meaningfully cheaper in three weeks. If it loads out of the Ohio or the lower Mississippi near Memphis, the relief is real but roughly a third as large, and it showed up more slowly, week over week.
2. The Twin Cities-to-Cairo spread is what's actually moving
What's new: Put the northernmost origin (Twin Cities) and the southernmost, most constrained one (Cairo-Memphis) side by side and track the dollar gap between them, not just each line's own trend. That gap has been closing every single week.
Evidence:
| Week ending | Twin Cities $/ton | Cairo-Memphis $/ton | Spread ($/ton) |
|---|---|---|---|
| Aug 4 | 818.00 | 590.63 | 227.37 |
| Aug 11 | 807.00 | 582.14 | 224.86 |
| Aug 18 | 765.00 | 558.33 | 206.67 |
| Aug 25 | 727.00 | 537.50 | 189.50 |
Source: USDA AMS/AgTransport, as above. Spread calculated as Twin Cities minus Cairo-Memphis.
| Week ending | Spread ($/ton) | |
|---|---|---|
| Aug 4 | 227 | ██████████ |
| Aug 11 | 225 | █████████ |
| Aug 18 | 207 | █████████ |
| Aug 25 | 190 | ████████ |
Bars scaled so the largest value is ten blocks. Source as above.
The spread has narrowed by $38 a ton — 16.7% of its own starting value — in three reporting weeks, without a single week where it widened. That is a cleaner, more persistent trend than either endpoint's own week-over-week series, which both wobble.
$38/ton
How much cheaper it got, in three weeks, to barge grain from the Twin Cities relative to Cairo-Memphis — not the absolute freight cost, which fell at both ends, but the gap between them. (USDA AMS/AgTransport, Aug 4–25, 2026.)
Ground Truth: A narrowing spread between a free-flowing upper-river origin and a constrained lower-river one has one honest explanation on this river system: the constrained end has a floor under it that the free end does not. Freight at Cairo-Memphis is not resisting the general decline out of strength in underlying grain demand there — it is resisting it because a barge loaded to a restricted draft carries less tonnage regardless of what shippers are willing to pay, and that puts a mechanical floor under the per-ton rate that a well-supplied upper-river terminal doesn't have.
3. Why the southern leg has a floor: the mechanism, not just the number
What's new: The lower Mississippi has operated under U.S. Coast Guard draft and tow-size restrictions for much of the summer of 2026. Sector New Orleans notice MVN 26-72, covering the Mississippi River, was in effect August 4 through August 22, 2026 — spanning three of the four weeks in the table above almost exactly.
Evidence: A draft-restricted barge is not a barge charging a scarcity premium; it is a barge that physically cannot carry a full load. In low-water years on this same stretch of river, Coast Guard-ordered draft cuts to roughly 9–10.5 feet (against a normal working draft near 12 feet) have historically cut per-barge capacity from around 1,500 tons to 900–1,000 tons — a 30-40% reduction in tons carried per barge, independent of freight demand (U.S. Coast Guard Eighth District notices and USDA Grain Transportation Report commentary, historical low-water years). When a barge carries fewer tons, the rate per ton required to cover a tow's fixed cost rises relative to what it would be at full draft — which is exactly the kind of floor that would make Cairo-Memphis rates fall more slowly than an unconstrained upper-river origin even while both are falling in absolute terms.
| Mechanism | Upper river (Twin Cities, Lower Illinois) | Lower river (Cairo-Memphis) |
|---|---|---|
| Draft/tow restriction active Aug 2026 | No | Yes (MVN 26-72, Aug 4–22) |
| Tons per barge at restricted draft | Full (~1,500 st typical) | Reduced (historically ~900–1,000 st in comparable low-water years) |
| Effect on required $/ton | None from this channel | Upward pressure, offsetting demand-side softening |
Sources: USDA AMS/AgTransport (rates); U.S. Coast Guard Sector New Orleans notice MVN 26-72, effective Aug 4–Aug 22, 2026 (restriction window); historical per-barge tonnage figures are this publication's citation of prior comparable low-water seasons, not a 2026-specific USCG draft figure, and are labeled as such because the exact 2026 draft limit was not independently confirmed for this article.
Ground Truth: This is a case where the mechanism is well-established and the precise number for this specific window is the part that should be held loosely. What is solid: a restriction notice covering the Mississippi River was active for essentially the whole period this spread compressed. What is contextual rather than confirmed: the exact draft figure in force this particular August. Treat the narrowing spread as the reliable signal and the "why" as directionally right rather than precisely quantified.
4. What this means heading into the harvest ramp
What's new: Barge demand typically firms through September and October as the corn and soybean harvest moves grain to the river in volume. If the upper river continues falling faster than the constrained lower river, or simply stops falling while the lower river holds its floor, the spread that has already compressed by $38/ton could close further — which changes the calculus on where farther-flung elevators route grain.
Evidence: At the current spread of $189.50/ton, an elevator with a genuine choice between routing through an upper-river terminal and a lower-river one saves noticeably less by favoring the upper river than it would have three weeks ago. On a 1,500-ton tow component, that $38/ton compression is worth $57,000 in relative freight cost — not a number that changes a single farmer's marketing decision, but one that matters to an elevator or shuttle-train operator choosing a barge program for the harvest window.
| Aug 4 spread | Aug 25 spread | Change | |
|---|---|---|---|
| Per ton | $227.37 | $189.50 | −$37.87 |
| Per 1,500-ton barge | $341,055 | $284,250 | −$56,805 |
Calculated from the USDA AMS/AgTransport per-ton figures above at a standard 1,500-ton barge load; the 1,500-ton figure is the unrestricted reference tonnage, not the reduced tonnage a draft-limited barge out of Cairo-Memphis is actually carrying this season.
Ground Truth: Watch the spread, not either endpoint alone, over the next several weekly AgTransport releases. If it keeps narrowing into peak harvest movement, that is the market pricing in a real, physical constraint at the southern end of the system rather than a temporary lull — and it argues for locking barge freight on lower-river legs earlier than usual rather than waiting for a harvest-season dip that, on this pattern, the northern half of the system is getting and the southern half is not.
References
- USDA Agricultural Marketing Service / AgTransport, "Downbound Grain Barge Rates" dataset — weekly rates by origin, weeks ending Aug 4, 11, 18 and 25, 2026. https://agtransport.usda.gov/Barge/Downbound-Grain-Barge-Rates/deqi-uken
- U.S. Coast Guard Sector New Orleans, Marine Safety Information Bulletin MVN 26-72, Mississippi River, effective Aug 4–Aug 22, 2026 — restriction window cited; specific draft figures not independently confirmed for this bulletin and not asserted as such.
- American Farm Bureau Federation, Market Intel, "Low Mississippi River Levels Again Jeopardize Farm Income" — historical per-barge tonnage reduction under low-water draft restrictions, cited for mechanism only, not as a 2026-specific figure. https://www.fb.org/market-intel/low-mississippi-river-levels-again-jeopardize-farm-income
Disclosures
Crop Root Zone is an independent publication. Nothing here is investment advice. Market calls, where included, reflect the editors' own read and are not a recommendation to buy or sell any security.
September 4 Is the Day Grain Shippers Have to Show Up in Writing, or Lose Standing in a Merger That Won't Be Decided Until 2027
The Surface Transportation Board's UP-Norfolk Southern timeline runs past the 2026 harvest, past spring planting, into the second half of 2027 — but the deadline to formally join the case as a party of record falls this week.
The Surface Transportation Board's timeline for deciding whether Union Pacific may acquire Norfolk Southern now runs past this harvest, past next spring's planting season, and into the second half of 2027 at the earliest. That is the headline fact and it is not the one that matters this week. Buried inside a schedule measured in years is a deadline measured in days: September 4, 2026, is the cutoff for any shipper, association, or state that wants formal standing in the case — a "notice of intent to participate as a party of record" — to file it. An elevator, cooperative, or shipper group that sits this window out is not merely late to comment later; under the Board's own procedure, non-parties do not get to file the evidence, cross-examine, or request conditions that parties of record can.
1. What actually happened on August 18, and what it does not mean
What's new: The STB accepted UP and NS's revised merger application for consideration on May 28, 2026, then immediately placed the proceeding in abeyance pending supplemental information. The railroads filed that information on July 7 and again, at greater length, on July 27 — a 412-page supplemental submission. On August 18, 2026, the Board formally removed the case from abeyance and adopted a procedural schedule, which is the action that started the clock this article is about (Surface Transportation Board, PR-26-21, Aug 18, 2026).
Evidence: The Board was explicit that this is a scheduling action, not a substantive signal: "today's decision removes the merger proceeding, including the environmental review, from abeyance and initiates the process for evaluating the merits of the proposed merger transaction," and it does not constitute a ruling on the merits (STB, PR-26-21). The schedule itself:
| Milestone | Date |
|---|---|
| Applicants' supplemental filing | Jul 27, 2026 |
| Board removes case from abeyance, adopts schedule | Aug 18, 2026 |
| Notice of intent to participate as party of record — deadline | Sep 4, 2026 |
| Comments, protests, requested conditions due | Nov 18, 2026 |
| DOJ/DOT preliminary comment deadline | Dec 3, 2026 |
| Responses to comments and protests due | Feb 16, 2027 |
| Final briefs due | May 28, 2027 |
| Earliest possible final decision | Second half of 2027 |
Source: Surface Transportation Board, press release PR-26-21, Aug 18, 2026; FreightWaves, "Regulators set schedule for review of UP-NS merger," Aug 2026.
Ground Truth: Nothing in this schedule requires anyone to act before September 4 except the parties who want to be inside the case rather than commenting on it from outside. That is a much lower bar to clear than most of what follows — a notice of intent is a short, largely administrative filing, not a legal brief — but it is a hard cutoff with no announced grace period.
2. Why "party of record" is the word worth understanding this week
What's new: The distinction between filing a public comment and being admitted as a party of record is not cosmetic. Parties of record can request specific conditions on the merger, participate in discovery, and are positioned to be heard through the full evidentiary process that runs through the November comment deadline and the February response deadline. A shipper who only submits a comment after November 18 is heard, but from a narrower procedural position.
Evidence: This is exactly the distinction the National Grain and Feed Association and allied shipper groups have already used. NGFA counsel has argued in filings that the UP-NS application "fails to consider rail-to-rail competition" in the way the Board's own competition-enhancement criteria require, and the grain group has joined chemical, fuel, fertilizer and industrial shipping interests in asking the Board to reject the application outright (Agri-Pulse, "Grain group joins other shipping interests in calling for rejection of UP-NS rail merger application," 2026). A separate consortium of shipper groups filed motions for summary denial on August 6, 2026 — before the case even came out of abeyance (FreightWaves, Aug 2026). Both actions required party-of-record standing to carry the procedural weight they were given.
Ground Truth: The associations most likely to protect an individual elevator's interests — NGFA foremost among them — are already positioned inside the case. An individual shipper's choice is not really "join or don't"; it is "rely entirely on NGFA's filing, or add a shipper-specific fact pattern the association's general filing can't carry." A single-railroad-served elevator with a specific rate or service complaint has a reason to be the second option that a diversified shipper without captive exposure does not.
3. What the ag-shipper objection actually is
What's new: The core grain-industry argument is not about rates in the abstract. It is about the loss of specific interchange points where a shipper currently has the option, at least in principle, of routing between two competing railroads.
Evidence: NGFA's filed position states plainly that captive shippers are the exposure: "this merger will deepen that captivity, eliminate what limited competitive options remain, and leave them exposed to service deterioration and rate increases with no recourse" (NGFA, quoted in Agri-Pulse coverage, 2026). Reporting on the broader shipper coalition's position names the specific mechanism: a combined UP-NS would create end-to-end single-railroad service across large parts of the country, eliminating interchange competition at points such as Chicago, St. Louis and New Orleans, where shippers have historically been able to bargain rates between the two carriers (Finance Yahoo/FreightWaves, "Union Pacific merger talk sparks agricultural shipper concerns," 2026).
| Interchange point named in shipper filings | Historical role |
|---|---|
| Chicago | UP/NS interchange — competitive routing option |
| St. Louis | UP/NS interchange — competitive routing option |
| New Orleans | UP/NS interchange — export-grain routing option |
Source: FreightWaves/Yahoo Finance coverage of shipper coalition filings, 2026, citing NGFA and allied groups. Named as points shippers have used to route between the two carriers; the merger would remove the competitive choice at each.
Separately, agricultural retailers have raised a more immediate, service-level concern rather than a structural one: reporting on ag-retailer filings flags specific rate and service issues expected during the transition period regardless of how the structural merits are ultimately decided (FreightWaves, "Rate, service issues flagged by ag retailers in Union Pacific-Norfolk Southern rail merger," 2026).
Ground Truth: Two distinct arguments are running in parallel and it is worth not collapsing them. The structural argument — interchange competition disappears — is what determines whether the merger is approved at all, and it plays out over the full 2026–2027 schedule. The transition-service argument — does fertilizer and grain move reliably during and after a combination this size — matters even if the merger is approved, and it is the one an individual elevator's operations desk should be tracking independent of the legal outcome.
4. The calendar that actually governs a shipper's next twelve months
What's new: Put the procedural dates against the crop calendar, because the two overlap in an unhelpful way: the entire comment-and-response window sits across fall harvest movement and the start of spring planting-input logistics, and the earliest possible decision doesn't land until after next fall's harvest is largely moved.
Evidence:
| STB date | Crop-calendar context |
|---|---|
| Sep 4, 2026 — party-of-record deadline | Mid-harvest for most of the Corn Belt |
| Nov 18, 2026 — comments/protests due | Harvest largely complete; fall fertilizer movement underway |
| Feb 16, 2027 — responses due | Pre-season input logistics for 2027 planting |
| May 28, 2027 — final briefs due | 2027 planting complete |
| 2H 2027 — earliest decision | 2027 harvest already moving |
Crop-calendar staging is this publication's own overlay on the STB dates above; it is not part of the Board's schedule.
A grain-handling operation deciding whether to file for party-of-record status this week is, in effect, deciding whether it wants a voice in a proceeding whose result will not be known until after two full crop cycles have already moved on whatever rail service exists in the meantime.
Ground Truth: The asymmetry here favors acting now over waiting. The party-of-record filing due September 4 is comparatively cheap procedurally; missing it and later wanting standing during the 2027 evidentiary fight is not something the schedule offers a second chance at. For a captive-served elevator, this week's filing deadline is a low-cost option on influence over a decision that otherwise arrives fully formed, eighteen months from now, with the shipper on the outside of the record that decided it.
References
- Surface Transportation Board, press release PR-26-21, "STB Adopts Procedural Schedule for Consideration of UP-NS Merger; Removes Proceeding from Abeyance," Aug 18, 2026. https://www.stb.gov/news-communications/latest-news/pr-26-21/
- FreightWaves, "Regulators set schedule for review of UP-NS merger," Aug 2026. https://www.freightwaves.com/news/regulators-set-schedule-for-review-of-up-ns-merger
- Agri-Pulse Communications, "Grain group joins other shipping interests in calling for rejection of UP-NS rail merger application," 2026. https://www.agri-pulse.com/articles/25105-grain-group-joins-other-shipping-interests-in-calling-for-rejection-of-up-ns-rail-merger-application
- FreightWaves (via Yahoo Finance), "Union Pacific merger talk sparks agricultural shipper concerns and regulatory focus," 2026. https://finance.yahoo.com/economy/policy/articles/union-pacific-merger-talk-sparks-130933568.html
- FreightWaves (via Yahoo Finance), "Rate, service issues flagged by ag retailers in Union Pacific-Norfolk Southern rail merger," 2026. https://finance.yahoo.com/economy/policy/articles/rate-issues-flagged-ag-retailers-180000928.html
Disclosures
Crop Root Zone is an independent publication. Nothing here is investment advice. Market calls, where included, reflect the editors' own read and are not a recommendation to buy or sell any security.
Fall Anhydrous Is 26% Cheaper Nitrogen Than Spring UAN28. The Inhibitor Has About $20 an Acre to Play With.
At $0.56 against $0.76 a pound of N, the form spread is worth $36 an acre at 180 units — and the independent nitrapyrin work puts the average corn response on ammonia at just over 2%, which sets a hard ceiling on what a stabilizer is worth paying for.
Fall nitrogen decisions get argued on agronomy — soil temperature, tile drainage, spring workload. This year the arithmetic is doing most of the work before agronomy is reached. Retail anhydrous ammonia costs $0.56 per pound of nitrogen. UAN28 costs $0.76. Urea costs $0.71, and UAN32 $0.72 (DTN/Progressive Farmer, prices for the week of Aug 24–28, 2026, published Sep 2, 2026). On 180 units of N, choosing ammonia over UAN28 is a $36-an-acre decision before anything else is considered.
That spread is the budget from which every other part of the fall decision has to be paid: the nitrification inhibitor, the risk of overwinter loss, and the cost of a second pass if the first one does not hold. This piece runs those numbers against the independent trial data rather than the label.
1. The form spread, at this week's prices
What's new: Nitrogen forms have decoupled sharply during 2026. Anhydrous is up 21% year over year while urea is up 4%, UAN28 up 2% and UAN32 down 5% — and yet anhydrous remains, by a wide margin, the cheapest pound of N on the retail board (DTN, Sep 2, 2026).
Evidence: Both facts can be true because they measure different things. The year-over-year column measures how much each form has moved; the cost-per-pound column measures where each one has arrived. Anhydrous has risen faster and is still cheapest, which tells you how large its structural discount was going into the year.
| Form | $/ton | $/lb N | YoY | |
|---|---|---|---|---|
| Anhydrous (82-0-0) | 923 | 0.56 | ███████ |
+21% |
| Urea (46-0-0) | 655 | 0.71 | █████████ |
+4% |
| UAN32 | 458 | 0.72 | █████████ |
−5% |
| UAN28 | 428 | 0.76 | ██████████ |
+2% |
Source: DTN/Progressive Farmer retail fertilizer trends, week of Aug 24–28, 2026, published Sep 2, 2026. Bars scaled on $/lb N.
| Rate (lb N/acre) | Anhydrous cost | UAN28 cost | Spread |
|---|---|---|---|
| 140 | $78.40 | $106.40 | $28.00 |
| 160 | $89.60 | $121.60 | $32.00 |
| 180 | $100.80 | $136.80 | $36.00 |
| 200 | $112.00 | $152.00 | $40.00 |
Derived from the DTN $/lb N figures above. Product cost only — excludes application, and excludes any loss.
$0.20/lb N
The anhydrous-to-UAN28 gap at the week of Aug 24–28, 2026 — a 26% discount on the nitrogen itself, worth $36 an acre at a 180-unit rate. (DTN/Progressive Farmer, Sep 2, 2026; per-acre figure derived)
2. What the independent trial data actually says about the inhibitor
What's new: The most-cited independent synthesis of nitrapyrin — the active ingredient in the widely used ammonia stabilizers — was conducted by Alison Eagle of Duke University's Nicholas Institute in February 2016 under contract to the Environmental Defense Fund, pooling field experiments across most of the US and Canada (NutrientStar).
Evidence: Its central results are less flattering to ammonia than the general reputation of the product suggests. Average corn yield increases were over 2% with anhydrous ammonia and almost 6% with urea; pooling mineral fertilizer sources together gave 3.3% in corn and 5.5% in wheat. Results with UAN, ammonium nitrate and ammonium sulfate on corn were reported as insignificant. Nitrapyrin worked best when incorporated into the soil, and the preliminary modeling found responses were not affected by tillage, irrigation status or crop rotation.
| Nitrapyrin, mean corn yield response | Response | Basis | |
|---|---|---|---|
| With urea | ~5.9% | ██████████ |
Pooled North American trials |
| All mineral N sources pooled | 3.3% | ██████ |
Pooled North American trials |
| With anhydrous ammonia | >2% | ████ |
Pooled North American trials |
| With UAN / AN / AMS | not significant | `` | Pooled North American trials |
Source: A. Eagle, Duke University Nicholas Institute for the Environmental Defense Fund, Feb 2016, as summarized by NutrientStar. Bars scaled on the reported percentages; the ">2%" figure is reported as a lower bound and is charted at 2%.
Vendor trial reporting reaches larger numbers. Corteva's own 2025 trial material describes results including a stated 18-bushel-per-acre advantage on stabilized fall-applied acres, and roughly 12% more nitrogen remaining in the ammonium form into the second half of May. Both sets of numbers can be accurate about different things — one is a pooled mean across many years and sites, the other a selection of trials — but only one of them is the number to budget against.
Ground Truth: The counterintuitive result in the independent data is that nitrapyrin's smallest corn response is on the product it is most associated with. That is not a contradiction; it is the mechanism working as designed. Anhydrous already resists nitrification on its own — the injection band raises pH and holds ammonium locally, which is most of what an inhibitor is added to accomplish. Urea has no such band, so the inhibitor is doing more of the work and shows a larger response. Buying a stabilizer for ammonia is buying the tail of a distribution, not its middle.
3. The break-even, run properly
What's new: Rather than assert a retail price for a stabilizer — quotes vary by dealer, volume and formulation, and we could not source a 2026 figure to a public tier — the honest form of this question is a break-even. At what per-acre cost does the independent mean response stop paying?
Evidence: At 180 bushels and the Sep 4, 2026 December corn settlement of $5.36¾ (Brownfield Ag News, Sep 4, 2026), a percentage yield response converts to dollars as follows.
| Yield response | Bushels gained (180 bu base) | Value at $5.36¾ | What it corresponds to |
|---|---|---|---|
| 2.0% | 3.6 | $19.32 | Independent mean, anhydrous |
| 3.3% | 5.9 | $31.88 | Independent mean, all mineral N |
| 5.9% | 10.6 | $56.97 | Independent mean, urea |
| 10.0% | 18.0 | $96.62 | Vendor trial territory |
Derived from the NutrientStar-reported response percentages and the Sep 4, 2026 December corn settlement. A yield response is not a guaranteed outcome; these are the dollar values of the reported means, not a forecast for any field.
So the arithmetic that matters for an ammonia program is this: the independent mean response justifies a stabilizer up to roughly $19 an acre, and no further. Above that number, on average and across many site-years, the product costs more than the yield it returns. Growers quoted materially above $20 an acre on an ammonia stabilizer are being asked to pay for the vendor distribution rather than the pooled one.
Ground Truth: The right way to think about a stabilizer on fall ammonia is not as a yield product at all. It is a hedge on the $36-an-acre form spread. The spread is the thing being protected: if fall-applied N is lost and has to be replaced in spring, the replacement pound is a UAN or urea pound at $0.71–$0.76, and the entire economic case for having gone in the fall disappears. Priced under about $20 an acre, the inhibitor is a reasonable premium against that outcome. Priced over it, the grower is spending the spread to defend the spread.
4. The condition the whole thing depends on
What's new: None of the above survives an early application. The extension position across the Corn Belt is consistent and unusually unanimous: wait until soil temperature at four inches is below 50°F and the forecast supports continued cooling before applying ammonia in the fall (Iowa State University Integrated Crop Management; University of Illinois farmdoc; Purdue Extension).
Evidence: The reason is that the loss pathway is temperature-driven. How much fall-applied nitrogen is at risk over winter depends on how much of it nitrifies to nitrate before spring — nitrate leaches and denitrifies, ammonium largely does not. Nitrification is a bacterial process that effectively stalls in cold soil, so the 50°F threshold is not a rule of thumb about convenience; it is the point at which the biology slows enough for the nitrogen to keep.
The stabilizer's role sits inside that constraint, not outside it. Extension guidance is explicit that a nitrification inhibitor does not replace waiting for the temperature threshold or applying at proper depth; it helps most in the specific case where soils warm back up for a period after application. That is a narrow and real job, and it is different from the job the marketing implies.
| Fall ammonia, the sequence that has to hold | Why |
|---|---|
| Soil at 4 in. below 50°F, trending cooler | Stalls nitrification — the loss pathway |
| Proper injection depth and sealing | Retains ammonia in the band |
| Inhibitor, if used | Covers a warm spell after application |
| Adequate soil moisture at application | Poor sealing in dry or cloddy soil loses product at the knife |
Structural summary of Iowa State, Illinois farmdoc and Purdue Extension guidance; not a data table.
Ground Truth: The order of operations here is the whole decision, and an inhibitor purchased to compensate for an early application is money spent to make a mistake slightly less expensive. The $36-an-acre form spread is durable — it will still be there in three weeks. Soil temperature is not a constraint that negotiates. A grower who applies at 55°F with a stabilizer is in a worse position than one who applies at 48°F without one.
5. What would change this read
Three things, and two of them are prices.
The form spread itself is not fixed. Anhydrous rose 21% year over year while UAN28 rose 2%; another move of that size closes the gap and removes the economic reason to prefer fall ammonia at all. The $0.20 spread should be re-checked against the current retail print before the decision is made, not assumed from September.
The corn price sets the break-even. At $5.36¾ the independent mean response is worth $19.32 an acre; at $4.62 — the crop insurance projected price this year — the same response is worth $16.63. A lower corn price makes the stabilizer harder to justify, not easier, which is the opposite of how input decisions are usually framed in a weak market.
And the trial base is old. The Duke synthesis dates to 2016 and pools work conducted before it. Genetics, nitrogen rates and stabilizer formulations have all moved since. That does not invalidate the pooled mean — it remains the best independent number available — but it is a reason to weight a local, recent strip trial over any published average, including this one.
References
- DTN/Progressive Farmer, "Fertilizer Prices Fall as UAN28, Urea Lead the Way Lower," Sep 2, 2026 (prices for the week of Aug 24–28, 2026) — https://www.dtnpf.com/agriculture/web/ag/crops/article/2026/09/02/fertilizer-prices-fall-uan28-urea
- NutrientStar, "Instinct II and N-Serve: Research Findings," summarizing A. Eagle, Duke University Nicholas Institute for Environmental Policy Solutions, Feb 2016, under contract to the Environmental Defense Fund — https://nutrientstar.org/tool-finder/nitrapyrin-research-findings/
- Iowa State University Integrated Crop Management, "Fall Anhydrous Ammonia Applications: What to know about soil moisture" — https://crops.extension.iastate.edu/post/fall-anhydrous-ammonia-applications-what-know-about-soil-moisture
- University of Illinois farmdoc, "Soil temperatures and fall ammonia application" — https://farmdoc.illinois.edu/field-crop-production/soil-temperatures-and-fall-ammonia-application-2.html
- Purdue University Extension, "Fall-applied Anhydrous Ammonia Best Practices" — https://extension.entm.purdue.edu/newsletters/pestandcrop/article/fall-applied-anhydrous-ammonia-best-practices
- NDSU Extension, "Nitrogen Extenders and Additives for Field Crops" — https://www.ndsu.edu/agriculture/extension/publications/nitrogen-extenders-and-additives-field-crops
- Corteva Agriscience, nitrogen stabilizer trial results and FAQ — https://www.corteva.com/us/Resources/crop-protection/corn/nitrogen-stabilizer-trial-results.html
- Brownfield Ag News, "Closing Grain and Livestock Futures: September 4, 2026" — https://www.brownfieldagnews.com/market-news/closing-grain-and-livestock-futures-september-4-2026/
Disclosures
Crop Root Zone is an independent publication. Nothing here is investment advice. Market calls, where included, reflect the editors' own read and are not a recommendation to buy or sell any security.
Every Sulfur Fertilizer Is Priced Off One Tampa Contract. Gypsum Is the Exception, and That Is Getting Less True.
Calcium sulfate is priced by drywall demand, coal scrubbers and phosphate waste rather than by the sulfur market that just set a second consecutive record — which is the entire argument for it, and also where its own supply problem is hiding.
The third-quarter Tampa contract for molten sulfur delivered settled at $705 per long ton, a record and an 8% rise on the $655/lt second-quarter number, which had itself already passed the previous peak set in 2008 (Argus Media, Jul 13, 2026). Against a $310/lt base at the start of the year, that is a 127% increase in the cost of the sulfur atom in nine months.
Practically every sulfur fertilizer on the market inherits that. Ammonium sulfate is manufactured from it. Ammonium thiosulfate is derived off it. Elemental sulfur products are it. There is one commonly used agricultural sulfur source that is not indexed to it at all, and it is worth understanding both why that is true and how long it will stay true.
1. The index everything else is on
What's new: The Tampa contract is the reference point for North American sulfur, and it has run further and faster in 2026 than the market expected. Argus's own start-of-year view had buyers and sellers projecting the first-quarter Tampa contract at $475–520/lt, up from $310/lt, and estimated that this would raise ammonium sulfate production costs by roughly $40–50 per short ton depending on grade.
Evidence: The actual Q3 settlement of $705/lt is far above that projected range. Scaling the same pass-through relationship linearly from the base — a $187.50/lt increase producing $45/st of amsul cost, against an actual $395/lt increase — implies roughly $95/st of ammonium sulfate cost inflation, about double what was projected in January. That figure is derived, using Argus's own stated relationship applied to a settlement it did not anticipate; it is not an Argus estimate and it assumes a linear pass-through that no producer has confirmed.
| Tampa molten sulfur, delivered | $/lt | vs $310 base | |
|---|---|---|---|
| Q1 2026 base | 310 | ████ |
— |
| Q1 2026, projected at the time | 475–520 | ███████ |
+$165–210 |
| Q2 2026 settlement | 655 | █████████ |
+$345 |
| Q3 2026 settlement | 705 | ██████████ |
+$395 |
Source: Argus Media, Jul 13, 2026; Argus Media 2026 amsul viewpoint (for the $310 base and the $475–520 projection).
Spot is higher again. Argus assessed US Gulf refinery export sulfur at $1,100–1,150/mt FOB on Jul 9, 2026, roughly 60% above the delivered contract, as Middle East export flows through the Strait of Hormuz collapsed and US Gulf cargoes were redirected.
+127%
Increase in the Tampa molten sulfur contract from the $310/lt Q1 2026 base to the record $705/lt Q3 settlement — the input cost carried, in some proportion, by every sulfate and elemental sulfur fertilizer. (Argus Media, Jul 13, 2026; percentage derived)
2. Why gypsum is not on that index
What's new: Agricultural gypsum is calcium sulfate dihydrate, CaSO₄·2H₂O, containing roughly 13–16% sulfur and 17–20% calcium. Critically, almost none of it is manufactured from elemental sulfur for agricultural use. It arrives as mined natural rock, as flue-gas desulfurization (FGD) byproduct from coal-fired power generation, as phosphogypsum from phosphate fertilizer manufacture, and as recycled drywall.
Evidence: Each of those routes has its own price-setting market. Mined gypsum is priced by construction demand for wallboard. FGD gypsum is priced by what a utility can get for a scrubber byproduct against the cost of landfilling it. Recycled material is priced by construction-waste diversion economics. None of those is a function of the Tampa contract.
The consequence is a genuine and unusual non-correlation. In a year when the sulfur atom repriced 127%, the delivered cost of sulfate sulfur from gypsum moved with drywall.
| Sulfur source | What sets its price | Indexed to Tampa? |
|---|---|---|
| Ammonium sulfate (21-0-0-24S) | Sulfur feedstock + ammonia | Yes, directly |
| Ammonium thiosulfate (12-0-0-26S) | Sulfur + ammonia, derived | Yes, directly |
| Elemental sulfur (90%+ S) | The sulfur market itself | Yes — it is the index |
| Potassium thiosulfate | Sulfur + potash | Yes, partly |
| Agricultural gypsum (CaSO₄·2H₂O) | Wallboard, coal scrubbers, phosphate waste, recycling | No |
Structural summary; not a price table.
Ground Truth: Non-correlation is the actual product being bought here, and it is worth more than the headline price in a year like this one. A buyer sourcing sulfate from gypsum is not making a bet that gypsum is cheap — it may or may not be, depending on freight. They are removing a single input's geopolitical risk from their sulfur line entirely. That is a portfolio decision rather than an agronomic one, and it is the kind of decision that only looks obvious after a shipping lane closes.
3. What it costs per pound of actual sulfur
What's new: Raw, non-pelletized agricultural-grade gypsum starts as low as $55/ton for recycled material and runs $140–195/ton for natural or high-volume standard product. A typical one-ton-per-acre application delivers roughly 320 lb of sulfate-sulfur and 400 lb of calcium (Michigan State University Extension).
Evidence: Dividing gives the sulfate sulfur cost, before freight and spreading:
| Gypsum grade | $/ton | lb S/ton | $/lb S | |
|---|---|---|---|---|
| Recycled, raw | 55 | 320 | 0.17 | ███ |
| Standard, low end | 140 | 320 | 0.44 | ███████ |
| Standard, high end | 195 | 320 | 0.61 | ██████████ |
Derived from published gypsum price ranges and the MSU Extension figure of ~320 lb sulfate-S per ton applied. Excludes freight and application, which for a bulk one-ton-per-acre product are a large share of delivered cost.
That freight caveat is not a footnote — it is most of the story on a low-analysis product. Gypsum is 84–87% not-sulfur by weight. Hauling a ton to deliver 320 pounds of nutrient is economic within a short radius of a source and quickly stops being economic outside it. The published price is a gate price at a supply point; the number that matters is delivered and spread, and it is intensely local.
The agronomic form is a real advantage, though. Gypsum's sulfur is already sulfate — immediately plant-available, no oxidation step required. Elemental sulfur has to be biologically oxidized to sulfate before a crop can use any of it, a process whose rate depends on particle size, temperature and moisture, and which is the reason elemental products are a fall decision rather than an in-season one. Gypsum's calcium is a genuine second nutrient rather than a filler claim, particularly on soils where the calcium is wanted without the pH change that lime brings.
| Property | Gypsum | Ammonium sulfate | Elemental sulfur |
|---|---|---|---|
| S form | Sulfate — immediately available | Sulfate — immediately available | Elemental — must oxidize first |
| S analysis | 13–16% | 24% | 90%+ |
| Second nutrient | Calcium 17–20% | Nitrogen 21% | None |
| Soil pH effect | Essentially neutral | Acidifying | Acidifying |
| Priced off Tampa sulfur | No | Yes | Yes |
Structural comparison; analyses are standard product specifications.
Ground Truth: The right comparison is not gypsum against ammonium sulfate on price per pound of sulfur — that comparison flatters gypsum by ignoring that AMS delivers 21% nitrogen the grower would otherwise buy. The right comparison is against a deliberately unbundled program: gypsum for the sulfate plus the cheapest available nitrogen form separately. At retail anhydrous of $0.56/lb N (DTN, Sep 2, 2026), that unbundled route is the one worth pricing out, and on a farm within haul distance of a gypsum source it is likely to win on cost. Outside that radius, freight settles it before agronomy gets a vote.
4. The part that is getting less true
What's new: Gypsum's independence from the sulfur market is real today and structurally eroding. Two of its three byproduct streams are contracting, and one of them is contracting because of the same sulfur price.
Evidence: FGD gypsum output in developed economies has plateaued after years of rapid growth — the direct consequence of coal-fired generation retiring, since scrubber byproduct only exists where coal is burned. Meanwhile phosphogypsum is a byproduct of phosphate fertilizer manufacture, and US phosphate manufacture is being curtailed: Mosaic has idled or sharply reduced phosphate output at Bartow and Riverview in Florida and Faustina and Uncle Sam in Louisiana, explicitly because of sulfur availability and cost (World Fertilizer, Jul 9, 2026), with a WARN notice covering 206 Louisiana workers filed in late August (The Advocate, Aug 2026).
That second link is the one worth sitting with. Phosphogypsum is only produced when sulfuric acid is reacted with phosphate rock. Less phosphate production means less phosphogypsum. So a sulfur price high enough to stop phosphate plants also reduces the supply of the one sulfur fertilizer that is not priced off sulfur.
| Gypsum supply stream | Direction | Driver |
|---|---|---|
| Mined natural | Stable | Construction demand for wallboard |
| FGD (coal scrubbers) | Plateaued in developed economies | Coal-fired generation retiring |
| Phosphogypsum | Falling with US phosphate curtailments | The sulfur price itself |
| Recycled drywall | Growing slowly | Construction-waste diversion |
Structural summary drawn from synthetic-gypsum market reporting and the 2026 phosphate curtailment coverage cited below; direction only, not quantified here.
Ground Truth: The hedge is real for the 2027 crop year and structurally weaker after it. Gypsum's non-correlation with the sulfur market depends on its supply being produced for reasons that have nothing to do with sulfur — and the phosphogypsum stream fails that test precisely when the hedge is most wanted. This is the general shape of byproduct-sourced inputs, and it is worth recognizing before relying on one: a byproduct is cheap because someone else pays for its production, which also means its availability is decided by an industry that is not thinking about you. When that industry's own economics break, the byproduct goes first.
5. What a buyer should actually do with this
The practical question is narrow: is gypsum a sulfur source for your acres, or an interesting fact about someone else's?
Price it delivered, from a named source, this month. The $140–195/ton range is a gate price. The number that decides this is the delivered-and-spread cost from the nearest actual supply point, and for a one-ton-per-acre bulk product that number diverges enormously with haul distance. Get the quote before doing any further arithmetic.
Price it unbundled against your nitrogen plan, not against ammonium sulfate. Comparing a sulfur-only product to a nitrogen-and-sulfur product on cost per pound of sulfur is a category error. Compare gypsum plus your cheapest nitrogen form against AMS plus a proportionally reduced nitrogen buy.
Soil-test rather than assume the response. Sulfur deficiency is genuinely more common than it was — atmospheric deposition has fallen sharply over decades — but "more common" is not "universal," and the sulfur response literature is full of trials in which a sulfur application moved the soil test and did not move the yield. The measurement establishes that the input arrived. It does not establish that it was needed.
And watch the Q4 Tampa settlement, due around the start of October. If it settles near the concurrent spot level, every sulfate product on the board reprices and the gypsum arithmetic improves further. If sulfur flows through Hormuz restore, the whole comparison narrows back toward normal and the freight disadvantage reasserts itself.
References
- Argus Media, "Tampa 3Q liquid sulphur price hits record $705/lt," Jul 13, 2026 — https://www.argusmedia.com/en/news-and-insights/latest-market-news/2851577-tampa-3q-liquid-sulphur-price-hits-record-705-lt
- Argus Media, "Viewpoint: Sulfur costs to support amsul prices in 2026" — https://www.argusmedia.com/en/news-and-insights/latest-market-news/2770651-viewpoint-sulfur-costs-to-support-amsul-prices-in-2026
- Michigan State University Extension, "Gypsum offers an economic source of sulfur for deficient soybean acres" — https://www.canr.msu.edu/news/gypsum_offers_an_economic_source_of_sulfur_for_deficient_soybean_acres
- Ohio State University Extension, "Response of Soils and Crops to Gypsum Application in Ohio," Ohioline ANR-0153 — https://ohioline.osu.edu/factsheet/anr-0153
- University of Arkansas Division of Agriculture, "Gypsum as a Soil Amendment," FSA2199 — https://www.uaex.uada.edu/publications/pdf/FSA2199.pdf
- World Fertilizer, "Mosaic reveals plans to reduce Brazil and US output," Jul 9, 2026 — https://www.worldfertilizer.com/phosphates/09072026/mosaic-reveals-plans-to-reduce-brazil-and-us-output/
- The Advocate (Baton Rouge), "Mosaic to lay off 206 at St. James fertilizer plants," Aug 2026 — https://www.theadvocate.com/baton_rouge/news/business/louisiana-fertilizer-plants-lay-off-200-as-war-with-iran-drives-up-cost-of-key/article_c550aee7-016d-4af5-ae2b-497f7e1c2fda.html
- DTN/Progressive Farmer, "Fertilizer Prices Fall as UAN28, Urea Lead the Way Lower," Sep 2, 2026 — https://www.dtnpf.com/agriculture/web/ag/crops/article/2026/09/02/fertilizer-prices-fall-uan28-urea
Disclosures
Crop Root Zone is an independent publication. Nothing here is investment advice. Market calls, where included, reflect the editors' own read and are not a recommendation to buy or sell any security.
The Cover Crop That Actually Makes Nitrogen Has About Three Weeks Left to Get Planted. The One Most People Seed Never Made Any.
Cereal rye scavenges 25–50 lb of N it did not create and can immobilize it into next spring. A legume fixes it — but only if it establishes before frost, and its credit is worth 36% more if it replaces sidedress UAN28 instead of fall anhydrous.
Cereal rye seed runs about $20.00 an acre in the University of Nebraska's 2026 cover crop budget — 80 lb at $0.25/lb — and it is the most widely seeded cover crop in the Corn Belt largely because it is the cheapest, the most forgiving of a late planting date, and the hardest to kill by accident. It also does not manufacture a single pound of nitrogen. Cereal rye scavenges and holds 25 to 50 lb of N per acre that was already in the soil profile (SARE, Managing Cover Crops Profitably), which is a real service — it is nitrogen that does not leach — but it is recycling, not production, and ahead of a corn crop the timing of its release can work against the following cash crop rather than for it. The cover crop that genuinely adds nitrogen to the system is a legume, and a legume has a planting deadline that a grass does not.
1. What a nitrogen credit is worth, and why the answer is not one number
What's new: Retail nitrogen prices published September 2 put a four-form spread of 20 cents per pound of N between the cheapest and dearest nitrogen a corn grower buys. A cover crop credit is denominated in pounds of N; its dollar value therefore depends entirely on which of those four forms it displaces.
Evidence:
| Nitrogen form displaced | $/lb N | Value of a 50 lb/ac credit | Value of a 100 lb/ac credit |
|---|---|---|---|
| Anhydrous (fall applied) | 0.56 | $28.00 | $56.00 |
| Urea | 0.71 | $35.50 | $71.00 |
| UAN32 | 0.72 | $36.00 | $72.00 |
| UAN28 (typical sidedress) | 0.76 | $38.00 | $76.00 |
Source: per-pound-nitrogen prices from DTN/Progressive Farmer retail survey, week of Aug 24–28, 2026, published Sep 2, 2026. Credit values are arithmetic.
| Value of a 50 lb N credit, by form displaced | $/acre | |
|---|---|---|
| UAN28 | 38.00 | ██████████ |
| UAN32 | 36.00 | █████████ |
| Urea | 35.50 | █████████ |
| Anhydrous | 28.00 | ███████ |
Source: derived from DTN per-pound-N figures, Sep 2, 2026.
The gap between the top and bottom rows is $10.00 an acre on identical biology. That is not a rounding difference — it is 36% of the credit's value, decided entirely by an agronomic sequencing choice made the following spring.
Ground Truth: Most cover crop economics are written against the cheapest nitrogen on the board, because anhydrous is the cheapest and it is the reflexive comparison. That understates the case. A legume credit is expressed as plant-available nitrogen released through the growing season, which is chronologically the sidedress nitrogen, not the fall pre-plant. If the credit lets a grower cut the in-season pass rather than the fall pass, it should be valued at $0.76/lb, not $0.56 — and that revaluation is worth more than most of the seed-cost differences the decision usually turns on.
2. Rye scavenges. It does not fix. Sometimes it takes.
What's new: The distinction between a scavenged pound and a fixed pound is not academic; it determines whether the following corn crop needs more nitrogen or less.
Evidence: Cereal rye takes up residual soil nitrate and holds it in biomass over winter, in the range of 25–50 lb N/acre (SARE). That nitrogen is not new. It re-enters the plant-available pool only when the rye residue decomposes, and the rate of that release is governed by the residue's carbon-to-nitrogen ratio. Rye terminated late, at high biomass and a wide C:N ratio, decomposes slowly and can immobilize soil nitrogen during early corn growth — precisely the window when corn is least able to tolerate a shortfall.
| Cover | Nitrogen mechanism | Reported N range | Available to next corn crop? |
|---|---|---|---|
| Cereal rye | Scavenging (recycling) | 25–50 lb/ac held | Delayed; can immobilize if terminated late at high biomass |
| Hairy vetch, full seeding | Biological fixation (new N) | 40–200 lb/ac | Yes, released through the season |
| Cereal rye + hairy vetch mix | Both | 50–100 lb/ac credit before corn | Yes; the mix moderates the C:N ratio |
Source: SARE, "Managing Cover Crops Profitably" — Cereal Rye and Hairy Vetch profiles. Ranges are as published and are wide because they span soil types, seeding dates, and termination timing.
The mix row is the one that does the work. A rye–vetch mixture narrows the residue's carbon-to-nitrogen ratio relative to rye alone, which reduces the immobilization risk while retaining rye's establishment reliability and erosion control. Published credits before corn of 50–100 lb N/acre are for the mixture, not for rye by itself.
Ground Truth: The most common cover crop failure in a nitrogen budget is not agronomic, it is bookkeeping. A grower plants rye, reads a 25–50 lb figure, and books it as a fertilizer saving for the following corn crop. It is not a saving in that year; it is retained nitrogen with an uncertain release date, and if termination runs late the same practice can require a starter nitrogen bump to cover early-season immobilization. Rye earns its keep on erosion, compaction, weed suppression and nitrate retention. Budgeting a fertilizer credit against it — in the year immediately following — is the step to be skeptical of.
3. The cost side, and how much of it the credit covers
What's new: Seed cost has fallen materially over a decade of survey data, which changes a calculation many operations last ran when it was more expensive.
Evidence: The national cover crop survey conducted by CTIC with SARE support found a median seed cost of $16–20/acre, with 46% of respondents paying $15/acre or less and about a quarter paying $26 or more — against a median of $25/acre in the 2012 and 2013 surveys. Growers using common cereals with local seed supply and no freight reported as little as $5–10/acre.
| Cost element | $/acre | Basis |
|---|---|---|
| Cereal rye seed, 80 lb @ $0.25/lb | 20.00 | University of Nebraska 2026 cover crop budget |
| Cover crop seed, national median (all species) | 16–20 | CTIC/SARE national survey, seed only |
| Seeding operation (drill or aerial) | 12–18* | Estimate — varies by method and region |
| Termination (herbicide + application) | 12–18* | Estimate — often shares a pass with burndown |
*Estimated ranges, not survey values. Termination frequently shares an existing burndown pass, in which case its marginal cost approaches zero.
Sources: University of Nebraska Center for Agricultural Profitability, 2026 cover crop budget; CTIC/SARE National Cover Crop Survey.
Set the two sides together. A rye–vetch mix delivering a published 50–100 lb N/acre credit before corn is worth $38.00 to $76.00 an acre if it displaces sidedress UAN28 at current prices, and $28.00 to $56.00 if it displaces fall anhydrous. Seed for a mix runs above the rye-only figure — vetch seed is the expensive component — and the seeding pass has to be paid for either way. At the top of the credit range against the dearest nitrogen, the practice pays for itself on nitrogen alone. At the bottom of the range against the cheapest nitrogen, it does not, and the case has to be made on the other benefits.
$0.20/lb N
The spread between the cheapest and dearest nitrogen a corn grower buys this month — and therefore the leverage that the sequencing of a cover crop credit has over its dollar value. (DTN/Progressive Farmer, Sep 2, 2026)
Ground Truth: The honest summary is that a nitrogen credit does not, on its own, justify a cover crop program in most Corn Belt situations at today's nitrogen prices. It covers between roughly half and all of the cost depending on species mix and which nitrogen it replaces. That is a real contribution and it is not the whole case — which is the correct conclusion, because an operation that adopts covers purely on a nitrogen credit will abandon them the first year anhydrous gets cheap.
4. The deadline is the part that is not negotiable
What's new: The two species behave completely differently with respect to seeding date, and September is where they separate.
Evidence: Cereal rye is the most date-tolerant cover crop in common use — it will establish from a late seeding, including after corn harvest in much of the Corn Belt, and still produce useful spring biomass. Hairy vetch is not. A legume must establish sufficient root and crown growth before the ground freezes to survive the winter and, critically, to have a functioning rhizobial association capable of fixing nitrogen in the spring. A vetch stand seeded too late either winterkills outright or survives thin and fixes a fraction of its published range.
| Decision | Window | Consequence of missing it |
|---|---|---|
| Seed a legume or legume mix | Now through roughly late September in the central Corn Belt | The nitrogen-fixing option is gone for the year; only scavenging remains |
| Seed cereal rye alone | Through and after harvest in much of the region | Little — rye is date-tolerant |
| Decide which nitrogen the credit will replace | Before spring N is prepaid | The credit is valued at $0.56 instead of $0.76 by default |
Regional windows are indicative; local extension guidance governs. The point is the asymmetry between the two species, not a specific date.
Note the sequencing trap in that table. The third row happens months after the first two, but it is decided by them — a grower who prepays the full fall anhydrous program in September has, in effect, already chosen to value any subsequent cover crop nitrogen at the cheap rate, because there is no longer an expensive in-season pass left to displace.
Ground Truth: The scarce thing in this decision is not money, it is the calendar. Rye can be seeded almost whenever; a legume cannot, and the legume is the only one of the two that adds nitrogen rather than moving it around. An operation that intends to build a nitrogen credit into its program has roughly three weeks to act on that intention this year, and the same operation has until spring to decide whether that credit is worth $28 an acre or $38 — which is a decision it can still make, for free, simply by leaving the in-season nitrogen pass as the one the cover crop is allowed to replace.
References
- SARE, Managing Cover Crops Profitably — Cereal Rye profile. https://www.sare.org/publications/managing-cover-crops-profitably/nonlegume-cover-crops/cereal-rye/
- SARE, Managing Cover Crops Profitably — Hairy Vetch profile. https://www.sare.org/publications/managing-cover-crops-profitably/legume-cover-crops/hairy-vetch/
- CTIC / SARE, National Cover Crop Survey — seed cost distribution and medians. https://www.sare.org/publications/cover-crop-economics/how-to-get-a-faster-return-from-cover-crops/creating-a-baseline-for-cover-crop-costs-and-returns/
- University of Nebraska–Lincoln, Center for Agricultural Profitability, 2026 crop budget #083, Cover Crop — Grazing, No-Till. https://cap.unl.edu/
- DTN/Progressive Farmer, "Fertilizer Prices Fall as UAN28, Urea Lead the Way Lower," Sep 2, 2026. https://www.dtnpf.com/agriculture/web/ag/crops/article/2026/09/02/fertilizer-prices-fall-uan28-urea
Disclosures
Crop Root Zone is an independent publication. Nothing here is investment advice. Market calls, where included, reflect the editors' own read and are not a recommendation to buy or sell any security.
A Week of Delay on a Manganese Deficiency Costs 5% of the Soybean Crop. Tank-Mixing It With Glyphosate Wrong Can Cost 30% of the Weed Control.
Both numbers come from the same body of research and point the same direction: manganese correction on soybeans has to happen fast, and it has to happen with the right source, or the fix and the herbicide pass start working against each other.
Soybean growers correcting a manganese deficiency face two clocks that pull in different directions. The agronomic literature is specific about the first one: yield is decreased roughly 5% for every week a manganese application is delayed once deficiency symptoms appear (Bayer Crop Science, "Manganese Fertilizer and Glyphosate Antagonism"). The temptation that follows is obvious — tank-mix the correction into whatever glyphosate pass is already scheduled and save a trip. The same literature is equally specific that doing so with the wrong manganese source can cut the glyphosate application's own weed control by 10% to 30% (Purdue University, Camberato, "Glyphosate-Manganese Interactions"). Fixing the deficiency fast is worth real yield. Fixing it carelessly can cost real weed control. Both facts sit inside the same input decision.
1. The deficiency, and why it's a soybean-specific problem this year
What's new: Manganese deficiency shows up most often on high-pH, sandy, or high-organic-matter soils, and soybeans are more sensitive to it than corn. The scale of exposure this year is set by acreage: USDA's June 2026 Acreage report puts soybean planted area at 85.4 million acres, up 5% from 2025, and roughly 95% of soybean acres nationally are planted to herbicide-tolerant varieties — overwhelmingly glyphosate-tolerant traits or stacks that include one (USDA NASS, Acreage report, Jun 30, 2026; USDA ERS, glyphosate use in soybean production).
Evidence:
| Figure | Value |
|---|---|
| 2026 US soybean planted acreage | 85.4 million acres |
| Change vs. 2025 | +5% |
| Share planted to herbicide-tolerant (glyphosate-dominant) varieties | ~95% |
| Approximate acreage where a glyphosate pass is the default herbicide program | ~81.1 million acres |
Sources: USDA NASS, Acreage report, Jun 30, 2026 (planted area); USDA ERS, Economic Research Service chart of note on glyphosate use in soybean production (adoption share). Acreage-where figure is this publication's calculation: 85.4M × 95%.
That is the population of acres where, on any field with a manganese-deficient soil test and an existing glyphosate program, the tank-mix temptation described in this article applies by default rather than by exception.
Ground Truth: This is not a niche input question. It sits at the intersection of the most common soybean soil deficiency and the most common soybean herbicide program, on a crop footprint that just grew 5% year over year. A retailer serving Mn-deficient ground is making this call on a meaningful share of a 85-million-acre crop, not a handful of unusual fields.
2. The cost of waiting: 5% a week, and what that is worth
What's new: The 5%-per-week figure is not a soft rule of thumb in the source material — it's stated as the expected yield penalty for each week manganese correction is delayed once symptoms are visible. Put a soybean price against it and the delay has a concrete dollar cost.
Evidence: At a 60 bu/acre yield goal and a $12.51/bu new-crop soybean price (CBOT, September 2026 contract, Aug 26, 2026 settlement), a single week of delay costs:
| Value | |
|---|---|
| Yield goal | 60 bu/acre |
| Yield loss per week of delay | 5% = 3.0 bu/acre |
| Soybean price (Sep '26 contract) | $12.51/bu |
| Cost per week of delay | $37.53/acre |
Yield-loss-per-week figure: Bayer Crop Science, "Manganese Fertilizer and Glyphosate Antagonism." Price: CBOT September 2026 soybean contract, settlement Aug 26, 2026, via AGSIST/Barchart. Dollar figure is this publication's calculation and scales linearly with the yield goal and price assumed — a 40 bu/acre goal at the same price and delay produces $25.02/acre per week; an 80 bu/acre goal produces $50.04/acre per week.
$37.53/acre
The estimated yield cost of a single week's delay correcting a manganese deficiency on a 60 bu/acre soybean field at the September 2026 contract price — before counting a second or third week, which the same literature says compounds roughly linearly. (Bayer Crop Science yield-loss figure; CBOT Sep '26 settlement, Aug 26, 2026.)
Ground Truth: This is the number that makes tank-mixing tempting in the first place. If a scheduled glyphosate pass is a week or two away and a separate Mn-only trip would push correction out past it, the yield math argues hard for getting manganese on now — which usually means putting it in the tank that's already going across the field. That is exactly the decision the next section says has a wrong way to make it.
3. The cost of doing it wrong: 10-30% of the herbicide pass
What's new: Not every manganese source behaves the same way in a glyphosate tank. Purdue's Camberato compiled trial results across manganese formulations and found the antagonism is source-specific and, in some combinations, severe enough to be called "greatly reduced" control rather than a marginal loss.
Evidence:
| Manganese source in the tank | Effect on glyphosate weed control |
|---|---|
| Ethylaminoacetate-manganese | Greatly reduced control |
| Lignin sulfate-manganese | 10-30% reduced efficacy |
| MnSO₄ powder (untreated with AMS) | 10-30% reduced efficacy |
| Manganese applied 2 days before glyphosate | Velvetleaf control down 15% |
| EDTA-manganese | Glyphosate performance enhanced — +25% giant foxtail, +40% velvetleaf control |
| MnSO₄ with 17 lb ammonium sulfate/100 gal added | Antagonism substantially mitigated |
Source: Purdue University, Camberato, "Glyphosate-Manganese Interactions and Impacts on Crop Production," compiling multiple trial results. Figures as reported in the underlying research; this publication did not re-run the trials.
| Tank-mix outcome | Weed control impact | |
|---|---|---|
| EDTA-Mn + glyphosate (velvetleaf) | +40% | ██████████ |
| EDTA-Mn + glyphosate (giant foxtail) | +25% | ██████ |
| MnSO₄/lignin sulfate-Mn, worst case | −30% | ████████ |
| Mn applied 2 days pre-glyphosate (velvetleaf) | −15% | ████ |
Bars show magnitude of effect (positive or negative), scaled so the largest absolute value is ten blocks. Source as above.
Ground Truth: The spread between the best and worst combination in this table is not a rounding difference — it runs from a 40-point improvement in weed control to control described as "greatly reduced." The source of the manganese and the sequencing of the tank matter more than whether a manganese correction happens at all in the same pass. "Tank-mix Mn with glyphosate" is not one decision; it is several, and the research says they don't perform alike.
4. Reading the two numbers together
What's new: Neither number, alone, tells a retailer or grower what to do. Together they define the actual decision: correct fast, but pick the tank-mix combination the research supports rather than whatever manganese source happens to be on the shelf.
Evidence: The safe path through both risks, as the underlying research describes it, is not "never tank-mix" — it is source selection and buffering. MnSO₄ is described as the generally preferred source for tank-mixing with glyphosate specifically because it is more soluble and provides greater crop safety than chelated forms at equivalent rates, and adding ammonium sulfate at 17 lb/100 gallons is the specific mitigation step called out in the trial compilation. A grower who defaults to an EDTA-chelated product because it's labeled for foliar micronutrient use, without knowing the same chelation that helps uptake also happens to help this particular glyphosate interaction, is getting the right outcome for the wrong reason — and a grower using an untreated MnSO₄ powder without the AMS buffer is one avoidable step from the 10-30% loss column.
| Decision | Yield-delay risk (Section 2) | Tank-mix risk (Section 3) |
|---|---|---|
| Wait for a dedicated Mn-only pass | Real: ~$37.50/acre per week of delay | None |
| Tank-mix MnSO₄ + AMS buffer with glyphosate | Minimized — corrected same day | Minimized per source data |
| Tank-mix untreated MnSO₄ powder, no AMS | Minimized | Real: up to 30% reduced control |
| Tank-mix EDTA-Mn | Minimized | Favorable — control enhanced in cited trials |
Constructed from Sections 2 and 3 above; not a recommendation, a summary of what the two cited sources each report about their own respective risk.
Ground Truth: The two numbers in this article's headline are not competing considerations to be traded off against each other — they're solved by the same fix. The yield-loss clock argues for tank-mixing rather than waiting; the antagonism data says the tank-mix penalty is avoidable with the right source and the right buffer, not inherent to tank-mixing itself. The costly mistake is not "correcting manganese fast" or "tank-mixing at all" — it's grabbing whatever manganese product is in inventory without checking which column of the Section 3 table it falls into.
References
- Bayer Crop Science, "Manganese Fertilizer and Glyphosate Antagonism." https://www.cropscience.bayer.us/articles/bayer/manganese-fertilizer-and-glyphosate-antagonism
- Camberato, J., Purdue University Botany and Plant Pathology, "Glyphosate-Manganese Interactions and Impacts on Crop Production." https://ag.purdue.edu/btny/purdueweedscience/wp-content/uploads/2021/02/Camberato-Glyhosagte-Manganese-Interactions-2010.pdf
- USDA National Agricultural Statistics Service, "Acreage" report, Jun 30, 2026 — 2026 planted acreage by crop. https://www.nass.usda.gov/Newsroom/2026/06-30-2026.php
- USDA Economic Research Service, "Glyphosate use is more widespread in soybean than in corn production," Chart of Note. https://www.ers.usda.gov/data-products/charts-of-note/chart-detail?chartId=78187
- AGSIST/Barchart, CBOT soybean futures, September 2026 contract settlement, Aug 26,
- https://agsist.com/soybean-futures-prices
Disclosures
Crop Root Zone is an independent publication. Nothing here is investment advice. Market calls, where included, reflect the editors' own read and are not a recommendation to buy or sell any security.
Discussion
This issue's fall-nitrogen feature puts anhydrous at $0.56 a pound of N against UAN28 at $0.76 — a $36-an-acre spread at 180 units — and shows the independent nitrapyrin data justifying a stabiliser on ammonia only up to roughly $20 an acre. So: what are you actually being quoted for a fall anhydrous stabiliser this autumn, per acre and by product, and what soil temperature will you go on? We are specifically interested in whether your retailer prices the inhibitor per acre, per ton of product, or bundled into the application charge, because those three quoting conventions are not comparable and only one of them lets you run the break-even.
Corrections are as welcome as answers. If you check our arithmetic against a primary source and we have it wrong, tell us — we ran a correction of our own at the front of RZ-007 and found it in-house rather than being told, which is the slow way. The sharpest replies get answered in next week's Letters & Responses.