Issue 05 · 2026-08-17
This issue kept turning up the same shape of error, in five unrelated corners of the business: a number fixed at one moment, still being quoted as though it described the present.
The clearest case is the one on our cover. The World Bank forecast 2026 urea down 7% last December, then up nearly 60% in May — a 67-point revision published within weeks of the April peak. Urea closed August 14 at $386 a tonne. The forecast made with less information about this year has aged better than the one made with more. The same pattern runs through everything else we looked at. Beijing's urea export floor was set at $660–670 in May and the benchmark has since fallen to $390, so the quota is a permission rather than a cargo. Your crop insurance projected price was locked at $4.62 in February and will be settled against an October average. Two carbon-removal contracts were signed at $300 and $419 a tonne against a rock-and-spreading bill we work out at $526. And a federal rule priced its own cost at $1.4 million a year while stating that 194,000 truck drivers will leave the freight market.
None of these are forecasting failures. They are stale anchors, and in every case the gap is arithmetic you can do yourself. We have shown the arithmetic.
— Crop Root Zone, Editorial Desk.
No new reader correspondence reached us this week. We checked, and there is nothing to print — rather than fill the space, we would rather say so.
Last issue's letter came from a reader who has spent a career on the nitrogen side of the trade, asking why growers can hedge corn, beans and wheat but have no instrument to lock in ammonia, urea, UAN or AMS. Our answer was that the asymmetry is structural: corn is one fungible deliverable against a liquid futures contract, while "nitrogen" is four different products with a regional spread that has run past $200 a ton — there is no single thing to write a contract on. Several of the pieces in this issue are downstream of that same problem. TRZ-0105 is about what happens when the only forward view available is somebody's published forecast rather than a market you can trade, and TRZ-0106 is about a price fixed in February that settles in October with nothing in between that a grower can act on.
That thread is worth continuing, so a direct request: if you have found a working way to fix a nitrogen cost more than a season out — a supplier contract with a real price, a basis arrangement, prepay with a cancellation right, anything that is not simply prepaying the full program and hoping — write and tell us how it is structured. We will publish the mechanics, anonymously if you prefer.
Corrections are equally welcome, and we would rather print one than carry an error. Reply to this issue, or use the discussion thread at the end.
In This Issue
This week's features, by department.
- The Same Institution Forecast 2026 Urea at −7%, Then +60%, Five Months ApartThe World Bank's December outlook had urea falling 7% this year. Its May outlook, written at the April peak, had it rising nearly 60%. The benchmark closed August 14 at $386/tonne — down roughly 45% from the April 15 high. Fall fill is being quoted off the worst vintage of forecast in the file.
- China's Export Window Closes in 17 Days. Its Price Floor Is $280 Above the Market.Beijing reopened urea exports in June with a 1.5–1.6 million tonne quota and a $660–670/t fob minimum. The benchmark has since fallen to $390. A quota you cannot legally price into the market is not supply, and fall fill quotes written against a Chinese overhang are quoting a tonne that may never load.
- America's Only Potash Producer Had a Good Quarter. Its Potash Gross Margin Did Not Move a Dollar.Intrepid's potash segment earned $4.9 million in Q2 2026 — exactly what it earned in Q2 2025 — while langbeinite gross margin rose 41 percent on a $30-per-ton cost decline. The company then raised potash production guidance into the nutrient that isn't paying.
- UAN32 Was the Most Expensive Nitrogen You Could Buy a Year Ago. It Is Now the Second Cheapest.Across four products delivering the same element, the year-on-year change runs from +26% to −8% — and the penalty for choosing liquid over anhydrous has fallen from $56 an acre to $23.
- The Illinois Anhydrous Ask Fell $107 a Ton in Two Weeks — and Crossed Below the National AverageUSDA's free distributor reports show anhydrous asks down $72 to $107/ton in a single bi-weekly step, with Illinois at $915.50 and Oklahoma at $875 against a national retail average of $960. In the same reports, DAP and MAP asks went up. Fall N is repricing; fall P is not.
- Your Revenue Protection Doesn't Pay Until October Corn Averages $3.93. A Big Yield Lowers That Bar.The 2026 projected price is $4.62 and corn is trading within pennies of it. At 85% coverage and trend yield, RP triggers nothing until the October average falls 15% — and every bushel above your APH pushes the trigger price further down. A record crop is the thing that disarms the insurance.
- Drought Just Crossed Half the Lower 48. Weighted by Corn Production, It Is About 24 Percent.The Drought Monitor hit 50.38 percent D1-or-worse on August 11, the highest of the season — while Illinois sits at 1.4 percent, Indiana at zero, and Iowa actually improved. The map is measuring land area. The crop lives somewhere else.
- One Buyer Took 82 Percent of Last Week's New-Crop Bean Sales. Corn's Biggest Took 45.China booked 1.45 million tonnes of the 1.76 million tonnes of 2026/27 soybeans sold in the week ending August 6 — 1.2 percent of a record crop, to one counterparty, in five business days. The corn book that week was spread across Mexico, unknown destinations and everyone else.
- USDA Cut the Corn Yield 2.3 Bushels. The Crop Got Bigger and the Carryout Still Fell 137 Million.The August WASDE's stock reduction decomposes exactly: +13 million from production, −75 from a carry-in revision, −75 from exports. The yield cut contributed nothing.
- The Crush Is Being Run for the Oil. The Meal Is 47% of the Revenue and All of the Risk.At 72.76-cent oil and $331 meal, oil is now the majority of crush revenue for the first time in a generation — but every bushel crushed for oil forces out four pounds of meal for every pound of oil. Record 14.4-million-tonne meal exports are the only reason the arithmetic clears.
- Agriculture Got the Carve-Out. It Is 83% of a Pipeline That Replaces 3% of the Drivers Leaving.FMCSA's February rule keeps H-2A agricultural workers eligible for a non-domiciled CDL and estimates about 6,000 will be issued a year. In the same analysis it states that roughly 194,000 current holders will exit the freight market — and prices the whole rule at $1.36 million a year, which is seven dollars per departing driver.
- The Waiver That Moved 150,000 Tonnes of Ammonia Just Became a Case-by-Case DecisionThe Jones Act waiver was extended 90 days on August 10 and simultaneously narrowed: from a blanket exemption to voyage-by-voyage review by the Pentagon and the Maritime Administration. The fertilizer volume it has carried since March would supply nitrogen to about 1.5 million corn acres.
- Propane Is 9% Cheaper Than Last Year and Midwest Tanks Are Filling. The Constraint Is the Calendar, Not the Price.A 16.0-billion-bushel corn crop concentrates its drying demand into three or four weeks — and a stock is not a delivery rate. The contracting window closes before the dryer runs.
- Two Pipelines Built in 1971 Decide Whether Your Retailer Can Sell Anhydrous at AllOne system moves 1.5 million tons a year across seven states and is the only one that can take imported ammonia; the other runs domestic-only from Oklahoma to Minnesota. USDA's own regional reports quote an anhydrous price in the states the pipes reach — and no anhydrous line at all in the states they don't.
- It Takes 19 Tonnes of Rock to Remove One Tonne of Carbon. The Rock Costs $18.50.A January 2026 Minnesota trial applied basalt at 10 tons an acre and found no measurable weathering at all. The Illinois trial that did find carbon removal applied nine times as much. At that dose the quarry-gate rock bill alone is $352 per tonne of CO2 — more than a carbon buyer paid Terradot for the finished credit.
- The Rock That Weathers Fast Enough Carries 2,000 ppm Nickel. Sludge Is Barred From Cropland at 420.EPA caps nickel in land-applied biosolids at 420 mg/kg and 420 kg/hectare over the life of a field. The olivine-bearing dunite used in enhanced weathering trials runs above 2,000 mg/kg, and a single published application rate puts 440 kg/hectare on in one pass — with no equivalent rule, because it arrived as a mineral instead of a sludge.
- A Federal Tax Credit Now Decides Which Fertilizer Practices Have Value. Your Agronomy Has No Vote.45Z pays on modeled carbon intensity, the model recognizes a short list of practices, and the largest CI improvement available in 2026 came from a June modeling revision — not from anything done in a field.
- Half the Value of a Ton of Poultry Litter Is Now Phosphate. That Is Also Why You Cannot Spread It.Litter re-rated 14% year over year and phosphate drove 53% of the increase — but the nutrient ratio that made it valuable is the same ratio that caps the rate at about a ton an acre.
The three macronutrients stopped moving together this month, and the split is now wide enough to be a planning input rather than a curiosity. USDA's most recent Illinois distributor print, for the week ending August 7, has anhydrous ammonia's average ask down $107.00 a ton in a single reporting period while DAP rose $29.44 and MAP rose $17.00. Potash did not move at all — down 42 cents. Nitrogen is falling hard, phosphate is still climbing, and potash has gone quiet.
| Product | IL distributor ask, avg | Change | Range | Basis |
|---|---|---|---|---|
| Anhydrous ammonia | 915.50 | −107.00 | 830.00–1,080.00 | F.O.B., current |
| DAP 18-46-0 | 912.22 | +29.44 | 840.00–975.00 | F.O.B., current |
| MAP 11-52-0 | 922.00 | +17.00 | 840.00–985.00 | F.O.B., current |
| Potash, white 0-0-62 | 497.08 | −0.42 | 445.00–550.00 | F.O.B., current |
| Urea 46-0-0 | 752.50 | 0.00 | 595.00–890.00 | F.O.B., current |
| Liquid N 28-0-0 | 523.89 | −6.67 | 425.00–585.00 | F.O.B., current |
| No. 2 diesel, farm | 4.65/gal | +0.21 | 4.43–4.77 | F.O.B., current |
| — | — | — | — | — |
| Corn, benchmark | 4.60/bu | +2.35% MoM | — | Aug 17 |
| Soybeans, benchmark | 11.86/bu | −3.27% MoM | — | Aug 17 |
Sources: USDA AMS Illinois Production Cost Report (bi-weekly), report for week ending 08/07/2026, dated Fri Aug 7, 2026 — downloaded and text-extracted Aug 17. Crop prices: Trading Economics corn and soybean benchmarks, Aug 17, 2026.
The nitrogen decline is real but it is an unwind, not a trend. Urea's international benchmark closed August 14 at $386 a tonne, roughly 45% below the three-and-a-half-year high above $700 set on April 15. That entire round trip belongs to one event — Middle East supply withdrawn in the spring and partially restored since, alongside a relaxation of Chinese export restrictions. Nothing structural changed: roughly a quarter of global urea exports still originate behind a single strait. A grower reading the decline as a new baseline is reading a suspended vulnerability as a resolved one.
Phosphate is the genuinely tight nutrient and has been all year, which is the part the headline "fertilizer is coming down" framing obscures. Two consecutive increases in the Illinois DAP and MAP asks, against a nitrogen collapse, is the market saying the two nutrients have different problems. Phosphate's is supply discipline and sulfur cost; nitrogen's was a shipping lane.
On the crop side the divergence runs the other way. Corn is up 2.35% on the month and 20.12% on the year; soybeans are down 3.27% on the month while still up 16.19% on the year. USDA cut the corn yield to 180.7 bushels and the crop still came in at 16.013 billion bushels, the second largest on record, with ending stocks falling to 1.653 billion on stronger exports. Soybeans set an outright production record at 4.519 billion bushels on a lowered 52.7-bushel yield, and China has taken something on the order of 7 million tonnes of US beans. Both crops are large; only one is being rewarded.
Put the two halves together and the margin arithmetic for 2027 planting is already forming. Corn is holding price into a record-adjacent crop while its dominant input has fallen hardest. Beans are softening while their phosphate and potash requirement is the one that has not cheapened. Diesel adding 21 cents a gallon into harvest sits on top of both.
The verdict: nitrogen gave back a spring panic, phosphate never joined it, and the crop that benefits most from cheap nitrogen is also the one still being paid — which is the most favourable corn-to-input configuration of 2026 so far, and the least durable.
Fertilizer
Illinois anhydrous ask drops $107 while phosphate climbs again — USDA's bi-weekly Illinois distributor print for the week ending August 7 has anhydrous ammonia averaging $915.50/ton, down $107.00, with DAP up $29.44 to $912.22 and MAP up $17.00 to $922.00. Nitrogen and phosphate are now moving in opposite directions in the same report. (USDA AMS Illinois Production Cost Report, week ending 08/07/2026)
Urea benchmark settles at $386, down about 45% from April — The international urea benchmark closed August 14 at $386.00/tonne, off 7.54% on the month and 12.67% on the year, against a three-and-a-half-year high above $700 set on April 15. It remains roughly 9% above where 2026 opened. (Trading Economics, Aug 14, 2026)
Potash has stopped moving in either direction — White potash 0-0-62 in Illinois came in at $497.08/ton, a change of negative 42 cents. Corn Belt retail MOP 0-0-60 has been quoted in a $310–380/ton range this spring, a spread against the Illinois white-potash ask that is mostly grade and basis rather than a market disagreement. (USDA AMS, week ending 08/07/2026; retail range via published market summaries, spring 2026)
Farm diesel adds 21 cents into harvest — No. 2 farm diesel in the same Illinois report averaged $4.65/gal, up $0.21, with biodiesel up $0.33 to $4.60. Fuel is now rising while nitrogen falls, which partially offsets the delivered-cost relief. (USDA AMS, week ending 08/07/2026)
Crops
Soybeans set an outright production record on a cut yield — USDA raised soybean production to a record 4.519 billion bushels while lowering the yield estimate to 52.7 bu/acre, the gain coming from acreage rather than agronomy. (USDA August estimates, as relayed by commodity market summaries, Aug 2026)
Corn is the second-largest crop on record and carryout still fell — The corn yield was cut to 180.7 bu/acre from 183, below a market expectation near 182.4, yet production reached 16.013 billion bushels and ending stocks dropped to 1.653 billion from 1.79 billion on stronger exports — 2025/26 raised 75 million bushels to a record 3.4 billion. (USDA August estimates, as relayed, Aug 2026)
China has taken roughly 7 million tonnes of US soybeans — Chinese purchases of US beans are reported near 7 million metric tons, with Sinograin running domestic auctions to clear storage space ahead of arrivals. (Market summaries via Trading Economics soybean commentary, Aug 17, 2026)
The two crops split on the month — Corn is up 2.35% over the past month and 20.12% year over year; soybeans are down 3.27% on the month while holding a 16.19% year-over-year gain. (Trading Economics, Aug 17, 2026)
Home & Garden
Now is the window to soil test, not next spring — Extension guidance is consistent that late summer and autumn are the right time to sample home lawns and gardens, because lime needs months to react and a fall test gives the amendment time to work before the next growing season. (Rutgers NJAES FS797, "Soil Testing for Home Lawns and Gardens"; Oregon State University Extension EM 9685)
Phosphorus-free lawn products are now the rule in many municipalities — A growing number of local ordinances restrict phosphorus in lawn fertilizer over runoff concerns, which is why so many lawn products now carry a zero in the middle number. If your bag reads 9-0-0 or 10-0-2, that is regulation rather than a formulation shortcut — and established lawns rarely need phosphorus anyway. (Municipal lawn-fertilizer ordinances; product labelling as surveyed in consumer testing coverage, 2026)
Two to three inches of compost is the actual recommendation — For both heavy clay and loose sandy garden soil, extension guidance is to work in two to three inches of compost or other organic matter rather than reaching for a stronger fertilizer. It is a soil-structure fix, and no fertilizer substitutes for it. (Rutgers NJAES FS678, "Growing Tomatoes in the Home Garden"; NC State Extension)
Micronutrients
Boron is the second most widespread micronutrient deficiency worldwide — After zinc, boron is the most commonly deficient micronutrient globally, and in corn and wheat a shortfall shows up as empty or deformed ears and heads. Symptoms in corn and soybeans are subtle enough to be missed in-season. (Extension and agronomic summaries, 2026)
Silicate rock amendments release a broad micronutrient package as they weather — Basalt weathering liberates calcium, magnesium, iron, potassium, phosphorus and micronutrients including manganese, molybdenum and zinc, and the Corn Belt trial that measured carbon removal also recorded significantly increased tissue concentrations of potassium, magnesium, manganese, phosphorus and zinc. (PNAS, Feb 2024; ScienceDirect, basalt mineralogy and nutrient release)
The same chemistry that frees micronutrients can raise pH out of the useful range — Sulfur, potassium and boron all become less available as pH rises, so a liming-type amendment applied for its micronutrient content can reduce availability of three others. Realized benefit depends on where the soil started. (Peer-reviewed enhanced-weathering literature, 2024–2026)
Organics
The 90-to-120-day raw manure rule still governs the calendar — Under the National Organic Program, raw animal manure must be composted, applied only to crops not intended for human consumption, or incorporated at least 90 to 120 days before harvest depending on whether the edible portion contacts the soil. Post-harvest application is the clean path. (USDA AMS, "Manure in Organic Production Systems" tipsheet)
Compost feedstock, not just maturity, decides whether it qualifies — Compost for certified organic production must be made from allowed feedstocks and meet defined process standards; a finished product that looks fine can still be ineligible on what went into it. Ask for the feedstock list, not just a test result. (USDA AMS Compost tipsheet; Organic Materials Review Institute compost standards)
Cover crops are being re-adopted for the microbes rather than the nitrogen — USDA's own framing of the cover-crop resurgence puts rotation diversity and supplying a carbon source to feed soil microbes alongside erosion control and the nitrogen credit — a shift in the stated reason growers plant them. (USDA, "Rediscovering Cover Crops and the Power of 'Green Manure'")
Up and Coming
Enhanced rock weathering now has real contracted volume, and it is early-stage — Frontier's buyer group has committed $33 million to Eion for 78,707 tonnes of CO2 removal across 2027–2030 using olivine on US farmland, and $27 million to Terradot for 90,000 tonnes across 2025–2029 using basalt in Brazil. These are pre-delivery offtake agreements on an unproven-at-scale technology, not a functioning market — the bulk of the tonnage has not been delivered or verified. (Frontier published purchase records, Mar 25, 2025 and Dec 12, 2024)
Steel slag outperformed basalt in a 2026 Corn Belt trial, which nobody expected — A three-year Minnesota field trial published January 13, 2026 found significantly elevated porewater pH and alkalinity in acidic soils treated with steel slag, while basalt produced differences from the control that were "small, but not significant" in every soil. A byproduct beat the purpose-mined mineral. Single site, one trial — treat as a result to replicate, not a conclusion. (Frontiers in Climate, Jan 13, 2026)
Crushed stone has become the constraint on rock-based carbon — USGS puts the average unit value of US crushed stone at $18.50/tonne in 2025, up 39.5% from $13.26 in 2021, and expects regional shortages and longer haul distances to keep pushing it. Any amendment measured in tons per acre inherits that curve. (USGS Mineral Commodity Summaries 2026, Stone (Crushed))
Interesting
It takes about 19 tonnes of rock to remove one tonne of carbon dioxide — Dividing the Corn Belt enhanced-weathering trial's 200 tonnes per hectare of applied basalt by its measured 10.5 tonnes of CO2 per hectare gives 19.05 tonnes of rock per tonne of carbon. Freight, not chemistry, is the binding term. (Crop Root Zone calculation from PNAS, Feb 2024)
A federal rule costed the removal of 194,000 truck drivers at seven dollars each — FMCSA's non-domiciled CDL final rule quantifies its annualized cost at $1,355,993 while stating in the same analysis that roughly 194,000 current holders will exit the freight market. The quantified total is dominated by $93,075 a year of state paperwork. (Federal Register doc. 2026-02965, Feb 13, 2026; division is ours)
Nickel rides into the soil in the magnesium seat — In olivine, nickel substitutes directly for magnesium in the crystal lattice, which is why it is released as the mineral dissolves while chromium in the same rock largely stays put in chromite. The nutrient pathway and the contaminant pathway are the same pathway. (Biogeosciences 17, 103, Jan 8, 2020)
Off the Wall Discovery
Porewater in a carbon-removal trial exceeded the WHO drinking-water nickel threshold — The Belgian cropland dunite mesocosm recorded surface-layer nickel concentrations above the WHO drinking-water guideline of 0.02 mg/L, while remaining inside the 0.2 mg/L agricultural irrigation limit. Two thresholds, one sample, opposite verdicts. (Biogeosciences 17, 103, Jan 8, 2020)
Sewage sludge is barred from farmland at one-fifth the nickel concentration found in a carbon-removal feedstock — EPA caps land-applied biosolids at 420 mg/kg nickel; the olivine-bearing dunite used in published weathering trials runs above 2,000 ppm. No rule is being broken, because the biosolids rule does not cover mineral amendments. (40 CFR § 503.13; Biogeosciences, Jan 8, 2020)
The carbon math and the metals math are the same number read twice — A weathering trial's finding that most released nickel stayed in the soil is reported as an environmental safety result. It is also the reason the loading is cumulative and permanent in the plow layer. Durability and accumulation are one property. (Biogeosciences, Jan 8, 2020; interpretation ours)
The Same Institution Forecast 2026 Urea at −7%, Then +60%, Five Months Apart
The World Bank's December outlook had urea falling 7% this year. Its May outlook, written at the April peak, had it rising nearly 60%. The benchmark closed August 14 at $386/tonne — down roughly 45% from the April 15 high. Fall fill is being quoted off the worst vintage of forecast in the file.
Urea futures settled at $386.00 per tonne on August 14, 2026 — down 7.54% on the month, down 12.67% on the year, and down roughly 45% from the three-and-a-half-year high above $700 reached on April 15. The physical story behind that round trip is already well understood: Middle East supply disrupted through the spring, then progress on restoring shipping and a relaxation of Chinese export restrictions on the way back down. What has not been laid out is what the institutional forecasts did while it happened, and it is worth doing, because growers are being quoted fall fill right now against numbers published at the top.
1. Two forecasts, one year, five months apart
What's new: The World Bank's commodity outlook published December 4, 2025 forecast urea to decline 7% in 2026 and a further 9% in 2027, with DAP falling 8% in both years and potash in moderate decline. The World Bank blog published May 14, 2026 forecast urea to rise nearly 60% in 2026, noting it had climbed above $850 per metric tonne in April, up 80% since February, and reached its highest level since April 2022.
Evidence: Same publisher, same forecast year, opposite direction.
| Vintage | Published | 2026 urea forecast | Context at time of writing |
|---|---|---|---|
| Pre-crisis | Dec 4, 2025 | −7% | Nov 2025: DAP −6% MoM, TSP −3%, urea +4% |
| Peak | May 14, 2026 | +~60% | April: urea above $850/t, +80% since February |
| Revision | — | 67 points | — |
Sources: World Bank Data Blog, "Fertilizer markets soften but remain constrained by trade policies," Dec 4, 2025; World Bank Data Blog, "Fertilizer prices surge as Strait of Hormuz disruptions tighten supplies," May 14, 2026. Both fetched Aug 17, 2026. The 67-point figure is this publication's arithmetic on the two stated forecasts.
67 points
The swing in one institution's 2026 urea forecast across five months — from −7% to +60% — with the upward revision published at the April peak. (Crop Root Zone arithmetic on World Bank Data Blog, Dec 4, 2025 and May 14, 2026)
The May outlook was not confined to nitrogen. It carried DAP up more than 10% in April and projected to rise nearly 6% for 2026, MOP up more than 5% in the first quarter and about 17% above a year earlier with a 2026 forecast near +12%, and the overall fertilizer price index up more than 12% in Q1 to its highest level since October 2022.
| World Bank 2026 forecast, May 14 vintage | Forecast change | |
|---|---|---|
| Urea | +60% | ██████████ |
| MOP (potash) | +12% | ██ |
| DAP | +6% | █ |
Source: World Bank Data Blog, May 14, 2026. Bar scaling is this publication's.
Note which of those has aged best. The May document put the largest revision on the nutrient that has since fallen the furthest, and the smallest on phosphate — which has in fact been the sticky one all year. The ranking was inverted, not merely the level.
Ground Truth: A 67-point revision in five months is not a forecast of a year; it is a high-resolution report on the preceding eight weeks. The December vintage — written before anyone knew about the spring disruption — is currently the closer of the two to what has actually happened, which is the uncomfortable part: the forecast made with less information about 2026 has outperformed the forecast made with more. Treat any fertilizer price projection published within a month of a supply shock as a description of the shock rather than a projection through it, and weight the pre-shock vintage more heavily than instinct suggests.
2. The round trip, on one series only
What's new: Measured entirely within the Trading Economics benchmark series to avoid mixing bases, urea has given back most of its spring move in four months.
Evidence:
| Date | Urea benchmark | Change |
|---|---|---|
| Apr 15, 2026 | above $700/t (3½-year high) | — |
| Aug 13, 2026 | $390.00/t | — |
| Aug 14, 2026 | $386.00/t | −44.9% from Apr 15 |
| — month-over-month | −7.54% | |
| — year-over-year | −12.67% | |
| — versus start of 2026 | still ~+9% |
Source: Trading Economics urea benchmark, accessed Aug 17, 2026 (Aug 14 print). Percentage change from the April 15 high is this publication's arithmetic against the stated "above $700," so the true decline is somewhat larger than 44.9%.
The last two rows are the ones worth holding together, because they contradict each other in a useful way. Urea is down 12.67% year-over-year and simultaneously up about 9% from where 2026 opened. Both are true: the market entered this year well below where it sat in August 2025, spiked, and has now returned to a level that is modestly above January and clearly below last summer. A grower reading only the year-over-year figure concludes nitrogen got cheaper; one reading only the year-to-date figure concludes it got dearer. Neither is the operative number for a fall purchase, which is the distance from the April peak.
What produced the spike, and what unwound it. The May document is specific about the mechanism, and it is worth restating because it defines what would have to recur for the benchmark to turn back up. The Middle East "accounts for nearly one-quarter of global urea exports" and handles a large share of global sulfur and ammonia shipments. During the disruption Iran halted ammonia production, Qatar suspended urea, ammonia and sulfur production, India reduced urea and ammonia output, and China tightened urea and DAP exports — four supply withdrawals landing inside one quarter. The decline since has come from the mirror image: progress toward restoring shipping, and a relaxation of the Chinese export restrictions that adds volume back to the seaborne market.
The asymmetry between those two lists is the reason to hold the current level with some humility. The spike required four things to go wrong at once and delivered an 80% move in roughly ten weeks. The recovery has required two of them to partially reverse. Nothing in that structure has changed: a quarter of the export book still originates in one strait, and the same producers can withdraw again on short notice. A benchmark at $386 is not evidence that the vulnerability was resolved, only that it is not currently being exercised.
One sourcing disagreement, reported rather than resolved. The World Bank put urea above $850/tonne in April 2026. Trading Economics puts the April 15 peak above $700. That is roughly a $150/tonne gap between two public sources describing the same month, and it is a basis difference rather than an error by either: the two track different benchmarks with different delivery terms, and neither page discloses enough to reconcile them. This publication has not averaged them and will not. The conclusions above are drawn inside the Trading Economics series alone. Anyone quoting a percentage decline from "the April peak" should say which peak they mean, because the two produce answers roughly ten percentage points apart.
3. Where the decline has and has not arrived
What's new: The benchmark round trip has only partly reached the farm gate. DTN's early-August retail survey, reported August 12, 2026, had urea averaging $678 per ton delivered retail, down about 5% on the month; anhydrous at $963 per ton, down about 7%; and potash at $495 per ton, roughly stable, with five of eight nutrients lower on the month and UAN32 leading the declines.
Evidence: The two figures are not directly comparable and the gap between them is mostly structure rather than margin.
| Measure | Value | Basis |
|---|---|---|
| Urea benchmark | $386.00/tonne | Benchmark series, Aug 14 |
| = per short ton | ~$350/st | Unit conversion only |
| Urea, delivered retail | $678/ton | DTN survey, reported Aug 12 |
| Retail as multiple of benchmark | ~1.9× | This publication's arithmetic |
Sources: Trading Economics (Aug 14 print); DTN/Progressive Farmer retail fertilizer survey as reported Aug 12, 2026. The multiple is indicative of direction only, not a margin calculation — the benchmark and the retail print differ in delivery terms, and ocean freight, inland freight, tariffs, storage and retail margin all sit legitimately between them. It is presented to show that retail has moved by single-digit percentages while the benchmark moved by 45%, not to imply anyone is capturing the difference.
The one-month retail declines of 5% for urea and 7% for anhydrous against a 45% benchmark decline from April is the familiar lag, and it cuts both ways: retail did not fully follow the spike up either. What it means practically is that the benchmark collapse is a forward-looking argument about where retail is heading, not a description of what is on today's invoice.
Market read: CF (NYSE) — Hold. A 45% round trip in the benchmark reaches a North American producer's realizations with a lag, which means the second half prices against the descent rather than the spike; the phosphate and potash legs holding firm is what keeps this a hold rather than a trim.
4. What this changes about a fall fill decision
What's new: The calendar is the problem. Fall fill and prepay conversations run through August and September. The most recent authoritative-looking institutional forecast on the file is the May vintage, written at the top, calling for +60%.
Evidence: Three practical consequences.
- Discount the peak-vintage forecast explicitly, don't just discount it mentally. If a fall quote's justification traces back to a spring projection, ask what the same source now says. The World Bank's May document is not wrong about April; it is being used as though it were about the fourth quarter.
- Separate the nutrients. The 2026 evidence is that nitrogen round-tripped and phosphate did not. A single "fertilizer is coming down" read is the error the forecast table above illustrates — the May vintage's ranking of which nutrient would move most was inverted.
- Price the option, not the direction. With the benchmark down 45% from April and retail down 5–7% on the month, the spread between them is the size of the move retail has yet to make. Prepaying the full program locks in a price that still contains most of the spring premium.
Ground Truth: The asymmetry in fall 2026 is unusual and worth naming. In most years prepay is a bet on direction. This year the benchmark has already fallen 45% and retail has passed through single digits of it, which means the grower is being asked to prepay a price that has not yet absorbed a decline that has already happened. That is not a forecast — it is an observation about two numbers that are currently inconsistent with each other. The resolution can come through retail falling or through the benchmark recovering; the one thing the two figures cannot do is stay where they are.
The falsification test is straightforward and arrives weekly: if DTN's retail prints through September show continued mid-single-digit monthly declines in urea and UAN while the benchmark holds near $386, the gap is closing the way this piece expects. If the benchmark turns up first — a renewed supply interruption, or China re-tightening exports at the close of its current window — then retail never has to fall and the prepay was right. The next DTN weekly print is the place to look.
References
- Trading Economics — urea benchmark, $386.00/T as of Aug 14, 2026; −7.54% MoM, −12.67% YoY; "three-and-a-half-year high above $700 reached on April 15"; approximately 9% above the start of 2026. Accessed Aug 17, 2026. https://tradingeconomics.com/commodity/urea
- World Bank Data Blog — "Fertilizer prices surge as Strait of Hormuz disruptions tighten supplies," May 14, 2026. Urea above $850/MT in April, +80% since February, highest since April 2022; 2026 forecasts urea +~60%, DAP +~6%, MOP +~12%; fertilizer price index +>12% in Q1 2026; Middle East "accounts for nearly one-quarter of global urea exports." Fetched Aug 17, 2026. https://blogs.worldbank.org/en/opendata/fertilizer-prices-surge-as-strait-of-hormuz-disruptions-tighten-
- World Bank Data Blog — "Fertilizer markets soften but remain constrained by trade policies," Dec 4, 2025. 2026 forecasts: urea −7%, DAP −8%, MOP moderate declines; Nov 2025 MoM DAP −6%, TSP −3%, urea +4%. Fetched Aug 17, 2026. https://blogs.worldbank.org/en/opendata/fertilizer-markets-soften-but-remain-constrained-by-trade-polici
- DTN/Progressive Farmer — "Fertilizers Start August With Mixed Prices as 5 Nutrients Decline, Led by UAN32," reported Aug 12, 2026. Retail urea $678/ton, anhydrous $963/ton, potash $495/ton. https://www.dtnpf.com/agriculture/web/ag/crops/article/2026/08/12/fertilizers-start-august-mixed-5-led
Disclosures
Crop Root Zone is an independent publication. Nothing here is investment advice. Market calls, where included, reflect the editors' own read and are not a recommendation to buy or sell any security.
China's Export Window Closes in 17 Days. Its Price Floor Is $280 Above the Market.
Beijing reopened urea exports in June with a 1.5–1.6 million tonne quota and a $660–670/t fob minimum. The benchmark has since fallen to $390. A quota you cannot legally price into the market is not supply, and fall fill quotes written against a Chinese overhang are quoting a tonne that may never load.
China's urea export window closes at the end of August. It was opened at the end of May with two conditions written into it, and only one of them gets quoted. The quota — 1.5 to 1.6 million tonnes for the June-through-August period, with perhaps another 400,000 tonnes reserved for government-to-government business — is the number that has been repeated in every fall-fill conversation since. The second condition is a minimum export price: $660 per tonne fob for prilled urea and $670 per tonne for granular (Profercy, May 26, 2026). On August 13 the international urea benchmark settled at $390.00 per tonne (Trading Economics, Aug 13, 2026). The floor is not close to the market. It is roughly 72 percent above it.
That gap is the whole story, and almost nobody is quoting it alongside the quota.
1. The two conditions, and what each one is worth
What's new: Nothing about the policy changed this week. What changed is the price it has to clear. When Beijing set the floors on May 26, several major fob benchmarks were still trading below $700 per tonne but within sight of it — the floor was a constraint, not an exclusion. Eleven weeks later the benchmark has fallen 11.5 percent year on year and 7.7 percent in the last month alone, and the same floor now sits nearly $280 above the print.
Evidence: The published terms against the published market:
| Condition | As set | Basis | Current market | Gap |
|---|---|---|---|---|
| Prilled urea floor | 660 | $/t fob | 390 | +270 |
| Granular urea floor | 670 | $/t fob | 390 | +280 |
| Quota, Jun–Aug | 1,500–1,600 | 1,000 t | — | — |
| G2G allocation (reported) | ~400 | 1,000 t | — | — |
Sources: Profercy, May 26, 2026 (quota and floors); Trading Economics urea benchmark, Aug 13, 2026 (market). Gap column is this publication's arithmetic.
The benchmark and the floor are not quoted on identical bases — the Trading Economics series is an internationally traded granular reference, not a China fob assessment — so the exact spread is indicative rather than a tradeable basis. That caveat narrows the number; it does not change the sign, and no reasonable basis adjustment closes a $280 gap.
$280/t
How far China's granular urea export floor sits above the international benchmark as of August 13. The quota is 1.5–1.6 million tonnes. The floor is what decides whether any of it moves. (Floors: Profercy, May 26, 2026. Benchmark: Trading Economics, Aug 13, 2026.)
2. The last time India actually paid for a tonne, it paid $449
What's new: The cleanest test of a price floor is not a benchmark — it is an auction where a buyer wrote a number down. India has run two this season and the results bracket the question precisely.
Evidence: India's National Fertilizers Ltd tender in June drew bids near $449 per tonne CFR, against an April round that peaked near $1,000 (Fertilizer Daily, Aug 7, 2026). The current RCF tender — 1.7 million tonnes, one million for the west coast and 700,000 for the east — opened bids on August 11 with offers required valid to August 24. As of this writing no result has been published.
Put those on one line, adjusting India's delivered price back to an fob-equivalent so the comparison is honest:
| Reference | Price | Basis | fob-equivalent* | vs $670 floor |
|---|---|---|---|---|
| April 2026 India round (peak) | ~1,000 | $/t CFR | ~975 | −305 |
| June 2026 NFL tender bids | 449 | $/t CFR | ~424 | +246 |
| Aug 13 international benchmark | 390 | $/t | 390 | +280 |
| Aug 11 RCF tender, 1.7 mn t | no public result | — | — | — |
*fob-equivalent applies an assumed $25/t freight allowance to the CFR figures. That allowance is this publication's estimate, not a quoted rate, and is shown only to put CFR and fob on one axis. Sources: Fertilizer Daily, Aug 7, 2026; Trading Economics, Aug 13, 2026.
The April column matters more than it looks. It is the only recent moment at which the Chinese floor would have been comfortably inside the market — which is a fair reading of why the floor was set where it was set. Policy written against an April price is being enforced into an August one.
Ground Truth: A quota is a permission to export, not a commitment to. The trade has spent three months treating 1.5–1.6 million Chinese tonnes as an overhang sitting on the market, and pricing fall fill accordingly. But the same policy that released the tonnes priced them at a level no buyer has paid since April. Whatever loosening the market has already banked from "China is back," it has banked twice: once when the quota was announced, and again as the price fell away from the floor that governs it. If you are being quoted a fall fill number whose justification is Chinese supply, the correct question is not how many tonnes were allocated. It is at what price they are permitted to leave.
3. The number circulating is from last August, not this one
What's new: A caution that is worth more to a buyer this month than any forecast. A widely re-served figure — that Chinese urea exports jumped to 567,184 tonnes in a month, a 614 percent year-on-year increase, against a January-to-May average of no more than 2,200 tonnes a month — is being quoted in 2026 fall-fill commentary as though it describes this year's window.
Evidence: It does not. Those figures are Chinese customs data for July 2025, reported on August 21, 2025 (South China Morning Post, Aug 21, 2025, citing customs data released Aug 20, 2025). The June figure paired with them, 66,241 tonnes, is June 2025. They describe the previous reopening, which preceded the restrictions imposed later in 2025 — not the June–August 2026 window.
The distinction is not academic. The 2025 sequence is the single most persuasive piece of evidence that a Chinese window, once opened, fills fast. Attaching it to 2026 imports that conclusion into a market with a floor 72 percent above the benchmark, which is exactly the condition under which it would not hold.
What is genuinely known about 2026 volumes: publicly, very little. This publication found no 2026-vintage Chinese customs print for June or July urea exports in open sources this week. That absence is reported as an absence. It is not filled with the 2025 number, and it should not be filled with it in a quote sheet either.
| Claim in circulation | Actual vintage | Status for 2026 |
|---|---|---|
| 567,184 t monthly exports | July 2025 customs | Not evidence for this window |
| +614% year on year | July 2025 vs July 2024 | Not evidence for this window |
| ≤2,200 t/month baseline | Jan–May 2025 | Not evidence for this window |
| 1.5–1.6 mn t quota | May 2026 policy | Current |
| $660 / $670 fob floors | May 2026 policy | Current, no revision found |
Sources: South China Morning Post, Aug 21, 2025; Profercy, May 26, 2026. Vintage column is this publication's verification.
4. What actually resolves it, and when
What's new: Two dates do almost all the work, and both fall inside the next three weeks.
Evidence: The RCF tender's offers stay valid until August 24. The export window's stated period ends with August, though at least one policy summary describes the shipment window as running to October 31 — a distinction between when a cargo may be awarded and when it must load that the public record does not settle cleanly, and which is flagged here rather than resolved by assumption.
| Date | Event | What it settles |
|---|---|---|
| Aug 24 | RCF offer validity expires | Whether 1.7 mn t clears, and at what CFR |
| Aug 31 | Stated end of Jun–Aug export period | Whether the quota window is extended or lapses |
| Oct 31 | Reported outer shipment date | Whether awarded tonnes can still load |
Sources: Fertilizer Daily, Aug 7, 2026; Profercy, May 26, 2026; policy summaries as reported. The October 31 date is reported secondhand and is not confirmed by a primary Chinese notice this publication could read.
The order matters. If the RCF tender clears materially above $449 CFR, the floor moves back toward relevance and the quota becomes real supply again. If it clears at or below June's level, the floor is confirmed as an exclusion and the correct planning assumption for Q4 is that Chinese tonnes are not in the market regardless of what was allocated.
Three notes for the fall-fill file:
- A floor is revisable, and floors like this one have been revised before when they limited business. The absence of a reported revision as of this writing is a fact about the public record, not a guarantee about September.
- Chinese production economics do not bind here. Roughly 70 percent of Chinese urea capacity is coal-based and largely insulated from gas-price swings, so the constraint is administrative, not a cost floor. That cuts both ways: an administrative constraint can be removed in a sentence.
- The domestic retail lag is unchanged by any of this. Whatever the international benchmark does in the next three weeks, the retail number a grower is quoted moves later and by less. Nothing in this piece is an argument for waiting on a delivered price that has already been offered.
Market read: CF — Hold — a benchmark 11.5 percent below year-ago is not a producer tailwind, but the Chinese floor is a genuine ceiling on how much competing supply can reach the water this quarter, and that argues against pressing the short side here.
References
- Profercy — "China reopens urea exports with $660pt price floor," May 26, 2026. https://www.profercy.com/insights/china-reopens-urea-exports-with-660pt-price-floor
- Trading Economics — Urea benchmark, $390.00/t, Aug 13, 2026. https://tradingeconomics.com/commodity/urea
- Fertilizer Daily — "India issues 1.7 million tonne urea tender through RCF with bids opening on August 11," Aug 7, 2026. https://www.fertilizerdaily.com/20260807-india-rcf-urea-tender-1-7-million-tonnes-august-2026/
- South China Morning Post — "China's shipments of major fertiliser surge 600%, signalling softer export curbs," Aug 21, 2025 (customs data released Aug 20, 2025). https://www.scmp.com/economy/china-economy/article/3322622/chinas-shipments-major-fertiliser-surge-600-signalling-softer-export-curbs
- Profercy — "RCF announces fresh urea purchasing tender to close 11 August," Aug 2026. https://www.profercy.com/insights/rcf-announces-fresh-urea-purchasing-tender-to-close-11-august
Disclosures
Crop Root Zone is an independent publication. Nothing here is investment advice. Market calls, where included, reflect the editors' own read and are not a recommendation to buy or sell any security.
America's Only Potash Producer Had a Good Quarter. Its Potash Gross Margin Did Not Move a Dollar.
Intrepid's potash segment earned $4.9 million in Q2 2026 — exactly what it earned in Q2 2025 — while langbeinite gross margin rose 41 percent on a $30-per-ton cost decline. The company then raised potash production guidance into the nutrient that isn't paying.
Intrepid Potash reported second-quarter results on August 4. Consolidated sales were $66.7 million, essentially flat against the prior-year quarter. Adjusted EBITDA rose to $17.5 million from $13.8 million. The company raised full-year production guidance on both products. The headline is a good quarter at the only potash producer of scale left in the United States.
The segment detail says something narrower and more useful. Potash gross margin was $4.9 million. A year earlier it was $4.9 million. The entire improvement in the business came from Trio, the company's langbeinite product, whose cost of goods sold fell $30 per ton to the lowest level since the fourth quarter of 2019.
1. The two segments went in different directions, and only one of them mattered
What's new: Potash realized price rose 8.3 percent year on year. That is a real move, and in most quarters it would carry a segment. It did not carry this one, because cost moved with it and volume moved against it.
Evidence: The segment comparison, as reported:
| Line | Potash Q2 2026 | Potash Q2 2025 | Trio Q2 2026 | Trio Q2 2025 |
|---|---|---|---|---|
| Sales volume (000 tons) | 59 | 69 | 70 | 70 |
| Avg. net realized price ($/ton) | 391 | 361 | 389 | 368 |
| Cost of goods sold ($/ton) | 359 | 337 | 205 | 235 |
| Price-less-cost spread ($/ton)* | 32 | 24 | 184 | 133 |
| Segment gross margin ($ mn) | 4.9 | 4.9 | 11.4 | 8.1 |
*Spread row is this publication's arithmetic (realized price less cost of goods sold per ton). It does not reconcile to the reported segment gross margin, and is not meant to — Intrepid's per-ton realized price and per-ton cost are reported measures that sit outside the segment margin line, which also carries byproduct revenue and other items. The spread is shown for direction and relative magnitude, not as a margin bridge. Source: Intrepid Potash second-quarter 2026 results release, Aug 4, 2026.
Read the last two rows together. Potash widened its per-ton spread by $8 and finished the quarter with gross margin unchanged, because volumes fell 14 percent — 59,000 tons against 69,000. Trio widened its per-ton spread by $51 on flat volume, and its gross margin rose 41 percent.
| Segment gross margin, Q2 2026 | $ mn | |
|---|---|---|
| Trio® | 11.4 | ██████████ |
| Potash | 4.9 | ████ |
Source: Intrepid Potash second-quarter 2026 results release, Aug 4, 2026.
Trio produced roughly 70 percent of the quarter's segment gross margin at a company whose name is Intrepid Potash.
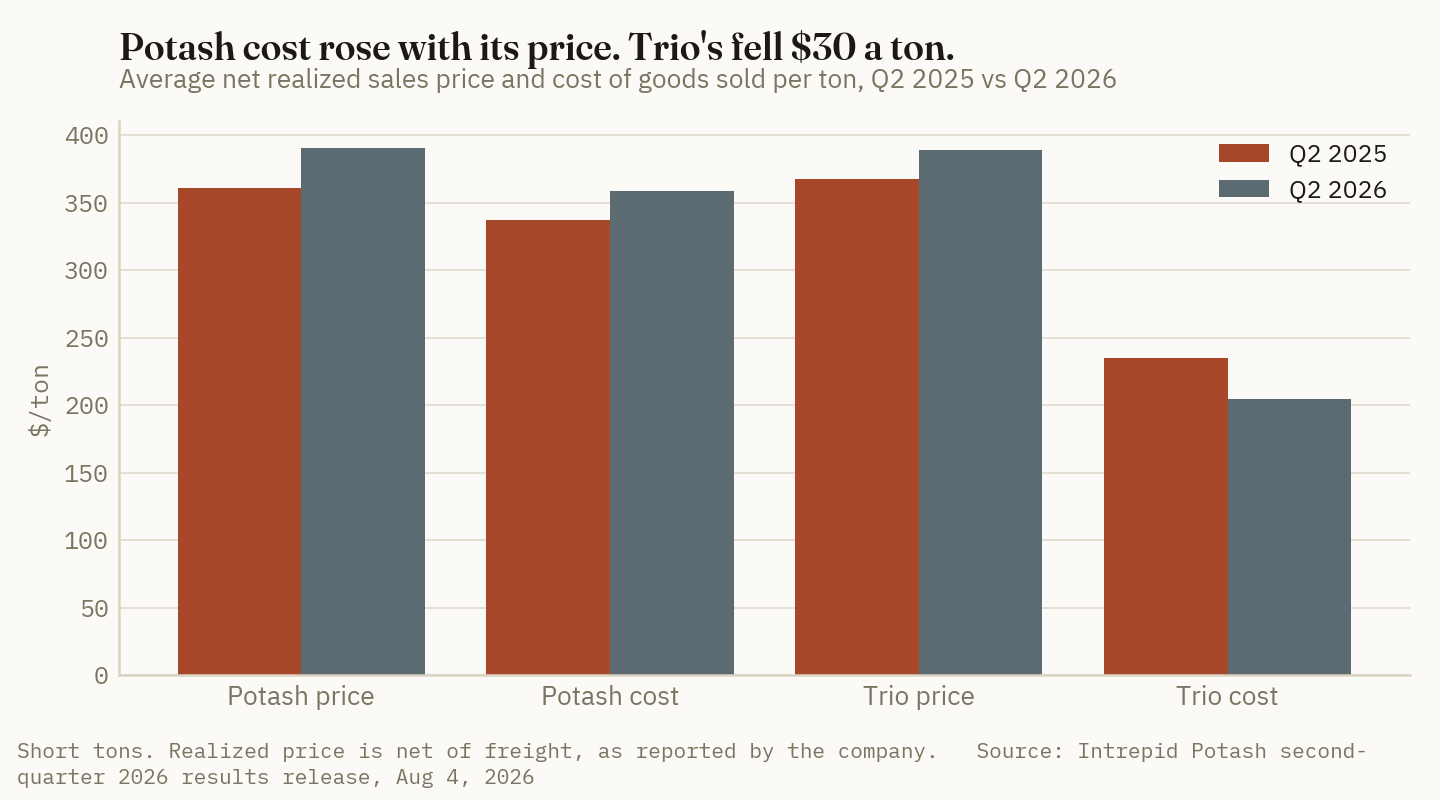
$184 vs. $32
Per-ton spread between realized price and cost of goods sold — Trio against potash, Q2 2026. A year ago the same comparison was $133 against $24. (Intrepid Potash Q2 2026 results release, Aug 4, 2026. Spread is this publication's arithmetic; see the note above.)
2. Where the cost move actually came from
What's new: The Trio cost decline is a production-rate story, not a procurement one. Trio production rose to 75,000 tons from 70,000 while sales volume held at 70,000 — which is the classic signature of fixed costs spreading over more tons.
Evidence: Trio cost of goods sold fell to $205 per ton from $235, a 12.8 percent decline described in the release as the lowest since the fourth quarter of 2019. Potash cost of goods sold went the other way, to $359 from $337.
| Product | COGS $/ton, Q2 2026 | YoY change | Direction |
|---|---|---|---|
| Trio® | 205 | −30 | Down, on higher production |
| Potash | 359 | +22 | Up |
Source: Intrepid Potash second-quarter 2026 results release, Aug 4, 2026.
This matters for what the guidance raise means. Potash full-year production guidance went to 290,000–300,000 tons from 270,000–285,000 — a midpoint increase of roughly 6 percent. Trio guidance went to 295,000–305,000 from 285,000–300,000, a midpoint increase of about 3 percent. The larger raise is on the product carrying the thinner spread.
Ground Truth: If Trio's cost fell because production volume rose, then potash's cost should fall on the same mechanism as its own volume guidance is met — and that, not price, is the swing variable in this company's second half. A grower or retailer reading this quarter as evidence that potash pricing has firmed enough to justify moving a fall purchase forward is reading the wrong segment. The potash price did firm, by $30 a ton. It bought the producer nothing, because cost took $22 of it and volume took the rest.
3. The domestic mine nets more than India pays delivered
What's new: The most interesting number in the release is one the release does not print, and it only appears when the domestic realized price is put next to the international contract on a common unit.
Evidence: Intrepid's $391 per ton is a short-ton figure, and the company reports it as a net realized price — sales net of freight, and therefore approximately a mine-gate number. Converted, that is roughly $431 per metric tonne at the mine.
The 2026 international contracts, both settled and public:
| Reference | Price | Basis | Settled | vs Intrepid netback* |
|---|---|---|---|---|
| Intrepid, Q2 2026 realized | 431 | $/MT, ≈mine gate | Q2 2026 | — |
| India (BPC–IPL) 2026 contract | 383 | $/MT CFR | May 18, 2026 | −48 |
| China 2026 standard MOP | 348 | $/MT CFR | Nov 2025 | −83 |
*Intrepid's $391/short ton converted at 1.10231 short tons per metric tonne — this publication's arithmetic. The comparison's main uncertainty is basis: a CFR price includes ocean freight and a mine-gate netback does not, so the two are not a like-for-like delivered comparison. Adjusting for freight would narrow the gap; at $48 per tonne it does not plausibly invert it. Sources: Intrepid Potash Q2 2026 release, Aug 4, 2026; Fertilizer Daily, May 20, 2026 (India settlement); Argus Media as relayed (China benchmark).
A U.S. mine is netting approximately $48 per tonne more at the gate than the world's second-largest importer pays for material landed at its port — and clearing an $8-per-ton year-on-year improvement in spread for it.
That is the answer to a question this publication has circled before from the retail side: why a grower's delivered potash price sits so far above what the mine appears to receive. The producer's own numbers say the mine is not where the money is. It is a $32-per-ton spread business at the wellhead of the supply chain.
Market read: IPI — Hold — the raise is real and the Trio cost line is genuinely impressive, but a company named for potash generating 70 percent of segment gross margin from langbeinite is a mix story that has to keep repeating to justify the multiple, and the potash spread has to widen for that to happen.
4. The scale that makes the comparison meaningful — and limits it
What's new: The reason a single producer's realized price is worth putting next to an international contract at all is that there is almost nothing else on the domestic side to put there.
Evidence: The U.S. Geological Survey's 2026 Mineral Commodity Summary puts U.S. net import reliance for potash at 92 percent, on domestic production of 500,000 tonnes of K₂O equivalent against apparent consumption of 5.9 million tonnes. Imports of 5.6 million tonnes came 79 percent from Canada, 12 percent from Russia, 3 percent from Israel.
Intrepid's raised guidance of 290,000–300,000 tons sits inside that 500,000-tonne domestic figure — but the two are not in the same unit, and the conversion is worth doing explicitly:
| Step | Value | Basis |
|---|---|---|
| Intrepid 2026 potash guidance (midpoint) | 295,000 | short tons, product |
| Converted | 267,600 | metric tonnes, product |
| At ~61% K₂O (standard MOP grade)* | ~163,000 | tonnes K₂O |
| U.S. production, 2025 | 500,000 | tonnes K₂O |
| Intrepid as share of U.S. production | ~33% | this publication's arithmetic |
| U.S. apparent consumption, 2025 | 5,900,000 | tonnes K₂O |
| Intrepid as share of U.S. consumption | ~2.8% | this publication's arithmetic |
*The 61 percent K₂O grade is a standard muriate-of-potash assumption applied by this publication, not a company-stated figure, and the conversion mixes a 2026 guidance number against 2025 USGS actuals. Both caveats widen the error bars on the share rows; neither changes the order of magnitude. Sources: Intrepid Potash Q2 2026 release, Aug 4, 2026; USGS Mineral Commodity Summaries 2026 (2025 data).
Two conclusions follow, and they pull in opposite directions. Roughly a third of everything the United States mines is this company's, which is why its cost and price lines are worth reading closely — there is no larger domestic comparison available. And it is under three percent of what the country actually uses, which is why its $32-per-ton spread cannot set the domestic price. The number that sets the domestic price is a Canadian netback plus rail and terminal cost, and the 12 percent Russian share is the piece of that stack most exposed to something other than economics.
5. What to watch, and one figure this piece deliberately did not use
What's new: Third-party summaries of the quarter carry a substantially larger net income figure than the results release does, and the difference is not a rounding matter.
Evidence: The company's release reports $2.4 million of net income from continuing operations and adjusted EBITDA of $17.5 million. Summaries of the corresponding Form 10-Q circulating this week carry a net income figure several times that, which would include results outside continuing operations. This publication was unable to retrieve the filing directly — sec.gov refuses automated retrieval — and so uses only the release figures above and reports the discrepancy rather than picking a side. A reader building a valuation off this quarter should read the 10-Q, not a summary of it.
Three things decide whether the potash segment matters again by the fourth quarter:
- Volume. Potash sold 59,000 tons against 69,000. The full-year guidance raise implies the back half makes that up. If it does, the cost-per-ton mechanism that gave Trio $30 should give potash something.
- The fall program. The release carried no fall-fill commentary. The domestic price that shows up in a fourth-quarter release is set in the next several weeks.
- The import benchmark. With India settled at $383 per tonne CFR through December and China at $348, the international side is fixed for the balance of the year. Domestic netbacks move against a known number, which is unusual and makes the fourth quarter cleaner to read than most.
References
- Intrepid Potash, Inc. — "Intrepid Announces Second Quarter 2026 Results," Aug 4, 2026. https://www.stocktitan.net/news/IPI/intrepid-announces-second-quarter-2026-rj7frarpsylr.html
- Fertilizer Daily — "BPC settles new India potash contract at $383/t CFR; $35/t above China's 2026 benchmark," May 20, 2026. https://www.fertilizerdaily.com/20260520-bpc-settles-new-india-potash-contract-at-383-t-cfr-35-t-above-chinas-2026-benchmark/
- Canpotex — "Canpotex Agrees to Potash Supply Contract with Customer in India." https://www.canpotex.com/news/canpotex-agrees-potash-supply-contract-customer-india-0/
- Intrepid Potash, Inc. — Form 10-Q for the quarter ended June 30, 2026 (referenced; not read directly — sec.gov refused automated retrieval). https://www.sec.gov/Archives/edgar/data/0001421461/000142146126000021/ipi-20260630.htm
- U.S. Geological Survey — Mineral Commodity Summaries 2026, Potash (2025 data: 92 percent net import reliance; 500,000 t domestic production; 5.9 mn t apparent consumption; imports 79% Canada / 12% Russia / 3% Israel). https://pubs.usgs.gov/periodicals/mcs2026/mcs2026-potash.pdf — these figures were read from a published summary of the USGS chapter; the PDF itself returned HTTP 403 to this publication's retrieval and was not opened directly. Prior-year chapter for reference: https://pubs.usgs.gov/periodicals/mcs2025/mcs2025-potash.pdf
Disclosures
Crop Root Zone is an independent publication. Nothing here is investment advice. Market calls, where included, reflect the editors' own read and are not a recommendation to buy or sell any security.
UAN32 Was the Most Expensive Nitrogen You Could Buy a Year Ago. It Is Now the Second Cheapest.
Across four products delivering the same element, the year-on-year change runs from +26% to −8% — and the penalty for choosing liquid over anhydrous has fallen from $56 an acre to $23.
DTN/Progressive Farmer's retail fertilizer survey for the week of August 3–7, published August 12, reported five of eight nutrients lower than a month ago and three slightly higher. The same table shows seven of eight higher than a year ago. Neither line is wrong and neither is the story. The month-over-month column is measuring against a spring peak that is rolling out of the base; the year-over-year column is measuring a nitrogen complex that has pulled 34 percentage points apart product by product, changed its internal ranking, and quietly erased most of the reason to handle anhydrous ammonia.
1. The month-over-month split runs exactly along the nitrogen line
Start with what actually moved, because the "five down, three up" framing obscures a clean division.
| Product | Grade | $/ton | MoM | YoY | Basis |
|---|---|---|---|---|---|
| Anhydrous | 82-0-0 | 963 | −7% | +26% | Delivered, retail |
| Urea | 46-0-0 | 678 | −5% | +5% | Delivered, retail |
| UAN28 | 28-0-0 | 446 | −10% | +6% | Delivered, retail |
| UAN32 | 32-0-0 | 458 | −13% | −8% | Delivered, retail |
| DAP | 18-46-0 | 917 | +0.5% | +12% | Delivered, retail |
| MAP | 11-52-0 | 959 | +0.5% | +8% | Delivered, retail |
| Potash | 0-0-60 | 495 | +0.2% | +2% | Delivered, retail |
Source: DTN/Progressive Farmer, Aug 12, 2026, survey week of Aug 3–7, 2026. DTN treats a move of 5% or more as significant.
Every product that fell is a nitrogen product. Every product that rose is not. The three risers — DAP, MAP and potash — are the three dry non-nitrogen materials, and all three rose by less than a percent, which is to say they did not really move at all. The three that DTN flags as significant decliners on its own 5% threshold are urea, UAN28 and UAN32, joined by anhydrous at 7%.
So the correct summary of the month is narrower and more useful than "prices are mixed": nitrogen fell, phosphate and potash sat still. That is not a general fertilizer deflation. It is one nutrient moving.
2. On a nitrogen basis, the four products moved 34 points apart
A dollar-per-ton comparison across 82-0-0, 46-0-0, 32-0-0 and 28-0-0 is not a comparison of anything — the products carry wildly different nitrogen concentrations. Converted to cost per pound of actual nitrogen, and with the year-ago level backed out of DTN's own year-over-year percentages, the picture reorders itself.
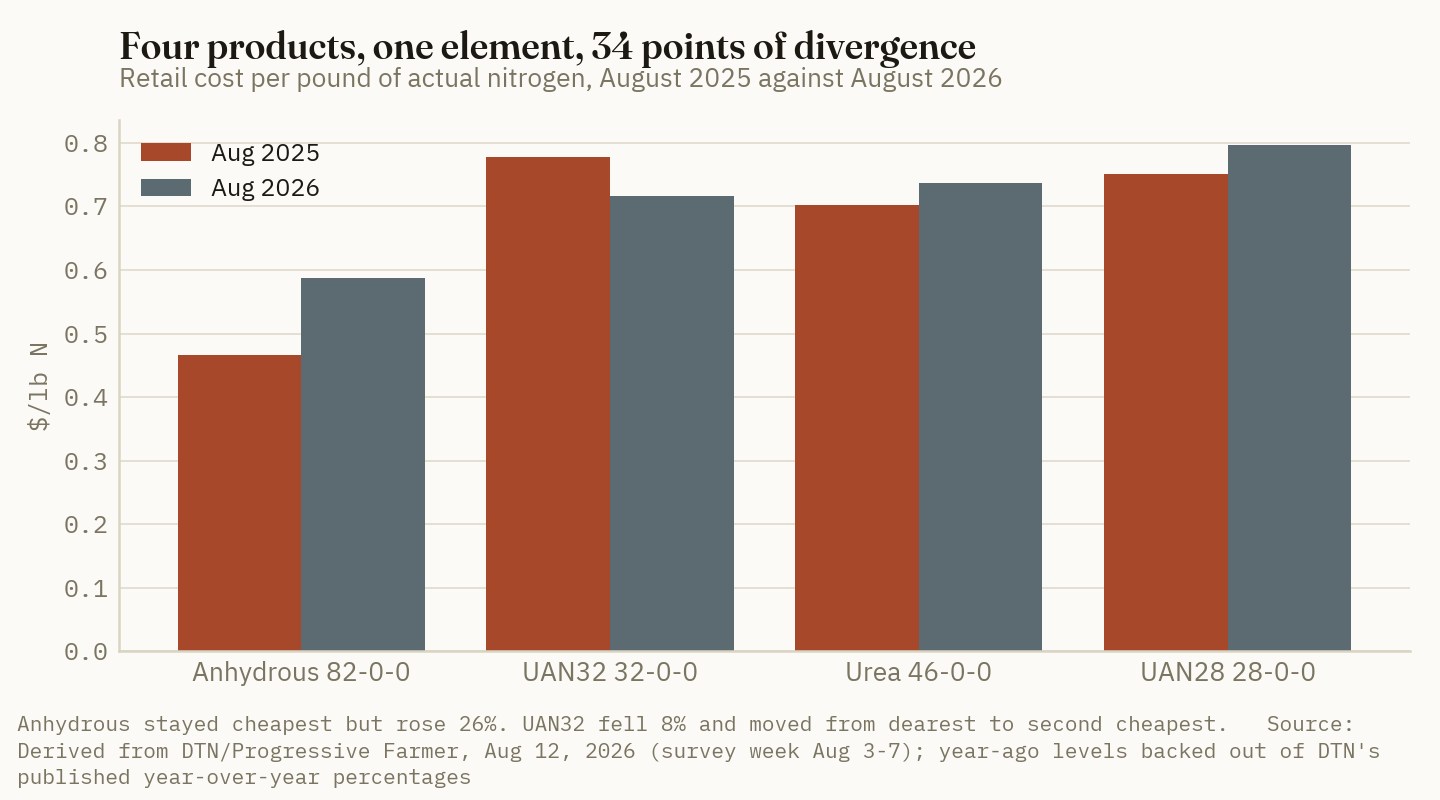
| Product | $/lb N, Aug 2026 | $/lb N, Aug 2025 | Change | Rank now | Rank then |
|---|---|---|---|---|---|
| Anhydrous 82-0-0 | 0.587 | 0.466 | +26% | 1 (cheapest) | 1 |
| UAN32 32-0-0 | 0.716 | 0.778 | −8% | 2 | 4 (dearest) |
| Urea 46-0-0 | 0.737 | 0.702 | +5% | 3 | 2 |
| UAN28 28-0-0 | 0.796 | 0.751 | +6% | 4 (dearest) | 3 |
Sources: current $/ton from DTN/Progressive Farmer, Aug 12, 2026; per-pound conversion at label nitrogen content (0.82, 0.32, 0.46, 0.28 × 2,000 lb). Year-ago levels are derived by deflating each current price by DTN's own published year-over-year percentage — they are this publication's arithmetic on DTN's figures, not a separate DTN print.
Two things happened here that a per-ton table cannot show.
UAN32 changed rank. A year ago it was the most expensive way to buy a pound of nitrogen in the survey. Today it is the second cheapest, ahead of both urea and its own sister product UAN28. Nothing about the molecule changed; the price of everything around it did.
The spread compressed. The gap between the cheapest and dearest pound of nitrogen was 67% a year ago (0.466 against 0.778). Today it is 36% (0.587 against 0.796). The nitrogen complex converged.
| Spread, cheapest to dearest $/lb N | ||
|---|---|---|
| August 2025 | 67% | ██████████ |
| August 2026 | 36% | █████ |
Source: derived from DTN/Progressive Farmer, Aug 12, 2026, as above.
3. What convergence costs, in acres
The reason this matters is that the nitrogen product decision is a real operational trade-off, not a pure price optimization. Anhydrous is the cheapest nitrogen on the market and has been for years, but it is bought at a price that is not on the invoice: pressurized storage, nurse tanks, a licensed applicator pass, a narrow application window, and a hazmat profile that keeps some operations out of it entirely. Liquid UAN is dearer and easier — it flows through the same equipment as the herbicide pass and can be split in-season.
The question a farm manager actually asks is: what is the convenience worth? That number has just halved.
| At 180 lb N/acre | Aug 2026 | Aug 2025 |
|---|---|---|
| Anhydrous | $105.7/ac | $83.9/ac |
| UAN32 | $128.8/ac | $140.0/ac |
| Penalty for choosing UAN32 | $23.1/ac | $56.1/ac |
| Penalty, in corn at $4.50/bu | 5.1 bu/ac | 12.5 bu/ac |
Sources: $/lb N derived from DTN/Progressive Farmer, Aug 12, 2026; corn season-average farm price $4.50/bu from USDA WASDE-674, Aug 12, 2026. The 180 lb/acre rate is a stated assumption for comparison, not a recommendation or a survey figure.
$23/acre
What it now costs to run UAN32 instead of anhydrous at a 180 lb/acre nitrogen rate — down from $56/acre a year ago. (Derived from DTN/Progressive Farmer, Aug 12, 2026)
Ground Truth: At $56 an acre, anhydrous pays for the tanks, the pass and the risk. At $23 an acre it is a much closer argument, and for a sizeable set of operations it has already crossed. An operation running 2,000 corn acres is now looking at $46,000 to switch the whole program to liquid, against roughly $112,000 a year ago. Against that sits the capital and hassle line — nurse-tank fleet, application-window compression, custom-application availability at the exact wrong week. This is the year to actually run that arithmetic rather than assume the answer, because the answer changed and nobody sent a notice. Note the direction of the risk: the spread compressed because anhydrous got more expensive, not because UAN got cheap, so a re-widening requires anhydrous to fall — and the wholesale evidence for that is currently thin.
4. Why the month-over-month column is the wrong one to budget from
There is a measurement trap in this table that will cost somebody money this fall.
Anhydrous prints −7% month over month and +26% year over year in the same row. Both are correct. The month-ago base is a spring peak — the seasonal high struck during the sidedress and pre-plant window — and it is now rolling out of the trailing thirty-day comparison. A negative month-over-month number generated by the base moving is not the same event as a price falling, and it does not forecast the next month.
The year-over-year column is the one with budgeting content. Backing $963 out by 26% puts anhydrous near $764/ton a year ago. That is a $199/ton increase carried into a fall application season, at a moment when USDA has corn's season-average farm price at $4.50 — ten cents higher than last month, on a balance sheet that tightened on export demand rather than on the crop (USDA WASDE-674, Aug 12, 2026).
| What each column is measuring | Anhydrous |
|---|---|
| MoM −7% | Distance from a spring peak that is leaving the window |
| YoY +26% | Distance from the same point in the fall-buying calendar |
| Implied Aug 2025 level | ~$764/ton |
| Implied change carried into fall | ~+$199/ton |
Source: derived from DTN/Progressive Farmer, Aug 12, 2026.
Ground Truth: Use the year-over-year column for the fall N budget and ignore the month-over-month column entirely. Fall application is an annual decision compared against last fall, not against last month, and the two columns currently point in opposite directions by 33 percentage points. A budget built off "nitrogen is down 7%" understates the fall anhydrous line by roughly $199 a ton against the same period last year — about $22 an acre at a 180 lb rate, or five bushels of $4.50 corn per acre that nobody has planned for.
5. The one product that got cheaper, and why it is not a trend
UAN32 at −8% year over year is the sole product in the survey below its year-ago level, and it is worth being precise about what that does and does not indicate.
UAN32 is the most nitrogen-dilute of the four straight nitrogen materials — 32% N against anhydrous's 82% — which means its delivered price carries the largest freight-and-water component per pound of nutrient. It is also the product that fell hardest month over month, at −13%, the largest single move in the survey. A product that is both the most freight-heavy and the most aggressively discounted is showing a distribution-and-inventory story at least as much as a nitrogen-value story.
What it is not is evidence of a general nitrogen deflation. Its sister product UAN28 — the same solution at a lower concentration — is +6% year over year. Two grades of one chemistry moved 14 points apart in twelve months. That is a spread inside a product family, not a market direction.
Market read: CF Industries (NYSE: CF) — Hold. The survey's nitrogen column is a retail print, and retail is the end of the chain, not the producer's realization. Anhydrous at +26% year over year is consistent with a firm upstream ammonia market, which is the constructive read for a nitrogen producer. But the same table shows the two UAN grades diverging by 14 points, which is a distribution signal rather than a production one, and retail prints lag wholesale by enough that this table is not a current read on realized margin. Nothing here changes a position.
References
- DTN/Progressive Farmer — Fertilizers Start August With Mixed Prices as 5 Nutrients Decline, Led by UAN32, Aug 12, 2026; retail survey week of Aug 3–7, 2026. https://www.dtnpf.com/agriculture/web/ag/crops/article/2026/08/12/fertilizers-start-august-mixed-5-led
- USDA World Agricultural Outlook Board — World Agricultural Supply and Demand Estimates, WASDE-674, Aug 12, 2026; corn season-average farm price $4.50/bu. https://www.usda.gov/oce/commodity/wasde/
- Per-pound-of-nitrogen conversions and year-ago levels are this publication's arithmetic on the DTN figures in [1], using label nitrogen content and DTN's own published year-over-year percentages. They are derived values, not separate market prints.
Crop Root Zone is an independent publication. Nothing here is investment advice. Market calls, where included, reflect the editors' own read and are not a recommendation to buy or sell any security.
The Illinois Anhydrous Ask Fell $107 a Ton in Two Weeks — and Crossed Below the National Average
USDA's free distributor reports show anhydrous asks down $72 to $107/ton in a single bi-weekly step, with Illinois at $915.50 and Oklahoma at $875 against a national retail average of $960. In the same reports, DAP and MAP asks went up. Fall N is repricing; fall P is not.
For the week ending August 7, 2026, USDA's Agricultural Marketing Service recorded the Illinois distributor ask for anhydrous ammonia at $915.50 per ton, down $107.00 from the prior report — a 10.5% cut in two weeks. Oklahoma's ask fell $72.00 to $875.00, and the report's own market comment notes "all reported prices now below 1000.00 per ton." Iowa, whose most recent bi-weekly covers the week ending July 24, printed $1,005.80, down $78.77. Set those against the national retail average most of the trade quotes — $960 per ton, itself already down 7% month over month — and two of the three regions are now asking less than the average retail price. That is not a rounding difference. It is the shape a market makes when the wholesale-adjacent price is falling faster than the retail print can follow.
1. Three reports, one direction, and a step size retail hasn't matched
What's new: The change column in USDA's regional production cost reports — a free, dated, government series published on staggered weekly and bi-weekly cycles — shows anhydrous repricing hard across three states at once, in steps larger than the national retail average has recorded over twice the elapsed time.
Evidence: Distributor "ask" averages, dollars per short ton, F.O.B., with the reported low–high range behind each average and the report's own change figure:
| Region (report) | Week ending | Ask range | Average | Change | Implied prior |
|---|---|---|---|---|---|
| Illinois (AMS 3195) | 08/07/2026 | 830.00 – 1,080.00 | 915.50 | −107.00 | 1,022.50 |
| Oklahoma (AMS 3621) | 08/07/2026 | 780.00 – 945.00 | 875.00 | −72.00 | 947.00 |
| Iowa (AMS 2863) | 07/24/2026 | 815.00 – 1,150.00 | 1,005.80 | −78.77 | 1,084.57 |
| National retail average | 07/27–31/2026 | — | 960 | −7% MoM | ~1,032 |
Sources: USDA AMS Livestock, Poultry & Grain Market News, Production Cost Reports 3195, 3621 and 2863, weeks ending Jul 24 and Aug 7, 2026; DTN/Progressive Farmer retail fertilizer survey published Aug 5, 2026. Implied prior column is a Crop Root Zone calculation (average less the reported change).
The percentage steps are −10.5% (Illinois), −7.6% (Oklahoma) and −7.3% (Iowa) — each over a two-week reporting interval. The national retail average fell 7% over a month. Whatever else is true, the ask is moving at roughly twice the speed of the average.
−$107.00/ton
The two-week change in the Illinois distributor ask for anhydrous ammonia, week ending Aug 7, 2026 — larger in half the time than the national retail average's entire monthly decline. (USDA AMS Production Cost Report 3195, Aug 7, 2026)
Oklahoma's report supplies a cause in its own words: "Continued hot and dry conditions have reduced demand across the fertilizer market." That is a demand-side explanation for a demand-side season — nobody is side-dressing into triple-digit heat, and the same report notes corn harvest got underway early as the crop dried down.
Ground Truth: The distributor ask is the leading indicator that a national retail average is built to smooth away. Retail surveys sample what growers paid, which includes tons contracted weeks ago; the ask is what a distributor will sell the next ton for. When the ask crosses below the retail average — as Illinois and Oklahoma just did — the correct reading is not that those regions are cheap. It is that the retail print is stale and has further to fall. A prepay quote written off the national average this week is being written off last month's market.
Market read: CF — Hold — falling distributor asks into the fall-fill window pressure realized nitrogen prices from here, and a producer whose long-run price deck moved up is priced for a market that is currently moving down.
2. The same reports say phosphate is going the other way
What's new: In the identical reports, same week, same distributors, the phosphate lines moved up while every nitrogen line moved down or held. This is the single most decision-relevant thing in the data, and it is invisible in any summary that reports "fertilizer prices."
Evidence: The Illinois card in full, week ending August 7, 2026 — one region, one survey, one week:
| Product | Ask range ($/ton) | Average | Change |
|---|---|---|---|
| Anhydrous ammonia | 830.00 – 1,080.00 | 915.50 | −107.00 |
| Liquid nitrogen 28-0-0 | 425.00 – 585.00 | 523.89 | −6.67 |
| Liquid nitrogen 32-0-0 | 605.00 | 605.00 | 0.00 |
| Urea 46-0-0 | 595.00 – 890.00 | 752.50 | 0.00 |
| Potash white 0-0-62 | 445.00 – 550.00 | 497.08 | −0.42 |
| MAP 11-52-0 | 840.00 – 985.00 | 922.00 | +17.00 |
| DAP 18-46-0 | 840.00 – 975.00 | 912.22 | +29.44 |
Source: USDA AMS Livestock, Poultry & Grain Market News, Production Cost Report 3195 (Illinois), week ending Aug 7, 2026.
It is not an Illinois quirk. Iowa's MAP ask rose $20.71 in its own reporting period, and the Pacific Northwest report — a market with no connection to Corn Belt fall demand — printed MAP +$22.00 while every other synthetic line in that report changed by exactly 0.00. Three regions, three phosphate increases, in a week when nitrogen was being marked down by triple digits.
| Region | Nitrogen line, change | Phosphate line, change |
|---|---|---|
| Illinois | Anhydrous −107.00 | DAP +29.44 / MAP +17.00 |
| Iowa | Anhydrous −78.77 | MAP +20.71 |
| Oklahoma | Anhydrous −72.00 | MAP −1.25 / DAP 0.00 |
| Pacific NW | Urea 0.00 / UAN32 0.00 | MAP +22.00 |
Source: USDA AMS Production Cost Reports 3195, 2863, 3621 and 3657, weeks ending Jul 24–Aug 7, 2026.
Ground Truth: "Fertilizer is falling" is now a statement about one nutrient. Whether a fall program actually gets cheaper depends entirely on its N:P ratio, and the answer flips inside a normal rotation. Take a 180 lb N/acre anhydrous rate: the Illinois ask cut is worth −$11.74 per acre. Add 100 lb/acre of MAP and the phosphate increase gives +$0.85 per acre back. Net −$10.89 — a real saving, but one that shrinks toward zero on a phosphate-heavy corn-on-corn program and disappears entirely on a soybean field taking P and K with no N at all. The grower who "saved money on fertilizer this fall" and the one who didn't may be on the same road.
3. What the number looks like on a nitrogen basis
What's new: Converted to price per pound of actual nitrogen — the only basis on which anhydrous, urea and UAN are comparable — the regional gaps are wide enough to swamp the entire move everyone is writing about.
Evidence: Anhydrous is 82% N, or 1,640 lb of N per short ton. Dividing each ask through:
| Region / series | $/ton | $/lb N | |
|---|---|---|---|
| Oklahoma ask | 875.00 | 0.534 | █████████ |
| Illinois ask | 915.50 | 0.558 | █████████ |
| National retail avg | 960.00 | 0.585 | ██████████ |
| Iowa ask (Jul 24) | 1,005.80 | 0.613 | ██████████ |
Sources: USDA AMS Production Cost Reports 3195, 3621, 2863; DTN/Progressive Farmer, Aug 5, 2026. $/lb N is a Crop Root Zone calculation at 82% N.
At a 180 lb N/acre rate that is $96.12 per acre in Oklahoma, $100.44 in Illinois, $105.30 at the national average and $110.34 in Iowa. The Illinois-to-Iowa gap alone is $9.90 per acre — on 2,000 corn acres, $19,800, for the same nutrient in adjacent states in the same fortnight.
That gap is partly real (freight, terminal access, timing of the survey) and partly an artifact of the Iowa report being two weeks older than the other two, which in a market falling $70–$107 per step is a meaningful part of it. We flag it rather than net it out: the honest statement is that Iowa's next report is the one to read, and if it prints another step of this size it will land near Illinois.
4. What this changes about the prepay decision
What's new: The fall-fill quote season is running against a wholesale-adjacent price that is still in motion, and the free federal series lets a buyer see the motion without a subscription.
Evidence: Three things in this week's data argue against locking:
- The steps are not decelerating. −$72.00, −$78.77 and −$107.00 across three regions is a market still finding a level, not one that found it. A single decelerating step in the next reports would be the signal that it has.
- The demand explanation is seasonal and temporary. Hot, dry, no-application weather suppresses the ask now; the fall application window restores that demand in six to ten weeks. The cause of the discount has an expiry date.
- The within-region range is still enormous. Illinois quotes ran $830 to $1,080 the same week — a $250 spread around a $915.50 average. A buyer working the range is negotiating over more money than the entire two-week move delivered.
Ground Truth: The case for waiting is not a price forecast, it is an asymmetry. If the ask keeps stepping down, waiting is worth another $70–$100 a ton. If it turns, the fall window is long enough to still get covered, and the $250 within-region range means an average-priced ton was never the best available ton anyway. What does not survive this data is prepaying at a quote benchmarked to the national retail average — that number is now above two of the three regional asks and is describing a market that has already moved.
The one position this argues against on the other side is deferring phosphate. DAP and MAP asks rose in three of four regions this week, urea and UAN did not move at all, and only anhydrous is genuinely repricing. A program that delays everything to catch the nitrogen decline will pay for the wait in the P column.
References
- USDA AMS, Livestock, Poultry & Grain Market News — Illinois Production Cost Report (Bi-weekly), report 3195, week ending Aug 7, 2026. https://www.ams.usda.gov/mnreports/ams_3195.pdf
- USDA AMS — Oklahoma Production Cost Report (Bi-Weekly), report 3621, week ending Aug 7, 2026. https://www.ams.usda.gov/mnreports/ams_3621.pdf
- USDA AMS — Iowa Production Cost Report (Bi-Weekly), report 2863, week ending Jul 24, 2026. https://www.ams.usda.gov/mnreports/ams_2863.pdf
- USDA AMS — Pacific Northwest Production Cost Report (Bi-Weekly), report 3657, week ending Aug 7, 2026 (corrected Aug 10, 2026). https://www.ams.usda.gov/mnreports/ams_3657.pdf
- DTN/Progressive Farmer, "Fertilizer Prices Fall as UAN32 Leads Significant Drops Heading Into August," retail survey week of Jul 27–31, published Aug 5, 2026.
- USDA AMS My Market News, report portal. https://mymarketnews.ams.usda.gov/
Disclosures
Crop Root Zone is an independent publication. Nothing here is investment advice. Market calls, where included, reflect the editors' own read and are not a recommendation to buy or sell any security.
Your Revenue Protection Doesn't Pay Until October Corn Averages $3.93. A Big Yield Lowers That Bar.
The 2026 projected price is $4.62 and corn is trading within pennies of it. At 85% coverage and trend yield, RP triggers nothing until the October average falls 15% — and every bushel above your APH pushes the trigger price further down. A record crop is the thing that disarms the insurance.
Corn's crop insurance projected price for 2026 is $4.62 a bushel, set by averaging December contract settlements across February. The benchmark is currently trading at $4.60 — within two cents of it. That coincidence makes this a good moment to be precise about a mechanic most growers carry a rough mental model of: Revenue Protection does not begin paying when the price falls below the projected price. At 85% coverage and a yield that matches your APH, it begins paying when the October average falls below $3.93 — and if this year's yield comes in above your APH, as USDA's August estimates imply it will for many operations, that trigger price drops further still.
1. What was set in February, and what gets set in October
What's new: The 2026 projected prices and volatility factors, established during February's discovery window, came in as follows.
Evidence:
| Crop | 2026 projected price | 2025 | 2026 volatility factor | 2025 |
|---|---|---|---|---|
| Corn | $4.62 | $4.70 | 0.15 | 0.18 |
| Soybeans | $11.09 | $10.54 | 0.13 | 0.14 |
Source: farmdoc daily (University of Illinois), "Projected Prices and Volatility Factors for 2026," Mar 3, 2026. Projected prices are the average of December corn and November soybean futures settlements across all active trading days in February; volatility factors use implied volatility from the options market averaged over the final five trading days of the discovery period.
The harvest price is determined the same way in October — the average of daily settlements for the same December corn and November soybean contracts across that month. Under Revenue Protection, the revenue guarantee is based on the higher of the projected and harvest prices, while the revenue actually counted against that guarantee uses the harvest price. That asymmetry is the whole product: it protects against a price collapse and lets you keep the upside if prices rise.
Two features of the February numbers are worth noting before the October mechanics. Corn's projected price fell only eight cents from 2025 while soybeans rose 55 cents — the ratio moved in beans' favour, which is the sort of thing that shows up in next spring's acreage. And corn's volatility factor of 0.15 is the lowest of the recent series, down from 0.18. A lower volatility factor means a lower premium for the same coverage. Growers who bought 2026 RP bought it cheap, in a year that has since produced a very large crop.
2. The identity that tells you when RP pays
What's new: The trigger price for a Revenue Protection indemnity is not a rule of thumb; it falls out of the definition in one line.
Evidence: The guarantee is APH × coverage level × projected price. Revenue to count is actual yield × harvest price. Setting them equal and solving for the harvest price gives:
Trigger harvest price = coverage level × projected price × (APH ÷ actual yield)
At trend yield — actual yield equal to APH, so the last term is 1.0 — the trigger collapses to coverage level × projected price. For 2026 corn:
| Coverage level | Trigger price at APH yield | Decline from $4.62 required |
|---|---|---|
| 85% | $3.93 | −15.0% |
| 80% | $3.70 | −20.0% |
| 75% | $3.47 | −25.0% |
| 70% | $3.23 | −30.0% |
Source: Crop Root Zone arithmetic on the 2026 corn projected price of $4.62 (farmdoc daily, Mar 3, 2026). Figures assume actual yield equals APH and ignore any unit-structure, enterprise-unit or trend-adjustment effects, which move the answer at the margin without changing the identity.
$3.93/bu
The October average December corn price below which 85% Revenue Protection begins to pay, at a yield equal to APH — 15% below the $4.62 projected price, and about 15% below where corn trades today. (Crop Root Zone calculation)
Now add the yield. The third term is the one growers routinely leave out, and in 2026 it works against them. If actual yield comes in above APH, the trigger price falls proportionally:
| Actual yield vs APH | Trigger price at 85% | Decline from $4.62 required |
|---|---|---|
| 10% below APH | $4.36 | −5.6% |
| Equal to APH | $3.93 | −15.0% |
| 5% above APH | $3.74 | −19.1% |
| 10% above APH | $3.57 | −22.7% |
| 15% above APH | $3.42 | −26.1% |
Source: Crop Root Zone arithmetic, trigger = 0.85 × $4.62 × (APH ÷ actual yield).
The same identity, run on soybeans, gives a different answer. At the 2026 projected price of $11.09 and 85% coverage, beans trigger at $9.43 per bushel at APH yield — also a 15% decline, since the coverage level sets the percentage regardless of the crop. What differs is the distance the market has to travel and what the ratio between the two crops is signalling.
| Corn | Soybeans | |
|---|---|---|
| 2026 projected price | $4.62 | $11.09 |
| Trigger, 85% RP at APH yield | $3.93 | $9.43 |
| 2026 bean:corn projected-price ratio | — | 2.40 |
| 2025 bean:corn projected-price ratio | — | 2.24 |
Source: Crop Root Zone arithmetic on farmdoc daily projected prices, Mar 3, 2026 (2026: corn $4.62, beans $11.09; 2025: corn $4.70, beans $10.54).
That ratio moved from 2.24 to 2.40 — a 7% shift toward soybeans in the price insurance itself locked in back in February, before a bushel was planted. The conventional planting-decision threshold sits near 2.4 to 2.5, so 2026's insurance prices arrived at the edge of the range where beans start winning acres outright. It is one input among many and fertilizer cost is the other big one, but it is an input that was fixed in February and is not revisited in October, which makes it a clean signal for next spring rather than a noisy one.
Ground Truth: Revenue Protection is frequently described as protecting the revenue a grower expected. It protects the guarantee, and the guarantee was fixed in February on APH — so a bin-busting yield does not add to the protection, it raises the price decline required to collect on it. This is the correct design for a revenue product and it is exactly backwards from how the risk feels in a big year. The grower with 15% above-APH corn needs a 26% price break before the policy engages, and by then the cash sale of that extra 15% has partially self-insured him anyway. RP is at its most powerful in a short crop and at its weakest in a record one.
3. What USDA's August numbers do to that bar
What's new: USDA's August estimates cut the national corn yield to 180.7 bushels per acre from 183, below a market expectation near 182.4, on extreme heat and dryness across parts of the Midwest — and still put production at 16.013 billion bushels, the second-largest crop on record, because planted acreage is larger. Export forecasts went up, not down: 2025/26 raised 75 million bushels to a record 3.4 billion, and 2026/27 raised 75 million to 3.275 billion, pulling projected ending stocks down to 1.653 billion from 1.79 billion.
Evidence: That combination — a yield cut, a near-record crop, and a stocks reduction on export strength — is why corn has firmed rather than broken. The benchmark is up 2.35% on the month and 20.12% on the year.
| Corn, current | Value |
|---|---|
| Benchmark price, Aug 17, 2026 | $4.60/bu |
| 2026 projected price (Feb average) | $4.62/bu |
| Gap | −$0.02 |
| Trigger price, 85% RP at APH yield | $3.93/bu |
| Distance from today's price to trigger | −14.6% |
Sources: Trading Economics corn benchmark, 460.05 US cents/bu as of Aug 17, 2026, +2.35% MoM, +20.12% YoY; farmdoc daily, Mar 3, 2026 for the projected price. Basis caveat: RP's harvest price uses the December 2026 contract averaged across October, whereas the benchmark quoted here is a nearby contract. December typically trades at a carry premium to the nearby, so the December contract is likely somewhat above $4.60 and the required decline correspondingly larger. The figure is used as a level indicator, not as a December quote.
The USDA figures above are relayed through commodity-market commentary rather than read from the source release, and are reported as such; the acreage, state-level yield and production detail in the August NASS materials would refine them.
4. What is actually at risk this fall, and it isn't the price
What's new: Put the insurance mechanics next to the cost side and the exposure becomes clear. Retail anhydrous averaged $963 per ton in early August, down about 7% on the month; urea $678 per ton, down about 5%; potash $495 per ton, roughly flat.
Evidence: RP indexes to price and yield. It does not index to input cost. A grower who raises a large crop, sells it near $4.60, and paid a 2026 nitrogen bill set during the spring spike has a margin problem that no revenue product addresses, because on RP's own arithmetic nothing has gone wrong: yield is high, price is near the projected level, and revenue to count comfortably exceeds the guarantee.
- The insured risk — October corn averaging below $3.93 at trend yield — is currently about 15% away and moving away rather than closer, on export strength.
- The uninsured risk — a good crop at an adequate price against input costs contracted at the peak — is happening now.
- The one lever left is marketing and freight, both of which are decisions rather than indemnities.
Ground Truth: The most useful thing to do with the $3.93 figure is to stop waiting for it. A grower holding unpriced corn "in case the insurance doesn't cover it" is holding an option that only pays if corn falls 15%, in which case the policy pays instead — the two are substitutes, not complements, and holding both is paying twice for one risk. With the trigger 15% below the market and USDA raising exports, the defensible position is to treat the RP floor as already spent and price the crop on its own merits.
5. The calendar between here and the harvest price
What's new: Three scheduled events sit between today and the close of the October discovery window, and only the last one counts directly.
Evidence:
- September WASDE — resets yield and demand ahead of discovery. Historically the report most likely to move the December contract before October.
- September 30 Grain Stocks — sets the old-crop carry-in, which flows into the new-crop balance sheet.
- All of October — the harvest price is the average of every trading day's December settlement, not the October 1 print and not the harvest-time cash price. A single sharp move late in the month is diluted by the days before it.
That last point is the one most often misread in practice. Growers watching the board in mid-October and concluding their harvest price is set are looking at one observation in a thirty-day mean. It also means the harvest price cannot be gamed by timing a sale — the two are independent, and a grower may perfectly well sell cash corn at the October high and receive a harvest price computed off the month's average.
What would change this reading: a genuine yield failure emerging in the September or final estimates, which would cut the crop and raise the price simultaneously — pushing the trigger price up through the yield term and the market price up at the same time, and making RP more rather than less likely to engage. That is the scenario the drought footprint across Minnesota and the Dakotas keeps alive, and it is the reason for holding this conclusion as a probability rather than a certainty.
References
- farmdoc daily, University of Illinois — "Projected Prices and Volatility Factors for 2026," Mar 3, 2026. Corn projected price $4.62 (2025: $4.70), volatility factor 0.15 (2025: 0.18); soybeans $11.09 (2025: $10.54), volatility factor 0.13 (2025: 0.14); February discovery on December corn and November soybean contracts. Fetched Aug 17, 2026. https://farmdocdaily.illinois.edu/2026/03/projected-prices-and-volatility-factors-for-2026.html
- Iowa State University Extension, Ag Decision Maker — "Revenue Protection Crop Insurance" (A1-54), on the guarantee being based on the higher of projected or harvest price and October harvest-price discovery. https://www.extension.iastate.edu/agdm/crops/html/a1-54.html
- Trading Economics — corn benchmark, 460.05 US cents/bu as of Aug 17, 2026; +2.35% MoM, +20.12% YoY. Also the relayed USDA August figures: yield cut to 180.7 bu/acre from 183 against expectations of 182.4; production 16.013 billion bushels; 2025/26 exports +75 million bushels to a record 3.4 billion; 2026/27 exports +75 million to 3.275 billion; ending stocks 1.653 billion from 1.79 billion. Accessed Aug 17, 2026. https://tradingeconomics.com/commodity/corn
- DTN/Progressive Farmer — retail fertilizer survey as reported Aug 12, 2026: anhydrous $963/ton, urea $678/ton, potash $495/ton. https://www.dtnpf.com/agriculture/web/ag/crops/article/2026/08/12/fertilizers-start-august-mixed-5-led
Disclosures
Crop Root Zone is an independent publication. Nothing here is investment advice. Market calls, where included, reflect the editors' own read and are not a recommendation to buy or sell any security.
Drought Just Crossed Half the Lower 48. Weighted by Corn Production, It Is About 24 Percent.
The Drought Monitor hit 50.38 percent D1-or-worse on August 11, the highest of the season — while Illinois sits at 1.4 percent, Indiana at zero, and Iowa actually improved. The map is measuring land area. The crop lives somewhere else.
The U.S. Drought Monitor map valid August 11 put 50.38 percent of the contiguous United States in moderate drought or worse — the first reading above half this season, and up from 45.77 percent three weeks earlier. Abnormally dry conditions or worse now cover 73.62 percent of the lower 48. On August 12, one day later, USDA forecast a 16.0-billion-bushel corn crop, the second largest on record, and a record 4.52-billion-bushel soybean crop.
Those two facts are not in tension, and the reason they are not is worth an hour of any grower's attention this month. Drought coverage is measured in land area. Corn is not grown in land area. It is grown in five states.
1. The national number and the crop are describing different geography
What's new: Every category of the Drought Monitor expanded over the last three weeks, and the expansion was fastest at the shallow end — abnormally dry, not severe.
Evidence: The contiguous-U.S. series, by percent of area:
| Map valid | D0+ | D1+ | D2+ | D3+ | D4 |
|---|---|---|---|---|---|
| Jul 21, 2026 | 65.24 | 45.77 | 29.14 | 10.71 | 0.93 |
| Jul 28, 2026 | 67.92 | 47.89 | 28.30 | 10.00 | 0.86 |
| Aug 4, 2026 | 70.95 | 48.54 | 28.57 | 9.51 | 0.95 |
| Aug 11, 2026 | 73.62 | 50.38 | 29.50 | 10.27 | 1.04 |
| Three-week change | +8.38 | +4.61 | +0.36 | −0.44 | +0.11 |
Source: U.S. Drought Monitor, national statistics by area percent, maps valid Jul 21 – Aug 11, 2026. Change row is this publication's arithmetic.
Read the bottom row across. D0 expanded 8.4 points and D2 expanded 0.4. The dryness is spreading, not deepening — new area is entering at the bottom of the ladder while severe and extreme categories are close to flat. That is a materially different signal from a drought that is intensifying in place, and it is the first reason the crop forecast did not move with the map.
The second reason is where the new area is.
2. Two of the three biggest corn states have essentially no drought
What's new: Illinois, which grows about one bushel in seven of the national corn crop, had 1.4 percent of its area in D1 or worse on August 11. Indiana had none. Iowa, the largest producer, actually improved on the week.
Evidence: The five largest corn states by production, against their August 11 drought coverage:
| State | Corn production (1,000 bu) | Share of U.S.* | D0+ | D1+ | D2+ |
|---|---|---|---|---|---|
| Iowa | 2,764,800 | 17.3% | 36.5 | 24.5 | 2.7 |
| Illinois | 2,321,400 | 14.5% | 31.1 | 1.4 | 0.0 |
| Nebraska | 1,767,780 | 11.0% | 91.6 | 81.2 | 54.9 |
| Minnesota | 1,635,100 | 10.2% | 88.2 | 75.2 | 44.8 |
| Indiana | 1,062,960 | 6.6% | 3.9 | 0.0 | 0.0 |
| Top five | 9,552,040 | 59.7% | — | — | — |
| United States | 16,012,964 | 100% | 73.62 | 50.38 | 29.50 |
*Share column is this publication's arithmetic. Sources: USDA NASS, Crop Production / Agricultural Statistics Board briefing, Aug 12, 2026 (production); U.S. Drought Monitor, map valid Aug 11, 2026 (drought).
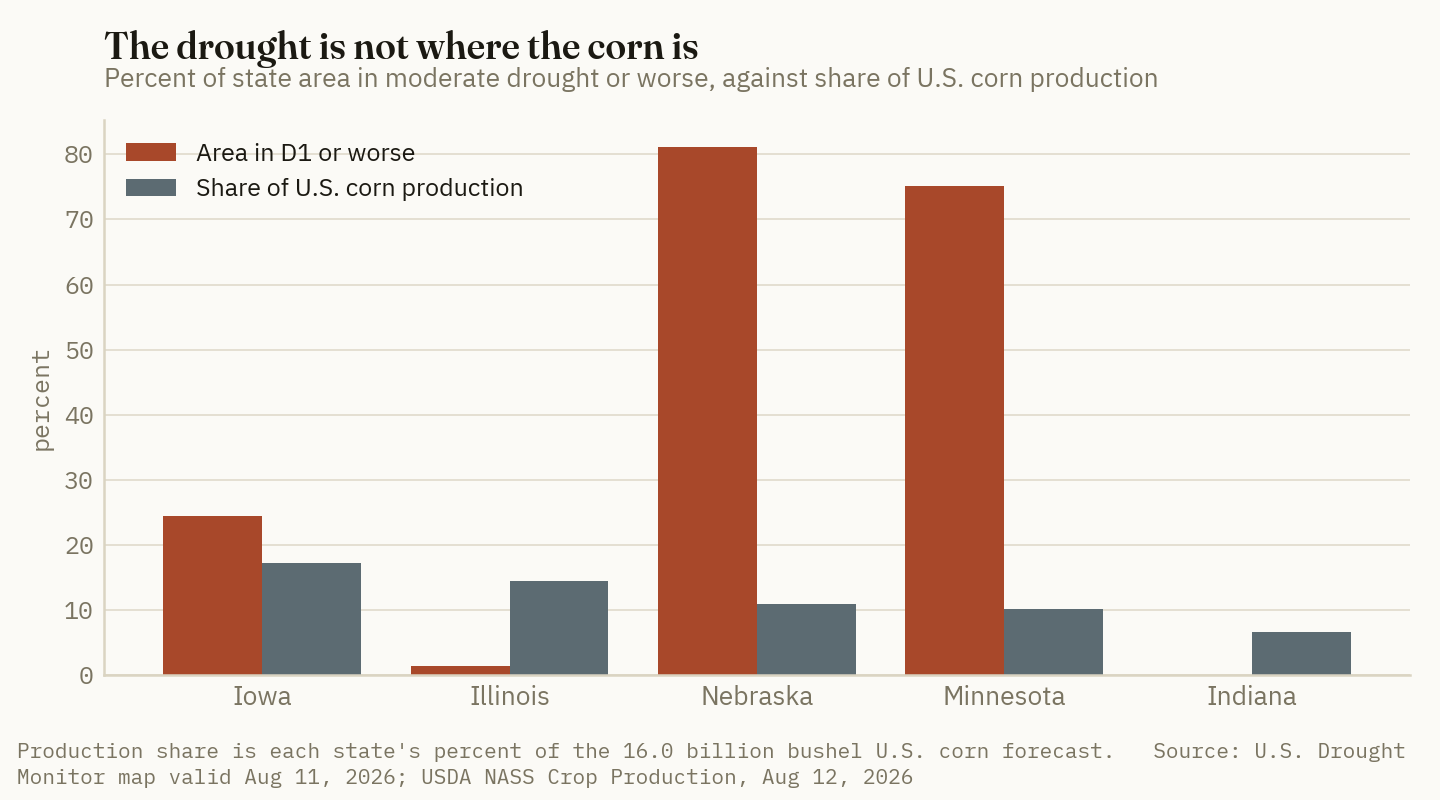
Weight each state's D1+ coverage by its share of top-five production and the picture resolves: 35.3 percent, against a national land-area figure of 50.38 percent. Simply counting where the corn is, rather than where the acres are, removes fifteen points of the headline.
Iowa deserves its own line. It went from 26.4 percent D1+ on August 4 to 24.5 on August 11, and from 44.8 percent D0+ to 36.5 — an eight-point improvement in the abnormally-dry category in the week the national number crossed 50. The largest corn state got wetter in the week the map got drier.
3. Nebraska is 81 percent in drought and irrigates three-quarters of its corn
What's new: The single largest contributor to that 35.3 percent weighted figure is Nebraska, and Nebraska is the one state where drought coverage and crop water supply are least connected.
Evidence: Roughly 74 percent of Nebraska's corn acres are irrigated — more than five million acres — making it the most heavily irrigated state in the country. University of Nebraska work puts irrigated corn near 200 bushels per acre against 147 for non-irrigated, a 53-bushel gap that exists precisely because the pump breaks the link between rainfall and yield.
Apply that to the weighted exposure. If irrigation were distributed independently of drought, Nebraska's genuinely rain-dependent-and-in-drought share would be 81.2 × 0.26 ≈ 21.1 percent rather than 81.2:
| Measure | Value |
|---|---|
| National D1+, land area (Aug 11) | 50.38% |
| Top-five, weighted by corn production | 35.33% |
| Top-five, weighted and irrigation-adjusted* | 24.21% |
*This publication's arithmetic. The irrigation adjustment applies Nebraska's ~74 percent irrigated corn share to its D1+ coverage and assumes irrigation and drought are independently distributed. In practice Nebraska's irrigation is concentrated in its drier western counties, which means the assumption is conservative — the true rain-dependent exposure is likely lower, not higher. Sources: U.S. Drought Monitor, Aug 11, 2026; USDA NASS, Aug 12, 2026; Nebraska Corn Board and University of Nebraska Extension (irrigated share and yield differential).
24% vs. 50%
Corn's production-weighted, irrigation-adjusted drought exposure against the national land-area headline. Same week, same map, same crop. (This publication's calculation from U.S. Drought Monitor, Aug 11, 2026 and USDA NASS, Aug 12, 2026.)
Ground Truth: A grower or a trader treating "half the country is in drought" as a bullish corn input is trading a land-area statistic as if it were a production one, and the market has already declined to make that mistake — which is why the map crossed 50 percent and the crop forecast went up. The exposure that is real does not sit in the states the headline is about. It sits in Minnesota, which has no irrigation to speak of, 75 percent D1+ coverage, and the fastest-deteriorating severe-drought footprint in the Corn Belt. If you are looking for the September revision, look there and in the Dakotas, not at the national percentage.
4. Minnesota is the exposure, and the survey window is the timing problem
What's new: Minnesota's severe-drought coverage rose 10.5 points in a single week, from 34.3 percent on August 4 to 44.8 on August 11. North Dakota's abnormally-dry coverage reached 99.0 percent.
Evidence: The northern tier, over four weeks:
| State | Jul 21 D1+ | Aug 11 D1+ | Change | Jul 21 D2+ | Aug 11 D2+ | Change |
|---|---|---|---|---|---|---|
| Minnesota | 47.8 | 75.2 | +27.4 | 17.0 | 44.8 | +27.8 |
| North Dakota | 16.7 | 64.0 | +47.3 | 1.7 | 30.4 | +28.7 |
| South Dakota | 51.6 | 76.5 | +24.9 | 20.8 | 38.5 | +17.7 |
| Nebraska | 76.2 | 81.2 | +5.0 | 60.8 | 54.9 | −5.9 |
| Kansas | 26.6 | 32.0 | +5.4 | 6.2 | 6.6 | +0.4 |
| Iowa | 14.0 | 24.5 | +10.5 | 0.0 | 2.7 | +2.7 |
| Illinois | 0.0 | 1.4 | +1.4 | 0.0 | 0.0 | 0.0 |
Source: U.S. Drought Monitor, state statistics by area percent, maps valid Jul 21 and Aug 11, 2026. Change columns are this publication's arithmetic.
Minnesota's crop already shows it. NASS put Minnesota corn at 197 bushels per acre, with production down 3.7 percent from last season, and Minnesota soybeans at 48.0 bushels — down 8.6 percent, the sharpest yield decline among the five largest soybean states. Nebraska corn production is down 12.8 percent year on year, though that came as much through acreage as yield: planted area fell 5.6 percent and harvested area 7.6 percent against a 5.7 percent yield decline.
The timing detail that decides how much of this is already in the number. NASS's August yield estimate rests on a producer survey whose usable responses were collected across roughly August 1 to August 10, per the Agricultural Statistics Board's own briefing material. The August 11 map — Minnesota's 10.5-point severe-drought expansion, North Dakota's move to 99 percent D0+ — falls at the very end of that window or past it. Some of it is in the August number. Not obviously all of it.
Three things to watch before the September report:
- Minnesota, first and mostly. Roughly 10 percent of the national corn crop, a bean yield already marked down 8.6 percent, and the fastest-worsening D2 footprint on the map.
- Whether D0 converts. Eight points of new abnormally-dry area appeared in three weeks while D2 barely moved. Shallow dryness late in grain fill costs far less than the same area at D2 would; if it deepens rather than spreads, the arithmetic in this piece changes.
- Iowa's direction, not its level. It improved this week. A state at 17.3 percent of national production moving two points either way is worth more to the national yield than North Dakota's entire map.
References
- U.S. Drought Monitor (National Drought Mitigation Center / USDA / NOAA) — national and state drought severity statistics by area percent, maps valid Jul 21 – Aug 11, 2026. https://droughtmonitor.unl.edu/
- USDA National Agricultural Statistics Service — August Crop Production, Agricultural Statistics Board briefing, Aug 12, 2026. https://www.nass.usda.gov/Newsroom/Executive_Briefings/2026/08-12-2026.pdf
- Nebraska Corn Board — "What's the Difference Between Dry Land and Irrigated Corn?" https://nebraskacorn.gov/cornstalk/whats-the-difference-between-dry-land-corn-and-irrigated-corn/
- University of Nebraska Extension — "Irrigation Management for Corn," G1850. https://extensionpubs.unl.edu/publication/g1850/irrigation-management-for-corn
- Drought.gov — Current Conditions, national summary, accessed Aug 14, 2026. https://www.drought.gov/current-conditions
Disclosures
Crop Root Zone is an independent publication. Nothing here is investment advice. Market calls, where included, reflect the editors' own read and are not a recommendation to buy or sell any security.
One Buyer Took 82 Percent of Last Week's New-Crop Bean Sales. Corn's Biggest Took 45.
China booked 1.45 million tonnes of the 1.76 million tonnes of 2026/27 soybeans sold in the week ending August 6 — 1.2 percent of a record crop, to one counterparty, in five business days. The corn book that week was spread across Mexico, unknown destinations and everyone else.
USDA's Foreign Agricultural Service reported net sales of 1,759,900 tonnes of 2026/27 soybeans for the week ending August 6 — 64.7 million bushels. China bought 1,446,000 tonnes of it. Unknown destinations took another 272,000. New-crop corn sales the same week were 924,500 tonnes, 36.4 million bushels, with Mexico the largest single buyer at 416,400 tonnes and unknown destinations at 253,700.
Two crops, one week, both being sold forward into a very large harvest. The soybean book was 82 percent one buyer. The corn book was 45 percent its largest.
1. The week, by destination
What's new: The soybean concentration is not a rounding artifact of a thin week. It is a large week — 64.7 million bushels of new crop in five business days — and the concentration is in the volume, not despite it.
Evidence: New-crop sales for the week ending August 6, as reported:
| Crop | Total net sales (t) | Largest buyer | Volume (t) | Share |
|---|---|---|---|---|
| Soybeans 2026/27 | 1,759,900 | China | 1,446,000 | 82.2% |
| Corn 2026/27 | 924,500 | Mexico | 416,400 | 45.0% |
Sources: USDA FAS weekly export sales, week ending Aug 6, 2026, released Aug 13, 2026, as reported by Brownfield Ag News, Aug 13, 2026. Share column is this publication's arithmetic.
Add the unknown-destination line and the two books look even less alike:
| Destination line | Soybeans (t) | Share | Corn (t) | Share |
|---|---|---|---|---|
| Largest named buyer | 1,446,000 | 82.2% | 416,400 | 45.0% |
| Unknown destinations | 272,000 | 15.5% | 253,700 | 27.4% |
| Everyone else | 41,900 | 2.4% | 254,400 | 27.5% |
| Total | 1,759,900 | 100% | 924,500 | 100% |
Source: as above. "Everyone else" is the residual and is this publication's arithmetic.
| Share of the week's new-crop book | % | |
|---|---|---|
| Soybeans — China | 82.2 | ██████████ |
| Corn — Mexico | 45.0 | █████ |
| Corn — everyone but Mexico | 55.0 | ███████ |
| Soybeans — everyone but China | 17.8 | ██ |
Source: USDA FAS weekly export sales, week ending Aug 6, 2026.
There is an upper bound worth stating and then setting aside. Unknown destinations frequently resolve to the buyer already dominating a book; if all 272,000 tonnes of the soybean unknowns were ultimately China, the week's concentration would be 97.6 percent. That is a bound, not a finding — unknowns resolve elsewhere often enough that treating the upper bound as the number would be sloppy. It is quoted here only so a reader understands which direction the uncertainty runs.
2. What one week means against a record crop
What's new: USDA forecast a record 4.519-billion-bushel soybean crop on August 12, at 52.7 bushels per acre. The single week of Chinese buying above is 1.18 percent of it.
Evidence: Converting the sales into crop terms:
| Measure | Soybeans | Corn |
|---|---|---|
| 2026 production forecast (mn bu) | 4,519 | 16,013 |
| Yield (bu/acre) | 52.7 | 180.7 |
| Harvested acres (mn) | 85.8 | 88.6 |
| Largest buyer's week (mn bu) | 53.1 | 16.4 |
| As % of the crop | 1.18% | 0.10% |
Sources: USDA NASS Crop Production / Agricultural Statistics Board briefing, Aug 12, 2026; USDA FAS weekly export sales, week ending Aug 6, 2026. Bushel conversions at 36.7437 bu/tonne for soybeans and 39.3683 for corn; percentage rows are this publication's arithmetic.
1.18%
Share of the entire record 2026 U.S. soybean crop committed to a single buyer in the week ending August 6. (This publication's calculation from USDA FAS export sales and USDA NASS Crop Production, both August 2026.)
The twelve-fold difference between those last two cells is mostly structural rather than newsworthy — soybeans export a far larger fraction of production than corn does, so a single large sale is always a bigger bite of the bean crop than of the corn crop. What is not structural is who is making it. Corn's marginal buyer that week was Mexico, a contiguous customer buying into a long-running trade relationship, alongside 27 percent of the book in unknowns and another 27 percent scattered. Soybeans' marginal buyer was one sovereign counterparty taking four bushels in five.
Ground Truth: For a grower with unpriced new-crop beans, this is not a geopolitics observation — it is a description of who is on the other side of your basis. A book that is 82 percent one buyer prices differently from a diversified one in exactly one respect: it reprices on that buyer's calendar, not on the balance sheet. The bean crop and the corn crop are both large. Only the bean crop has a price that can move on a single counterparty's decision to pause for two weeks, and that argues for treating incremental new-crop bean pricing as a risk-reduction exercise rather than a wait-for-more-rally one — regardless of what you think the fundamentals justify.
3. The shipping side says the old crop is finishing, not starting
What's new: The same week's shipment and unshipped-balance figures show the 2025/26 program closing out rather than the new one loading.
Evidence: Physical shipments and outstanding balances, week ending August 6:
| Line | Volume | Detail |
|---|---|---|
| Corn shipments, 2025/26 | 410,700 t (16.2 mn bu) | Spain 257,600 t; Mexico 74,000 t |
| Soybean shipments, 2025/26 | 75,100 t (2.8 mn bu) | China 65,900 t; Japan 52,100 t |
| Soybean cumulative exports, 2025/26 | 1.536 bn bu | Season to date |
| Wheat shipments | 255,900 t (9.4 mn bu) | Mexico 101,100 t; South Korea 66,500 t |
| Wheat cancellations (unknown) | 143,000 t | Against the above |
| Corn + soybean unshipped balance | 9.6 mmt | −14% w/w, +9% YoY |
| Wheat unshipped, 2026/27 | 3.99 mmt | −6% w/w, −41% YoY |
Sources: USDA FAS weekly export sales, week ending Aug 6, 2026, as reported by Brownfield Ag News, Aug 13, 2026; USDA AMS Grain Transportation Report, Aug 13, 2026 (unshipped balances).
Two things stand out and neither is the corn or bean line. Wheat's unshipped balance is down 41 percent year on year — a far larger deterioration than anything in the row-crop book, and it sits alongside 143,000 tonnes of cancellations in a week when total wheat shipments were 255,900. And the combined corn-and-soybean unshipped balance, at 9.6 million tonnes, is up 9 percent from a year ago even after falling 14 percent on the week. The forward book is bigger than last year's; it is the near-term shipping queue that emptied.
4. A concentrated book has a geography, and the freight numbers show it
What's new: Where a concentrated forward book executes matters as much as who holds it, because the two U.S. export coasts are not priced alike and the gap is currently large.
Evidence: Ocean freight for the week ending August 6:
| Route | Rate | Change | |
|---|---|---|---|
| U.S. Gulf → Japan | $71.50/mt | +3% w/w | ██████████ |
| Pacific Northwest → Japan | $36.75/mt | +1% w/w | █████ |
| Spread | $34.75/mt | — |
Source: USDA AMS Grain Transportation Report, Aug 13, 2026. Spread row is this publication's arithmetic.
Thirty-three oceangoing grain vessels were loaded in the Gulf that week, 14 percent more than the same period last year, with 30 expected in the following ten days — 9 percent fewer than a year ago. The Gulf is running ahead of last year on loadings and slightly behind on the forward book.
What this publication cannot tell you, and will not guess: the destination-port split for last week's Chinese purchases is not in the public weekly report. A Pacific Northwest execution and a Gulf execution imply different interior basis, different rail demand and a $34.75 per tonne difference in freight to the same discharge port. The concentration documented in Section 1 is therefore also a concentration of routing risk, in a direction this week's data does not resolve. A grower whose delivery point feeds one coast and not the other is exposed to that split whether or not anyone publishes it.
One related figure from the same report belongs here. Average August shuttle secondary railcar bids ran $83 per car above tariff for the week ending August 6 — $217 above the same week last year — while non-shuttle bids at $44 above tariff were $31 below year-ago. Shuttle capacity is what serves high-volume export loading. The secondary market is already paying up for it, six weeks before harvest.
5. What would change the read
What's new: Nothing in this piece requires China to stop buying. It requires only that a reader distinguish a large book from a diversified one.
Three tests over the next month:
- Does the concentration persist? One week at 82 percent is a data point. Four consecutive weeks above 70 percent is a market structure, and it would justify treating new-crop bean basis as a single-counterparty exposure explicitly.
- Do the unknowns resolve toward China or away? This is the cleanest available measure of whether the concentration is real or a reporting artifact, and it resolves on its own within weeks without anyone having to forecast anything.
- Does corn's book stay spread? Mexico at 45 percent with 27 percent unknown is a normal-looking corn week. If the unknowns resolve into a single destination too, the contrast drawn here narrows and the argument weakens.
There is no market call in this piece. The tradeable names in this publication's coverage universe are input and equipment companies, and the subject here is a grain marketing decision, not an equity one.
References
- Brownfield Ag News — "China makes up most of week's soybean export sales," Aug 13, 2026, reporting USDA FAS weekly export sales for the week ending Aug 6, 2026. https://www.brownfieldagnews.com/news/china-makes-up-most-of-weeks-soybean-export-sales/
- USDA Foreign Agricultural Service — Export Sales Reporting Program / Weekly Export Sales. https://www.fas.usda.gov/programs/export-sales-reporting-program
- USDA National Agricultural Statistics Service — August Crop Production, Agricultural Statistics Board briefing, Aug 12, 2026. https://www.nass.usda.gov/Newsroom/Executive_Briefings/2026/08-12-2026.pdf
- USDA Agricultural Marketing Service — Grain Transportation Report, Aug 13, 2026. https://www.ams.usda.gov/sites/default/files/media/GTR08132026.pdf
Disclosures
Crop Root Zone is an independent publication. Nothing here is investment advice. Market calls, where included, reflect the editors' own read and are not a recommendation to buy or sell any security.
USDA Cut the Corn Yield 2.3 Bushels. The Crop Got Bigger and the Carryout Still Fell 137 Million.
The August WASDE's stock reduction decomposes exactly: +13 million from production, −75 from a carry-in revision, −75 from exports. The yield cut contributed nothing.
USDA's World Agricultural Outlook Board published WASDE-674 at noon Eastern on August 12, carrying the season's first survey-based corn and soybean yield forecasts. The corn yield came in at 180.7 bushels per acre, down 2.3 bushels from the July projection. Ending stocks for 2026/27 fell 137 million bushels to 1.7 billion. Those two facts appeared in the same report and most of the coverage tied them together. They are not connected. Corn production went up 13 million bushels this month, to 16.0 billion — the second-largest U.S. corn harvest on record — because a 1.2-million-acre increase in harvested area more than absorbed the lower yield. Every bushel of the stocks reduction came from the demand side of the page.
1. The decomposition is exact, and it has three terms
The August balance sheet change for 2026/27 U.S. corn resolves without a residual:
| Line item | Change vs. July | Direction on ending stocks |
|---|---|---|
| Production | +13 mn bu | builds stocks |
| Beginning stocks | −75 mn bu | draws stocks |
| Exports | +75 mn bu | draws stocks |
| Ending stocks | −137 mn bu | 1,700 mn bu |
Source: USDA WASDE-674, Aug 12, 2026. Arithmetic: +13 − 75 − 75 = −137.
Read the middle line carefully, because it is the one nobody covered. Beginning stocks for 2026/27 were lowered 75 million bushels to 1.9 billion, and USDA is explicit about why: raised exports for 2025/26 — the old crop, the marketing year that has already largely happened. A third of this month's tightening is a backward-looking revision to a year that is nearly closed. It is not news about the 2026 crop at all.
The forward-looking third is the export line. USDA raised 2026/27 corn exports 75 million bushels to 3.3 billion, citing increased global demand and constrained exports for Ukraine. Total use rose 75 million to 16.3 billion against domestic use left unchanged — so the entire increase in projected consumption is foreign buyers, not ethanol and not feed.
| Component of the 137 mn bu cut | Bushels | Share | |
|---|---|---|---|
| Old-crop export revision (beginning stocks) | 75 | 55% | ██████████ |
| New-crop export increase | 75 | 55% | ██████████ |
| Production (offsetting) | −13 | −10% | ░░ |
Source: derived from USDA WASDE-674, Aug 12, 2026. Shares exceed 100% because production worked in the opposite direction.
Ground Truth: A yield cut and a demand-led stock draw call for opposite trades. A yield cut is a supply shock — it is weather, it is regional, it can reverse in September or October when the objective-yield surveys replace the farmer-reported ones. A demand draw is a level shift in the consumption base that does not reverse on a rain. This month's number is the second kind wearing the first kind's headline. If you sold cash corn on Wednesday because "USDA cut the yield," you sold a demand-tightening balance sheet on a supply story.
2. The yield cut is real, but it is the least reliable number in the report
The 180.7 bu/acre figure is the season's first survey-based forecast, which replaces the trend-and-weather modeling used in July. That transition is where the 2.3-bushel change came from — it is a change of method as much as a change of conditions.
Two features of the report argue for treating it as provisional. First, USDA raised harvested area at the same time, by 1.2 million acres — and area revisions of that size in August are themselves an admission that the acreage base was unsettled. Second, and more striking, the same report cut the sorghum yield by 13.9 bushels per acre to 55.4, taking sorghum production down 84 million bushels to 296 million. That is a roughly 20% yield cut and a 22% production cut in a crop grown on much of the same Plains geography as the marginal corn acre.
| Crop | Aug yield | Change vs. July | Production | Change |
|---|---|---|---|---|
| Corn | 180.7 bu/ac | −2.3 (−1.3%) | 16.0 bn bu | +13 mn |
| Sorghum | 55.4 bu/ac | −13.9 (−20.1%) | 296 mn bu | −84 mn |
| Soybeans | 52.7 bu/ac | −0.3 (−0.6%) | 4.5 bn bu | +44 mn |
Source: USDA WASDE-674, Aug 12, 2026.
A 20% sorghum cut alongside a 1.3% corn cut is a wide spread between two crops that share weather. It may be entirely correct — sorghum's acreage base is smaller and more concentrated, so it samples differently. But it is the kind of divergence that gets revised, and it is a reason to hold the corn yield loosely until the objective-yield data arrive.
3. Soybeans went the other way, and the crush is why
The soybean side of the report is the mirror image: a slightly lower yield, a materially higher crop, and looser stocks.
| 2026/27 soybeans | August | Change vs. July |
|---|---|---|
| Yield | 52.7 bu/ac | −0.3 |
| Harvested area | 85.8 mn ac | +1.4 mn |
| Production | 4.5 bn bu | +44 mn bu |
| Crush | 2.78 bn bu | +30 mn bu |
| Meal exports | 22.7 mn short tons | +0.7 mn st |
| Exports | unchanged | — |
| Ending stocks | 320 mn bu | +10 mn bu |
| Season-average farm price | $11.40/bu | unchanged |
Source: USDA WASDE-674, Aug 12, 2026. Soybean meal projected at $310/short ton, oil at 70 cents/lb, both unchanged.
The harvested-area increase of 1.4 million acres — attributed to Missouri, Mississippi and Minnesota — outran the yield cut by enough to add 44 million bushels. USDA then put 30 million of that into crush, citing robust crush margins and demand for both meal and oil, and raised meal exports 0.7 million short tons on demand from the Philippines, Mexico, Thailand, Turkey, the EU and Ecuador. Bean exports were left alone. Ending stocks still rose 10 million bushels to 320 million.
So the two crops now carry opposite signals from the same report: corn tightened on export demand while its crop grew; soybeans loosened on a bigger crop that domestic processors — not foreign bean buyers — absorbed most of.
1.7 bn bu
2026/27 U.S. corn ending stocks after the August cut — a stocks-to-use ratio of 10.4% against total use of 16.3 billion bushels. (Derived from USDA WASDE-674, Aug 12, 2026)
4. What the price lines actually did
USDA moved two of the four major season-average farm prices, and both moves were small relative to the balance-sheet changes underneath them.
| Crop | 2026/27 SAFP | Change | Ending stocks | Change |
|---|---|---|---|---|
| Corn | $4.50/bu | +$0.10 | 1,700 mn bu | −137 mn |
| Soybeans | $11.40/bu | unchanged | 320 mn bu | +10 mn |
| Wheat | $6.20/bu | +$0.20 | 717 mn bu | −5 mn |
| Rice (all) | $14.90/cwt | unchanged | 36.0 mn cwt | +2.9 mn |
Source: USDA WASDE-674, Aug 12, 2026. Wheat production 1,531 mn bu, down 5 mn on lower harvested area and yield, with Hard Red Winter and Durum accounting for most of the reduction; wheat ending stocks are down 22% from last year. All-rice production 158.4 mn cwt on a 7,644 lb/acre yield, with ending stocks still down 33% year on year.
The wheat line deserves a note because it is the most aggressive price move in the report on the smallest stock change. USDA raised wheat's season-average price 20 cents on a 5-million-bushel stocks reduction, explicitly citing the lower stocks-to-use ratio and observed futures and cash prices. Wheat carryout is down 22% year over year; rice carryout is down 33%. Those two are genuinely tight balance sheets. Corn's 10.4% stocks-to-use is not tight by historical standards — it is merely tighter than it was in July.
5. Where this leaves the fall input decision
The practical consequence sits in the crop-to-fertilizer ratio, and it moved the wrong way for growers this month. Corn's season-average price forecast went up a dime, to $4.50. On the same day's retail fertilizer survey, anhydrous ammonia averaged $963/ton, which is 26% higher than a year ago (DTN/Progressive Farmer, Aug 12, 2026, covering Aug 3–7).
At 180.7 bushels per acre and $4.50, gross crop revenue is $813/acre. At $0.59 per pound of nitrogen and a 180 lb/acre N rate, the nitrogen bill alone is $106/acre, or 13.0% of gross. A year ago the same nitrogen rate at anhydrous's year-ago equivalent cost roughly $84/acre.
| Item | 2026/27 | Basis |
|---|---|---|
| Corn SAFP | $4.50/bu | USDA WASDE-674 |
| Corn yield forecast | 180.7 bu/ac | USDA WASDE-674 |
| Gross revenue | $813/ac | derived |
| N at 180 lb/ac, anhydrous | $106/ac | derived at $0.59/lb N |
| N as share of gross | 13.0% | derived |
| Bushels to pay the N bill | 23.5 bu/ac | derived |
Sources: USDA WASDE-674, Aug 12, 2026; DTN/Progressive Farmer retail fertilizer survey, Aug 12, 2026 (week of Aug 3–7). Derived rows are this publication's arithmetic at a stated 180 lb/acre rate, not a USDA figure.
Ground Truth: The export line is the one to watch, not the yield line. USDA raised 2026/27 corn exports 75 million bushels and revised 2025/26 exports up enough to take 75 million out of the carry-in — two separate confirmations, in one report, that foreign demand has been running ahead of the forecast. Weekly export sales are published every Thursday and are the highest-frequency check on whether that continues. If commitments keep outrunning the pace implied by 3.3 billion bushels, the September and October WASDEs tighten again regardless of what the objective-yield surveys do to 180.7 — and that is the scenario in which holding unpriced bushels past harvest pays. If export sales stall, the yield question becomes the only question again, and a 16-billion-bushel crop is a heavy thing to be long into.
Market read: ADM (NYSE) — Hold. The crush story in this report is real: USDA raised soybean crush 30 million bushels on margins it describes as robust, and lifted meal exports on broad-based demand. But the same report leaves soybean carryout higher and bean prices unchanged, and a processor's margin is a spread, not a level. The demand evidence supports the business; it does not by itself re-rate the equity.
References
- USDA World Agricultural Outlook Board — World Agricultural Supply and Demand Estimates, WASDE-674, Aug 12, 2026. https://www.usda.gov/oce/commodity/wasde/
- USDA WASDE-674, "Coarse Grains" section — corn production 16.0 bn bu, yield 180.7 bu/ac, exports 3.3 bn bu, ending stocks 1.7 bn bu, SAFP $4.50/bu; sorghum yield 55.4 bu/ac, production 296 mn bu. Aug 12, 2026.
- USDA WASDE-674, "Oilseeds" section — soybean production 4.5 bn bu, harvested area 85.8 mn acres, yield 52.7 bu/ac, crush 2.78 bn bu, meal exports 22.7 mn st, ending stocks 320 mn bu, SAFP $11.40/bu. Aug 12, 2026.
- USDA WASDE-674, "Wheat" section — production 1,531 mn bu, ending stocks 717 mn bu (−22% YoY), SAFP $6.20/bu. Aug 12, 2026.
- USDA WASDE-674, "Rice" section — production 158.4 mn cwt, all-rice yield 7,644 lb/acre, ending stocks 36.0 mn cwt, SAFP $14.90/cwt. Aug 12, 2026.
- DTN/Progressive Farmer — Fertilizers Start August With Mixed Prices as 5 Nutrients Decline, Led by UAN32, Aug 12, 2026 (retail survey week of Aug 3–7, 2026). https://www.dtnpf.com/agriculture/web/ag/crops/article/2026/08/12/fertilizers-start-august-mixed-5-led
Crop Root Zone is an independent publication. Nothing here is investment advice. Market calls, where included, reflect the editors' own read and are not a recommendation to buy or sell any security.
The Crush Is Being Run for the Oil. The Meal Is 47% of the Revenue and All of the Risk.
At 72.76-cent oil and $331 meal, oil is now the majority of crush revenue for the first time in a generation — but every bushel crushed for oil forces out four pounds of meal for every pound of oil. Record 14.4-million-tonne meal exports are the only reason the arithmetic clears.
NOPA members crushed 214.340 million bushels of soybeans in June 2026, up 15.7% from June 2025, and followed it with 182.9 million bushels in July — a July record that beat the prior year by 9.6 million bushels. In the same July report, soybean oil stocks fell to 1.499 billion pounds, a seven-month low, down 123 million pounds from June. Record crush and falling oil inventory at the same time is the signature of a processing industry running flat out to feed demand it cannot get ahead of. But a soybean does not yield oil on request. Every bushel run for its oil produces roughly four pounds of meal for each pound of oil, and that meal has to go somewhere.
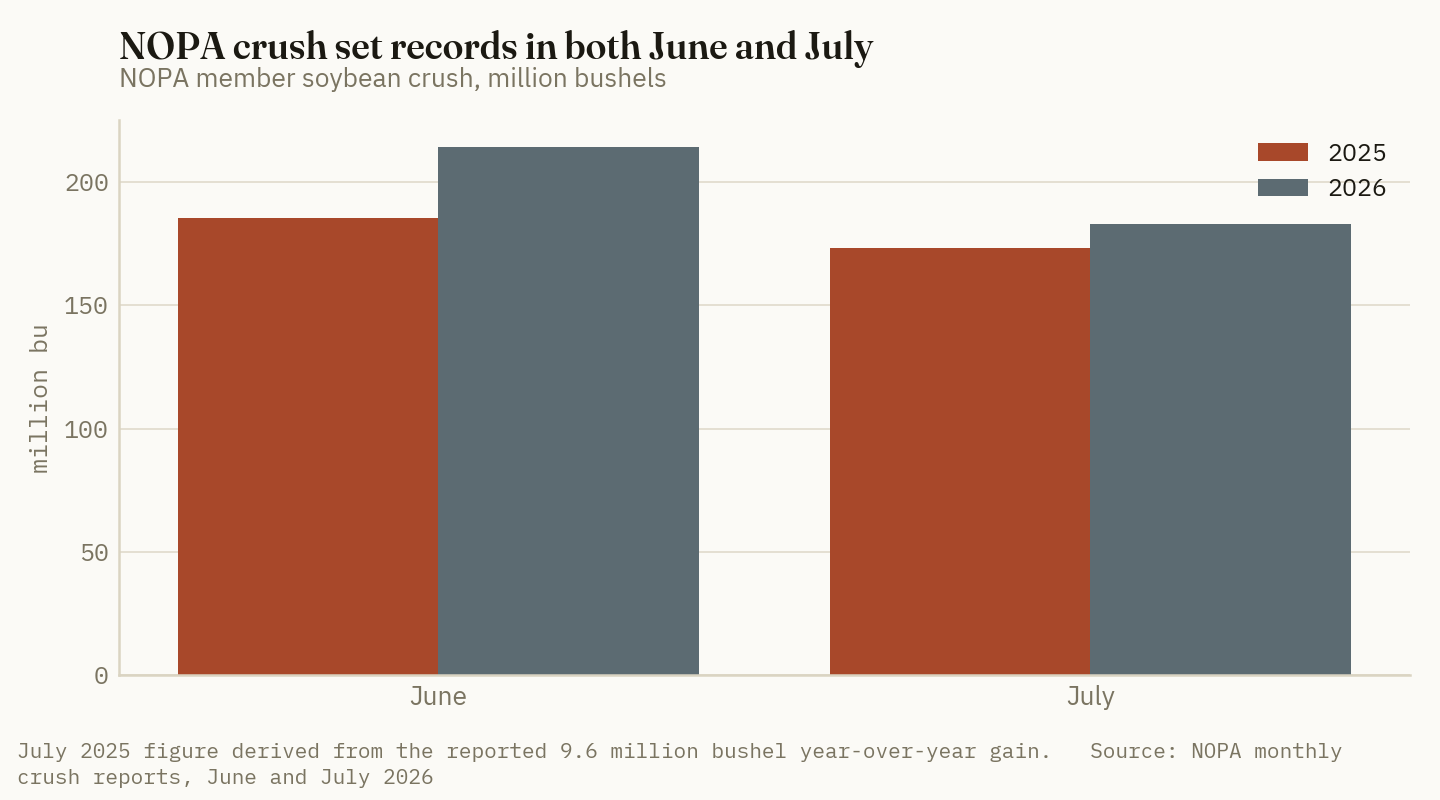
1. The oil demand is policy, and the policy got bigger
What's new: The crush build-out is a response to a mandate, not to a price signal that arose in the market. EPA's Renewable Volume Obligations for 2026 and 2027, finalized at the end of March, sit 67% and 70% above the 2025 total of 5.42 billion gallons, and the 45Z Clean Fuel Production Credit continues to route soybean oil into the fuel pool.
Evidence: The demand shift shows up on the consumption side before it shows up in price. U.S. soybean oil consumption reached a record 1.22 million tonnes in March, of which 658,000 tonnes went to biofuels — up 74% year over year and the first month since August 2024 in which biofuel use accounted for more than half of total soybean oil demand. Crush margins on the board followed: $2.11 per bushel on February 27, $3.76 by May 5.
USDA now forecasts 2026/27 crush at 2.75 billion bushels, up 5%, with marketing-year-to-date crush already running 8% above last year.
5.42 → 9.05 billion gallons
The 2025 RVO total against the finalized 2026 obligation, a 67% step increase — the single largest input into the crush build-out. (EPA Renewable Volume Obligations, finalized March 2026)
Ground Truth: A mandate-driven demand line does not behave like a market one. When crush is pulled by feed demand, a high meal price rations it and the system self-corrects. When it is pulled by a gallon obligation, the processor runs regardless of what the byproduct fetches, because the oil economics carry the plant. That makes meal the residual — priced by whatever clears after the oil decision has already been made. Anyone forecasting meal off feed demand alone is modeling the wrong variable.
2. Price the bushel out and the historical split has inverted
What's new: At current product prices, oil is the majority of crush revenue — a reversal of the long-standing pattern in which meal carried roughly two-thirds of the value of a crushed bushel.
Evidence: A 60-pound bushel yields approximately 11.4 pounds of crude oil and 44.6 pounds of 48% meal, with the balance in hulls. Applying current prices:
| Product | Yield per bu | Price | Revenue per bu | Share | |
|---|---|---|---|---|---|
| Soybean oil | 11.4 lb | $0.7276/lb | $8.29 | 52.9% | ██████████ |
| Soybean meal | 44.6 lb | $331.30/ton | $7.39 | 47.1% | █████████ |
| Combined | $15.68 | ||||
| Less: soybeans | 1 bu | $11.47/bu | −$11.47 | ||
| Gross product margin | $4.21 |
Sources: CBOT soybean oil futures opening quote, 72.76 cents/lb, Aug 2026; CBOT soybean meal ZMQ26 $331.30/ton, contract expiring Aug 14, 2026; CBOT soybeans $11.4725/bu settlement, Aug 11, 2026. Yield factors are standard industry conversions; revenue split, hull value excluded, and gross product margin are Crop Root Zone calculations and are gross of processing cost, energy and freight.
The historical relationship is the opposite: meal has conventionally carried around 60–65% of the value of a crushed bushel, with oil the smaller share. Oil at 53% is not a small drift off that norm — it is the norm turned over.
Note what the margin figure is and is not. $4.21 per bushel is a gross product margin, not a processing profit; it is before energy, labour, hexane, depreciation and freight, and it is calculated on nearby futures rather than on any individual plant's realized basis. It is directionally consistent with the $3.76 board crush print recorded in early May, which is the properly constructed measure.
Ground Truth: The inversion explains why the crush is not self-limiting at these meal prices. When meal was two-thirds of the revenue, a meal price break shut plants down. With oil carrying the majority, a plant can absorb a substantial meal decline and still run — which means the meal price has further it can fall before it changes anyone's behaviour. For a feeder, that is the good news. For anyone long meal on the assumption that record crush must eventually be rationed by weak byproduct values, it is not.
3. The constraint is meal disposal, and it is currently an export story
What's new: The meal produced by a 2.75-billion-bushel crush cannot be consumed domestically, and the balancing item has become exports — which are already at a record.
Evidence: U.S. soybean meal exports have reached a record 14.4 million metric tonnes. USDA forecasts global oilseed meal trade at a record 119 million tonnes in 2026/27, with soybean meal exports rising 5% to 88 million tonnes. In other words, the destination market is growing, but the U.S. share of it has to keep growing faster for the domestic crush expansion to clear.
Run the arithmetic on the increment. A 5% rise in crush to 2.75 billion bushels adds roughly 131 million bushels of throughput over the prior year. At 44.6 pounds of meal per bushel that is about 2.9 million short tons — 2.65 million tonnes — of additional meal in one year. Domestic livestock numbers are not growing at anything like that rate.
| Where the incremental meal has to go | Approx. tonnes/yr | |
|---|---|---|
| Additional meal from a 5% crush increase | ~2,650,000 | ██████████ |
| Forecast growth in global SBM trade (5% of 88 mmt) | ~4,190,000 | the whole world's growth |
Sources: USDA 2026/27 crush forecast of 2.75 billion bushels and global oilseed meal trade forecast; incremental meal tonnage is a Crop Root Zone calculation at 44.6 lb meal/bu.
The comparison is the point: the U.S. crush increment alone is equivalent to roughly 63% of the entire forecast growth in global soybean meal trade. That does not make it impossible — the U.S. can take share from Argentina and Brazil, and record export volumes say it currently is. It does mean the meal balance is now settled at export terminals and on ocean freight, not in domestic feedlots.
Ground Truth: The risk in the crush build-out has migrated from the oil side to the logistics side. The oil demand is legislated through 2027 and reasonably firm. The meal has to physically leave the country in volumes that require export capacity to keep pace, and the two things most likely to bind are vessel loading capacity and the river — which is exactly where this year's stress already is. A processor's worst case is no longer a soft meal price; it is meal it cannot ship, which backs up into plant slowdowns regardless of how good the oil economics look.
4. What it means on the farm
What's new: The two effects on a farm balance sheet run in opposite directions, and which one dominates depends on whether the operation sells beans or buys meal.
Evidence: For a bean seller, the crush build-out is the demand story underneath a soybean price that reached the mid-$11s in August, with USDA raising its demand outlook on crush strength. For a cattle or hog feeder, cheap meal is a direct input subsidy delivered by somebody else's mandate — meal traded a 30-day range of $295.90 to $342.90 per ton, and the crush arithmetic above says the floor under it is softer than it used to be.
For the rotation decision, the signal is weaker than it looks. A demand line that comes from a fuel obligation is a policy line, and policy lines are revisited. The RVOs are set through 2027; the 45Z credit's treatment beyond that is not something a 2027 acreage decision can safely assume.
Ground Truth: If you feed livestock, the useful read is that the meal discount is structural rather than seasonal for as long as the mandate holds, and it is worth locking a larger share of the ration than usual — the byproduct of somebody else's policy is the cheapest input you will be offered this year. If you grow beans, the caution is the mirror image: a crush-led bid is a durable bid only as long as the obligation behind it is, and the bean price is currently being supported by a demand line whose renewal date is inside the planning horizon of the acres you are about to commit.
5. The July number is a capacity signal, not a demand signal
What's new: July crush fell 14.7% from June in absolute terms and about 17% on a daily-rate basis — and was still a July record. That combination says the summer constraint is the plants, not the buyers.
Evidence: June's 214.340 million bushels came at a daily rate of 7.145 million bushels, itself up from 6.735 million in May. July's 182.9 million bushels across 31 days works out to roughly 5.90 million bushels a day — a Crop Root Zone calculation on the reported monthly totals, and a decline of about 17% from June's pace.
| Month | Crush (mn bu) | Days | Est. daily rate (mn bu) | |
|---|---|---|---|---|
| May 2026 | 208.785 | 31 | 6.735 * | █████████ |
| June 2026 | 214.340 | 30 | 7.145 * | ██████████ |
| July 2026 | 182.9 | 31 | ~5.90 | ████████ |
Sources: NOPA monthly crush reports, May–July 2026. * May and June daily rates as reported by NOPA; the July daily rate is a Crop Root Zone calculation from the monthly total.
Nothing about demand changed between June and July. What changed is that July is when crush plants take their maintenance turnarounds, and a plant down for a turnaround crushes nothing regardless of how good the margin is. The industry ran its scheduled downtime and still beat the prior July record by 9.6 million bushels.
The more telling number sits alongside it: oil stocks fell 123 million pounds in the same month, to a seven-month low. Consumption outran production in the industry's weakest production month of the year, with no inventory cushion built during the strong ones.
Ground Truth: A market that draws down oil inventory during turnaround season has no slack in it. The usual pattern is that summer downtime is absorbed by stocks built in the spring; this year there were no such stocks to absorb it. That has one clear implication for the coming months — the autumn crush run-up will be met by a demand line that is already ahead of it, which supports the crush margin and, by the arithmetic of section 2, keeps the pressure on meal to clear. Watch the August NOPA daily rate: a return to 7.1 million bushels a day or better says capacity is the only thing that was ever binding, and the meal question in section 3 arrives sooner than the annual forecasts imply.
References
- NOPA Monthly Crush Report, June 2026 — 214.340 million bushels crushed; 7.145 million bu/day. https://www.nopa.org/resources/nopa-monthly-crush-report/
- NOPA Monthly Crush Report, July 2026 — 182.9 million bushels; soybean oil stocks 1.499 billion lb.
- Argus Media, "US soy crush margins soar, set to remain high" — board crush $2.11/bu Feb 27 to $3.76/bu May 5, 2026.
- U.S. EPA, Renewable Volume Obligations for 2026 and 2027, finalized March 2026 — 67% and 70% above the 2025 total of 5.42 billion gallons.
- USDA Economic Research Service, Oil Crops Outlook, 2026 — 2026/27 crush forecast 2.75 billion bushels; global oilseed meal trade 119 million tonnes. https://www.ers.usda.gov/topics/crops/soybeans-and-oil-crops/market-outlook
- Agweek, "U.S. soybean meal reaches record exports, driven by increased crush capacity and global demand" — record 14.4 million metric tonnes.
- CBOT settlement and quote data, soybeans, soybean meal (ZMQ26) and soybean oil, Aug 11–12, 2026, via Barchart and Trading Economics.
Disclosures
Crop Root Zone is an independent publication. Nothing here is investment advice. Market calls, where included, reflect the editors' own read and are not a recommendation to buy or sell any security.
Agriculture Got the Carve-Out. It Is 83% of a Pipeline That Replaces 3% of the Drivers Leaving.
FMCSA's February rule keeps H-2A agricultural workers eligible for a non-domiciled CDL and estimates about 6,000 will be issued a year. In the same analysis it states that roughly 194,000 current holders will exit the freight market — and prices the whole rule at $1.36 million a year, which is seven dollars per departing driver.
On February 13, 2026, FMCSA published a final rule restricting who may hold a non-domiciled commercial driver's license. It took effect March 16. Eligibility now runs to three employment-based nonimmigrant categories only: H-2A temporary agricultural workers, H-2B temporary non-agricultural workers, and E-2 treaty investors. Agriculture, in other words, is inside the fence — and by FMCSA's own working assumption, agriculture accounts for roughly five of every six non-domiciled CDLs that will be issued from here. That is a real exemption, and it protects almost none of the trucking a grain farm actually depends on, because a farm's exposure to trucking is overwhelmingly to trucks it hires rather than trucks it plates. The number in the same document that matters to this fall is a different one: roughly 194,000.
1. What the rule does, and who stays eligible
What's new: The rule narrows non-domiciled CLP and CDL eligibility to H-2A, H-2B and E-2 status holders, whose fitness and driver history FMCSA judged reliably verifiable through consular vetting and interagency screening. Employment Authorization Documents are no longer accepted as proof of eligibility. It also requires an unexpired foreign passport and Form I-94/I-94A at every issuance, transfer, renewal and upgrade; a SAVE query to USCIS confirming lawful status; in-person presence at every renewal; and an expiration date matching the I-94 or one year, whichever is sooner.
Evidence: FMCSA received 8,010 comments during the 60-day period ending November 28, 2025. The safety case rests on 17 fatal crashes in 2025 caused by non-domiciled CDL holders who would be ineligible under the new rule, resulting in 30 fatalities; FMCSA states it identified no such crash caused by a holder who would remain eligible.
FMCSA's forward estimate of who is left builds up as follows:
| Category | FMCSA's estimate of annual non-domiciled CDL applicants | Share |
|---|---|---|
| H-2A (temporary agricultural workers) | ~5,000 (assumption: ⅓ of ~15,000 BLS ag heavy/tractor-trailer drivers) | 83% |
| H-2B (temporary non-agricultural workers) | 500–600 | ~9% |
| E-2 (treaty investors) | ≤300 | ~5% |
| Total, all categories | ~6,000 | 100% |
Source: Federal Register, 91 FR, doc. 2026-02965, "Restoring Integrity to the Issuance of Non-Domiciled Commercial Drivers Licenses (CDL)," Feb 13, 2026 — full text downloaded and parsed locally, Aug 17, 2026. Share column is this publication's arithmetic. FMCSA states it lacks a clear estimate of H-2A workers intending to operate a CMV "because it is often incidental to the work they are doing," and reaches 5,000 by assuming one-third of the BLS agricultural driver count holds H-2A status.
Two things about that table deserve flagging rather than repeating. The 5,000 is not a count; it is a one-third assumption applied to a BLS industry total, and FMCSA says so. And the upper bound FMCSA cites for context — approximately 27,240 H-2A visas issued to nationals of countries other than Canada and Mexico in 2023 — is described in the rule as "highly unlikely" to convert to CDL applications at anything near that rate.
2. The number in the same document that matters more
What's new: Immediately after estimating 6,000 annual issuances, the rule states: "The remaining roughly 194,000 current non-domiciled CDL holders will exit the freight market."
Evidence: FMCSA sizes the carrier-side exposure against a base of approximately 785,000 for-hire and private motor carriers, and says that assuming no single carrier employs more than one non-domiciled CDL holder, a maximum of 194,000 — 25 percent — could be affected. It flags the 194,000 as "an extreme upper bound estimate" on precisely that one-driver-per-carrier assumption, and elsewhere says these drivers exit "over the course of the next five years."
| Drivers | ||
|---|---|---|
| Current non-domiciled CDL holders exiting | 194,000 | ██████████ |
| New non-domiciled CDLs issued per year | 6,000 | ▌ |
| — of which FMCSA assumes agricultural (H-2A) | 5,000 |
Source: Federal Register doc. 2026-02965, Feb 13, 2026. Bar scaling is this publication's.
The replacement rate is the point. Annual new issuance runs at about 3.1% of the departing population, and the agricultural share of that replacement — the carve-out agriculture won — is about 2.6% of the drivers leaving. A commenter's figure, cited in the rule, puts non-domiciled drivers at 3.5 to 4 percent of all CDL holders; against 194,000 that implies a national CDL population near 5.2 million, which is the right order and gives the 194,000 a sanity check it otherwise lacks.
There is also an unresolved tension in the timing, and it is worth holding rather than smoothing over. FMCSA describes the exit as occurring over five years. But the rule caps every non-domiciled credential at the I-94 date or one year, whichever is sooner, and requires in-person renewal — which means the great majority of the 194,000 face a renewal decision within roughly twelve months of March 16, 2026. The rule does not reconcile the one-year credential life with the five-year exit path, and this publication cannot either. What can be said is that the phase-out is governed by renewal dates rather than by a schedule, and renewal dates are not distributed to suit a harvest.
Ground Truth: Agriculture negotiated the right exemption for the wrong vehicle. H-2A eligibility protects the driver hauling a grower's own grain on the grower's own truck — a real but small slice of the movement. Corn to the elevator, beans to the river, fertilizer from the terminal to the retailer and anhydrous to the field all move predominantly on for-hire equipment, and the for-hire market is where the 194,000 sat. A farm's trucking exposure is a purchased service, and the carve-out did not touch the price of that service. Expect the rule to show up not as an inability to find a driver, but as a rate.
3. What FMCSA says the rule costs
What's new: The rule quantifies its ten-year cost at approximately $9.5 million discounted at three percent and $8.1 million at seven percent, with annualized impacts of $1.36 million and $1.16 million respectively, in 2024 dollars.
Evidence: The largest identifiable line inside that total is administrative: FMCSA estimates the SAVE-query and documentation burden across all affected state licensing agencies at approximately $93,075 per year — 6,000 applicants × a $62.05 personnel wage rate × 15 minutes each.
| Item | Value |
|---|---|
| Quantified 10-year cost, 3% discount | $9,523,927 |
| Quantified 10-year cost, 7% discount | $8,121,638 |
| Quantified annualized cost, 3% | $1,355,993 |
| Quantified annualized cost, 7% | $1,156,339 |
| State agency SAVE-query burden, per year | $93,075 |
| Drivers stated to exit the freight market | 194,000 |
Source: Federal Register doc. 2026-02965, Table 5 "Quantified Costs and Transfers" and the SDLA cost discussion, Feb 13, 2026.
$6.99
The rule's quantified annualized cost divided by the number of drivers it states will leave the freight market — $1,355,993 ÷ 194,000. (Crop Root Zone arithmetic on Federal Register doc. 2026-02965)
That figure is not an accusation of error; it is a description of scope. FMCSA's quantified total counts compliance paperwork and treats the drivers' foregone work largely as transfers rather than social cost, and it argues explicitly that the capacity is replaceable: there are, in the rule's words, "experienced drivers that have been sidelined or working at a reduced capacity during the ongoing freight recession who are ready and willing to come back into the market or increase their workload." That is a defensible position in a soft freight market. It is also an unpriced one — the rule does not quantify how much of the 194,000 gets backfilled, at what wage, or on what timetable, which means the federal record contains no estimate of the freight-rate effect at all.
For scale on what is missing rather than as a forecast: 194,000 drivers working a nominal 2,000 hours at a wage in the mid-$20s per hour represents something on the order of $9–10 billion of annual driver labour. (Illustrative only — hours and wage are this publication's assumptions, and the true net cost is far smaller than the gross to the extent FMCSA's backfill argument holds. The point is the range between $1.4 million and the gross, not either endpoint.)
4. Where a grain farm actually meets this
What's new: The comment record contains the agricultural argument, and FMCSA reproduced it. Accion Opportunity Fund submitted that driver shortages "will harm agriculture and harvest logistics due to short harvest windows for crops and ports and drayage," predicting capacity loss, longer dwell times, higher demurrage and price increases, and estimated $250 million in small-business working capital tied to current non-domiciled truckers would be in jeopardy.
Evidence: The mechanism worth understanding is that harvest trucking demand is inelastic in time in a way almost no other freight is. A soybean field is ready in a window measured in days; a truck that arrives in November is not a substitute for a truck that arrives in October. Every fall the same equipment is bid for by grain moving out and by fall fertilizer moving in — the anhydrous, MAP and potash that go on after harvest. When capacity tightens, the two demands compete against each other on the same lanes.
- Grain out. The elevator's bid is a delivered price net of freight. A higher truck rate lands as weaker basis rather than as a visible line item, which is why this kind of cost is routinely mistaken for a market move.
- Fertilizer in. Fall-applied nutrients arrive by truck for the last leg regardless of how they reached the terminal. Retail delivered prices absorb the rate.
- The overlap is the exposure. Both flows peak in the same six weeks, and the rule's renewal-driven attrition builds through the same period.
Ground Truth: The practical planning consequence is not to expect a shortage — it is to stop treating fall freight as a spot purchase. A grower who books harvest trucking in August at a known rate has converted an unpriced regulatory risk into a fixed cost, and the rule's own text is the argument for doing so: the federal government has stated that a quarter of the carrier base may be affected and has published no estimate whatsoever of what that does to rates. When the party imposing a change declines to price it, the party absorbing it should not assume the price is zero.
5. What to watch, and what would falsify this
What's new: Three observable series will settle this well before anyone publishes a study.
Evidence:
- Truck rates in the USDA AMS Grain Transportation Report. The weekly GTR carries diesel and secondary rail-car market data alongside barge and truck commentary; a rate move concentrated in truck while barge and rail are stable is the signature to look for, because barge and rail are not exposed to this rule.
- Basis at the local elevator versus the river terminal. Trucking cost shows up in the spread between them. A widening interior-to-river basis in October, in a year with adequate water, points at the truck rather than the barge.
- Whether the exit actually front-loads. If the one-year credential cap dominates, attrition concentrates in the twelve months from March 2026. If FMCSA's five-year characterization proves right, this fall sees very little.
The honest falsification test is the third one plus FMCSA's backfill claim. If sidelined domestic drivers do return at the rate the rule assumes, harvest 2026 will pass without a visible freight effect and this piece will have overweighted a phase-out that spread itself thin. The reason to take the position anyway is asymmetry: booking freight early costs a small premium if nothing happens, and the alternative is being a price-taker in a six-week window with a crop on the ground. USDA's August estimates put production near the second-largest corn crop on record; there will be a great deal to move either way.
References
- Federal Register, doc. 2026-02965 — "Restoring Integrity to the Issuance of Non-Domiciled Commercial Drivers Licenses (CDL)," final rule, published Feb 13, 2026, effective Mar 16, 2026. Full text downloaded and parsed locally on Aug 17, 2026 (federalregister.gov and fmcsa.dot.gov both returned HTTP 403 to the automated fetcher; the full-text file at federalregister.gov/documents/full_text/text/2026/02/13/2026-02965.txt returned HTTP 200 and was parsed). Source of: eligibility categories; 8,010 comments; 17 fatal crashes / 30 fatalities in 2025; ~6,000 annual issuances; H-2B 500–600 and E-2 ≤300; the one-third H-2A assumption on ~15,000 BLS agricultural drivers; 27,240 H-2A visas in 2023; 194,000 exiting holders; 785,000 motor carriers and the 25% upper bound; Table 5 cost figures; the $93,075 SDLA burden; the sidelined-driver backfill argument; and the Accion Opportunity Fund comment including the $250 million working-capital estimate.
- U.S. Bureau of Labor Statistics — employment by industry and occupation, agricultural heavy and tractor-trailer truck drivers, 2024 (~15,000), as cited in reference 1.
- Office of Homeland Security Statistics — Yearbook of Immigration Statistics 2023, Table 25, H-2A visas issued, as cited in reference 1.
- USDA — August 2026 crop production estimates, second-largest corn crop on record, as relayed by Trading Economics commodity commentary, accessed Aug 17, 2026. https://tradingeconomics.com/commodity/corn
Disclosures
Crop Root Zone is an independent publication. Nothing here is investment advice. Market calls, where included, reflect the editors' own read and are not a recommendation to buy or sell any security.
The Waiver That Moved 150,000 Tonnes of Ammonia Just Became a Case-by-Case Decision
The Jones Act waiver was extended 90 days on August 10 and simultaneously narrowed: from a blanket exemption to voyage-by-voyage review by the Pentagon and the Maritime Administration. The fertilizer volume it has carried since March would supply nitrogen to about 1.5 million corn acres.
On August 10 the White House extended the waiver of Section 27 of the Merchant Marine Act of 1920 — the Jones Act — for another 90 days, taking it to roughly mid-November. The waiver lets foreign-flagged vessels carry cargo between U.S. ports, and it covers energy and fertilizer products. It was first implemented in March and extended once in April. The new extension takes effect August 17, immediately after the prior one expires.
What matters is not the extension. It is the sentence attached to it. Going forward the exemption is no longer blanket: individual voyages will be considered case by case, against criteria including whether a Jones Act-eligible ship is actually available, with the Pentagon consulting the Maritime Administration on which voyages qualify.
1. What has actually moved under it
What's new: The Maritime Administration has a count, and USDA published it this week.
Evidence: Based on reports submitted to MARAD as of August 12, 217 voyages have used the waiver, carrying crude oil, gasoline, renewable fuels and diesel. On the fertilizer side specifically, the waiver has been used to move nearly 150,000 metric tons of anhydrous ammonia, along with shipments of urea liquid fertilizer and monoammonium phosphate (USDA AMS, Grain Transportation Report, Aug 13, 2026).
Put the ammonia figure into acres, which is the only unit that makes it legible:
| Step | Value | Basis |
|---|---|---|
| Anhydrous moved under waiver | 150,000 | metric tonnes |
| Nitrogen content | 82% | anhydrous ammonia, NH₃ |
| Nitrogen equivalent | 123,000 | tonnes N |
| Nitrogen equivalent | 271.2 | million lb N |
| At a 180 lb N/acre corn program | ~1.51 | million acres |
| Share of 2026 planted corn acres | 1.6% | of 96.73 million |
Source: USDA AMS Grain Transportation Report, Aug 13, 2026 (tonnage); USDA NASS, Aug 12, 2026 (planted acres). Conversion to acres is this publication's arithmetic and assumes a 180 lb N per acre program with anhydrous as the sole source — an illustrative rate, not a survey figure.
~1.5 million acres
Corn acreage that could be fertilized with the anhydrous ammonia carried under the Jones Act waiver since March, at 180 lb N per acre. (This publication's calculation from USDA AMS Grain Transportation Report, Aug 13, 2026.)
That is 1.6 percent of the national corn crop, which is the right way to hold this: the waiver is not load-bearing for U.S. nitrogen supply. It is load-bearing for particular moves.
2. Why a small tonnage sits on a sensitive part of the system
What's new: Coastwise vessel moves are not a substitute for the main arteries. They are what runs when the main arteries do not reach.
Evidence: Roughly 60 percent of U.S. ammonia moves by a single pipeline, owned and operated by Sunoco LP, serving a broad swath of the Corn Belt (The Fertilizer Institute, via USDA AMS, Aug 13, 2026). USDA this week added a dataset of anhydrous ammonia pipeline tariff rates to its AgTransport platform, covering five origins — three in Louisiana, one in Arkansas, one in Iowa — and 25 destinations, most of them in the Corn Belt.
Read those two facts together and the geography of the exposure falls out. The pipeline network originates on the Gulf and terminates in the Corn Belt. Anything that needs to move between coasts, or to a terminal the pipeline does not reach, moves by water or not at all. A blanket waiver made that routine. A case-by-case review makes it a filing.
| Movement | Primary mode | Substitute if unavailable |
|---|---|---|
| Gulf plant → Corn Belt terminal | Ammonia pipeline (~60% of U.S. volume) | Rail, barge |
| Gulf import → Gulf/river terminal | Barge | Rail, truck |
| U.S. port → U.S. port, coastwise | Jones Act vessel, or waived foreign flag | Limited |
Source: USDA AMS Grain Transportation Report, Aug 13, 2026; The Fertilizer Institute as cited therein. Substitute column is this publication's assessment, not a USDA finding.
The three pipeline origins USDA chose to feature on its new dashboard happen to describe three different supply routes, and only one of them is domestic-molecule-to-domestic-pipe:
| Origin | What it is | Where the molecule comes from |
|---|---|---|
| Donaldsonville, LA | The largest nitrogen-producing plant in the world | Domestic production |
| Taft, LA | A deepwater import facility | Imported by vessel |
| Garner, IA | A facility receiving ammonia by rail | Rail, from Canada |
Source: USDA AMS Grain Transportation Report, Aug 13, 2026, describing the new AgTransport anhydrous ammonia pipeline tariff dataset (five origins — three in Louisiana, one in Arkansas, one in Iowa — and 25 destinations).
That middle row is the one this week's policy change touches. A deepwater import terminal is fed by ships; whether those ships can also move product between U.S. ports is precisely what the waiver governs. The pipeline itself is unaffected by any of this — but two of the three featured entry points into it depend on something crossing water or a border before the pipe ever sees it.
Ground Truth: The change from a blanket waiver to voyage-by-voyage review does not reduce the tonnage that can move. It converts a certainty into a lead-time. For a retailer or terminal operator positioning fall ammonia, the practical consequence is that a coastwise cargo now carries an administrative review whose duration nobody has quoted yet — and the criterion is availability of a U.S.-flag ship, which is exactly the variable the requester cannot control or predict. If any part of your fall positioning plan assumes a coastwise vessel, the question to put to your supplier this week is not whether the waiver exists. It does, through mid-November. The question is what happens to the schedule if a single voyage is denied, and who holds that risk in your contract.
3. The rest of the freight stack, in the same week
What's new: The waiver news landed in a week when the surrounding freight numbers were mixed rather than tight — which is the reason this is a planning item and not an emergency.
Evidence: From the same report, all for the weeks noted:
| Indicator | Value | Change |
|---|---|---|
| U.S. average diesel, wk ending Aug 10 | $5.257/gal | −9.1¢ w/w; +150.3¢ YoY |
| Barged grain, wk ending Aug 8 | 716,850 tons | −11% w/w; −16% YoY |
| Barges unloaded, New Orleans region | 724 | +21% w/w |
| Barges moved down river | 460 | −67 w/w |
| Class I grain carloads, wk ending Aug 1 | 27,840 | +1% w/w; +5% YoY; +30% vs 3-yr avg |
| Shuttle secondary railcar bids | +$83/car over tariff | +$6 w/w; +$217 YoY |
| Non-shuttle secondary railcar bids | +$44/car over tariff | −$67 w/w; −$31 YoY |
| Gulf → Japan ocean freight, Aug 6 | $71.50/mt | +3% w/w |
| PNW → Japan ocean freight, Aug 6 | $36.75/mt | +1% w/w |
Source: USDA AMS Grain Transportation Report, Aug 13, 2026.
| Freight line, year-on-year direction | ||
|---|---|---|
| Diesel, ¢/gal above year-ago | 150.3 | ██████████ |
| Shuttle secondary, $/car above year-ago | 217 | ██████████ |
| Barged grain volume, % below year-ago | 16 | █ |
Source: USDA AMS Grain Transportation Report, Aug 13, 2026. Scaled independently per row; the bars compare each line to its own year-ago level, not to each other.
Two of those lines deserve a second look. Rail carloads at 30 percent above the three-year average, with shuttle secondary values $217 per car above year-ago, is a rail market being bid hard well before harvest. And barge volumes 16 percent below year-ago with New Orleans unloads up 21 percent on the week is the signature of a river system clearing a backlog rather than running at capacity.
4. Two other items in the same report that belong in a fall file
What's new: Neither is about fertilizer, and both affect the same weeks.
Evidence:
- Chicago switching congestion. On August 3 the Surface Transportation Board wrote to the Belt Railway of Chicago seeking an explanation for service metrics it called concerning: weekly railcar inventory at BRC's clearing yard up 57 percent and dwell time up 72 percent against last year. BRC replied on August 10 attributing the deterioration to record traffic, up 8.4 percent year to date, plus weather, crew shortages, a highway-rail accident and multiple derailments, and listed train-length limits and inbound restrictions among its remedies. Chicago is where a great many Corn Belt-bound cars change hands.
- Nebraska hours-of-service waiver, sixth extension. FMCSA extended Nebraska's emergency hours-of-service waiver through September 11 to speed feed hauling, after wildfires burned more than a million acres in a state already in severe drought. Permit fees are waived alongside it. That is a trucking-capacity signal in a state that is simultaneously the country's third-largest corn producer.
Source: USDA AMS Grain Transportation Report, Aug 13, 2026.
What to watch: whether MARAD publishes any guidance on review turnaround for case-by-case voyage requests, and whether the 217-voyage count keeps climbing at its March-to-August pace after August 17. The count is the cleanest available measure of whether the narrowing is procedural or restrictive, and it does not require anyone to speculate.
References
- USDA Agricultural Marketing Service — Grain Transportation Report, Aug 13, 2026 (weekly highlights; snapshots by sector). https://www.ams.usda.gov/sites/default/files/media/GTR08132026.pdf
- Associated Press / The Washington Post — "Trump extends Jones Act waiver 90 days for foreign ships moving energy, fertilizers," Aug 10, 2026. https://www.washingtonpost.com/business/2026/08/10/trump-jones-act-foreign-ships-waiver/4b8e063a-94ea-11f1-9ef9-1be722184483_story.html
- USDA Agricultural Marketing Service — AgTransport, anhydrous ammonia pipeline tariff rate dataset and Fertilizer Transportation Dashboard. https://www.ams.usda.gov/services/transportation-analysis
- USDA National Agricultural Statistics Service — August Crop Production, Agricultural Statistics Board briefing, Aug 12, 2026 (planted corn acres). https://www.nass.usda.gov/Newsroom/Executive_Briefings/2026/08-12-2026.pdf
- Cato Institute — Jones Act Waiver Tracker (waiver history reference). https://www.cato.org/jones-act-waiver-tracker
Disclosures
Crop Root Zone is an independent publication. Nothing here is investment advice. Market calls, where included, reflect the editors' own read and are not a recommendation to buy or sell any security.
Propane Is 9% Cheaper Than Last Year and Midwest Tanks Are Filling. The Constraint Is the Calendar, Not the Price.
A 16.0-billion-bushel corn crop concentrates its drying demand into three or four weeks — and a stock is not a delivery rate. The contracting window closes before the dryer runs.
The U.S. Energy Information Administration's weekly series put Mont Belvieu propane spot at $0.655 per gallon for the week ending August 7, 2026, against $0.718 for the comparable week a year earlier — about 8.8% lower. Over the same stretch, propane and propylene stocks in the Midwest refining district (PADD 2) climbed from 22.07 million barrels on July 3 to 25.01 million on August 7, a 13.3% build in five weeks. Meanwhile USDA's August 12 WASDE put the 2026 corn crop at 16.0 billion bushels, the second largest on record. Cheap fuel, rising inventories, and a very large crop is a benign-looking combination. It is also the exact combination in which grain-drying propane has historically gone wrong, because the variable that binds is not how much propane exists in August but how fast it can reach a farm tank in October.
1. Where the price and the inventory actually sit
| Series | Latest | Week ending | Year-ago comparison |
|---|---|---|---|
| Mont Belvieu propane spot | $0.655/gal | Aug 7, 2026 | $0.718/gal (Aug 1, 2025), −8.8% |
| PADD 2 propane/propylene stocks | 25,006 kbbl | Aug 7, 2026 | — |
Source: U.S. Energy Information Administration, Weekly Petroleum Status Report series, accessed Aug 13, 2026.
The Midwest build is steady rather than dramatic, and it is the shape that matters as much as the level:
| Week ending | PADD 2 propane stocks (kbbl) | ||
|---|---|---|---|
| Jul 3, 2026 | 22,067 | ████████ |
|
| Jul 10, 2026 | 22,934 | █████████ |
|
| Jul 17, 2026 | 23,518 | █████████ |
|
| Jul 24, 2026 | 24,026 | ██████████ |
|
| Jul 31, 2026 | 24,633 | ██████████ |
|
| Aug 7, 2026 | 25,006 | ██████████ |
+13.3% vs. Jul 3 |
Source: U.S. Energy Information Administration, weekly PADD 2 propane and propylene stocks, accessed Aug 13, 2026.
That is the normal summer injection pattern — the Midwest builds through the summer to carry grain drying and then the heating season. Five straight weekly builds into a market trading below last year is, in isolation, a comfortable position.
2. What drying actually consumes
The engineering is well established and it makes the exposure quantifiable. High-temperature drying removes about 0.72 pounds of water per point of moisture per bushel; a high-temperature dryer needs roughly 2,500 Btu to evaporate a pound of water; propane carries about 91,500 Btu per gallon. That chain produces the coefficient extension budgets have used for decades: about 0.02 gallons of propane per point of moisture per bushel for a moderately efficient dryer.
Measured performance on working farms runs slightly better and varies widely. Iowa State's grain-drying research puts high-temperature bin drying at roughly 0.019 gal/point/bushel, with observed values spanning 0.015 to 0.022. Other extension guidance cites an average near 0.018 with a wider range of 0.010 to 0.025 across system types.
| Basis | gal/point/bushel | Source type |
|---|---|---|
| Textbook coefficient, moderately efficient dryer | 0.020 | Extension budgeting standard |
| Iowa farms, high-temperature bin drying (measured) | 0.019 | Measured research average |
| Measured range, high-temperature bin drying | 0.015 – 0.022 | Measured research range |
| Broader range across system types | 0.010 – 0.025 | Extension guidance |
Sources: Iowa State University Extension, Ag Decision Maker A2-31, "Estimating the Cost for Drying Corn"; Iowa State University Extension grain-drying research; University of Minnesota Extension, "Energy costs for corn drying and cooling"; North Dakota State University Extension drying guidance.
Applied to a real field decision, at the 0.02 coefficient:
| Points removed | gal/bu | At $1.69/gal* | Per acre at 180.7 bu |
|---|---|---|---|
| 3 points (20% → 17%) | 0.060 | $0.101/bu | $18.3 |
| 5 points (20% → 15%) | 0.100 | $0.169/bu | $30.5 |
| 8 points (23% → 15%) | 0.160 | $0.270/bu | $48.9 |
| 10 points (25% → 15%) | 0.200 | $0.338/bu | $61.1 |
*The $1.69/gallon figure is a farm-delivered budgeting assumption drawn from published drying-cost examples, not a market print — farm-delivered propane is contracted individually and is not surveyed weekly in August. Yield of 180.7 bu/acre from USDA WASDE-674, Aug 12, 2026. Fuel only; excludes electricity for fans and handling, shrink, and dryer capital.
$30.50/acre
Fuel-only cost of removing five points of moisture from a 180.7 bu/acre corn crop, at 0.02 gal/point/bushel and $1.69/gallon farm-delivered. (Derived from Iowa State University Extension drying coefficients and USDA WASDE-674, Aug 12, 2026)
3. The spread between the hub and the tank is the whole story
Here is the number that does not appear in any of the coverage of cheap propane. Mont Belvieu spot is $0.655/gallon. The farm-delivered figure used in drying budgets is around $1.69/gallon. That is a difference of about $1.03 a gallon, or a 158% markup between the Gulf Coast fractionation hub and the tank behind the dryer.
| Point in the chain | $/gal | Share of farm-delivered | |
|---|---|---|---|
| Mont Belvieu spot, Aug 7 2026 | 0.655 | ████ |
39% |
| Everything else — pipeline, rail, terminal, local truck, margin | ~1.035 | ██████ |
61% |
| Farm-delivered budgeting assumption | ~1.690 | ██████████ |
100% |
Sources: Mont Belvieu spot from EIA weekly series, week ending Aug 7, 2026; farm-delivered figure is a published budgeting assumption as noted above, not a survey print. The residual row is derived by subtraction and is illustrative of the delivered-cost stack, not a measured margin.
Ground Truth: Roughly six of every ten cents a grower pays for drying propane is logistics and local margin, not molecule. That is why an 8.8% move at the hub is not an 8.8% move at the farm — it lands on the 39% of the delivered price that is the commodity, so it reads as roughly a 3.4% decline at the tank. In absolute terms the year-on-year hub move is about 6 cents a gallon, worth roughly $1.14 an acre on a five-point dry at 180.7 bu/acre. The cheap-propane headline is true and nearly irrelevant at that scale. The contract terms are what move the number.
4. Why the risk is simultaneity, not supply
Twenty-five million barrels in the Midwest is a large number. It is also a stock, and drying demand is a flow — and the two failure modes are completely different.
Grain drying is the most concentrated demand event in the propane calendar. It arrives with harvest, it is regional, and it does not spread out: when a wet crop comes off across the Corn Belt in the same three or four weeks, dryers across several states run continuously and the draw lands on truck fleets and terminal loading racks, not on the aggregate inventory number. The historical propane squeezes in the Midwest have been delivery-rate events during compressed, wet harvests — not situations where the region ran out of propane in total.
Three factors this year point at a compressed, high-demand window rather than a relaxed one:
- Crop size. 16.0 billion bushels is the second-largest corn crop on record (USDA WASDE-674, Aug 12, 2026). More bushels through the same dryers is more gallons through the same trucks.
- A wet season. Reporting on the 2026 grain-drying outlook has pointed to a markedly wetter tone across the Midwest and Delta, with early-season precipitation running well above normal in a broad band — the setup that raises harvest moisture and therefore points removed per bushel.
- Harvest timing. USDA has expected recent corn harvests to run slightly later than the 2020–24 average, which pushes drying into cooler, damper conditions where natural field drydown does less of the work.
None of these is a forecast that propane will be short. Together they describe a demand profile that is larger and more concentrated than normal, drawn against a delivery system whose capacity is fixed.
| What is comfortable | What is not measured by it |
|---|---|
| PADD 2 stocks at 25.0 mn bbl, five straight builds | Truck and rack loading capacity during a 3–4 week peak |
| Mont Belvieu 8.8% below last year | Farm-delivered contract terms, which are 61% of the price |
| Summer injection season proceeding normally | Whether the crop comes off wet and all at once |
Source: EIA weekly PADD 2 stocks and Mont Belvieu spot, accessed Aug 13, 2026; USDA WASDE-674, Aug 12, 2026.
5. The decision, and when it expires
The practical consequence is that the propane decision is being made now, in August, and settled long before the first load of wet corn reaches the pit. Pre-buy and cap-price contracts written in the May-to-August window have routinely carried a meaningful discount to winter spot rates — published guidance puts the typical saving in the range of $0.30 to $0.60 a gallon, which on a five-point dry across 1,000 acres of 180.7-bushel corn is worth roughly $5,400 to $10,800.
| Contracting decision, 1,000 acres, 5-point dry | Gallons | Value of $0.30/gal | Value of $0.60/gal |
|---|---|---|---|
| 180,700 bu × 0.100 gal/bu | 18,070 | $5,421 | $10,842 |
Derived from the 0.02 gal/point/bushel coefficient and a 180.7 bu/acre yield (USDA WASDE-674, Aug 12, 2026). The $0.30–0.60/gallon pre-buy range is published general guidance on summer contracting versus winter spot, not a quoted 2026 offer — actual terms are negotiated locally and vary by supplier, volume and contract form.
Ground Truth: The asymmetry here is what should drive the decision, not the price forecast. If propane stays cheap and the harvest is dry, a contracted grower gives up a modest amount of upside — a few cents a gallon on a fraction of the crop. If the harvest is wet and late on a 16-billion-bushel crop, an uncontracted grower is bidding for truck capacity in the same week as every neighbour, and the binding constraint becomes whether the delivery arrives before the bin spoils, at which point the per-gallon price stops being the relevant number entirely. Contract the gallons for the moisture you expect to remove in a normal year, and treat anything above that as the weather bet it is. The one thing not worth doing is reading the EIA stock number as a reason to do nothing — inventories say the propane exists, and say nothing at all about whether it can reach you in October.
Two operational notes follow from the same logic. First, the coefficient range is wide enough to be worth knowing your own: a dryer at 0.015 gal/point/bushel uses 25% less fuel than one at 0.020, which on the 1,000-acre example above is about 4,500 gallons a season. Second, points removed is the term with the most leverage in the whole calculation — it is linear in the arithmetic, so a two-point difference in harvest moisture changes the fuel bill by 40% on a five-point dry, more than any plausible move in the price of propane.
References
- U.S. Energy Information Administration — Mont Belvieu, TX propane spot price FOB, weekly series; $0.655/gal week ending Aug 7, 2026, $0.718/gal week ending Aug 1, 2025. Accessed Aug 13, 2026. https://www.eia.gov/dnav/pet/
- U.S. Energy Information Administration — Weekly Midwest (PADD 2) propane and propylene stocks; 25,006 thousand barrels week ending Aug 7, 2026. Accessed Aug 13, 2026. https://www.eia.gov/dnav/pet/
- USDA World Agricultural Outlook Board — World Agricultural Supply and Demand Estimates, WASDE-674, Aug 12, 2026; corn production 16.0 bn bu, yield 180.7 bu/acre. https://www.usda.gov/oce/commodity/wasde/
- Iowa State University Extension and Outreach — Estimating the Cost for Drying Corn, Ag Decision Maker File A2-31. https://www.extension.iastate.edu/agdm/crops/html/a2-31.html
- Iowa State University Extension and Outreach — grain drying research on measured high-temperature bin drying energy use (0.019 gal/point/bushel average, 0.015–0.022 range). https://www.extension.iastate.edu/news/grain-drying-research-guides-farmers-harvest-and-winter-storage-plans
- University of Minnesota Extension — Energy costs for corn drying and cooling. https://extension.umn.edu/corn-harvest/energy-costs-corn-drying-and-cooling
- North Dakota State University Extension — drying guidance, including the 0.72 lb water per point per bushel, 2,500 Btu/lb and 91,500 Btu/gallon basis for the 0.02 coefficient.
Crop Root Zone is an independent publication. Nothing here is investment advice. Market calls, where included, reflect the editors' own read and are not a recommendation to buy or sell any security.
Two Pipelines Built in 1971 Decide Whether Your Retailer Can Sell Anhydrous at All
One system moves 1.5 million tons a year across seven states and is the only one that can take imported ammonia; the other runs domestic-only from Oklahoma to Minnesota. USDA's own regional reports quote an anhydrous price in the states the pipes reach — and no anhydrous line at all in the states they don't.
The anhydrous ammonia a Corn Belt retailer sells this fall almost certainly arrived through one of two pipelines, both completed around 1971, both single-purpose, and both now owned by companies whose main business is something else. The larger — operated by Sunoco LP, which acquired NuStar Energy in a $7.3 billion deal in 2024 — connects seven Midwestern states over roughly 2,100 kilometres of mainline plus 650 kilometres of lateral, about 1,700 miles in total, and moves approximately 1.5 million tons of ammonia a year. The other, the former Magellan Midstream system now inside ONEOK after its $18.8 billion acquisition, runs about 1,100 miles from Oklahoma and Texas to Minnesota. They run roughly parallel, about 100 miles apart, with delivery terminals in direct competition. Between them they define where in America it is physically possible to buy a ton of anhydrous.
1. Two systems, and only one of them can be backfilled by imports
What's new: The two pipelines are not substitutes. They have structurally different supply sets, and only one of them can draw on the world market.
Evidence: The Sunoco/NuStar system is the only U.S. ammonia pipeline with the connectivity to receive product from outside the United States directly into the system. The ONEOK/Magellan system originates at domestic production in Oklahoma and Texas and is restricted to domestically produced anhydrous ammonia.
| Sunoco LP (former NuStar) | ONEOK (former Magellan) | |
|---|---|---|
| Route | Gulf Coast into seven Midwest states | Oklahoma / Texas to Minnesota |
| Length | ~2,100 km mainline + ~650 km lateral (~1,700 mi) | ~1,100 miles |
| Throughput | ~1.5 million tons/year | not separately published |
| Supply set | Domestic plus waterborne imports | Domestic production only |
| In service since | 1971 | Mid-Continent legacy system |
| Current parent's core business | Fuel distribution | Natural gas liquids |
Sources: Sunoco LP / NuStar Energy system disclosures and public awareness materials; ONEOK–Magellan Midstream acquisition (2023, $18.8 billion); Sunoco–NuStar acquisition (2024, $7.3 billion); U.S. Department of State pipeline description of the 1,100-mile Magellan ammonia system.
1.5 million tons
Annual ammonia throughput on the larger of the two U.S. ammonia pipeline systems — the only one able to take imported tons. (Sunoco LP / NuStar Energy system disclosures)
Ground Truth: This is a supply-security difference dressed up as a freight difference, and it only shows itself in a bad year. A retailer on the import-connected system can be backfilled from the world market when a domestic plant goes down. A retailer on the domestic-only system cannot — its supply is exactly as reliable as Mid-Continent production. In a normal fall those two look identical on an invoice. In an outage year they are different businesses, and the time to ask your supplier which pipe it sits on is now, not in October.
2. The federal price reports draw the same map
What's new: USDA's regional production cost reports quote an anhydrous ammonia distributor price in the states the pipelines reach — and carry no anhydrous line at all in the states they don't. The pipeline map is legible in the price data.
Evidence: Five USDA AMS regional Production Cost Reports, all covering late July or early August 2026:
| Report | Region | Anhydrous ammonia line? | Ask average |
|---|---|---|---|
| AMS 3195 | Illinois | Yes | $915.50 |
| AMS 2863 | Iowa | Yes | $1,005.80 |
| AMS 3621 | Oklahoma | Yes | $875.00 |
| AMS 3051 | Alabama | No — liquid N 28-0-0 only, delivered and applied | — |
| AMS 3657 | Pacific Northwest | No — liquid N 32-0-0 and urea only | — |
Sources: USDA AMS Livestock, Poultry & Grain Market News, Production Cost Reports 3195, 2863, 3621, 3051 and 3657, weeks ending Jul 24 to Aug 7, 2026.
The three regions that report an anhydrous price sit on or adjacent to the two pipeline corridors. The two that do not are off-system: Alabama's nitrogen market is quoted as 28-0-0 delivered and applied, and the Pacific Northwest's as 32-0-0 and urea. Those are precisely the products a market uses when the cheapest form of nitrogen is not physically available to it.
We would not push this further than the evidence carries. USDA reports what its surveyed distributors actually trade, and a missing line means the product is not a reported staple in that channel rather than that no ton has ever moved. But the correlation runs the right way, and it is a rare case where a piece of infrastructure geography can be read directly off a free price report.
Ground Truth: The most common explanation a grower is given for a regional nitrogen price gap is freight. Freight is the smaller part. The larger part is whether the cheapest nitrogen product is on the menu at all — and that is a pipeline question with a fifty-year-old answer. A grower in Alabama paying $600/ton for applied 28-0-0 is not paying a freight premium on anhydrous; they are paying for a different product because the anhydrous market does not reach them.
3. The constraint is terminal storage, not line capacity
What's new: Direct-application ammonia demand is compressed into a few weeks twice a year. A pipeline sized for that peak would be idle most of the year, so it isn't — which means the binding asset is storage at the delivery end.
Evidence: Pipeline operators describe the ammonia business as exposed to direct-application demand and weather, which is the polite formulation of a system whose entire annual purpose arrives in a fall window that can open late, close early, or be rained out. A line moving 1.5 million tons across 12 months carries roughly 125,000 tons a month on a flat basis — but fall application does not want a flat basis, it wants several hundred thousand tons inside about six weeks.
The gap between those two profiles has to be held somewhere, and it is held in tankage at delivery terminals and at retail. This is why the practical failure mode in a compressed fall is never "the pipeline is full." It is a retailer whose nurse tanks and plant storage are empty on the two good days between rains, with tons that are technically available two hundred miles upstream.
Crop Root Zone estimate — the scale of the non-pipeline market: U.S. corn area is roughly 90 million acres; if on the order of 45% of it receives anhydrous at about 150 lb N/acre, direct-application demand is approximately 3.7 million tons of ammonia a year. Against ~1.5 million tons of pipeline throughput, that leaves the majority of the market moving by rail, barge and truck.
| How the estimated direct-application market moves | Approx. tons/yr | |
|---|---|---|
| Pipeline (larger system, published) | ~1,500,000 | ████ |
| Everything else — rail, barge, truck | ~2,200,000 * | ██████ |
Pipeline figure is published throughput; the remainder marked * is a Crop Root Zone estimate derived from the acreage and rate assumptions stated above and should be read as an order of magnitude, not a survey.
Ground Truth: Ask your retailer the storage question, not the supply question. "Can you get it?" is nearly always yes. "How many tons can you hold on the pad when the field is fit?" is the number that determines whether you get covered in a short fall — and it is the one that has been quietly shrinking as retail consolidation closed small plants and concentrated tankage at fewer, larger sites. A grower forty miles from the surviving plant has a longer nurse-tank round trip than they had a decade ago, and that round trip is the real capacity constraint on the two days the ground is right.
4. The ownership question nobody underwrites
What's new: Neither pipeline is now owned by a fertilizer company. One sits inside a fuel distributor, the other inside a natural gas liquids business.
Evidence: Sunoco's acquisition of NuStar brought roughly 9,500 miles of pipeline and 63 terminal and storage facilities covering crude, refined products, renewable fuels, ammonia and specialty liquids. Ammonia is a line item in that portfolio, not the portfolio. The same is true of the former Magellan system inside ONEOK.
That is not an allegation of neglect — both systems are operating and moving tons. It is an observation about how capital gets allocated. A 55-year-old single-purpose ammonia line competes for maintenance and expansion capital against fuel assets with different return profiles and a different customer base, inside companies whose investors do not hold the stock for its fall fertilizer season.
Ground Truth: The risk here is not a sudden shutdown; it is the slow version. Deferred capital on a single-purpose asset shows up as more unplanned outages, longer ones, and less appetite to add terminal storage in a market that is not growing. If a grower wants one thing to watch that is genuinely predictive of fall ammonia availability three to five years out, it is not the nitrogen price — it is whether either owner announces capital spending on ammonia terminal capacity. Neither has an obvious commercial reason to, and that is the point.
5. Run the window arithmetic and the mismatch is obvious
What's new: The gap between what a pipeline delivers per month and what a fall season demands per week is not a small mismatch to be smoothed. It is roughly an order of magnitude, and it is the whole reason the system is built around storage.
Evidence: Take the published throughput at face value. 1.5 million tons a year across twelve months is about 125,000 tons a month, or roughly 29,000 tons a week, on a perfectly flat basis.
Now set that against the demand profile. Fall anhydrous application in the northern Corn Belt conventionally waits for soil temperatures at four inches to fall below 50°F and to be trending down — the threshold at which nitrification slows enough that the nitrogen is still there in spring. In practice that opens a window of a few weeks between the first sustained cold and frozen or saturated ground, and rain removes days from it without warning.
| Tons | ||
|---|---|---|
| Pipeline delivery, flat weekly basis | ~29,000 | █ |
| Estimated direct-application demand, spread across 6 fall weeks * | ~300,000 | ██████████ |
Pipeline figure derives from published annual throughput. * The demand figure is a Crop Root Zone estimate: roughly half of the ~3.7 million ton annual direct-application market estimated in section 3, applied across an assumed six-week fall window. It is an order-of-magnitude illustration, not a survey, and the true window varies by year and latitude.
The ratio is roughly ten to one. No pipeline is sized for that, and none should be — a line built to serve the peak would sit idle forty-six weeks a year and nobody would finance it. The system resolves the mismatch by filling terminal and retail storage through the summer against a demand that arrives all at once.
Ground Truth: This is why a compressed fall is a logistics failure rather than a supply failure, and why the two get confused every time it happens. The tons exist; they were pumped in July. Whether they are within nurse-tank range of your field on the four days the ground is fit is a question about pad storage and truck turns, decided months earlier by a retailer's capital budget. A grower who wants insurance against a short window buys it in the form of a relationship and a delivery position before Labor Day, not with a price negotiation in October when the constraint has already bound.
References
- USDA AMS, Livestock, Poultry & Grain Market News — Production Cost Reports 3195 (Illinois), 2863 (Iowa), 3621 (Oklahoma), 3051 (Alabama) and 3657 (Pacific Northwest), weeks ending Jul 24–Aug 7, 2026. https://mymarketnews.ams.usda.gov/
- NuStar Pipeline Operating Partnership, Ammonia Pipeline public awareness operator profile — system description and import connectivity.
- Sunoco LP acquisition of NuStar Energy, announced January 2024, $7.3 billion — approximately 9,500 miles of pipeline and 63 terminal and storage facilities.
- ONEOK acquisition of Magellan Midstream Partners, 2023, $18.8 billion — includes the Mid-Continent ammonia pipeline system.
- U.S. Department of State, description of the 1,100-mile Magellan ammonia pipeline system.
- Ammonia Energy Association, "Ammonia pipelines: existing networks, future deployments, and safety considerations." https://ammoniaenergy.org/articles/ammonia-pipelines-existing-networks-future-deployments-and-safety-considerations/
Disclosures
Crop Root Zone is an independent publication. Nothing here is investment advice. Market calls, where included, reflect the editors' own read and are not a recommendation to buy or sell any security.
It Takes 19 Tonnes of Rock to Remove One Tonne of Carbon. The Rock Costs $18.50.
A January 2026 Minnesota trial applied basalt at 10 tons an acre and found no measurable weathering at all. The Illinois trial that did find carbon removal applied nine times as much. At that dose the quarry-gate rock bill alone is $352 per tonne of CO2 — more than a carbon buyer paid Terradot for the finished credit.
Two field trials, one conclusion each, and they point opposite ways. On January 13, 2026, Frontiers in Climate published a three-year Minnesota trial that spread crushed basalt on cropland at 10 tons per acre and could not detect that anything had happened: the basalt "generated small, but not significant, differences relative to untreated controls in all soils." Twenty-three months earlier, PNAS published a four-year Illinois trial that measured a genuine 10.5 tonnes of CO2 per hectare of carbon removal from the same class of rock, alongside 12–16% yield gains. The trials do not actually disagree. They differ by a factor of nine in how much rock went on the ground, and once that is converted into dollars per tonne of carbon, the entire commercial proposition of enhanced rock weathering on farmland runs into a number that has nothing to do with soil chemistry: the price of crushed stone.
1. The Minnesota trial found nothing, and said so plainly
What's new: The Frontiers in Climate paper (published January 13, 2026) reports a replicated three-year field trial at Carleton College in Northfield, Minnesota, running from 2021 to 2024 across a corn–soybean rotation — soybeans in 2022, corn in 2023, soybeans in 2024. Two amendments went on once, in November 2021: crushed basalt at 10 tons per acre, and steel slag at 2 tons per acre.
Evidence: The steel slag worked, in acidic soils. Porewater pH and alkalinity were "significantly elevated in acidic soils treated with steel slag relative to control," and soil pH and calcium saturation rose in the slag plots. The basalt did not. Across every soil in the trial the basalt produced differences from the untreated control that were small and statistically insignificant, which the authors attribute to coarse grain size and low reactivity. Neither amendment moved total soil organic matter, the mineral-associated or particulate organic matter pools, or soil CO2 flux.
That last point matters for anyone reading a carbon contract. The trial did not merely fail to find a large effect; it failed to find the effect in the plow layer, in the porewater, and in the gas flux simultaneously — three independent places where a weathering signal would have to show up.
Ground Truth: The Minnesota result is not an argument against the chemistry of enhanced weathering, which is not in dispute. It is evidence about rate. A grower offered basalt at a commercially haulable tonnage should read this trial as the closest available answer to the only question that matters at signing: at the dose someone is actually willing to pay to spread, is there a measurable signal at all? In this trial, at 10 tons per acre over three years, there was not.
2. The Illinois trial found carbon removal — at 200 tonnes of rock per hectare
What's new: The counterweight is the PNAS paper "Enhanced weathering in the US Corn Belt delivers carbon removal with agronomic benefits," a large replicated trial on a maize–soybean rotation at an experimental farm in Illinois, run over four years from 2016 to 2020. It reports a conservative, time-integrated cumulative carbon dioxide removal potential of 10.5 ± 3.8 tonnes CO2 per hectare, with maize and soybean yields up 12–16% on improved fertility, reduced acidification and upregulated root nutrient transport.
Evidence: The application rate was 50 tonnes per hectare per year, for four years — 200 tonnes of basalt per hectare in total. Converted to the units a custom applicator quotes in, that is 20.2 tonnes per acre per year, or 80.9 tonnes per acre cumulatively. The Minnesota trial's single 10-ton-per-acre pass is roughly 22.4 tonnes per hectare — about one-ninth of the Illinois cumulative dose.
| Trial | Published | Site | Years | Basalt applied | Result |
|---|---|---|---|---|---|
| PNAS | Feb 2024 | Illinois | 2016–2020 | 200 t/ha total (50 t/ha/yr × 4) | 10.5 ± 3.8 t CO₂/ha; yields +12–16% |
| Frontiers in Climate | Jan 13, 2026 | Northfield, MN | 2021–2024 | ~22.4 t/ha total (10 short tons/acre, once) | No significant difference vs. control |
Sources: PNAS, "Enhanced weathering in the US Corn Belt delivers carbon removal with agronomic benefits," Feb 2024; Frontiers in Climate, Jan 13, 2026. Hectare/acre conversions are this publication's arithmetic at 2.4711 acres per hectare.
Read the table as one experiment rather than two. Nine times the rock produced a measurable signal; one-ninth of it did not. That is the shape of a dose-response relationship, and it is the reason the two papers can both be right. It also means the encouraging result is the one attached to the tonnage nobody has to haul yet.
3. The ratio the pitch deck leaves out
What's new: Divide the Illinois trial's rock by the Illinois trial's carbon and you get the physical exchange rate of the whole technology: 200 tonnes of basalt per hectare produced 10.5 tonnes of CO2 per hectare, or 19.05 tonnes of rock per tonne of CO2 removed (this publication's arithmetic on the PNAS figures). Every cost in the system multiplies by that number before it reaches the carbon.
19.05 t
Tonnes of crushed basalt required per tonne of CO₂ removed, on the only Corn Belt trial that has measured a removal signal. (Crop Root Zone calculation from PNAS, Feb 2024: 200 t/ha rock, 10.5 t CO₂/ha)
Evidence: The price of the rock is not a mystery. USGS Mineral Commodity Summaries 2026 — downloaded and text-extracted for this piece — puts the average unit value of US crushed stone at $18.50 per metric tonne in 2025, the top of a four-year climb:
| Year | Crushed stone, average unit value ($/t) | Change |
|---|---|---|
| 2021 | 13.26 | — |
| 2022 | 14.31 | +7.9% |
| 2023 | 15.86 | +10.8% |
| 2024 | 17.50 (est.) | +10.3% |
| 2025 | 18.50 | +5.7% |
Source: USGS, Mineral Commodity Summaries 2026, Stone (Crushed), fetched and parsed Aug 17, 2026. USGS marks the 2024 value estimated. Percentage changes are this publication's arithmetic.
USGS also notes the direction of travel: it expected the underlying factors supporting crushed-stone price increases to continue in 2026, with regional shortages pushing new quarries further from population centers and "higher-than-average price increases" in industrialized areas. The delivered cost of the rock is a rising line, and it is rising for reasons — zoning, haul distance, fuel — that have nothing to do with agriculture.
At $18.50 per tonne, 19.05 tonnes of rock costs $352.43 per tonne of CO2 removed, at the quarry gate. That is before grinding to a reactive fineness, before a mile of freight, and before a spreader enters the field.
Spreading is separately quotable. The 2026 Iowa Farm Custom Rate Survey puts lime spreading at an average of $8.30 per ton, median $8.00, range $5.00–$14.00 across 31 responses. The Illinois dose of 20.2 tonnes per acre per year is 22.3 short tons, so spreading alone runs about $185 per acre per year, which against that trial's 1.06 tonnes of CO2 per acre per year is another $174 per tonne of CO2.
| Cost layer, per tonne of CO₂ removed | $/t CO₂ | |
|---|---|---|
| Crushed rock, quarry gate | 352 | ██████████ |
| Custom spreading | 174 | █████ |
| Grinding to reactive fineness | not quantified | |
| Freight, quarry to field | not quantified | |
| Subtotal, before grinding and freight | 526 |
Sources: USGS MCS 2026 (rock); 2026 Iowa Farm Custom Rate Survey lime-spreading average (spreading); PNAS Feb 2024 (rock-to-carbon ratio). All per-tonne-CO₂ conversions are this publication's arithmetic. Grinding and freight are left blank rather than estimated.
The sensitivity is the cleanest way to hold the freight uncertainty honestly: because 19.05 tonnes of rock stand behind each tonne of carbon, every $1 per tonne added to the delivered cost of the rock adds $19.05 per tonne to the cost of the carbon. A 50-mile haul does not need to be priced precisely to know which direction it moves the answer.
4. What the carbon buyers are actually paying
What's new: Two agricultural ERW purchases are large enough and disclosed enough to divide. Frontier — the buying group whose members include Stripe, Google, Shopify, Autodesk, H&M Group, JPMorgan Chase, Workday and Salesforce — paid Eion $33 million for 78,707 tonnes of CO2 removal between 2027 and 2030, announced March 25, 2025, using olivine on farmland across the southern and midwestern United States. It paid Terradot $27 million for 90,000 tonnes between 2025 and 2029, announced December 12, 2024, using basalt on farmland in southern Brazil.
Evidence: Those divide to $419.28 and $300.00 per tonne of CO2 respectively (this publication's arithmetic).
| Purchase | Announced | $ | Tonnes CO₂ | $/t CO₂ | Rock |
|---|---|---|---|---|---|
| Frontier → Eion | Mar 25, 2025 | 33,000,000 | 78,707 | 419.28 | Olivine |
| Frontier → Terradot | Dec 12, 2024 | 27,000,000 | 90,000 | 300.00 | Basalt |
Source: Frontier published purchase pages for Eion and Terradot, fetched Aug 17, 2026. Per-tonne prices are this publication's division.
Set that against the $526 per tonne of CO2 that the rock and the spreading alone consume at the Illinois dose, and the arithmetic closes badly: the Terradot price covers 57% of a bill that is still missing grinding and freight, and the Eion price covers 80% of it. Neither leaves anything for the quarry's margin, the developer's measurement and verification programme, or the grower.
Ground Truth: Enhanced rock weathering's binding constraint is not measurement, permanence, or public acceptance — the three things the sector spends its disclosure budget on. It is a mass ratio colliding with a commodity price. Nineteen tonnes of rock per tonne of carbon means the technology is a freight and aggregate business wearing an agronomy costume, and the credit prices already agreed for the rest of this decade were struck below the cost of the rock and the spreader at the only dose ever shown to work. The affordable dose produced no measurable signal in Minnesota; the dose that produced a signal in Illinois is not affordable at $300 to $419 a tonne. That gap does not close with better soil sampling.
5. What a grower should ask before signing
What's new: The offer arriving at the farm gate is rarely framed as carbon. It is framed as free liming, free magnesium and micronutrients, and a payment on top — with the developer carrying the cost of rock, freight and application. That framing is accurate, and it is exactly why the economics above are the grower's problem rather than a spectator sport: a programme whose physical bill exceeds its revenue is a programme that renegotiates, narrows its geography, or stops mid-contract.
Evidence: Three specifics worth extracting in writing before a spreader arrives.
- The dose, in tons per acre, and the grain size. The Minnesota null result was attributed to coarse grain and low reactivity. A tonnage without a fineness specification is not a comparable number, and it is the single variable that separates the two trials' outcomes.
- Who owns the liming credit. Basalt and slag both raise pH; that is agronomically valuable and separately purchasable. If the rock is displacing a lime purchase the grower would have made anyway, that saving belongs in the negotiation rather than being counted twice as a free benefit.
- What happens to the field's obligations if the developer's funding stops. The rock stays in the soil either way. So does anything that came with it — which is the subject of a companion piece in this issue.
The one thing not in dispute is that the material does something agronomically. The Illinois trial's 12–16% yield response is a real, replicated, peer-reviewed number, and the Minnesota trial's steel slag genuinely raised pH and calcium saturation in acidic soils. A grower with acid soils and a developer willing to haul 20 tonnes an acre at someone else's expense is being offered something of value. The question is only whether the entity on the other side of that contract has priced its own tonnage — and at $300 to $419 per tonne of CO2 against a $526 floor, the published numbers say not yet.
References
- Frontiers in Climate — "Evidence for carbon dioxide removal via enhanced rock weathering with steel slag, though not basalt, in a midwestern U.S. field trial," Jan 13, 2026. https://www.frontiersin.org/journals/climate/articles/10.3389/fclim.2025.1657058/full
- PNAS — "Enhanced weathering in the US Corn Belt delivers carbon removal with agronomic benefits," Feb 2024. Trial figures (50 t/ha/yr over 2016–2020; 10.5 ± 3.8 t CO2/ha; yields +12–16%) taken from the paper's abstract via the PubMed Central and publisher records; the PNAS article page returned HTTP 403 to automated fetching and was not opened directly. https://pubmed.ncbi.nlm.nih.gov/38386712/
- USGS — Mineral Commodity Summaries 2026, Stone (Crushed). Downloaded and text-extracted locally, Aug 17, 2026. https://pubs.usgs.gov/periodicals/mcs2026/mcs2026-stone-crushed.pdf
- Iowa State University Extension and Outreach — 2026 Iowa Farm Custom Rate Survey (Ag Decision Maker A3-10), lime spreading: average $8.30/ton, median $8.00, range $5.00–$14.00, 31 responses. Figure surfaced via search of extension.iastate.edu; the PDF and HTML both returned HTTP 403 to automated fetching and were not opened.
- Frontier — published purchase record, Eion: $33 million for 78,707 tonnes CO2, 2027–2030, olivine, southern and midwestern US; announced Mar 25, 2025. Fetched Aug 17, 2026. https://frontierclimate.com/writing/eion
- Frontier — published purchase record, Terradot: $27 million for 90,000 tonnes CO2, 2025–2029, basalt, southern Brazil; announced Dec 12, 2024. Fetched Aug 17, 2026. https://frontierclimate.com/writing/terradot
Disclosures
Crop Root Zone is an independent publication. Nothing here is investment advice. Market calls, where included, reflect the editors' own read and are not a recommendation to buy or sell any security.
The Rock That Weathers Fast Enough Carries 2,000 ppm Nickel. Sludge Is Barred From Cropland at 420.
EPA caps nickel in land-applied biosolids at 420 mg/kg and 420 kg/hectare over the life of a field. The olivine-bearing dunite used in enhanced weathering trials runs above 2,000 mg/kg, and a single published application rate puts 440 kg/hectare on in one pass — with no equivalent rule, because it arrived as a mineral instead of a sludge.
The companion piece in this issue works out why enhanced rock weathering struggles on cost: at the only Corn Belt dose that produced a measurable carbon signal, it takes 19 tonnes of basalt to remove one tonne of CO2, and crushed stone now averages $18.50 a tonne at the quarry. There is an obvious engineering answer to that problem, and the industry has already taken it — use a rock that weathers faster, so less of it is needed. The fast rock is olivine, mined as dunite, and it is the mineral in the largest US agricultural carbon-removal purchase on record. It also carries nickel and chromium at concentrations above 2,000 parts per million each. For comparison, the federal government prohibits land-applying sewage sludge on farmland if its nickel concentration exceeds 420 milligrams per kilogram.
1. The mineral the economics select for
What's new: Frontier's $33 million purchase from Eion — announced March 25, 2025, for 78,707 tonnes of CO2 removal between 2027 and 2030 across southern and midwestern US farmland — specifies olivine, not basalt. Frontier's $27 million Terradot purchase (December 12, 2024, 90,000 tonnes, 2025–2029) uses basalt, but on farmland in southern Brazil, where higher temperatures accelerate weathering.
Evidence: The selection is rational. The January 13, 2026 Frontiers in Climate trial in Minnesota found basalt produced "small, but not significant, differences relative to untreated controls in all soils," attributing the null result to coarse grain size and low reactivity. Olivine dissolves far faster than basalt, which is precisely why a developer paying for freight and spreading would choose it: fewer tonnes per tonne of carbon means fewer tonnes to buy, haul and spread.
Ground Truth: The two problems are one problem. Basalt is agronomically benign and too slow to pay for its own freight; olivine is fast enough to pay for its freight and carries a metals load that no other cropland amendment would be permitted to carry. Enhanced weathering does not have a cost problem and a contaminant problem. It has a single constraint that can be paid down in either currency, and the economics push the whole sector toward paying in the second one.
2. What is actually in the rock
What's new: The best-documented cropland dunite trial is a mesocosm study published in Biogeosciences on January 8, 2020: Belgian loamy sandy soil, wheat and barley, olivine-bearing dunite ground to two grain-size fractions, applied at 22 kg per square metre and followed for 730 days. The paper reports the feedstock's trace-element content directly: nickel above 2,000 ppm and chromium above 2,000 ppm.
Evidence: 22 kg/m² is 220 tonnes per hectare — the same order as the 200 t/ha cumulative dose in the Illinois basalt trial, and roughly 89 tonnes per acre. At 2,000 ppm, every tonne of that rock carries 2.0 kg of nickel.
| Quantity | Value | Basis |
|---|---|---|
| Dunite nickel content | >2,000 ppm | Biogeosciences, Jan 8, 2020 |
| = nickel per tonne of rock | >2.0 kg/t | Unit conversion |
| Application rate in trial | 22 kg/m² = 220 t/ha | Biogeosciences, Jan 8, 2020 |
| Nickel applied, one pass | ≥440 kg/ha | This publication's arithmetic |
Sources: Biogeosciences 17, 103 (Jan 8, 2020), fetched Aug 17, 2026. Conversions are this publication's arithmetic; the paper states nickel and chromium each exceed 2,000 ppm without giving an upper figure, so 440 kg/ha is a floor, not a point estimate.
The chromium is a separate matter and behaves differently. The paper notes chromium sits in chromite and chromochlorite in the source rock and "is not expected to be released strongly at the observed pH levels," whereas nickel substitutes for magnesium in the olivine lattice and is released as the olivine dissolves. Nickel is the mobile one, and nickel is the one with a federal number attached.
That chromium assurance is worth reading carefully rather than banking, because of what conditions it. The finding is that chromium is not strongly released at the pH levels observed in that experiment — and raising pH is the entire agronomic selling point of the amendment. A treatment whose purpose is to move soil pH upward is being certified safe on chromium by reference to a pH range it is designed to change. This publication is not asserting that chromium becomes mobile; the mineralogy argument for chromite's stability is sound and chromium in these rocks is overwhelmingly the trivalent form. The point is narrower: the guarantee is conditional, the condition is the variable under treatment, and a two-year Belgian mesocosm study is not the dataset that resolves it over a twenty-year application programme.
The monitoring literature adds two elements to watch that are not in the headline pair. Zinc and copper are identified as the trace metals most likely to accumulate to consequential levels on decade timescales — slower than nickel, but on cropland the relevant horizon is decades. And accumulation runs faster where weathering runs faster, which means warm-climate deployments load metals more quickly than temperate ones. That is the same temperature advantage that makes tropical and subtropical geographies attractive for the carbon side of the ledger.
3. The only federal cropland metals standard, and what it says
What's new: The United States has one binding numerical regime for heavy metals applied to farmland: 40 CFR Part 503, the biosolids rule. It sets three relevant limits for nickel, and the dunite figures clear all three by wide margins.
Evidence: From § 503.13:
| EPA Part 503 nickel limit | Value | Dunite / trial rate | Ratio |
|---|---|---|---|
| Table 1 — ceiling concentration (sludge ineligible above this) | 420 mg/kg | >2,000 mg/kg | >4.8× |
| Table 2 — cumulative loading rate, lifetime of the field | 420 kg/ha | ≥440 kg/ha in one pass | >1.0× |
| Table 4 — annual loading rate | 21 kg/ha per 365 days | ≥440 kg/ha in one pass | >21× |
Sources: 40 CFR § 503.13 Tables 1, 2 and 4, via Cornell LII e-CFR, retrieved Aug 17, 2026; Biogeosciences, Jan 8, 2020 for the feedstock and rate. Ratios are this publication's arithmetic.
420 mg/kg
The nickel concentration above which EPA prohibits land application of sewage sludge on farmland — roughly one-fifth of the nickel in the dunite used in published enhanced-weathering trials. (40 CFR § 503.13, Table 1)
No rule is being broken. Part 503 governs sewage sludge. It does not govern mineral soil amendments, and an olivine application is not a biosolids application. That is the entire point: the same element, at five times the concentration, arriving on the same field for the same purpose of building soil, is subject to a lifetime cumulative cap in one delivery vehicle and to nothing at all in the other. This publication has covered EPA's treatment of biosolids before, where the agency traded a 272-page PFAS risk assessment for nine pages of guidance. The nickel comparison runs the other way: here the sludge is the regulated material and the rock is the gap.
Converted into what a soil test would read: 440 kg/ha spread through a six-inch plow layer of roughly 2,242 tonnes per hectare adds about 196 mg/kg of nickel to that layer. Against a typical Midwest background in the 10–50 mg/kg range, that is on the order of a four- to twentyfold increase in the plow layer's nickel inventory, landing the field somewhere near half of the 420 mg/kg concentration that would disqualify a biosolid. (Plow-layer mass at 2 million lb/acre and the background range are stated assumptions, not measurements; the direction of any error in the background figure does not change the loading, only the multiple.)
4. Why "it stays in the soil" is the bad news
What's new: The Biogeosciences trial's headline safety finding is that the released nickel largely did not travel. Solution-phase nickel came in a factor of 10–20 below what the dissolution rate implied was theoretically possible, and soil analysis found trace metals elevated and concentrated in the surface layers. On leaching, the result is genuinely reassuring in one respect and not in another: observed nickel concentrations exceeded the WHO drinking-water quality threshold of 0.02 mg/L in the surface layer, while remaining within the 0.2 mg/L agricultural irrigation limit.
Evidence: Retention is what makes a carbon-removal claim durable and what makes a metals loading permanent, and it is the same physical fact in both cases.
| Reading of "the nickel stayed in the soil" | Whose interest it serves |
|---|---|
| It did not reach groundwater at irrigation-limit concentrations | The developer's environmental risk case |
| It is concentrated in the top few inches, where roots and soil tests are | The landowner's problem |
| It accumulates pass over pass with no cap | Nobody's, currently |
Source: Biogeosciences 17, 103 (Jan 8, 2020). Interpretation is this publication's.
Ground Truth: Every enhanced-weathering programme needs the metals to stay put, because a metal that leaches is an environmental liability the developer must answer for, while a metal that stays is an asset on the landowner's balance sheet that nobody has to disclose. Retention is reported as a safety result and functions as a transfer of the exposure from the party with the lawyers to the party with the deed. Part 503's cumulative loading rate exists for precisely this: not because one sludge application is dangerous, but because loading that does not leave has to be counted across the life of the field. There is no such ledger for rock.
The paper also flags that accumulation runs faster in warm climates, because weathering runs faster — which is worth holding alongside the fact that the basalt purchase Frontier made is deployed in southern Brazil specifically for the temperature.
5. What to get in writing
What's new: None of this argues against taking an enhanced-weathering contract. It argues that the feedstock assay is the term sheet, and it is usually not in the term sheet.
Evidence: Four items a landowner can reasonably require, all of which a legitimate developer already has on file:
- A feedstock assay, by lot, for nickel and chromium — and for zinc and copper, which the monitoring literature identifies as the elements that could accumulate to consequential levels over decades. A rock type is not an assay; dunite nickel varies with the deposit.
- The cumulative loading, in kg/ha, over the full contract term, computed from that assay and the planned tonnage — then compared against 420 kg/ha as a voluntary yardstick, since no mandatory one applies.
- A baseline soil test that includes nickel, taken before the first pass. Standard fertility panels do not report it. Without a baseline there is no way, later, to distinguish what the rock added from what was always there.
- Who holds the obligation if the programme stops. The rock and everything in it remain in the plow layer whether or not the delivery schedule in the 2027–2030 window is completed.
The material question remains genuinely open, and the honest position is that the long-run agronomic effect of repeated high-rate olivine on Midwest soils has not been measured over a rotation-length horizon in North America — the best cropland dunite dataset is a 730-day Belgian mesocosm study from 2020, and the best North American field evidence is a basalt trial that found nothing. That is a thin base for a technology already contracted through 2030. It is also why the assay costs a few hundred dollars and the alternative is finding out from a soil test in 2040.
References
- Biogeosciences 17, 103 — "Enhanced Weathering and related element fluxes – a cropland mesocosm approach," Jan 8, 2020. Dunite Ni and Cr >2,000 ppm; 22 kg/m² application; 730 days; WHO drinking-water threshold 0.02 mg/L exceeded in surface layer, within 0.2 mg/L irrigation limit. Fetched Aug 17, 2026. https://bg.copernicus.org/articles/17/103/2020/
- 40 CFR § 503.13 — Pollutant limits. Table 1 ceiling concentration nickel 420 mg/kg; Table 2 cumulative pollutant loading rate nickel 420 kg/ha; Table 4 annual pollutant loading rate nickel 21 kg/ha per 365-day period. Via Cornell LII e-CFR, retrieved Aug 17, 2026. https://www.law.cornell.edu/cfr/text/40/503.13
- Frontier — published purchase record, Eion: $33 million, 78,707 tonnes CO2, 2027–2030, olivine, southern and midwestern US; announced Mar 25, 2025. Fetched Aug 17, 2026. https://frontierclimate.com/writing/eion
- Frontier — published purchase record, Terradot: $27 million, 90,000 tonnes CO2, 2025–2029, basalt, southern Brazil; announced Dec 12, 2024. Fetched Aug 17, 2026. https://frontierclimate.com/writing/terradot
- Frontiers in Climate — "Evidence for carbon dioxide removal via enhanced rock weathering with steel slag, though not basalt, in a midwestern U.S. field trial," Jan 13, 2026. https://www.frontiersin.org/journals/climate/articles/10.3389/fclim.2025.1657058/full
- Environmental Science & Technology — "Enhanced Rock Weathering for Carbon Removal—Monitoring and Mitigating Potential Environmental Impacts on Agricultural Land," identified as the source of the recommendation that developers disclose feedstock composition for chromium and nickel and for elements that accumulate over decades (zinc, copper). The publisher page returned HTTP 403 to automated fetching and was not opened; the recommendation is reported from indexed summaries and is not quoted. https://pubs.acs.org/doi/10.1021/acs.est.4c02368
Disclosures
Crop Root Zone is an independent publication. Nothing here is investment advice. Market calls, where included, reflect the editors' own read and are not a recommendation to buy or sell any security.
A Federal Tax Credit Now Decides Which Fertilizer Practices Have Value. Your Agronomy Has No Vote.
45Z pays on modeled carbon intensity, the model recognizes a short list of practices, and the largest CI improvement available in 2026 came from a June modeling revision — not from anything done in a field.
For the first time, a fertilizer decision made in a field has a defined federal revenue consequence — collected somewhere else. The 45Z Clean Fuel Production Credit pays the producer of a transportation fuel based on how far the fuel's modeled carbon intensity sits below a statutory benchmark of 50 kilograms of CO₂-equivalent per million Btu. Corn ethanol's CI includes the emissions of growing the corn, so a grower's tillage, cover cropping and nitrogen management now enter a tax calculation. What they do not do is enter it freely: the credit is computed through a government model, and the model recognizes a specific and fairly short set of practices. An input that reduces real nitrogen loss but is not on that list produces agronomic benefit and zero credit.
1. The mechanics, and what a carbon-intensity point is worth
The credit structure is straightforward at its two published endpoints.
| Parameter | Value | Source |
|---|---|---|
| Emissions benchmark | 50 kg CO₂e per mmBtu | Statutory threshold |
| Base credit at the benchmark | $0.20/gallon | 45Z as enacted |
| Maximum credit | $1.00/gallon (ethanol and general biofuels) | 45Z as enacted |
| Standard corn CI score | 29.1 | GREET model |
| Applies to fuel produced after | Dec 31, 2024 | 45Z |
| Extended expiration | Dec 31, 2029 | One Big Beautiful Bill Act |
Sources: American Farm Bureau Federation, 45Z Clean Fuel Production Credit market intel; farmdoc daily (University of Illinois), "The Clean Fuel Production Tax Credit (45Z)," May and June 2026.
Those endpoints imply a rate. Eighty cents of credit is spread across the 50 kg of CI between the benchmark and zero, which works out to about 1.6 cents per gallon per kilogram of CO₂e/mmBtu removed.
| Derived value of one CI point | |
|---|---|
| Credit range above the base | $0.80/gal |
| CI range from benchmark to zero | 50 kg CO₂e/mmBtu |
| Per kg CO₂e/mmBtu | ~$0.016/gal |
| At ~2.85 gallons of ethanol per bushel | ~$0.046/bushel |
Derived by this publication from the published statutory endpoints above. This is a linear read across the two endpoints and an order-of-magnitude guide only — the actual credit is computed through the 45ZCF-GREET model, not by a linear formula, and the ethanol yield per bushel is a conventional industry figure, not a statutory one.
That derived rate is the number worth carrying. A practice bundle that removes 5 kg of CI generates roughly 8 cents a gallon, or about 23 cents per bushel of credit — against a nitrogen bill of about $106 an acre at 180 lb N and $0.59 per pound (DTN/Progressive Farmer, Aug 12, 2026), on a 180.7 bu/acre crop (USDA WASDE-674, Aug 12, 2026). Twenty-three cents a bushel on 180.7 bushels is about $41 an acre of credit created — roughly 39% of the nitrogen bill.
~$41/acre
Credit value generated by a 5 kg CO₂e/mmBtu carbon-intensity reduction on a 180.7 bu/acre corn crop — created at the field, collected at the ethanol plant. (Derived from published 45Z endpoints, USDA WASDE-674 and DTN, Aug 12, 2026)
2. The recognized-practice list is the product list
This is where the credit stops being a climate policy and starts being an input-market instrument. A practice only lowers the feedstock CI if the calculator that produces the score recognizes it. Reporting on the USDA framework describes the Feedstock Carbon Intensity Calculator as recognizing a narrow set:
| Practice | Recognized in the feedstock CI calculator | Crop restriction |
|---|---|---|
| No-till | Yes | — |
| Reduced till | Yes | — |
| Cover crops | Yes | — |
| Nitrification inhibitors | Yes | — |
| Split in-season fertilizer application | Yes | Corn and sorghum only |
| Spring-only fertilizer application | Yes | Corn only |
Source: reporting on the USDA Feedstock Carbon Intensity Calculator practice set under the 45Z framework, as described in 2026 program guidance summaries.
Now set that against what the input market actually sells. Enhanced-efficiency products, biologicals, variable-rate application and controlled-release coatings all have a case for reducing nitrogen loss. Only one category on that list — nitrification inhibitors — appears in the recognized set. And two of the six recognized items are not products at all. Split in-season application and spring-only application change the timing of a pass; they can be adopted without buying anything new.
| What earns CI credit | What it costs to adopt |
|---|---|
| Spring-only application (corn) | A calendar change; no product purchase |
| Split in-season application (corn, sorghum) | An extra pass; no new product |
| Nitrification inhibitors | A product purchase |
| Cover crops | Seed, seeding pass, termination |
| No-till / reduced till | Equipment and system change |
Source: as above.
Ground Truth: The recognized list rewards timing at least as much as technology, and timing is the cheapest thing on it. A grower chasing CI reduction should exhaust the zero-product options first — moving fall nitrogen to spring, splitting the application — because they carry no input cost and score the same as things that do. That ordering is the opposite of how enhanced-efficiency products are usually sold, and it is a direct consequence of a scoring model, not of agronomy. The corollary is uncomfortable for the input side: a product that genuinely cuts nitrogen loss but is not in the calculator is now competing against a free calendar change that scores.
3. The published lists do not agree, and that is not a detail
There is a discrepancy in the public record that a grower should not resolve by assumption.
The American Farm Bureau Federation's account of the program describes USDA releasing a list of 24 possible conservation practices in January 2025 — including no-till, cover cropping and high-efficiency fertilizers — with the earlier "bundling" requirement removed. Summaries of the Feedstock Carbon Intensity Calculator describe a much shorter recognized set, the six items above.
| Source | Practices described | Date |
|---|---|---|
| USDA conservation practice list (per AFBF) | 24 | January 2025 |
| Feedstock CI Calculator recognized set (per program summaries) | 6 | 2026 guidance |
Sources: American Farm Bureau Federation, 45Z Clean Fuel Production Credit market intel; 2026 summaries of the USDA Feedstock Carbon Intensity Calculator.
These are probably not measuring the same thing — a list of conservation practices USDA will recognize as climate-smart is a different object from the set of variables a calculator will actually accept as inputs to a CI score. But the gap between 24 and 6 is exactly where a farm's money gets spent on the wrong side of a line. A practice on the broader list that the calculator cannot ingest produces no credit, and the distinction is invisible from a product brochure.
Ground Truth: Do not buy an input on the strength of a marketing claim that it is "45Z-eligible." Eligibility is a property of the calculator, not of the product, and the two published lists in circulation differ by a factor of four. The only version that matters is the one the ethanol plant's verifier will actually run. Before spending on a practice for CI reasons, get the buying plant to confirm in writing that its model accepts that specific practice and how it will be documented — because the documentation burden, not the agronomy, is where these programs fail.
4. The largest CI improvement of 2026 required no farming at all
On June 12, 2026, the Department of Energy released an updated 45ZCF-GREET model that lowers carbon intensity scores by removing indirect land use change emissions for fuels produced after December 31, 2025.
Indirect land use change has historically been one of the larger single penalties applied to corn ethanol's score. Removing it lowers the CI of every gallon produced from every bushel, including bushels grown with conventional tillage, fall-applied anhydrous and no cover crop.
| Route to a lower CI in 2026 | Requires a field practice change | Requires documentation |
|---|---|---|
| June 12 GREET revision (ILUC removal) | No | No |
| Cover crops | Yes | Yes |
| No-till / reduced till | Yes | Yes |
| Nitrification inhibitors | Yes | Yes |
| Split or spring-only application | Yes | Yes |
Source: Department of Energy 45ZCF-GREET model revision, June 12, 2026.
Ground Truth: The single biggest improvement to corn ethanol's carbon intensity this year was a modeling decision, and it accrued automatically to every bushel regardless of how it was grown. That tells a grower something important about the durability of this revenue stream: the score is a policy output, not a physical measurement, and it can move by more in one federal announcement than a full practice-change program delivers in a season. Treat CI-linked premiums as a contract term with a counterparty, never as an asset you have built into the farm. The practice change is defensible on its own agronomic and soil merits; the credit attached to it is revocable by memo.
5. Nothing requires the money to reach the field
The structural point is the one that should govern every decision above. The credit is claimed by the fuel producer. There is no requirement in 45Z that a biofuels producer pass any portion of its earnings to the farmers who supplied the feedstock.
That leaves the grower's practice change as an unpriced input into someone else's tax position unless a contract says otherwise. The chain runs: the farm bears the cost and the documentation burden, the elevator or plant aggregates the practice data, and the producer claims a credit worth — by the derived rate above — roughly 4.6 cents a bushel per kilogram of CI removed.
| Who bears what | Cost | Documentation | Credit |
|---|---|---|---|
| Grower | Yes | Yes | Only if contracted |
| Elevator / aggregator | Partial | Yes | Only if contracted |
| Fuel producer | No | Verification | Claims the credit |
Source: American Farm Bureau Federation, 45Z Clean Fuel Production Credit market intel — "there is no requirement for biofuels producers to pass any of their earnings from 45Z on to the farmers."
Ground Truth: The question to ask a buyer is not "do you have a 45Z program" but "what is the per-bushel premium, is it a fixed number or a share of a modeled credit, and who carries the risk if the model changes?" The June 12 revision is the proof that the last part is a live risk rather than a theoretical one. A fixed per-bushel premium transfers that risk to the buyer; a revenue-share leaves it on the farm. At roughly 4.6 cents per bushel per CI kilogram, a program that offers a few cents a bushel is capturing a modest slice of what the practice generates, and that is a negotiation, not a gift.
For the input market, the read is sharper still. The recognized-practice list has effectively become a federal allowlist that decides which nitrogen technologies carry a revenue story and which are sold on agronomy alone. That is a powerful distribution advantage for nitrification inhibitors and cover crop seed, and a structural disadvantage for every other nutrient-efficiency product — one that has nothing to do with whether the product works.
References
- American Farm Bureau Federation — 45Z Clean Fuel Production Credit, Market Intel. https://www.fb.org/market-intel/45z-clean-fuel-production-credit
- farmdoc daily, University of Illinois — The Clean Fuel Production Tax Credit (45Z); Introductory Discussion, May 2026. https://farmdocdaily.illinois.edu/2026/05/the-clean-fuel-production-tax-credit-45z-introductory-discussion.html
- farmdoc daily, University of Illinois — The Clean Fuel Production Tax Credit (45Z), Part 2, June 18, 2026. https://farmdocdaily.illinois.edu/wp-content/uploads/2026/06/fdd061826.pdf
- U.S. Department of Energy — 45ZCF-GREET model revision, June 12, 2026, removing indirect land use change emissions for fuels produced after Dec 31, 2025.
- USDA Feedstock Carbon Intensity Calculator — recognized practice set as described in 2026 program guidance summaries.
- USDA World Agricultural Outlook Board — WASDE-674, Aug 12, 2026; corn yield 180.7 bu/acre. https://www.usda.gov/oce/commodity/wasde/
- DTN/Progressive Farmer — retail fertilizer survey, Aug 12, 2026 (week of Aug 3–7); anhydrous $0.59/lb N. https://www.dtnpf.com/agriculture/web/ag/crops/article/2026/08/12/fertilizers-start-august-mixed-5-led
Crop Root Zone is an independent publication. Nothing here is investment advice. Market calls, where included, reflect the editors' own read and are not a recommendation to buy or sell any security.
Half the Value of a Ton of Poultry Litter Is Now Phosphate. That Is Also Why You Cannot Spread It.
Litter re-rated 14% year over year and phosphate drove 53% of the increase — but the nutrient ratio that made it valuable is the same ratio that caps the rate at about a ton an acre.
Poultry litter has always been valued as a nitrogen source that happens to carry phosphate and potash. At the price relationships in DTN/Progressive Farmer's August 12 retail survey, that description is now backwards. Converting the survey's per-ton prices into nutrient unit values and applying them to a standard broiler litter analysis, phosphate accounts for roughly half the value of a ton of litter and nitrogen for barely a quarter. The material did not change. The price of the nutrient it is richest in did.
1. Deriving what a nutrient unit actually costs
Litter has to be valued against something. The standard approach prices each nutrient off the cheapest commercial source of it, credits the nitrogen contained in a phosphate product at the straight-nitrogen price, and assigns the remainder to phosphate.
| Nutrient | Reference product | $/ton | Unit value | Derivation |
|---|---|---|---|---|
| N | Anhydrous 82-0-0 | 963 | $0.587/lb N | 963 ÷ (2,000 × 0.82) |
| N (urea basis) | Urea 46-0-0 | 678 | $0.737/lb N | 678 ÷ (2,000 × 0.46) |
| K₂O | Potash 0-0-60 | 495 | $0.4125/lb K₂O | 495 ÷ (2,000 × 0.60) |
| P₂O₅ | DAP 18-46-0 | 917 | $0.708/lb P₂O₅ | (917 − N credit at urea) ÷ (2,000 × 0.46) |
Source: DTN/Progressive Farmer, Aug 12, 2026, retail survey week of Aug 3–7, 2026. Unit values are this publication's arithmetic on those prices at label nutrient content, using the conventional N-credit method for the phosphate derivation. They are derived figures, not market prints.
2. What a ton of litter is worth at those numbers
Broiler litter analysis varies substantially by house, bedding, flock count and storage, which is why every extension publication on the subject opens by telling growers to test their own. Published regional averages cluster in a recognizable band:
| Source region | N | P₂O₅ | K₂O | Basis |
|---|---|---|---|---|
| Oklahoma | 63 | 61 | 50 | lb/ton, "as is" |
| North Carolina (typical) | 60 | 55 | 45 | lb/ton |
| Southeast Kansas | 56 | 53 | 46 | lb/ton |
Sources: Oklahoma State University Extension, "Using Poultry Litter as Fertilizer"; NC State Extension, "Poultry Litter as a Fertilizer Source"; University of Georgia Extension, "Calculating the Fertilizer Value of Broiler Litter."
Availability matters and is not symmetric. Extension guidance is consistent that the phosphate and potash in litter are plant-available in the year of application, while typically only 50–70% of the total nitrogen is. Taking the Oklahoma 63-61-50 analysis and a 60% first-year nitrogen availability:
| Nutrient | lb/ton | Available lb | Unit value | Value/ton | Share | |
|---|---|---|---|---|---|---|
| Phosphate | 61 | 61 | $0.708 | $43.19 | ██████████ |
50.2% |
| Nitrogen | 63 | 37.8 | $0.587 | $22.19 | █████ |
25.8% |
| Potash | 50 | 50 | $0.4125 | $20.63 | █████ |
24.0% |
| Total | $86.01 | 100% |
Derived by this publication from the DTN unit values in §1 and the Oklahoma State Extension litter analysis. Nitrogen valued at the anhydrous-equivalent unit price and discounted to 60% first-year availability; phosphate and potash valued in full. Nutrient value only — excludes hauling, spreading, handling, labour and the cost of the litter at the house.
$86/ton
Plant-available nutrient value of a ton of broiler litter at August 2026 retail nutrient prices — of which phosphate is $43. (Derived from DTN/Progressive Farmer, Aug 12, 2026 and Oklahoma State University Extension litter analysis)
3. Phosphate drove the re-rating
Backing year-ago nutrient unit values out of DTN's own published year-over-year percentages shows where the increase came from.
| Nutrient unit | Aug 2025 | Aug 2026 | Change |
|---|---|---|---|
| P₂O₅ (DAP basis) | $0.6153/lb | $0.7080/lb | +15.1% |
| N (anhydrous basis) | $0.4661/lb | $0.5872/lb | +26.0% |
| K₂O (potash basis) | $0.4044/lb | $0.4125/lb | +2.0% |
Derived from DTN/Progressive Farmer, Aug 12, 2026, by deflating each current price by DTN's published year-over-year percentage (DAP +12%, anhydrous +26%, potash +2%, urea +5%) and re-running the §1 derivations.
Applied to the same 63-61-50 ton:
| Contribution to the year-over-year change | $/ton | Share of increase | |
|---|---|---|---|
| Phosphate | +$5.66 | 53% | ██████████ |
| Nitrogen | +$4.58 | 43% | ████████ |
| Potash | +$0.41 | 4% | █ |
| Total | +$10.65 | 100% | |
| Year-ago value | $75.36 | ||
| Current value | $86.01 | +14.1% |
Derived as above.
Ground Truth: Litter did not become a better product; phosphate became a scarcer one. That distinction sets the direction of the risk. Nitrogen's contribution to litter's value rests on anhydrous holding a +26% year-over-year level, and the retail nitrogen complex has been the most volatile column in the survey — four nitrogen products fell month over month while DAP, MAP and potash sat within half a percent of unchanged. Phosphate's contribution rests on a market where producers have been posting thin-to-negative phosphate margins even at $917 retail DAP. A litter valuation is therefore about half exposed to the stickiest nutrient in the survey and only a quarter to the loosest, which is the better composition to carry into fall.
4. The freight ceiling stopped binding — and stopped mattering
The traditional rule of thumb is that litter does not pay to haul far. Extension figures put tractor-trailer hauling at roughly $3.00–4.00 per loaded mile on a 25-ton load, which is $0.12–0.16 per ton-mile.
Against $86.01 of nutrient value, that arithmetic no longer produces a short radius:
| Scenario | Value available for freight | At $0.16/ton-mile | At $0.12/ton-mile |
|---|---|---|---|
| Gross nutrient value | $86.01 | 538 miles | 717 miles |
| Net of $20/ton at the house* | $66.01 | 413 miles | 550 miles |
| Net of $20/ton and a 25% margin* | $49.51 | 309 miles | 413 miles |
*The $20/ton price at the house and the 25% margin are stated assumptions for illustration, not surveyed figures — litter prices at the house are negotiated locally and vary widely. Hauling rates from published extension guidance. Break-even distances are gross of spreading, loading and handling costs, which are real and are excluded.
Those are break-evens in the hundreds of miles, not the dozens. On freight alone, litter became a regionally tradable commodity at these nutrient prices.
But this is where the piece turns, because the freight ceiling is no longer the binding one.
5. The ratio that created the value is the ratio that caps the rate
Litter's problem is that its nutrients do not arrive in the proportion a corn crop uses them. Working from the same 63-61-50 analysis at 60% first-year N availability, one ton delivers 37.8 lb of available N and 61 lb of P₂O₅ — a ratio of about 0.62 pounds of available nitrogen for every pound of phosphate.
A corn crop wants close to the opposite. At the 180.7 bu/acre yield in USDA's August WASDE, a crop needs roughly 180 lb of nitrogen and removes on the order of 67 lb of P₂O₅ in the grain — about 2.7 pounds of nitrogen per pound of phosphate.
| Rate driver | Litter rate | N supplied | P₂O₅ supplied | P₂O₅ removed by crop | Over/under |
|---|---|---|---|---|---|
| Meet the nitrogen need | 4.76 ton/ac | 180 lb | 290 lb | 67 lb | 4.3× over |
| Meet phosphate removal | 1.10 ton/ac | 41.6 lb | 67 lb | 67 lb | balanced |
Derived by this publication from the Oklahoma State litter analysis, a 60% first-year N availability assumption, a 180 lb/acre N requirement and grain P₂O₅ removal of roughly 0.37 lb/bushel at the 180.7 bu/acre yield in USDA WASDE-674, Aug 12, 2026. Removal coefficients are conventional agronomic figures; actual requirements are soil-test and yield-goal specific.
Spreading litter to meet the corn crop's nitrogen requirement applies more than four times the phosphate the crop removes. In practice that is not permitted for long. Nutrient management planning across the major poultry-producing states runs on phosphorus-index tools and soil-test-phosphorus thresholds precisely to stop repeated over-application, and once a field's soil test P crosses its threshold the plan moves the application to a phosphorus basis — which is the 1.10 ton/acre row.
At 1.10 ton/acre, litter delivers about $95 an acre of nutrient value and 41.6 lb of available nitrogen — roughly 23% of the crop's need. The other 77% still has to be bought.
| At a phosphate-based rate of 1.10 ton/acre | |
|---|---|
| Nutrient value delivered | $94.61/ac |
| Available N delivered | 41.6 lb |
| Share of a 180 lb N requirement | 23% |
| Supplemental N still required | 138 lb |
| Cost of that N at $0.587/lb (anhydrous) | $81.01/ac |
Derived as above; anhydrous unit value from §1.
Ground Truth: The economics and the agronomy now point in opposite directions, and the agronomy wins. Phosphate's re-rating made litter worth hauling several hundred miles, and the same re-rating means the phosphate is exactly the component you are least able to apply freely. The operations that capture this are the ones with phosphate-hungry ground — fields with genuinely low soil-test P and room under the index — not the ones nearest the houses. That is a reversal of the historical pattern, in which proximity determined who used litter and soil-test status was an afterthought. Treat litter as a phosphate product with a nitrogen credit attached, price it against DAP at $917 rather than against urea, and size the rate off the soil test rather than off the nitrogen bill. Buying it as cheap nitrogen is how a field ends up over its P index carrying a fertilizer that costs $86 a ton to move and is 50% composed of the nutrient it is no longer allowed to receive.
Two caveats belong on all of the above. First, every figure here is driven by the litter analysis assumed, and the spread across the three published regional averages in §2 is wide enough to move the per-ton value by several dollars — a book value is not a substitute for testing the specific litter being bought. Second, the 50–70% first-year nitrogen availability band is itself a 20-point range; at the top of it the nitrogen share of value rises to about 29% and at the bottom it falls to about 22%, which changes the emphasis of the argument but not its direction.
References
- DTN/Progressive Farmer — Fertilizers Start August With Mixed Prices as 5 Nutrients Decline, Led by UAN32, Aug 12, 2026; retail survey week of Aug 3–7, 2026. DAP $917, MAP $959, potash $495, urea $678, anhydrous $963. https://www.dtnpf.com/agriculture/web/ag/crops/article/2026/08/12/fertilizers-start-august-mixed-5-led
- Oklahoma State University Extension — Using Poultry Litter as Fertilizer, fact sheet F-2246; "as is" N, P₂O₅, K₂O of 63, 61 and 50 lb/ton. https://extension.okstate.edu/fact-sheets/using-poultry-litter-as-fertilizer
- NC State Extension — Poultry Litter as a Fertilizer Source. https://content.ces.ncsu.edu/poultry-litter-as-a-fertilizer-source
- University of Georgia Extension — Calculating the Fertilizer Value of Broiler Litter, Circular 933. https://extension.uga.edu/publications/detail.html?number=C933
- Published extension guidance on litter hauling economics — $3.00–4.00 per loaded mile on a 25-ton tractor-trailer load, equivalent to $0.12–0.16 per ton-mile.
- USDA World Agricultural Outlook Board — WASDE-674, Aug 12, 2026; corn yield 180.7 bu/acre. https://www.usda.gov/oce/commodity/wasde/
- Nutrient unit values, year-ago derivations, per-ton litter valuations and rate arithmetic are this publication's calculations on the sources above, as labelled at each table.
Crop Root Zone is an independent publication. Nothing here is investment advice. Market calls, where included, reflect the editors' own read and are not a recommendation to buy or sell any security.
Discussion
Anhydrous ammonia's Illinois distributor ask fell $107 a ton in one reporting period, and the international urea benchmark is down about 45% from its April peak — but the retail prints have moved in single digits. So the specific question: what are you actually being quoted for fall-applied anhydrous or urea right now, in what region, and has your retailer passed through any of the benchmark decline yet — or is the fall fill offer still written off spring numbers?
Tell us the number and the basis, and whether you are prepaying, partially booking, or waiting. We are especially interested in anyone who has been quoted a cancellable or repriceable prepay, because last issue's correspondent asked whether any instrument exists to fix nitrogen cost forward and we could not point to one.
Corrections are welcome and we would rather print one than leave an error standing. The sharpest replies get answered in next week's Letters & Responses, anonymously if you prefer.